TIBCO offers many pre-configured TIBCO Spotfire ® templates for data analysis in the energy industry. These analyses are configured with controls for data preparation, visualization, and predictive analysis. Each template accepts a primary data table containing raw starting data and optional metadata such as a data dictionary. A Spotfire user may replace the starting table with their own data to run the analyses. Templates adapt to columns in the new data. Some coordinate columns may need to be specified, for example, date/time, latitude, and longitude. The analysis then progresses using sensible default settings, which can be tuned by the user. DECLINE CURVE ANALYSIS This analysis fits thousands of well production decline curves in minutes. Results include Estimated Ultimate Recovery (EUR) and type curves. Monthly or daily raw production data are input, then in batch mode, outliers are flagged with adaptive processes, and production curves are fit. Users can adjust which data points to include or exclude. Fit choices include hyperbolic, modified hyperbolic, exponential, stretched exponential, power law exponential, and Duong methods. Outputs include well-by-well fits and interactive visualization and q-D-b diagnostic plots, with EUR specified by time or by a specified abandonment rate. Sensible default settings are used for initial analysis. Users can adjust settings to control outlier detection; minimum, maximum Arps Hyperbolic b value; abandonment rate; modified hyperbolic transition; and other parameters. TIBCO Industry Analytics Energy Solutions / Spotfire Templates
Transcript
TIBCO offers many pre-configured TIBCO Spotfire® templates for data analysis in the energy industry. These analyses are configured with controls for data preparation, visualization, and predictive analysis. Each template accepts a primary data table containing raw starting data and optional metadata such as a data dictionary.
A Spotfire user may replace the starting table with their own data to run the analyses. Templates adapt to columns in the new data. Some coordinate columns may need to be specified, for example, date/time, latitude, and longitude. The analysis then progresses using sensible default settings, which can be tuned by the user.
DECLINE CURVE ANALYSIS This analysis fits thousands of well production decline curves in minutes. Results include Estimated Ultimate Recovery (EUR) and type curves. Monthly or daily raw production data are input, then in batch mode, outliers are flagged with adaptive processes, and production curves are fit. Users can adjust which data points to include or exclude. Fit choices include hyperbolic, modified hyperbolic, exponential, stretched exponential, power law exponential, and Duong methods.
Outputs include well-by-well fits and interactive visualization and q-D-b diagnostic plots, with EUR specified by time or by a specified abandonment rate. Sensible default settings are used for initial analysis. Users can adjust settings to control outlier detection; minimum, maximum Arps Hyperbolic b value; abandonment rate; modified hyperbolic transition; and other parameters.
TIBCO Industry AnalyticsEnergy Solutions / Spotfire Templates
DATASHEET | 2
PRODUCTION PERCENTILES [P10, P50, P90] AND AGGREGATION ANALYSISAnalyzes production from existing wells to estimate the probability of future production.
PROBABILITY FITTINGAnalyzes production (for example, initial production or EUR) of a collection of wells, showing P10, P50, P90 and other estimates of future production (p90 is production that is 90% likely to be met). Interactive Spotfire filtering and marking selects wells for analysis by geographical region, vintage, and other attributes. Probability choices include lognormal (the most common statistical framework), Weibull, and gamma parametric distributions, plus nonparametric bootstrap methods.
AGGREGATION ANALYSISWhen the distribution has been fit, aggregation analysis finds the P10, and the P90 for average production of a group of planned wells (the more wells, the higher the P90, even in the same distribution). Alternatively, it enables finding the minimum number of wells needed to attain a certain P10, P90 production value.
CLUSTER ANALYSIS (PART OF COMPLETIONS OPTIMIZATION)Analyzes any collection of geological attributes (porosity, permeability, water saturation, silica, TOC, and others) to find natural groupings of locations with similar attributes. This analysis provides an alternative to geographic/regional type curves. It also enables a geology-based approach to predict production by geology outside a collection of producing wells (for example, the square grid shown below).
DATASHEET | 3
COMPLETIONS OPTIMIZATION WITH MACHINE LEARNINGAnalyzes well production (for example, initial production or EUR) as a function of available information such as geology (porosity, permeability, formation thickness, and other attributes) and well completions information (for example, operator, lateral length, amount and types of fluid and proppant) or any relevant measurement or descriptor. It builds a multivariable model using machine-learning methods. It sorts and displays the most significant predictors from the candidate variables. And it displays the model fit to the data, enabling investigation of any unusually high or low production not fully captured by the available predictor variables.
NORMALIZATION AND WHAT-IF SCENARIOSThe model may be used to create on-the-fly predictions for production, holding completions steady across the play. If geology information is available in a new region, the model can provide what-if predictions for production in the new region.
DATASHEET | 4
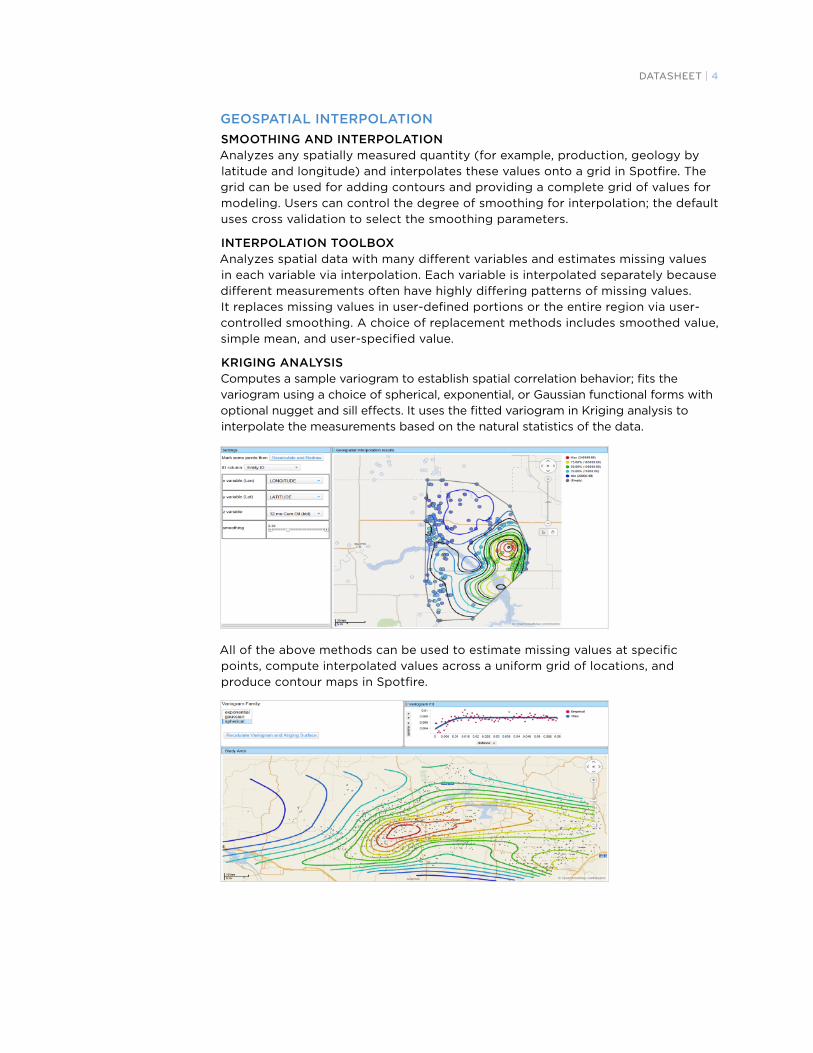
GEOSPATIAL INTERPOLATIONSMOOTHING AND INTERPOLATIONAnalyzes any spatially measured quantity (for example, production, geology by latitude and longitude) and interpolates these values onto a grid in Spotfire. The grid can be used for adding contours and providing a complete grid of values for modeling. Users can control the degree of smoothing for interpolation; the default uses cross validation to select the smoothing parameters.
INTERPOLATION TOOLBOX Analyzes spatial data with many different variables and estimates missing values in each variable via interpolation. Each variable is interpolated separately because different measurements often have highly differing patterns of missing values. It replaces missing values in user-defined portions or the entire region via user-controlled smoothing. A choice of replacement methods includes smoothed value, simple mean, and user-specified value.
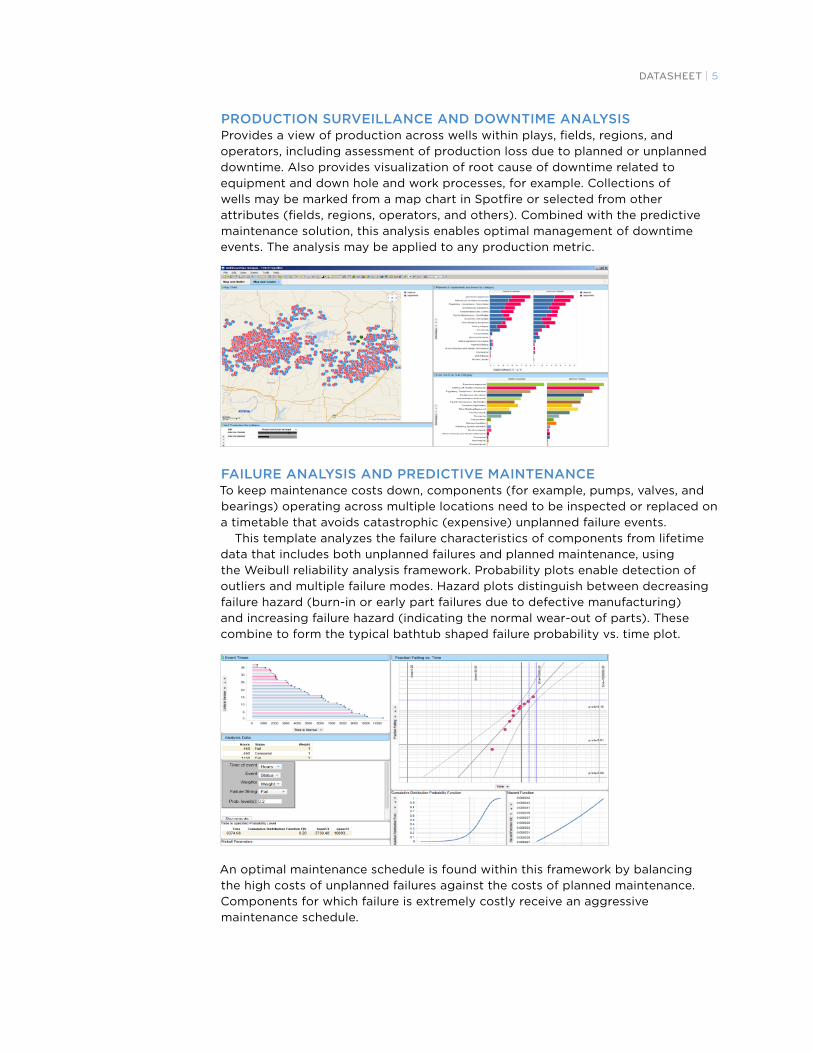
KRIGING ANALYSISComputes a sample variogram to establish spatial correlation behavior; fits the variogram using a choice of spherical, exponential, or Gaussian functional forms with optional nugget and sill effects. It uses the fitted variogram in Kriging analysis to interpolate the measurements based on the natural statistics of the data.
All of the above methods can be used to estimate missing values at specific points, compute interpolated values across a uniform grid of locations, and produce contour maps in Spotfire.
DATASHEET | 5
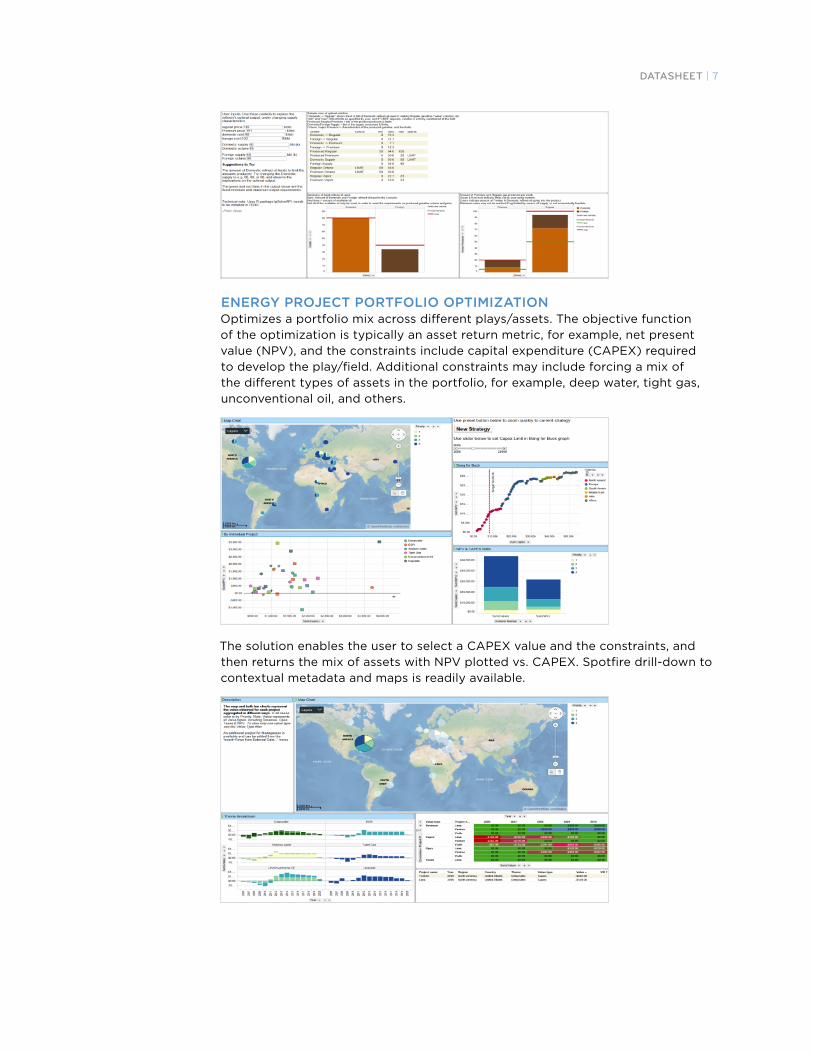
PRODUCTION SURVEILLANCE AND DOWNTIME ANALYSIS Provides a view of production across wells within plays, fields, regions, and operators, including assessment of production loss due to planned or unplanned downtime. Also provides visualization of root cause of downtime related to equipment and down hole and work processes, for example. Collections of wells may be marked from a map chart in Spotfire or selected from other attributes (fields, regions, operators, and others). Combined with the predictive maintenance solution, this analysis enables optimal management of downtime events. The analysis may be applied to any production metric.
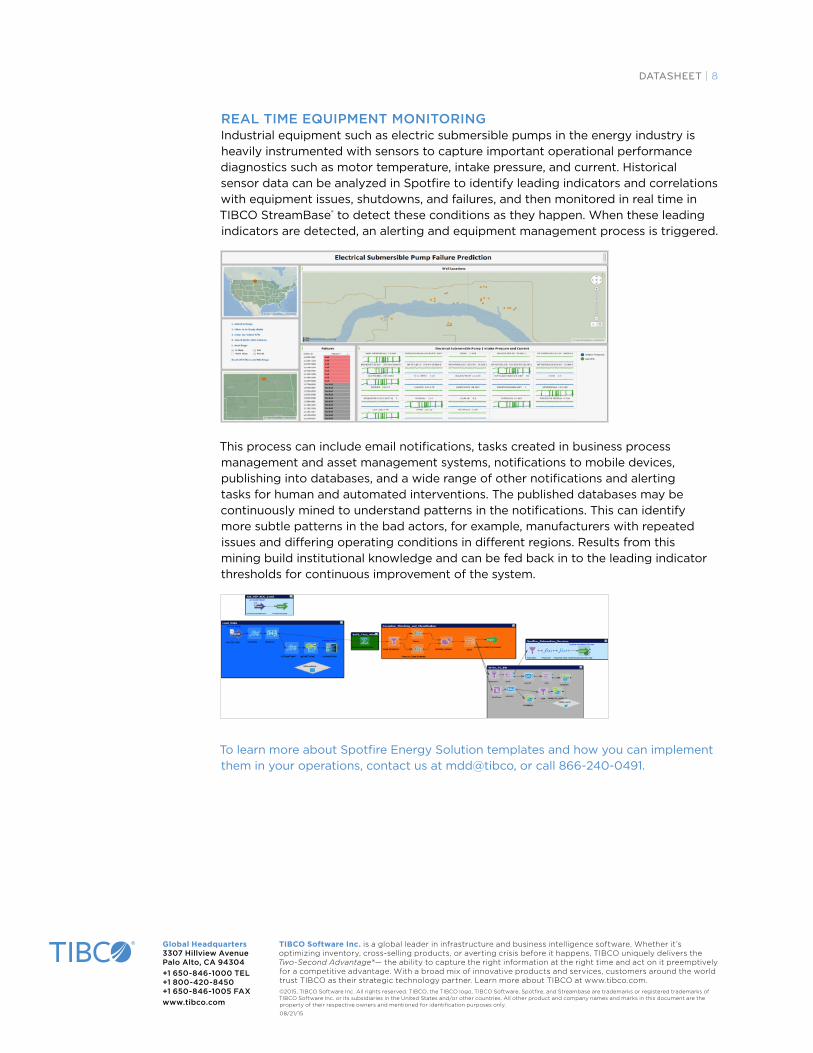
FAILURE ANALYSIS AND PREDICTIVE MAINTENANCE To keep maintenance costs down, components (for example, pumps, valves, and bearings) operating across multiple locations need to be inspected or replaced on a timetable that avoids catastrophic (expensive) unplanned failure events.
This template analyzes the failure characteristics of components from lifetime data that includes both unplanned failures and planned maintenance, using the Weibull reliability analysis framework. Probability plots enable detection of outliers and multiple failure modes. Hazard plots distinguish between decreasing failure hazard (burn-in or early part failures due to defective manufacturing) and increasing failure hazard (indicating the normal wear-out of parts). These combine to form the typical bathtub shaped failure probability vs. time plot.
An optimal maintenance schedule is found within this framework by balancing the high costs of unplanned failures against the costs of planned maintenance. Components for which failure is extremely costly receive an aggressive maintenance schedule.
DATASHEET | 6
REFINERY BLEND OPTIMIZATIONIn some types of production plants (chemicals, food, others) source components are combined to produce a blended product. Blended products need to stay within certain specifications, even in the face of variations in the quantity or specifications of the inputs. The objective is to minimize the cost of the product, as input constituents normally differ in their cost and availability.
This analysis file performs general optimization for this blending problem. In the case shown, blended gasoline is produced, and the octane and vapor pressure need to be within some specifications. The source components are domestic and imported blends, which have variable specifications as well as cost and availability.
GASOLINE REFINERY BLEND OPTIMIZATION
• Your refinery produces two types of gasoline (top) which you sell to service stations at prices shown.
• Produced gasoline must meet specifications shown (top).
• You have refined oil on hand as shown (bottom).
• Need to calculate the percentage blend of foreign and domestic oils that maximizes profit.
PRODUCED GASOLINE CHARACTERISTICS
MAXIMUM VAPOR PRESSURE
MINIMUM OCTANE RATING
MAXIMUM DEMAND, BBL/WK
MINIMUM DELIVERIES, BBL/WK
SELLING PRICE, $/BBL
REGULAR 23 88 100k 50k $138
PREMIUM 23 93 20k 5k $151
RAW MATERIALS (REFINED OIL) ON HAND
VAPOR PRESSURE
OCTANE RATING
INVENTORY, BBL
COST, $/BBL
DOMESTIC 25 85 80k $90
FOREIGN 15 98 40k $150
DATASHEET | 7
ENERGY PROJECT PORTFOLIO OPTIMIZATIONOptimizes a portfolio mix across different plays/assets. The objective function of the optimization is typically an asset return metric, for example, net present value (NPV), and the constraints include capital expenditure (CAPEX) required to develop the play/field. Additional constraints may include forcing a mix of the different types of assets in the portfolio, for example, deep water, tight gas, unconventional oil, and others.
The solution enables the user to select a CAPEX value and the constraints, and then returns the mix of assets with NPV plotted vs. CAPEX. Spotfire drill-down to contextual metadata and maps is readily available.
Global Headquarters 3307 Hillview Avenue Palo Alto, CA 94304+1 650-846-1000 TEL +1 800-420-8450 +1 650-846-1005 FAXwww.tibco.com
REAL TIME EQUIPMENT MONITORINGIndustrial equipment such as electric submersible pumps in the energy industry is heavily instrumented with sensors to capture important operational performance diagnostics such as motor temperature, intake pressure, and current. Historical sensor data can be analyzed in Spotfire to identify leading indicators and correlations with equipment issues, shutdowns, and failures, and then monitored in real time in TIBCO StreamBase® to detect these conditions as they happen. When these leading indicators are detected, an alerting and equipment management process is triggered.
This process can include email notifications, tasks created in business process management and asset management systems, notifications to mobile devices, publishing into databases, and a wide range of other notifications and alerting tasks for human and automated interventions. The published databases may be continuously mined to understand patterns in the notifications. This can identify more subtle patterns in the bad actors, for example, manufacturers with repeated issues and differing operating conditions in different regions. Results from this mining build institutional knowledge and can be fed back in to the leading indicator thresholds for continuous improvement of the system.
To learn more about Spotfire Energy Solution templates and how you can implement them in your operations, contact us at mdd@tibco, or call 866-240-0491.