222
TIBCO Spotfire S+ ® 8.2 Workbench User’s Guide November 2010 TIBCO Software Inc.
TIBCO Spotfire S+® 8.2Workbench User’s Guide
November 2010
TIBCO Software Inc.
IMPORTANT INFORMATION
SOME TIBCO SOFTWARE EMBEDS OR BUNDLES OTHER TIBCO SOFTWARE. USE OF SUCH EMBEDDED OR BUNDLED TIBCO SOFTWARE IS SOLELY TO ENABLE THE FUNCTIONALITY (OR PROVIDE LIMITED ADD-ON FUNCTIONALITY) OF THE LICENSED TIBCO SOFTWARE. THE EMBEDDED OR BUNDLED SOFTWARE IS NOT LICENSED TO BE USED OR ACCESSED BY ANY OTHER TIBCO SOFTWARE OR FOR ANY OTHER PURPOSE.
USE OF TIBCO SOFTWARE AND THIS DOCUMENT IS SUBJECT TO THE TERMS AND CONDITIONS OF A LICENSE AGREEMENT FOUND IN EITHER A SEPARATELY EXECUTED SOFTWARE LICENSE AGREEMENT, OR, IF THERE IS NO SUCH SEPARATE AGREEMENT, THE CLICKWRAP END USER LICENSE AGREEMENT WHICH IS DISPLAYED DURING DOWNLOAD OR INSTALLATION OF THE SOFTWARE (AND WHICH IS DUPLICATED IN TIBCO SPOTFIRE S+® LICENSES). USE OF THIS DOCUMENT IS SUBJECT TO THOSE TERMS AND CONDITIONS, AND YOUR USE HEREOF SHALL CONSTITUTE ACCEPTANCE OF AND AN AGREEMENT TO BE BOUND BY THE SAME.
This document contains confidential information that is subject to U.S. and international copyright laws and treaties. No part of this document may be reproduced in any form without the written authorization of TIBCO Software Inc.
TIBCO Software Inc., TIBCO, Spotfire, TIBCO Spotfire S+, Insightful, the Insightful logo, the tagline "the Knowledge to Act," Insightful Miner, S+, S-PLUS, TIBCO Spotfire Axum, S+ArrayAnalyzer, S+EnvironmentalStats, S+FinMetrics, S+NuOpt, S+SeqTrial, S+SpatialStats, S+Wavelets, S-PLUS Graphlets, Graphlet, Spotfire S+ FlexBayes, Spotfire S+ Resample, TIBCO Spotfire Miner, TIBCO Spotfire S+ Server, TIBCO Spotfire Statistics Services, and TIBCO Spotfire Clinical Graphics are either registered trademarks or trademarks of TIBCO Software Inc. and/or subsidiaries of TIBCO Software Inc. in the United States and/or other countries. All other product and company names and marks mentioned in this document are the property of their respective owners and are mentioned for identification purposes only. This
ii
software may be available on multiple operating systems. However, not all operating system platforms for a specific software version are released at the same time. Please see the readme.txt file for the availability of this software version on a specific operating system platform.
THIS DOCUMENT IS PROVIDED “AS IS” WITHOUT WARRANTY OF ANY KIND, EITHER EXPRESS OR IMPLIED, INCLUDING, BUT NOT LIMITED TO, THE IMPLIED WARRANTIES OF MERCHANTABILITY, FITNESS FOR A PARTICULAR PURPOSE, OR NON-INFRINGEMENT. THIS DOCUMENT COULD INCLUDE TECHNICAL INACCURACIES OR TYPOGRAPHICAL ERRORS. CHANGES ARE PERIODICALLY ADDED TO THE INFORMATION HEREIN; THESE CHANGES WILL BE INCORPORATED IN NEW EDITIONS OF THIS DOCUMENT. TIBCO SOFTWARE INC. MAY MAKE IMPROVEMENTS AND/OR CHANGES IN THE PRODUCT(S) AND/OR THE PROGRAM(S) DESCRIBED IN THIS DOCUMENT AT ANY TIME.
Copyright © 1996-2010 TIBCO Software Inc. ALL RIGHTS RESERVED. THE CONTENTS OF THIS DOCUMENT MAY BE MODIFIED AND/OR QUALIFIED, DIRECTLY OR INDIRECTLY, BY OTHER DOCUMENTATION WHICH ACCOMPANIES THIS SOFTWARE, INCLUDING BUT NOT LIMITED TO ANY RELEASE NOTES AND "READ ME" FILES.
TIBCO Software Inc. Confidential Information
Reference The correct bibliographic reference for this document is as follows:
TIBCO Spotfire S+® 8.2 Workbench User’s Guide TIBCO Software Inc.
iii
TIBCO SPOTFIRE S+ BOOKS
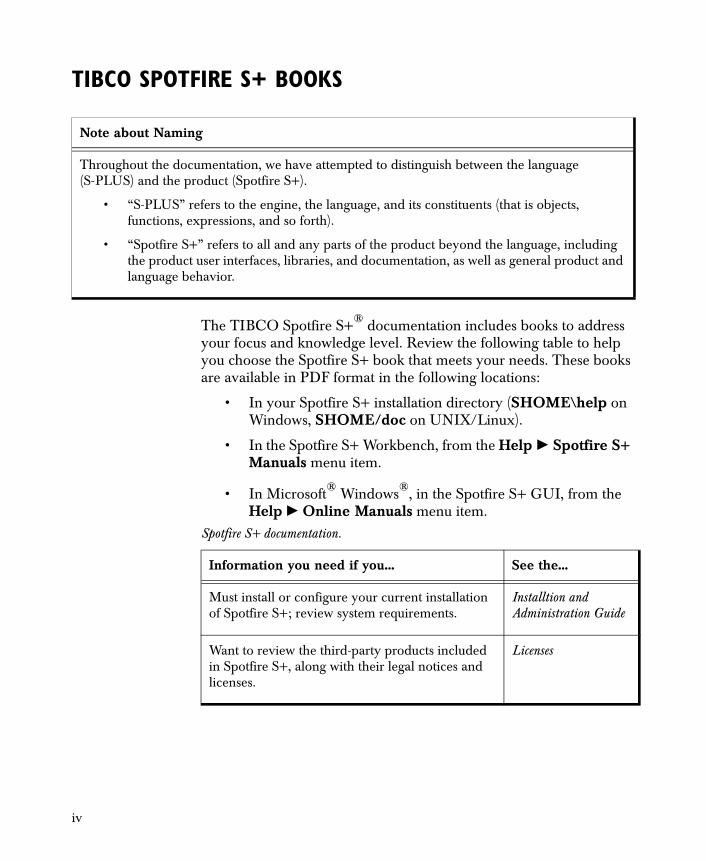
The TIBCO Spotfire S+® documentation includes books to address your focus and knowledge level. Review the following table to help you choose the Spotfire S+ book that meets your needs. These books are available in PDF format in the following locations:
• In your Spotfire S+ installation directory (SHOME\help on Windows, SHOME/doc on UNIX/Linux).
• In the Spotfire S+ Workbench, from the Help � Spotfire S+ Manuals menu item.
• In Microsoft® Windows®, in the Spotfire S+ GUI, from the Help � Online Manuals menu item.
Note about Naming
Throughout the documentation, we have attempted to distinguish between the language (S-PLUS) and the product (Spotfire S+).
• “S-PLUS” refers to the engine, the language, and its constituents (that is objects, functions, expressions, and so forth).
• “Spotfire S+” refers to all and any parts of the product beyond the language, including the product user interfaces, libraries, and documentation, as well as general product and language behavior.
Spotfire S+ documentation.
Information you need if you... See the...
Must install or configure your current installation of Spotfire S+; review system requirements.
Installtion and Administration Guide
Want to review the third-party products included in Spotfire S+, along with their legal notices and licenses.
Licenses
iv
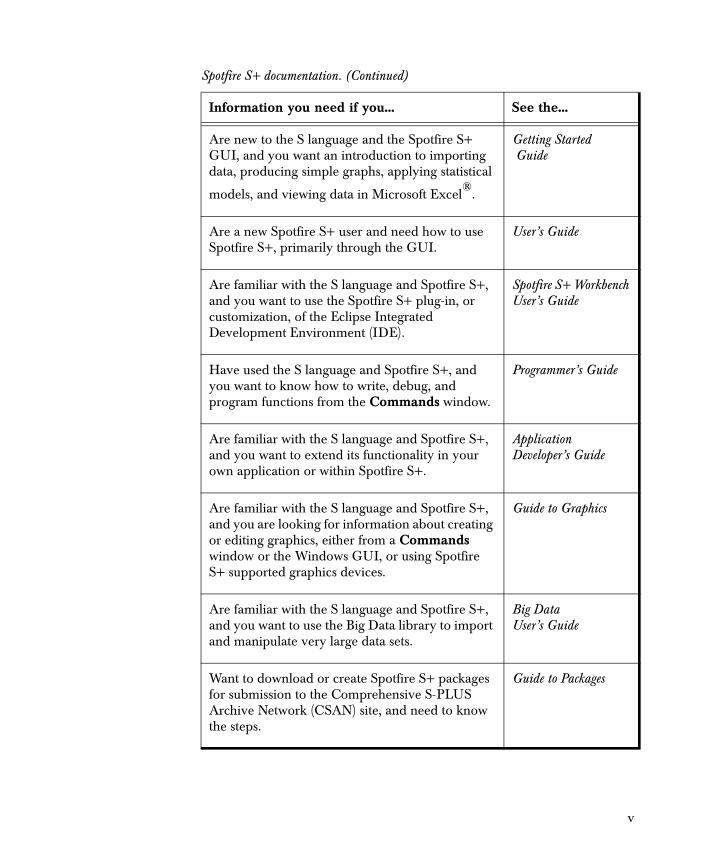
Are new to the S language and the Spotfire S+ GUI, and you want an introduction to importing data, producing simple graphs, applying statistical
models, and viewing data in Microsoft Excel®.
Getting Started Guide
Are a new Spotfire S+ user and need how to use Spotfire S+, primarily through the GUI.
User’s Guide
Are familiar with the S language and Spotfire S+, and you want to use the Spotfire S+ plug-in, or customization, of the Eclipse Integrated Development Environment (IDE).
Spotfire S+ Workbench User’s Guide
Have used the S language and Spotfire S+, and you want to know how to write, debug, and program functions from the Commands window.
Programmer’s Guide
Are familiar with the S language and Spotfire S+, and you want to extend its functionality in your own application or within Spotfire S+.
Application Developer’s Guide
Are familiar with the S language and Spotfire S+, and you are looking for information about creating or editing graphics, either from a Commands window or the Windows GUI, or using Spotfire S+ supported graphics devices.
Guide to Graphics
Are familiar with the S language and Spotfire S+, and you want to use the Big Data library to import and manipulate very large data sets.
Big Data User’s Guide
Want to download or create Spotfire S+ packages for submission to the Comprehensive S-PLUS Archive Network (CSAN) site, and need to know the steps.
Guide to Packages
Spotfire S+ documentation. (Continued)
Information you need if you... See the...
v
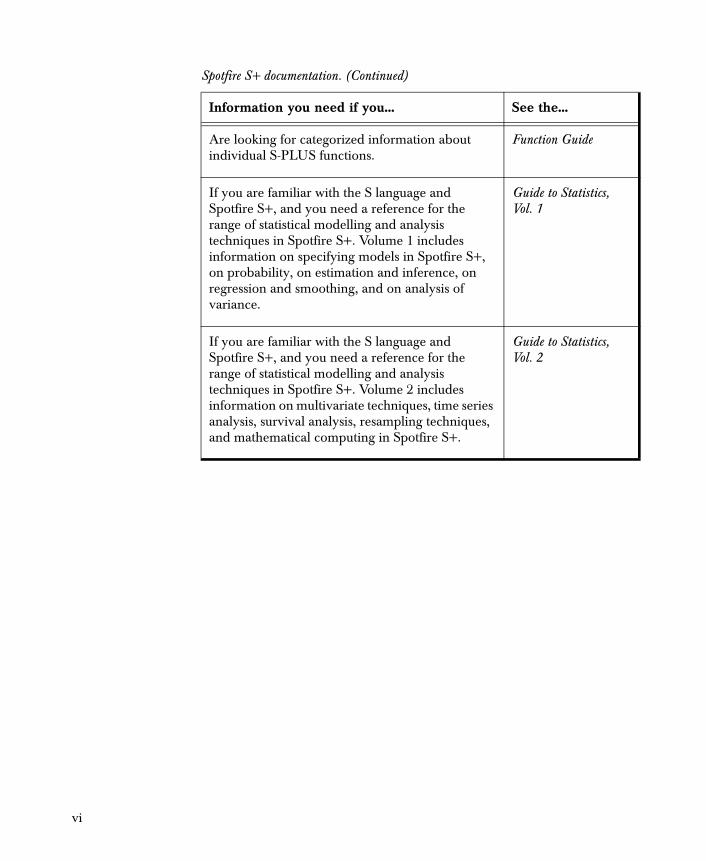
Are looking for categorized information about individual S-PLUS functions.
Function Guide
If you are familiar with the S language and Spotfire S+, and you need a reference for the range of statistical modelling and analysis techniques in Spotfire S+. Volume 1 includes information on specifying models in Spotfire S+, on probability, on estimation and inference, on regression and smoothing, and on analysis of variance.
Guide to Statistics, Vol. 1
If you are familiar with the S language and Spotfire S+, and you need a reference for the range of statistical modelling and analysis techniques in Spotfire S+. Volume 2 includes information on multivariate techniques, time series analysis, survival analysis, resampling techniques, and mathematical computing in Spotfire S+.
Guide to Statistics, Vol. 2
Spotfire S+ documentation. (Continued)
Information you need if you... See the...
vi
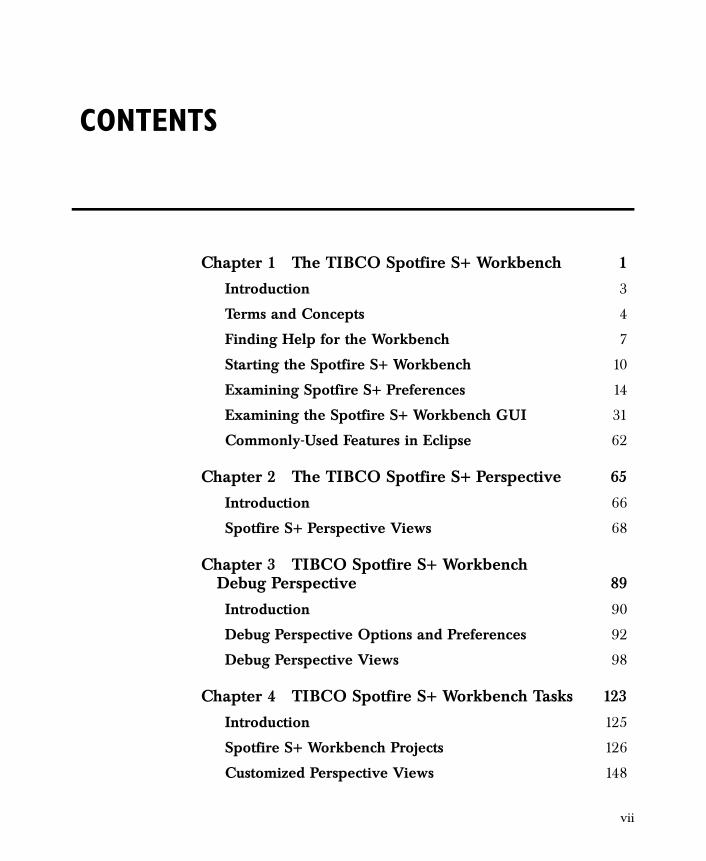
Chapter 1 The TIBCO Spotfire S+ Workbench 1
Introduction 3
Terms and Concepts 4
Finding Help for the Workbench 7
Starting the Spotfire S+ Workbench 10
Examining Spotfire S+ Preferences 14
Examining the Spotfire S+ Workbench GUI 31
Commonly-Used Features in Eclipse 62
Chapter 2 The TIBCO Spotfire S+ Perspective 65
Introduction 66
Spotfire S+ Perspective Views 68
Chapter 3 TIBCO Spotfire S+ Workbench Debug Perspective 89
Introduction 90
Debug Perspective Options and Preferences 92
Debug Perspective Views 98
Chapter 4 TIBCO Spotfire S+ Workbench Tasks 123
Introduction 125
Spotfire S+ Workbench Projects 126
Customized Perspective Views 148
CONTENTS
vii
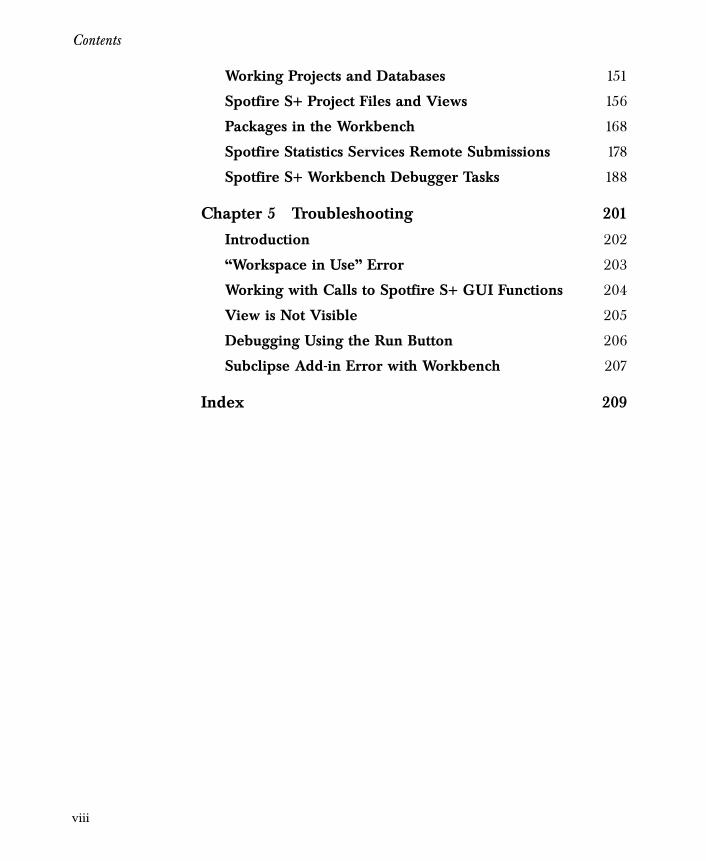
Contents
Working Projects and Databases 151
Spotfire S+ Project Files and Views 156
Packages in the Workbench 168
Spotfire Statistics Services Remote Submissions 178
Spotfire S+ Workbench Debugger Tasks 188
Chapter 5 Troubleshooting 201
Introduction 202
“Workspace in Use” Error 203
Working with Calls to Spotfire S+ GUI Functions 204
View is Not Visible 205
Debugging Using the Run Button 206
Subclipse Add-in Error with Workbench 207
Index 209
viii
Introduction 3
Terms and Concepts 4
Finding Help for the Workbench 7Getting Started Tutorial 7Help for Spotfire S+ Functions 8The Spotfire S+ Workbench PDF 9
Starting the Spotfire S+ Workbench 10From Microsoft Windows 10From Unix 11The Spotfire S+ Workspace 12
Examining Spotfire S+ Preferences 14File Associations 14Spotfire S+ Workbench options 16Send Output from Run Action to Console View 17Spotfire S+ Package Repository 18Console Options 18Editor 20Outline Options 23Output Options 24Task Options 25Statistics Services Options 25
Examining the Spotfire S+ Workbench GUI 31Spotfire S+ New Project Wizard 31Customized Menus, Toolbars, and Dialogs 31Spotfire S+ Workbench Status Bar 40Spotfire S+ Workbench Perspectives and Views 42Default Shared Views 49
THE TIBCO SPOTFIRE S+ WORKBENCH 1
1

Chapter 1 The TIBCO Spotfire S+ Workbench
Commonly-Used Features in Eclipse 62Using the Workbench as an Eclipse Plug-In 63
2
Introduction
INTRODUCTION
TIBCO Spotfire S+ provides a plug-in, or customization, of theEclipse Integrated Development Environment (IDE) called theSpotfire S+ Workbench. You can use the Spotfire S+ Workbench, thebasic Eclipse IDE features, and other third-party plug-ins for manytasks, including:
• Manage your project files and tasks.
• Edit your code.
• Run Spotfire S+ commands.
• Examine Spotfire S+ objects.
• Debug your code.
• Track resource use, functions, variables, and expressions.
• Troubleshoot problems with Spotfire S+ code.
• Provide source control for shared project files.
The Spotfire S+ Workbench is a stand-alone application that runs theS-PLUS engine. When you run the Spotfire S+ Workbench, you donot need to run any other version of Spotfire S+ (for example, theconsole or traditional Windows or Java GUI).
This chapter introduces the Spotfire S+ Workbench and providesimportant conceptual information and definitions of terms you needto know to use the Spotfire S+ Workbench most effectively.
• Chapter 2 provides reference for the Spotfire S+ perspective.
• Chapter 3 provides reference for the Debug perspective.
• Chapter 4 provides tasks for learning to use the Spotfire S+Workbench.
Caution
If you run two or more simultaneous sessions of Spotfire S+ (including one or more in the Spotfire S+ Workbench), take care to use different working directories. To use the same working directory for multiple sessions can cause conflicts, and possibly even data corruption.
3
Chapter 1 The TIBCO Spotfire S+ Workbench
TERMS AND CONCEPTS
Before you start using the Spotfire S+ Workbench, you shouldunderstand key terms and concepts that vary from the traditionalSpotfire S+ for Windows GUI and Spotfire S+ for UNIX Java GUI.
Note
If you are using the Eclipse IDE on a UNIX platform from a Windows machine using a Windows X-server software package, you might notice that Eclipse runs slowly, similar to the Spotfire S+ Java GUI. See the Release Notes for more information and recommendations for improving UI performance.
Note
Eclipse version 3.2 or later does not support SPARC/Motif for Solaris. If you are using a version of Solaris prior to version 10, you must install the GTK (version 2.2.4 or greater) library. For more information about finding this library, see http://www.sun.com/software/solaris/. (This library is included in Solaris 10.)
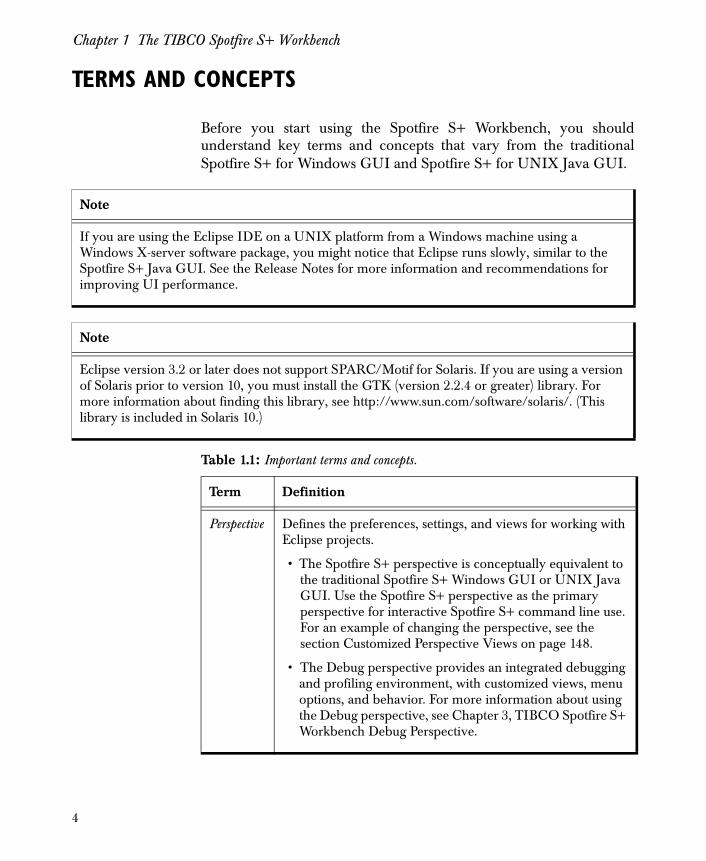
Table 1.1: Important terms and concepts.
Term Definition
Perspective Defines the preferences, settings, and views for working with Eclipse projects.
• The Spotfire S+ perspective is conceptually equivalent to the traditional Spotfire S+ Windows GUI or UNIX Java GUI. Use the Spotfire S+ perspective as the primary perspective for interactive Spotfire S+ command line use. For an example of changing the perspective, see the section Customized Perspective Views on page 148.
• The Debug perspective provides an integrated debugging and profiling environment, with customized views, menu options, and behavior. For more information about using the Debug perspective, see Chapter 3, TIBCO Spotfire S+ Workbench Debug Perspective.
4
Terms and Concepts
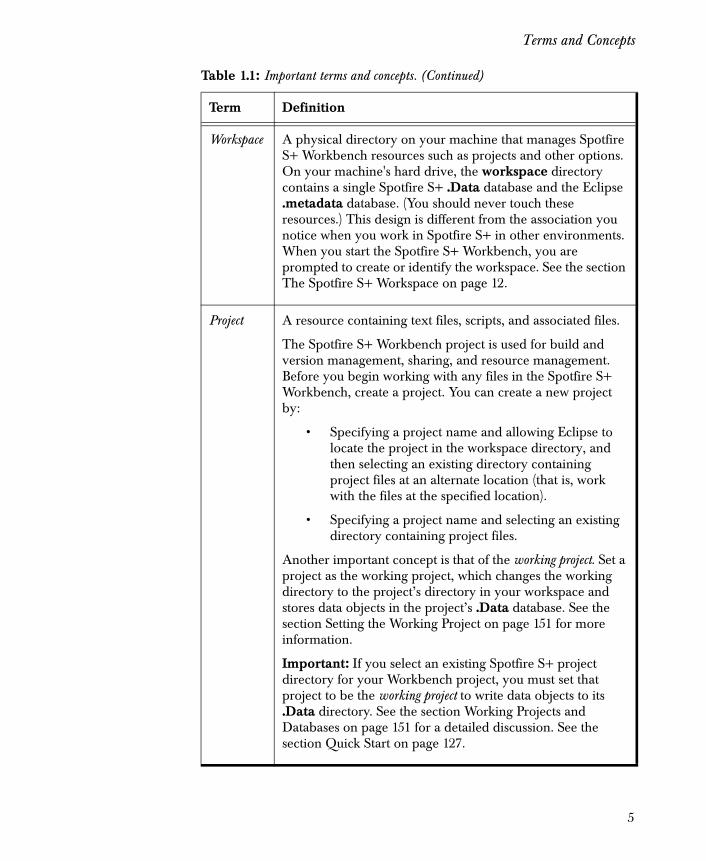
Workspace A physical directory on your machine that manages Spotfire S+ Workbench resources such as projects and other options. On your machine's hard drive, the workspace directory contains a single Spotfire S+ .Data database and the Eclipse .metadata database. (You should never touch these resources.) This design is different from the association you notice when you work in Spotfire S+ in other environments. When you start the Spotfire S+ Workbench, you are prompted to create or identify the workspace. See the section The Spotfire S+ Workspace on page 12.
Project A resource containing text files, scripts, and associated files.
The Spotfire S+ Workbench project is used for build and version management, sharing, and resource management. Before you begin working with any files in the Spotfire S+ Workbench, create a project. You can create a new project by:
• Specifying a project name and allowing Eclipse to locate the project in the workspace directory, and then selecting an existing directory containing project files at an alternate location (that is, work with the files at the specified location).
• Specifying a project name and selecting an existing directory containing project files.
Another important concept is that of the working project. Set a project as the working project, which changes the working directory to the project’s directory in your workspace and stores data objects in the project’s .Data database. See the section Setting the Working Project on page 151 for more information.
Important: If you select an existing Spotfire S+ project directory for your Workbench project, you must set that project to be the working project to write data objects to its .Data directory. See the section Working Projects and Databases on page 151 for a detailed discussion. See the section Quick Start on page 127.
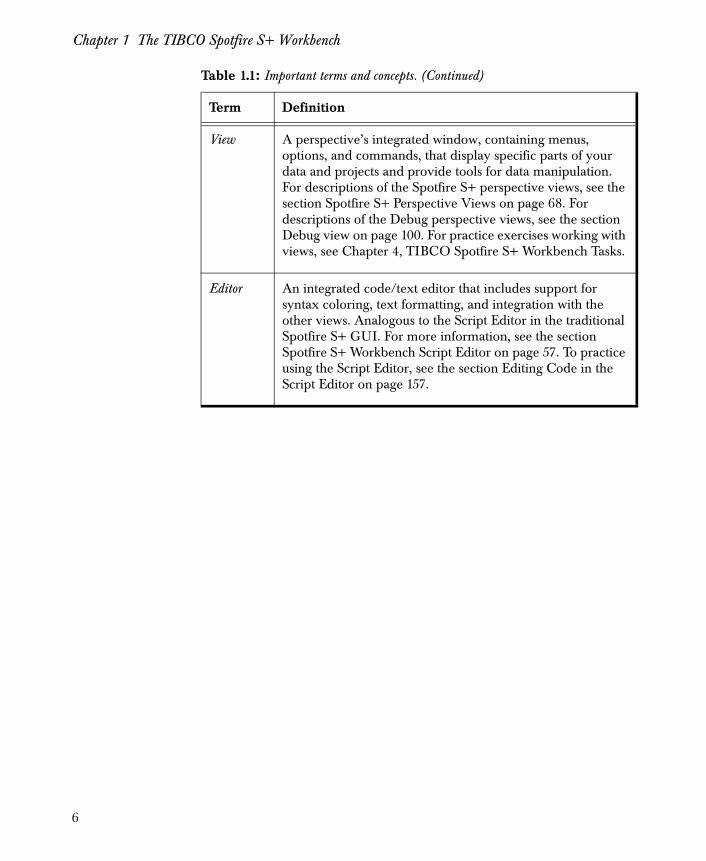
Table 1.1: Important terms and concepts. (Continued)
Term Definition
5
Chapter 1 The TIBCO Spotfire S+ Workbench
View A perspective’s integrated window, containing menus, options, and commands, that display specific parts of your data and projects and provide tools for data manipulation. For descriptions of the Spotfire S+ perspective views, see the section Spotfire S+ Perspective Views on page 68. For descriptions of the Debug perspective views, see the section Debug view on page 100. For practice exercises working with views, see Chapter 4, TIBCO Spotfire S+ Workbench Tasks.
Editor An integrated code/text editor that includes support for syntax coloring, text formatting, and integration with the other views. Analogous to the Script Editor in the traditional Spotfire S+ GUI. For more information, see the section Spotfire S+ Workbench Script Editor on page 57. To practice using the Script Editor, see the section Editing Code in the Script Editor on page 157.
Table 1.1: Important terms and concepts. (Continued)
Term Definition
6
Finding Help for the Workbench
FINDING HELP FOR THE WORKBENCH
The Eclipse IDE contains extensive, in-depth documentation for itsuser interface. For information about basic Eclipse IDE functionality,on the menu, see the Eclipse Workbench User Guide.
Getting Started Tutorial
If you are not familiar with the Eclipse IDE, after you start theSpotfire S+ Workbench, take the first few minutes to learn the basicconcepts and IDE layout by working through the basic tutorial in theWorkbench User Guide.
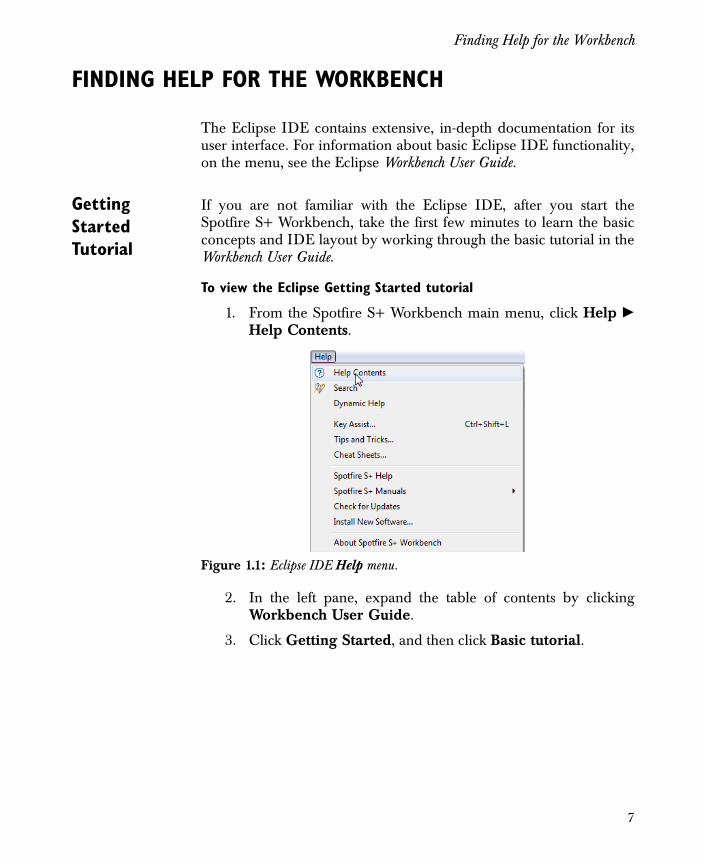
To view the Eclipse Getting Started tutorial
1. From the Spotfire S+ Workbench main menu, click Help �Help Contents.
2. In the left pane, expand the table of contents by clickingWorkbench User Guide.
3. Click Getting Started, and then click Basic tutorial.
Figure 1.1: Eclipse IDE Help menu.
7
Chapter 1 The TIBCO Spotfire S+ Workbench
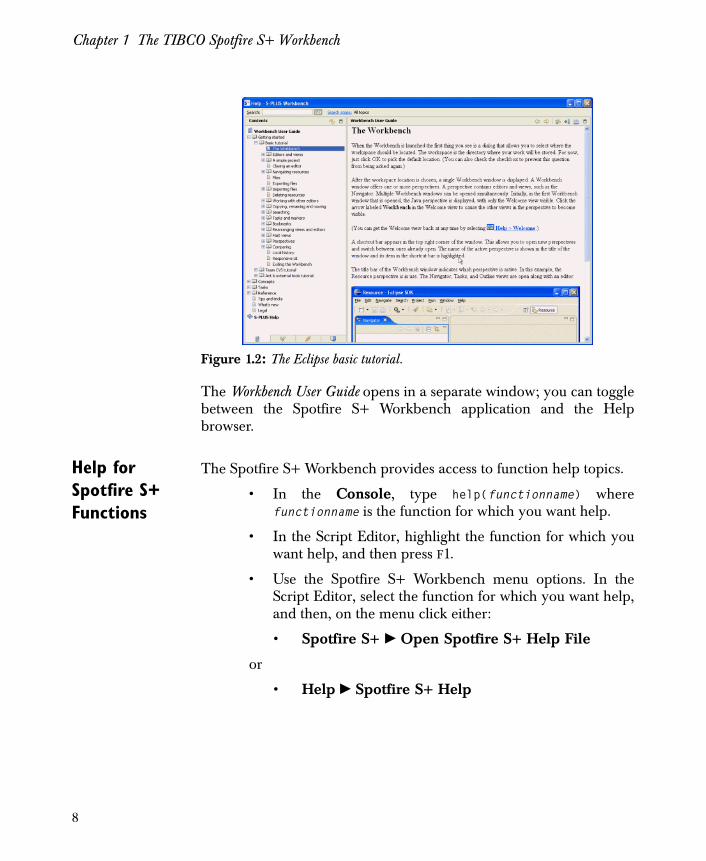
The Workbench User Guide opens in a separate window; you can togglebetween the Spotfire S+ Workbench application and the Helpbrowser.
Help for Spotfire S+ Functions
The Spotfire S+ Workbench provides access to function help topics.
• In the Console, type help(functionname) wherefunctionname is the function for which you want help.
• In the Script Editor, highlight the function for which youwant help, and then press F1.
• Use the Spotfire S+ Workbench menu options. In theScript Editor, select the function for which you want help,and then, on the menu click either:
• Spotfire S+ � Open Spotfire S+ Help File
or
• Help � Spotfire S+ Help
Figure 1.2: The Eclipse basic tutorial.
8
Finding Help for the Workbench
The Spotfire S+ Workbench PDF
If you browsed to and opened this document directly from theinstallation directory, you might be interested to know how you canopen it directly from the Spotfire S+ Workbench user interface.
On the Spotfire S+ Workbench menu, click Help � Spotfire S+Manuals � Spotfire S+ Workbench Guide. (Note that all SpotfireS+ manuals are available from the Spotfire S+ Manuals menu,including the Programmer’s Guide, the Application Developer’s Guide, theFunction Guide, the Big Data User’s Guide, the Guide to Packages and theGuide to Graphics, among others.)
For more information about setting preferences, see the followingdocumentation:
• The section Examining Spotfire S+ Preferences on page 14.
• The section Setting the Spotfire S+ Workbench Preferenceson page 137.
• The Eclipse Workbench User Guide, available from the SpotfireS+ Workbench menu item Help � Help Contents.
Note
Whether you are working in Windows®
or a UNIX®
platform, You must have access to a PDF reader to open any of the PDFs shipped with Spotfire S+.
Note
For information about creating a package project using the Spotfire S+ Packages feature with the Spotfire S+ Workbench, see the section To create a package project on page 168.
9
Chapter 1 The TIBCO Spotfire S+ Workbench
STARTING THE SPOTFIRE S+ WORKBENCH
The Spotfire S+ Workbench user interface is the same in bothMicrosoft Windows and UNIX platforms.
From Microsoft Windows
In Microsoft Windows, click the Start menu � All Programs � TIBCO � TIBCO Spotfire S+ 8.2 � TIBCO Spotfire S+Workbench.
Setting Environment Variables
When you start the Spotfire S+ Workbench from the Windows Startmenu, it uses a shortcut that starts a Java virtual machine (-vm)immediately. The Workbench supports a Java system variable,splus.environment.vars, that can pass environment variables to theengine for startup consumption. For example, you can set yourSpotfire S+ Workbench environment to start without printingcopyright and version infromation by setting the environmentvariable S_SILENT_STARTUP=<any value>.
To use the Java system variable, create a shortcut or a .bat file thatcontains the following instructions:
"SHOME\eclipse\eclipse.exe" -vm "SHOME\java\jre\bin\javaw.exe" -vmargs -Dsplus.shome="SHOME"
(Where SHOME is your Spotfire S+ installation location.
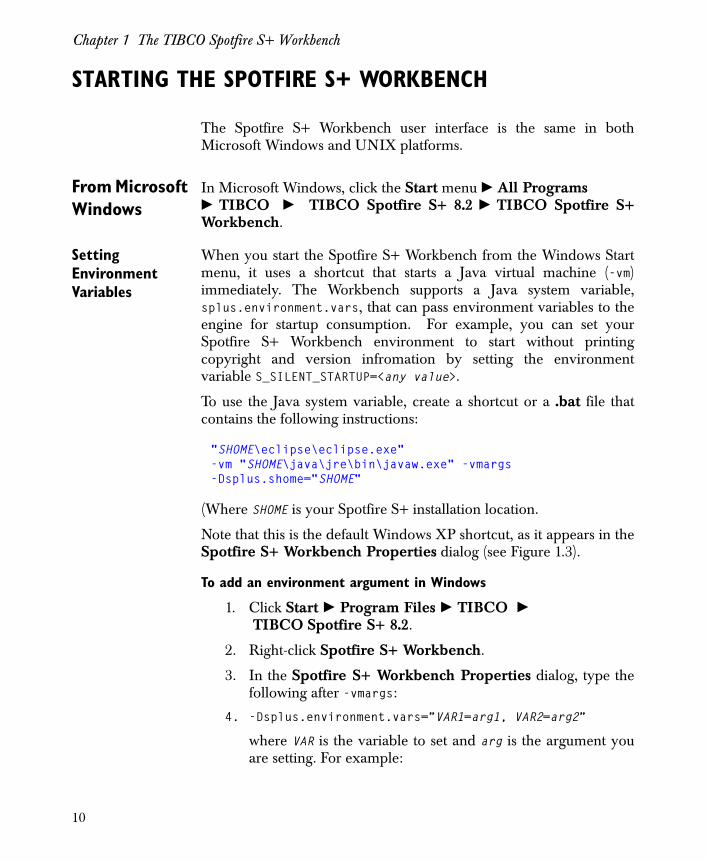
Note that this is the default Windows XP shortcut, as it appears in theSpotfire S+ Workbench Properties dialog (see Figure 1.3).
To add an environment argument in Windows
1. Click Start � Program Files � TIBCO � TIBCO Spotfire S+ 8.2.
2. Right-click Spotfire S+ Workbench.
3. In the Spotfire S+ Workbench Properties dialog, type thefollowing after -vmargs:
4. -Dsplus.environment.vars=”VAR1=arg1, VAR2=arg2”
where VAR is the variable to set and arg is the argument youare setting. For example:
10
Starting the Spotfire S+ Workbench
-Dsplus.environment.vars=”S_LICMGRSN=WTP10987654321, S_SILENT_STARTUP=X”
From Unix In UNIX, at the command prompt, type
Splus -w
or type
Splus -workbench
Note
The Windows startup shortcut is defined to run a command with the option to set memory heap size: -Xmx400m.
"SHOME\eclipse\eclipse.exe" -vm "SHOME\java\jre\bin\javaw.exe" -vmargs -Dsplus.shome="SHOME\eclipse\eclipse.exe -Xmx400m”
You can override this setting and increase the memory heap size by appending a different setting at the end of the shortcut. (For example, change -Xmx400m to -Xmx600m at the end of the command to set the memory heap size to 600mb.) See Figure 1.3 for an example.
Figure 1.3: Spotfire S+ Workbench Properties dialog.
11
Chapter 1 The TIBCO Spotfire S+ Workbench
Setting Environment Variables
Certain required environment variables are set to work with UNIXand Linux as part of the Spotfire S+ Workbench startup script. To addother environment variables, set them using env. For example, youcan start the Spotfire S+ Workbench with a particular license and tostart displaying no copyright and version information by using thefollowing:
env S_LICMGRSN=WTP10987654321 S_SILENT_STARTUP=X Splus -w
(To set multiple environment variables, separate them with spaces. )
To extend the Java maximum memory heap size to 600MB, set theenvironment variable JAVA_OPTIONS to -Xmx600m. For example:
env JAVA_OPTIONS="-Xmx600m" Splus -w
The Spotfire S+ Workspace
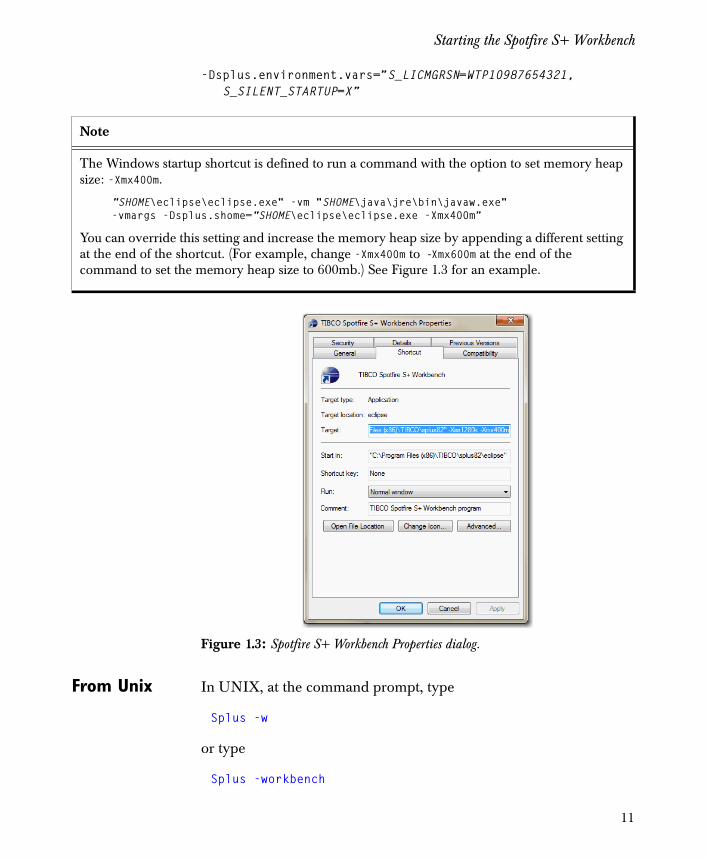
When you launch the Spotfire S+ Workbench, you see theWorkspace Launcher dialog. You must indicate the location of theworkspace.
The Spotfire S+ workspace is the directory where the Spotfire S+workspace .Data and Eclipse .metadata databases are stored. (Youshould never touch these files.) Optionally, the workspace directorycan also store your project directories. The Spotfire S+ workspace isthe default directory specified for the project's directory in the NewProject wizard. See the section Spotfire S+ New Project Wizardon page 31 for more information. (For instruction on creating aworkspace, see the section Setting the Workspace on page 126.)
Figure 1.4: The Workspace Launcher dialog.
12
Starting the Spotfire S+ Workbench
Important
In the Spotfire S+ Workbench, you have two options for storing dataobjects:
• Using the Spotfire S+ Workbench model, where the SpotfireS+ workspace contains a .Data directory, not individualprojects. The .Data directory can store objects for projects toshare in the workspace.
• Using the familiar Spotfire S+ model, the working Spotfire S+project stores its data objects to its .Data directory and replacesthe first entry in the Search Path with the project's location.It is also the location to which relative paths are resolved.
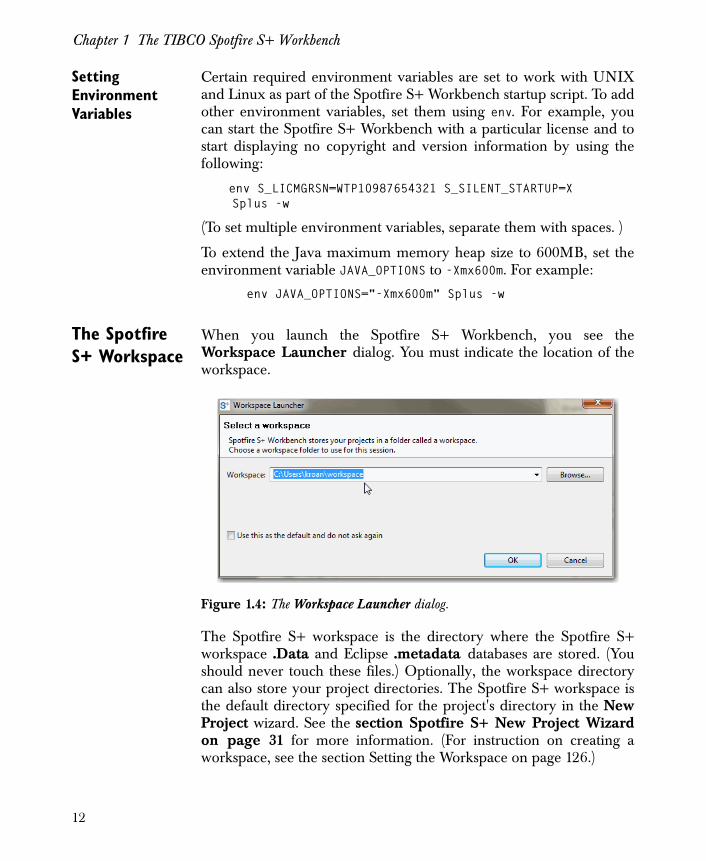
Working projects are marked by an arrow icon, and by thecue (working) in the navigator:
For more information about setting the Spotfire S+ working project,see the section Setting the Working Project on page 151.
Figure 1.5: The working project.
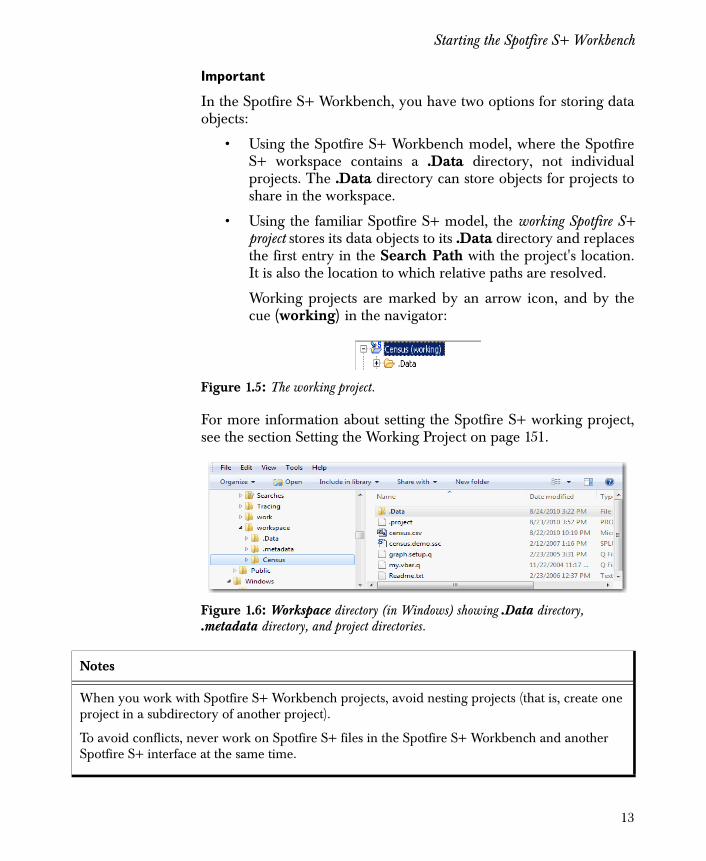
Figure 1.6: Workspace directory (in Windows) showing .Data directory, .metadata directory, and project directories.
Notes
When you work with Spotfire S+ Workbench projects, avoid nesting projects (that is, create one project in a subdirectory of another project).
To avoid conflicts, never work on Spotfire S+ files in the Spotfire S+ Workbench and another Spotfire S+ interface at the same time.
13
Chapter 1 The TIBCO Spotfire S+ Workbench
EXAMINING SPOTFIRE S+ PREFERENCES
The Spotfire S+ Workbench IDE defaults are set to the Spotfire S+perspective. The preferences include project type, windowappearance, editor preferences, menu options, debugging options,server options, and file associations. Use the Preferences dialog tochange these preferences and any other default Eclipse preferences.To display the Preferences dialog, on the main menu, click Window� Preferences.
You can also display the Preferences dialog for the following Spotfire
S+ Workbench views by clicking the drop-down button ( ) andselecting Preferences from the control menu:
• Tasks view.
• Problems view.
• Output view.
• Console view.
You can display the Preferences dialog for the Spotfire S+Workbench Script editor from the right-click menu (that is, right-clickthe Script Editor, and from the menu, click Preferences).
For instruction on setting Spotfire S+ preferences, see the sectionSetting the Spotfire S+ Workbench Preferences on page 137.
The Spotfire S+ Workbench sets defaults for the followingpreferences.
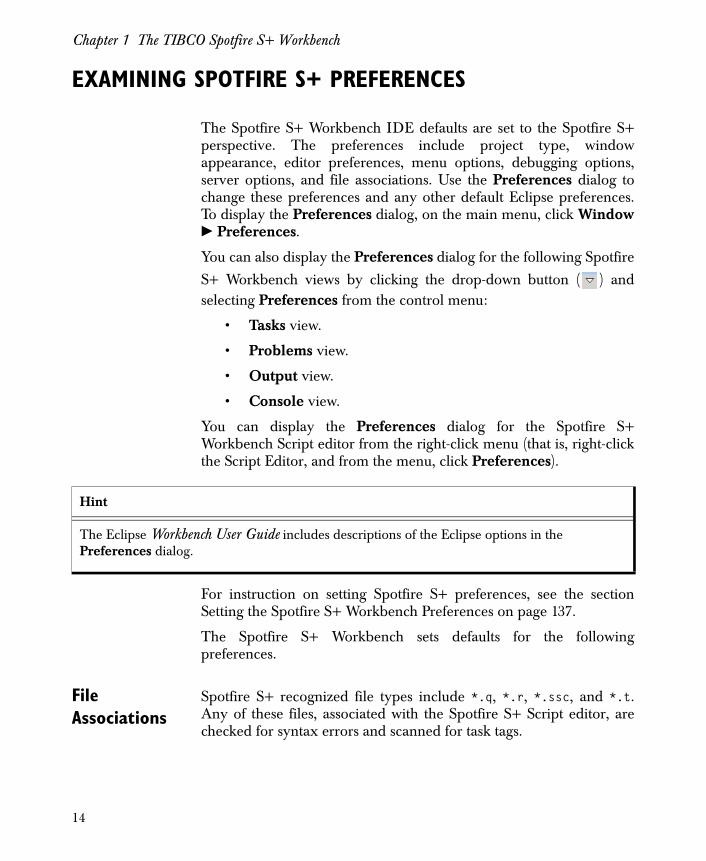
File Associations
Spotfire S+ recognized file types include *.q, *.r, *.ssc, and *.t.Any of these files, associated with the Spotfire S+ Script editor, arechecked for syntax errors and scanned for task tags.
Hint
The Eclipse Workbench User Guide includes descriptions of the Eclipse options in the Preferences dialog.
14
Examining Spotfire S+ Preferences
Note that when you select the file type, its associated editors aredisplayed in the Associated editors box. You can add or removeboth file types and associated editors.
Figure 1.7: The File Associations page of the Preferences dialog.
15
Chapter 1 The TIBCO Spotfire S+ Workbench
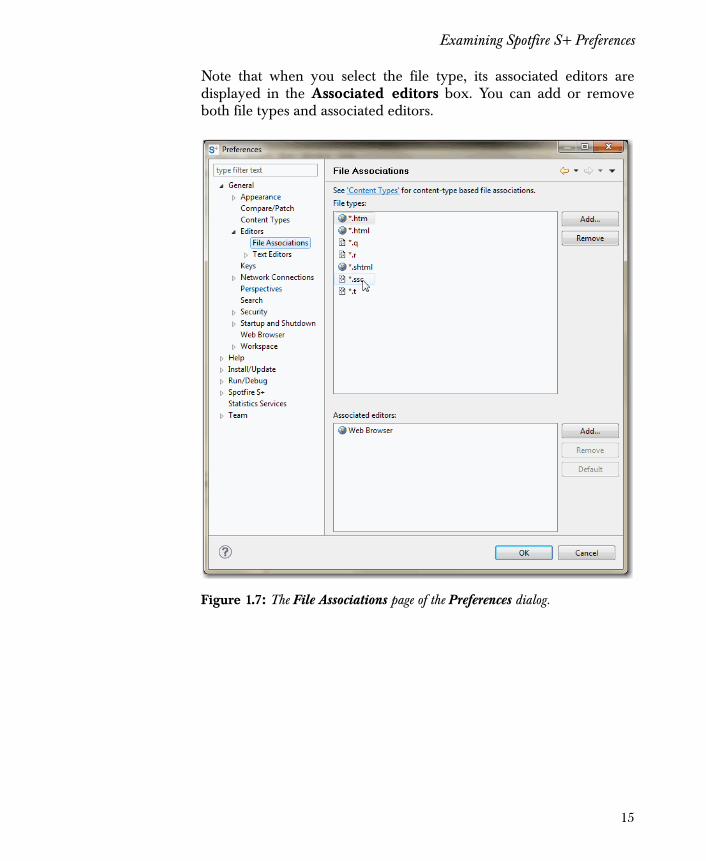
Spotfire S+ Workbench options
These options control general settings for the Spotfire S+ Workbench.
Run code on startup
Select this option, and then provide any code that you want theSpotfire S+ Workbench to run when it starts up. Note that this box isselected by default, and the Big Data library is loaded by default.
Figure 1.8: The Spotfire S+ Workbench Options page of the Preferences dialog.
Note
If you clear the Run code on startup box, or if you do not supply the option to load the Big Data library on startup, and then later open a project that uses the Big Data library, you could see unexpected results when you try to perform actions. If your typical projects include large data sets, add the code to load the Big Data library and select Run code on startup to load the Big Data library when you start the Spotfire S+ Workbench.
16
Examining Spotfire S+ Preferences
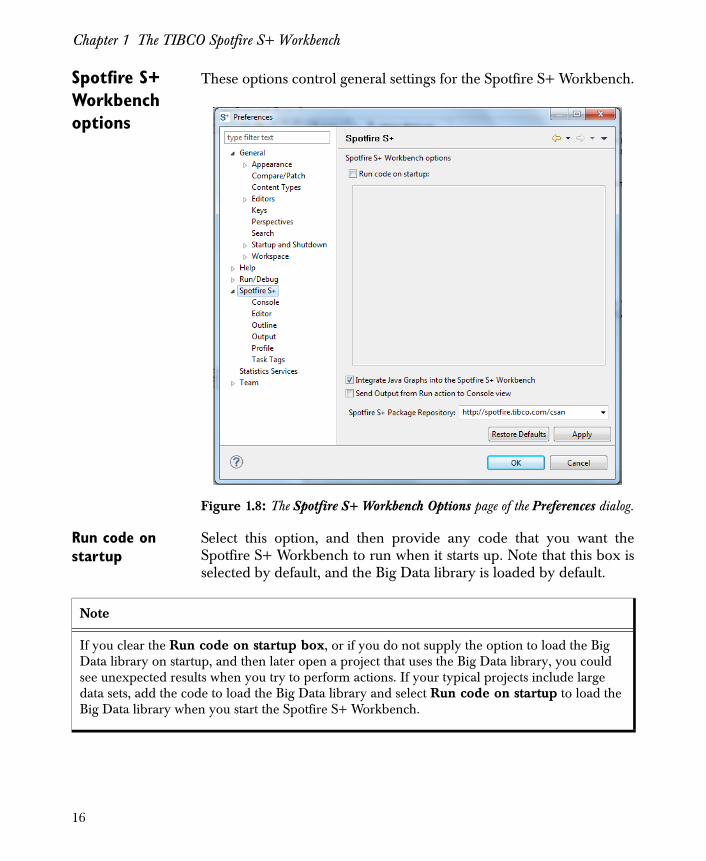
Integrate Java Graphs into the Spotfire S+ Workbench
This option is selected by default. Clear this option if you do not wantJava graphs embedded in the Spotfire S+ Workbench.
With this option selected, any Java graphs created as part of yourscript appear embedded in a view to the right of the folder containingthe console view by default.
Figure 1.9 shows the a Java graph from the Census sample, embeddedin the Spotfire S+ Workbench.
Send Output from Run Action to Console View
Select this option if you want script output to appear in the Consoleview, rather than in the Output view. This option is cleared bydefault: when you run code from the Script Editor, the Output viewopens and displays the results.
Note that output for code you type in the Console view alwaysappears in the Console view.
Note
java.graph is the default device for the Spotfire S+ Workbench.
Figure 1.9: Java graph embedded in the Spotfire S+ Workbench.
Note
If you have multiple graphs, and you want to display tabbed graph windows, you can set the option from the drop-down arrow in the Graph Window. Select Graph Options � Options, and in New Plot Action, select whether to delete, reuse, or add new pages.
Alternatively, you can set this option programmatically using the Spotfire S+ function java.new.plot.action. See its Help file for more information.
17
Chapter 1 The TIBCO Spotfire S+ Workbench
Spotfire S+ Package Repository
Change this option to specify another location for Spotfire S+packages. By default, this location is set to the CSAN Web site (http://spotfire.tibco.com/csan). The preference specified in thisbox populates the Repository contols in the Update Packages andFind Packages dialogs. (Selections in these dialog boxes also appearin the Spotfire S+ Package Repository drop-down list.)
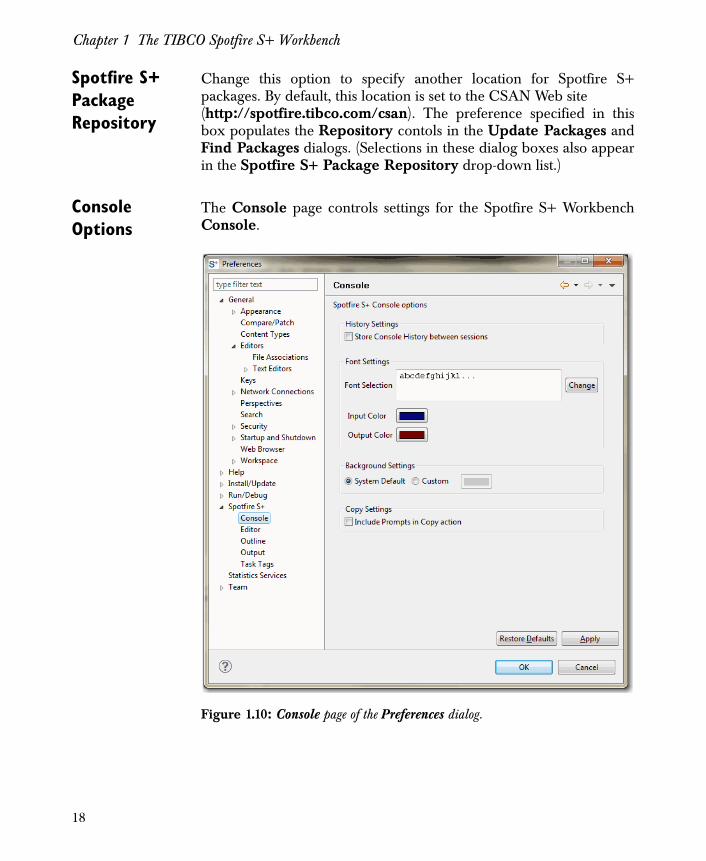
Console Options
The Console page controls settings for the Spotfire S+ WorkbenchConsole.
Figure 1.10: Console page of the Preferences dialog.
18
Examining Spotfire S+ Preferences
Store Console History Between Sessions
By default, this option is selected. It persists the commands you issuein the Console (which then appear in the History), between sessions.When you re-start the Spotfire S+ Workbench, click History todisplay the stored entries. Entries you select in the History thenappear in the Console. Also, you can scroll up and down in theHistory to display items in the Console. For more information aboutusing the History, see the section Examining the History on page165. For information about setting options for the Output view, seesection Output Options on page 24.
Font Settings By default, the Console displays input and output text using thedefault system font as blue and red, respectively. You can change boththe font and the color.
• To set the font, click Change, and then, in the Font dialog,select from Font, Font style, Size, and any additional fontproperties to use. Note that the font changes for both inputand the output displayed in the Console.
• To set a custom font color, click the Input Color or OutputColor button, and then, in the Color picker, select a color forthe input or output.
Background Settings
By default, the Spotfire S+ Console uses the system default. SelectCustom Color, and then click the color button to display the Colorpicker and choose a different background color.
Include Prompts in Copy action
Select if you want to include prompts (> and +) when you copy codefrom either the Console.
19
Chapter 1 The TIBCO Spotfire S+ Workbench
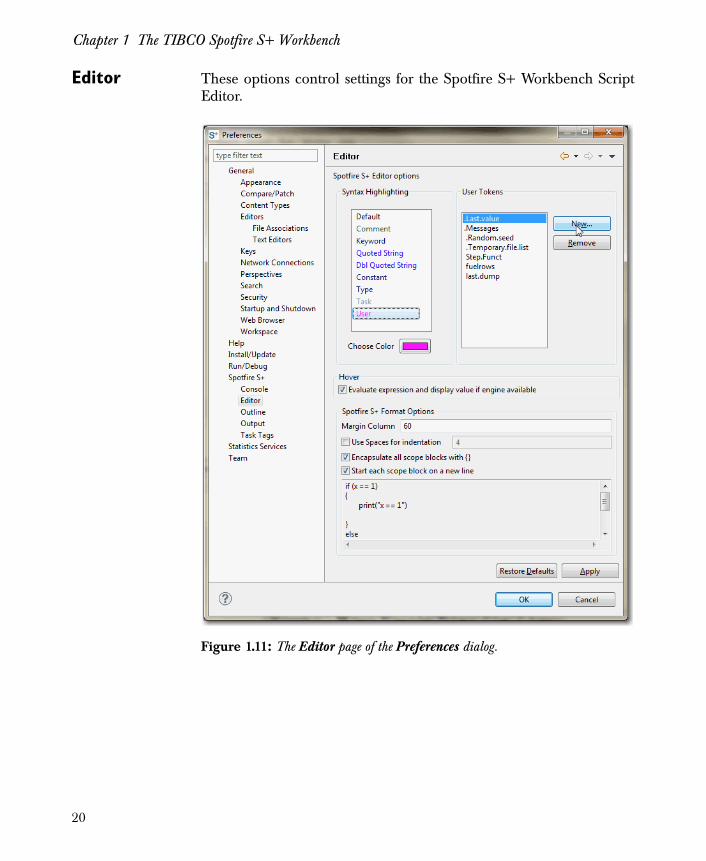
Editor These options control settings for the Spotfire S+ Workbench ScriptEditor.
Figure 1.11: The Editor page of the Preferences dialog.
20
Examining Spotfire S+ Preferences
Syntax Highlighting
Specifies the colors for text and defined syntax appearing in the ScriptEditor. To change the default color for any of the items listed, clickChoose Color and, from the color picker dialog, select a color.
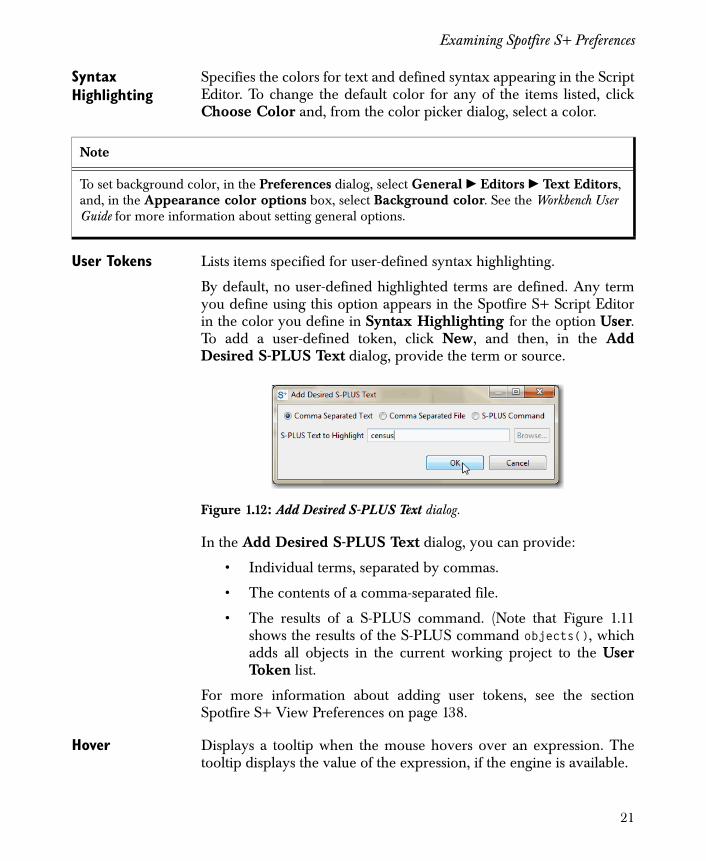
User Tokens Lists items specified for user-defined syntax highlighting.
By default, no user-defined highlighted terms are defined. Any termyou define using this option appears in the Spotfire S+ Script Editorin the color you define in Syntax Highlighting for the option User.To add a user-defined token, click New, and then, in the AddDesired S-PLUS Text dialog, provide the term or source.
In the Add Desired S-PLUS Text dialog, you can provide:
• Individual terms, separated by commas.
• The contents of a comma-separated file.
• The results of a S-PLUS command. (Note that Figure 1.11shows the results of the S-PLUS command objects(), whichadds all objects in the current working project to the UserToken list.
For more information about adding user tokens, see the sectionSpotfire S+ View Preferences on page 138.
Hover Displays a tooltip when the mouse hovers over an expression. Thetooltip displays the value of the expression, if the engine is available.
Note
To set background color, in the Preferences dialog, select General � Editors � Text Editors, and, in the Appearance color options box, select Background color. See the Workbench User Guide for more information about setting general options.
Figure 1.12: Add Desired S-PLUS Text dialog.
21
Chapter 1 The TIBCO Spotfire S+ Workbench
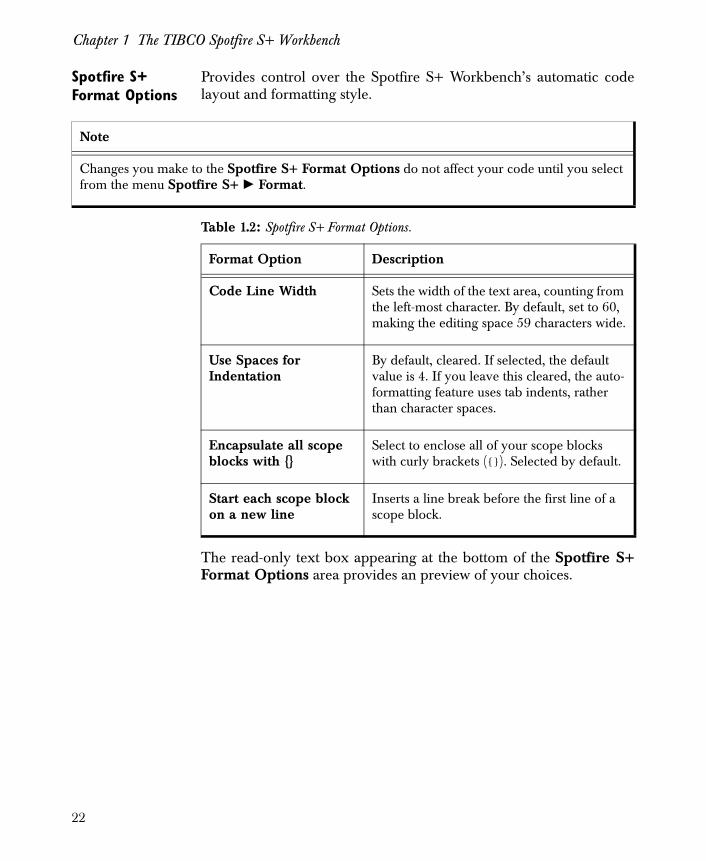
Spotfire S+ Format Options
Provides control over the Spotfire S+ Workbench’s automatic codelayout and formatting style.
The read-only text box appearing at the bottom of the Spotfire S+Format Options area provides an preview of your choices.
Note
Changes you make to the Spotfire S+ Format Options do not affect your code until you select from the menu Spotfire S+ � Format.
Table 1.2: Spotfire S+ Format Options.
Format Option Description
Code Line Width Sets the width of the text area, counting from the left-most character. By default, set to 60, making the editing space 59 characters wide.
Use Spaces for Indentation
By default, cleared. If selected, the default value is 4. If you leave this cleared, the auto-formatting feature uses tab indents, rather than character spaces.
Encapsulate all scope blocks with {}
Select to enclose all of your scope blocks with curly brackets ({}). Selected by default.
Start each scope block on a new line
Inserts a line break before the first line of a scope block.
22

Examining Spotfire S+ Preferences
Outline Options
Lists the options to display anonymous functions and functions towatch.
Show Anonymous Functions in Outline
By default, the Spotfire S+ Script Editor shows anonymous functionsin the outline.
Functions to Watch
Contains a predefined list of Spotfire S+ functions to identify in theOutline view. You can add your own functions to this list using theNew button. You can also remove functions from the list or reorderthe list.
Figure 1.13: The Outline page of the Preferences dialog.
23
Chapter 1 The TIBCO Spotfire S+ Workbench
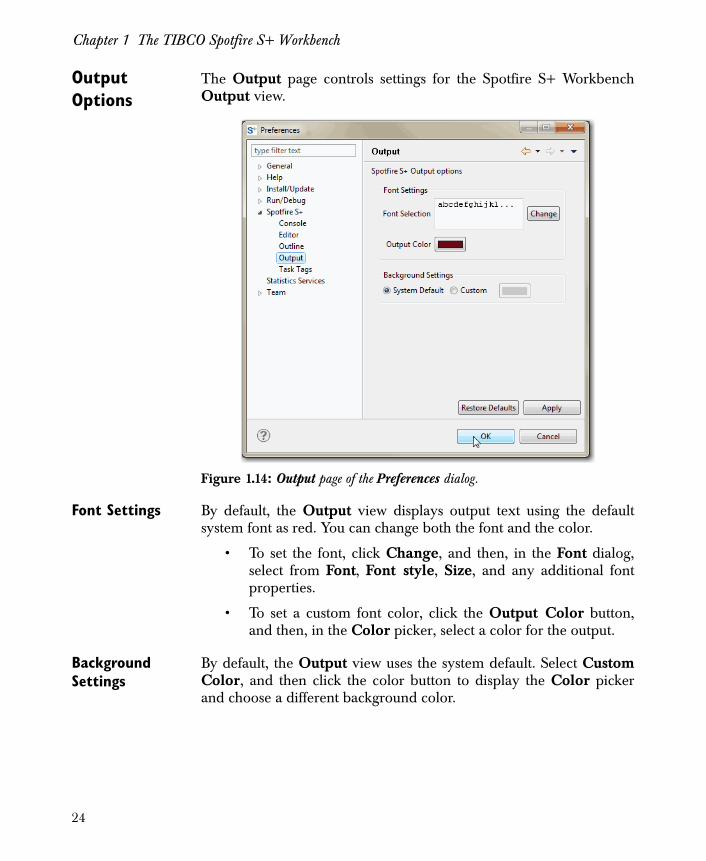
Output Options
The Output page controls settings for the Spotfire S+ WorkbenchOutput view.
Font Settings By default, the Output view displays output text using the defaultsystem font as red. You can change both the font and the color.
• To set the font, click Change, and then, in the Font dialog,select from Font, Font style, Size, and any additional fontproperties.
• To set a custom font color, click the Output Color button,and then, in the Color picker, select a color for the output.
Background Settings
By default, the Output view uses the system default. Select CustomColor, and then click the color button to display the Color pickerand choose a different background color.
Figure 1.14: Output page of the Preferences dialog.
24
Examining Spotfire S+ Preferences
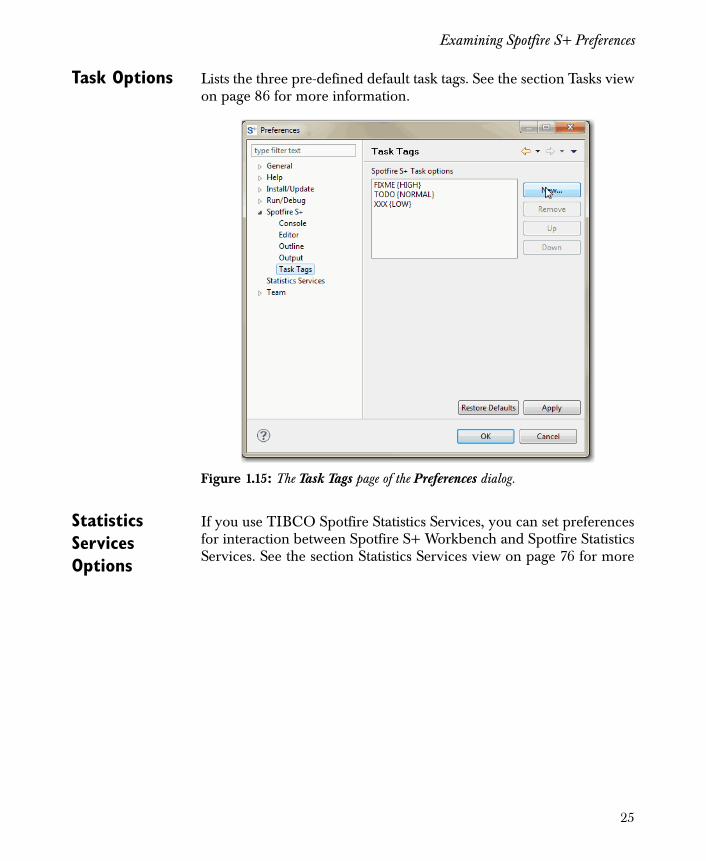
Task Options Lists the three pre-defined default task tags. See the section Tasks viewon page 86 for more information.
Statistics Services Options
If you use TIBCO Spotfire Statistics Services, you can set preferencesfor interaction between Spotfire S+ Workbench and Spotfire StatisticsServices. See the section Statistics Services view on page 76 for more
Figure 1.15: The Task Tags page of the Preferences dialog.
25
Chapter 1 The TIBCO Spotfire S+ Workbench
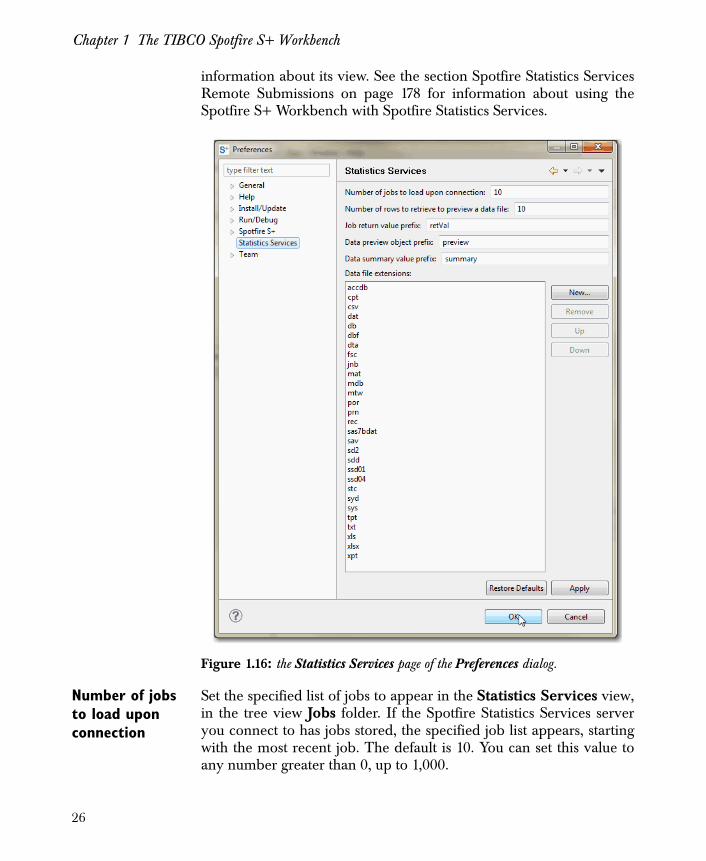
information about its view. See the section Spotfire Statistics ServicesRemote Submissions on page 178 for information about using theSpotfire S+ Workbench with Spotfire Statistics Services.
Number of jobs to load upon connection
Set the specified list of jobs to appear in the Statistics Services view,in the tree view Jobs folder. If the Spotfire Statistics Services serveryou connect to has jobs stored, the specified job list appears, startingwith the most recent job. The default is 10. You can set this value toany number greater than 0, up to 1,000.
Figure 1.16: the Statistics Services page of the Preferences dialog.
26
Examining Spotfire S+ Preferences
• If you set it to 0, the default of 10 is used.
• If you specify a number larger than 1,000 or a non-numericcharacter, the dialog displays an “Invalid field value” errorand the text box turns yellow. If the error text contains anellipsis (...), the message is truncated. Widen the dialog box todisplay the entire message.
• If you change this number while you are connected to theSpotfire Statistics Services computer, the display does notchange until you disconnect and reconnect.
• If you run jobs in excess of this number, all jobs are displayeduntil you disconnect and reconnect.
• If you delete jobs from the list, any earlier existing jobs areappended to the list, up to the maximum number of availablejobs or the specified number.
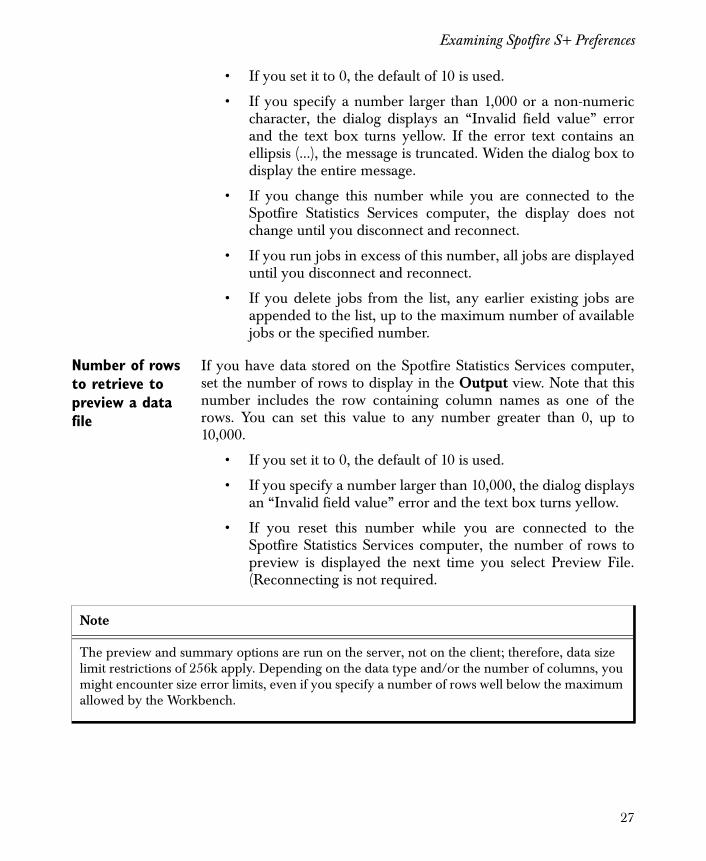
Number of rows to retrieve to preview a data file
If you have data stored on the Spotfire Statistics Services computer,set the number of rows to display in the Output view. Note that thisnumber includes the row containing column names as one of therows. You can set this value to any number greater than 0, up to10,000.
• If you set it to 0, the default of 10 is used.
• If you specify a number larger than 10,000, the dialog displaysan “Invalid field value” error and the text box turns yellow.
• If you reset this number while you are connected to theSpotfire Statistics Services computer, the number of rows topreview is displayed the next time you select Preview File.(Reconnecting is not required.
Note
The preview and summary options are run on the server, not on the client; therefore, data size limit restrictions of 256k apply. Depending on the data type and/or the number of columns, you might encounter size error limits, even if you specify a number of rows well below the maximum allowed by the Workbench.
27
Chapter 1 The TIBCO Spotfire S+ Workbench
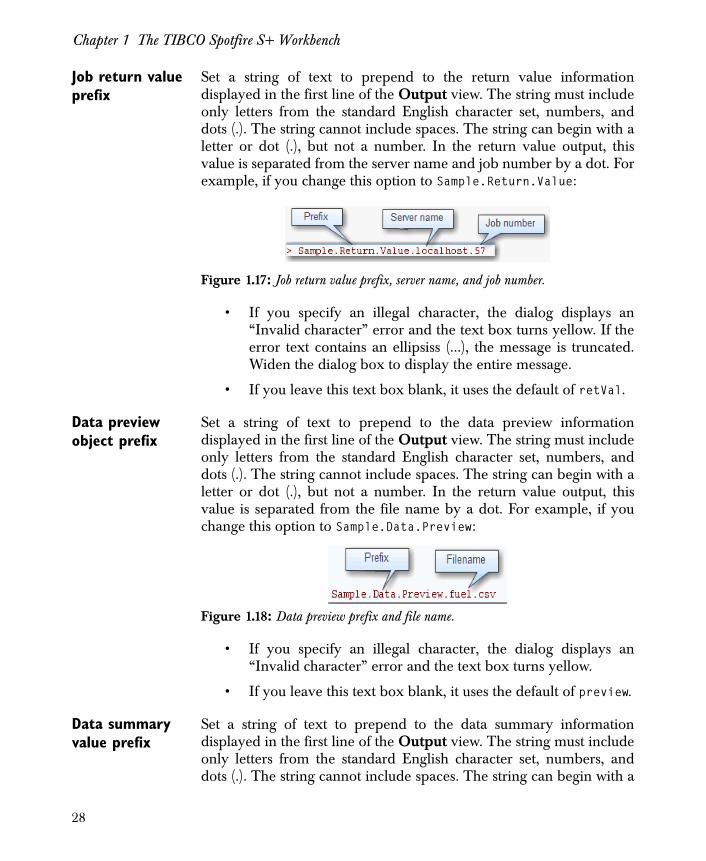
Job return value prefix
Set a string of text to prepend to the return value informationdisplayed in the first line of the Output view. The string must includeonly letters from the standard English character set, numbers, anddots (.). The string cannot include spaces. The string can begin with aletter or dot (.), but not a number. In the return value output, thisvalue is separated from the server name and job number by a dot. Forexample, if you change this option to Sample.Return.Value:
• If you specify an illegal character, the dialog displays an“Invalid character” error and the text box turns yellow. If theerror text contains an ellipsiss (...), the message is truncated.Widen the dialog box to display the entire message.
• If you leave this text box blank, it uses the default of retVal.
Data preview object prefix
Set a string of text to prepend to the data preview informationdisplayed in the first line of the Output view. The string must includeonly letters from the standard English character set, numbers, anddots (.). The string cannot include spaces. The string can begin with aletter or dot (.), but not a number. In the return value output, thisvalue is separated from the file name by a dot. For example, if youchange this option to Sample.Data.Preview:
• If you specify an illegal character, the dialog displays an“Invalid character” error and the text box turns yellow.
• If you leave this text box blank, it uses the default of preview.
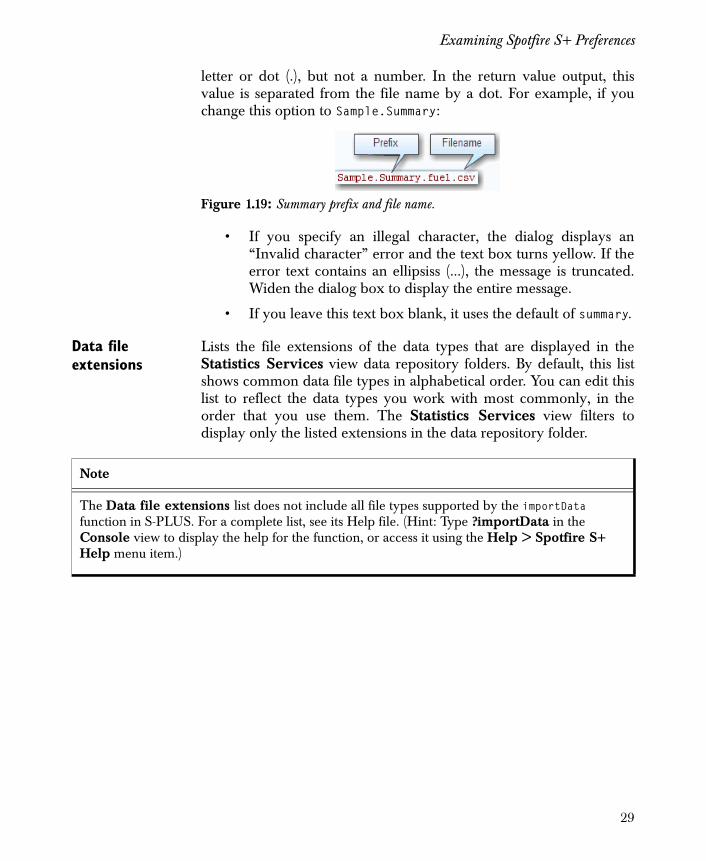
Data summary value prefix
Set a string of text to prepend to the data summary informationdisplayed in the first line of the Output view. The string must includeonly letters from the standard English character set, numbers, anddots (.). The string cannot include spaces. The string can begin with a
Figure 1.17: Job return value prefix, server name, and job number.
Figure 1.18: Data preview prefix and file name.
28
Examining Spotfire S+ Preferences
letter or dot (.), but not a number. In the return value output, thisvalue is separated from the file name by a dot. For example, if youchange this option to Sample.Summary:
• If you specify an illegal character, the dialog displays an“Invalid character” error and the text box turns yellow. If theerror text contains an ellipsiss (...), the message is truncated.Widen the dialog box to display the entire message.
• If you leave this text box blank, it uses the default of summary.
Data file extensions
Lists the file extensions of the data types that are displayed in theStatistics Services view data repository folders. By default, this listshows common data file types in alphabetical order. You can edit thislist to reflect the data types you work with most commonly, in theorder that you use them. The Statistics Services view filters todisplay only the listed extensions in the data repository folder.
Figure 1.19: Summary prefix and file name.
Note
The Data file extensions list does not include all file types supported by the importData function in S-PLUS. For a complete list, see its Help file. (Hint: Type ?importData in the Console view to display the help for the function, or access it using the Help > Spotfire S+ Help menu item.)
29
Chapter 1 The TIBCO Spotfire S+ Workbench
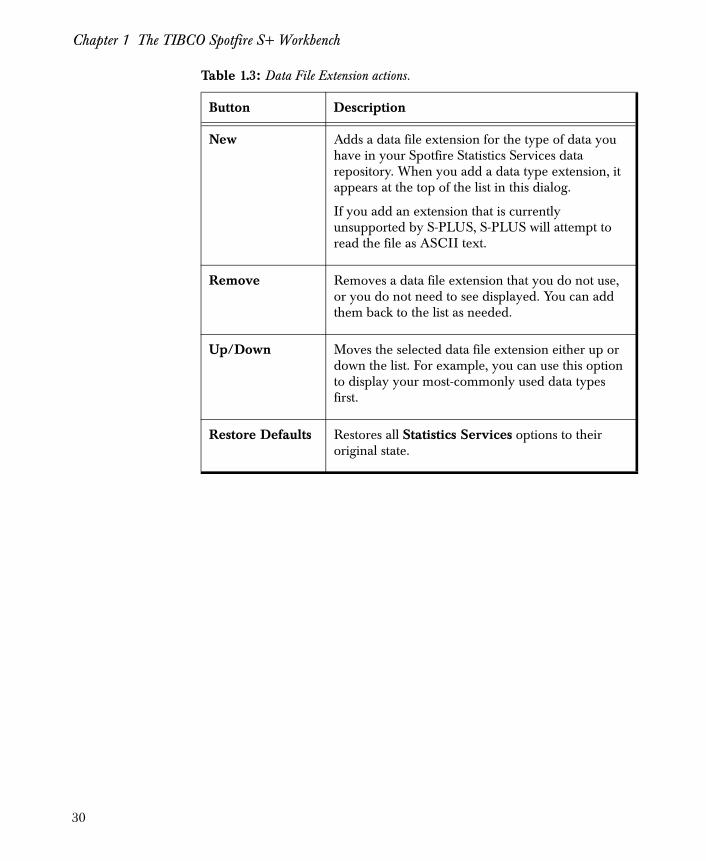
Table 1.3: Data File Extension actions.
Button Description
New Adds a data file extension for the type of data you have in your Spotfire Statistics Services data repository. When you add a data type extension, it appears at the top of the list in this dialog.
If you add an extension that is currently unsupported by S-PLUS, S-PLUS will attempt to read the file as ASCII text.
Remove Removes a data file extension that you do not use, or you do not need to see displayed. You can add them back to the list as needed.
Up/Down Moves the selected data file extension either up or down the list. For example, you can use this option to display your most-commonly used data types first.
Restore Defaults Restores all Statistics Services options to their original state.
30
Examining the Spotfire S+ Workbench GUI
EXAMINING THE SPOTFIRE S+ WORKBENCH GUI
After the Spotfire S+ Workbench GUI opens, and you setpreferences, spend a moment examining the user interface, includingthe toolbars, menus, perspectives, and views.
• For more information about perspectives, see the sectionSpotfire S+ Workbench Perspectives and Views on page 42.
• For more information about views, see the section Examiningthe Views on page 43.
Spotfire S+ New Project Wizard
When you start a new Spotfire S+ project in the Spotfire S+Workbench, you see the New Project wizard, where you specify thelocation of your project files. See the section Quick Start on page 127for more information about specifying the project file location.
Working with Files External to the Project
You can use the Eclipse editor to edit non-project files in the SpotfireS+ Workbench. To open a non-project file, on the File menu, clickOpen File, and then browse to the location of the file to edit. Formore information about editing files in Eclipse, see the EclipseWorkbench User Guide.
Customized Menus, Toolbars, and Dialogs
The Spotfire S+ Workbench includes in the Eclipse GUI:
• Customized top-level menu items.
• Customized top-level toolbar.
• Customized view-specific toolbars and view menus. (See thesection Control and Right-Click Menus on page 46 for moreinformation about the menus.)
Customized menus
Spotfire S+ customizes the basic Eclipse menu to provide easy accessto global Spotfire S+ control and to control debugging options.
31
Chapter 1 The TIBCO Spotfire S+ Workbench
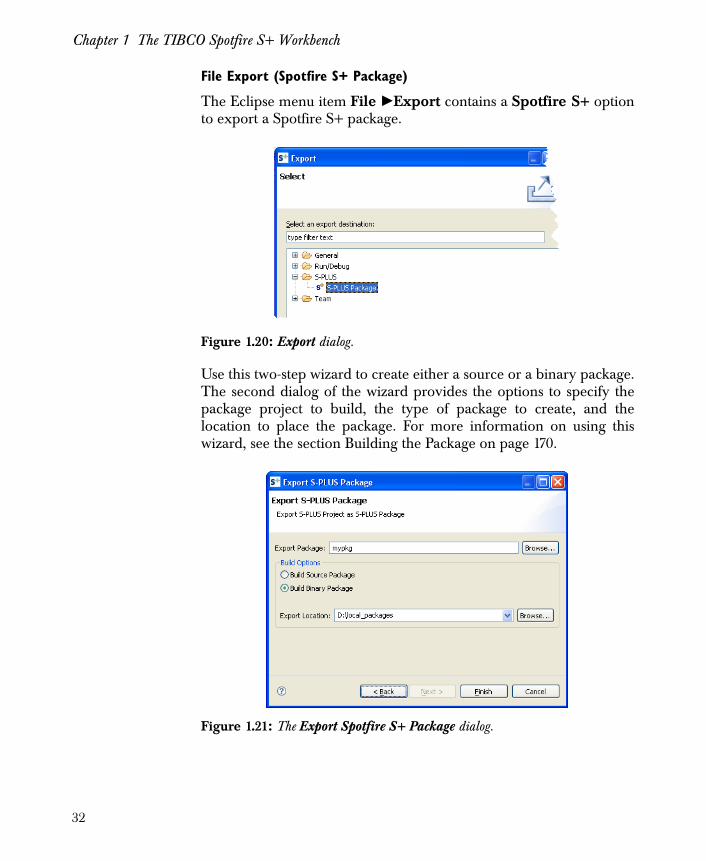
File Export (Spotfire S+ Package)
The Eclipse menu item File �Export contains a Spotfire S+ optionto export a Spotfire S+ package.
Use this two-step wizard to create either a source or a binary package.The second dialog of the wizard provides the options to specify thepackage project to build, the type of package to create, and thelocation to place the package. For more information on using thiswizard, see the section Building the Package on page 170.
Figure 1.20: Export dialog.
Figure 1.21: The Export Spotfire S+ Package dialog.
32
Examining the Spotfire S+ Workbench GUI
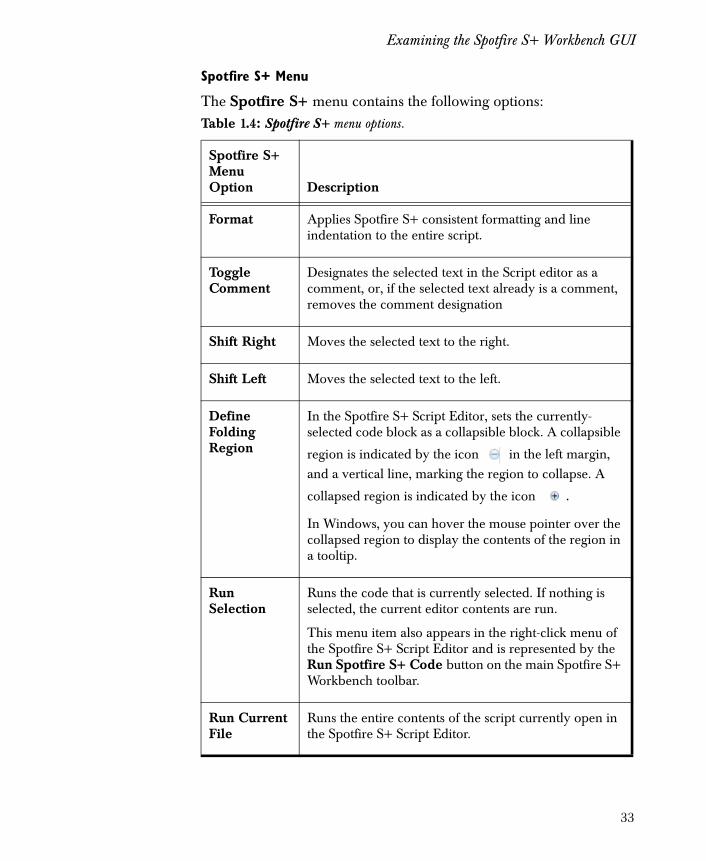
Spotfire S+ Menu
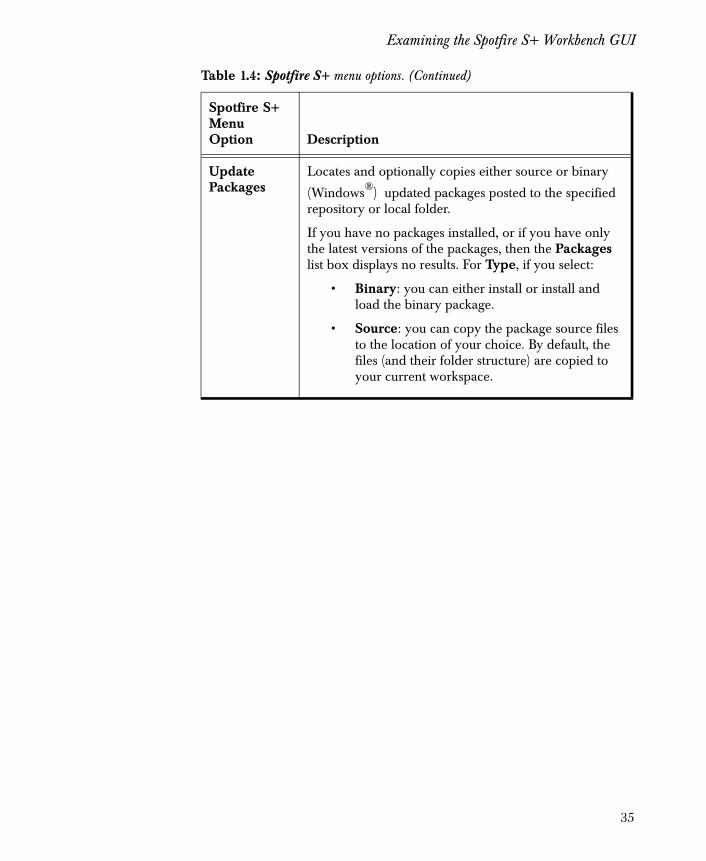
The Spotfire S+ menu contains the following options:Table 1.4: Spotfire S+ menu options.
Spotfire S+ Menu Option Description
Format Applies Spotfire S+ consistent formatting and line indentation to the entire script.
Toggle Comment
Designates the selected text in the Script editor as a comment, or, if the selected text already is a comment, removes the comment designation
Shift Right Moves the selected text to the right.
Shift Left Moves the selected text to the left.
Define Folding Region
In the Spotfire S+ Script Editor, sets the currently-selected code block as a collapsible block. A collapsible
region is indicated by the icon in the left margin, and a vertical line, marking the region to collapse. A
collapsed region is indicated by the icon .
In Windows, you can hover the mouse pointer over the collapsed region to display the contents of the region in a tooltip.
Run Selection
Runs the code that is currently selected. If nothing is selected, the current editor contents are run.
This menu item also appears in the right-click menu of the Spotfire S+ Script Editor and is represented by the Run Spotfire S+ Code button on the main Spotfire S+ Workbench toolbar.
Run Current File
Runs the entire contents of the script currently open in the Spotfire S+ Script Editor.
33
Chapter 1 The TIBCO Spotfire S+ Workbench
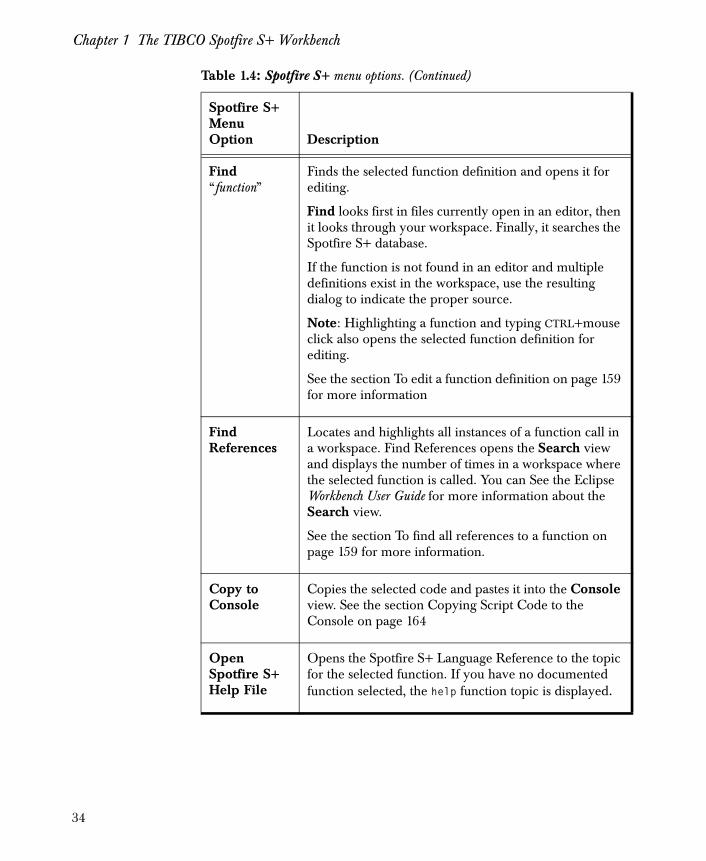
Find “function”
Finds the selected function definition and opens it for editing.
Find looks first in files currently open in an editor, then it looks through your workspace. Finally, it searches the Spotfire S+ database.
If the function is not found in an editor and multiple definitions exist in the workspace, use the resulting dialog to indicate the proper source.
Note: Highlighting a function and typing CTRL+mouse click also opens the selected function definition for editing.
See the section To edit a function definition on page 159 for more information
Find References
Locates and highlights all instances of a function call in a workspace. Find References opens the Search view and displays the number of times in a workspace where the selected function is called. You can See the Eclipse Workbench User Guide for more information about the Search view.
See the section To find all references to a function on page 159 for more information.
Copy to Console
Copies the selected code and pastes it into the Console view. See the section Copying Script Code to the Console on page 164
Open Spotfire S+ Help File
Opens the Spotfire S+ Language Reference to the topic for the selected function. If you have no documented function selected, the help function topic is displayed.
Table 1.4: Spotfire S+ menu options. (Continued)
Spotfire S+ Menu Option Description
34
Examining the Spotfire S+ Workbench GUI
Update Packages
Locates and optionally copies either source or binary
(Windows®) updated packages posted to the specified repository or local folder.
If you have no packages installed, or if you have only the latest versions of the packages, then the Packages list box displays no results. For Type, if you select:
• Binary: you can either install or install and load the binary package.
• Source: you can copy the package source files to the location of your choice. By default, the files (and their folder structure) are copied to your current workspace.
Table 1.4: Spotfire S+ menu options. (Continued)
Spotfire S+ Menu Option Description
35
Chapter 1 The TIBCO Spotfire S+ Workbench
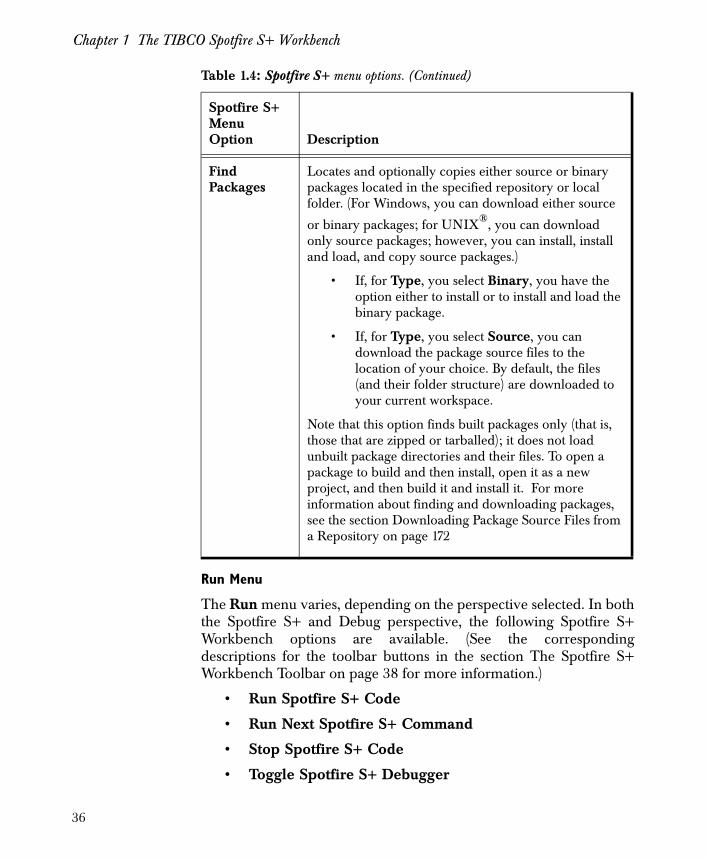
Run Menu
The Run menu varies, depending on the perspective selected. In boththe Spotfire S+ and Debug perspective, the following Spotfire S+Workbench options are available. (See the correspondingdescriptions for the toolbar buttons in the section The Spotfire S+Workbench Toolbar on page 38 for more information.)
• Run Spotfire S+ Code
• Run Next Spotfire S+ Command
• Stop Spotfire S+ Code
• Toggle Spotfire S+ Debugger
Find Packages
Locates and optionally copies either source or binary packages located in the specified repository or local folder. (For Windows, you can download either source
or binary packages; for UNIX®, you can download only source packages; however, you can install, install and load, and copy source packages.)
• If, for Type, you select Binary, you have the option either to install or to install and load the binary package.
• If, for Type, you select Source, you can download the package source files to the location of your choice. By default, the files (and their folder structure) are downloaded to your current workspace.
Note that this option finds built packages only (that is, those that are zipped or tarballed); it does not load unbuilt package directories and their files. To open a package to build and then install, open it as a new project, and then build it and install it. For more information about finding and downloading packages, see the section Downloading Package Source Files from a Repository on page 172
Table 1.4: Spotfire S+ menu options. (Continued)
Spotfire S+ Menu Option Description
36
Examining the Spotfire S+ Workbench GUI
• Toggle Spotfire S+ Profiler
• Toggle Spotfire S+ Warning Breakpoint
• Toggle Spotfire S+ Error Breakpoint
For more information about the Run menu options available only inthe Debug perspective, see the section Debug Run Menu Options onpage 94.
Window Menu
The Spotfire S+ Workbench preferences are available from theWindow � Preferences menu option. See the section ExaminingSpotfire S+ Preferences on page 14 for more information.
Help Menu
Reference help, conceptual help, books, and user-interface guidanceare available from the Help menu.
• Click Spotfire S+ Help from the Help menu to display theSpotfire S+ Language Reference topic for the help function.
• Click Spotfire S+ Manuals for a list of the PDFs that areinstalled by default with your Spotfire S+ installation.
Customized Toolbars
Both Spotfire S+ perspectives in the Workbench providecustomizations to the Eclipse toolbar and to view-specific toolbars.
37
Chapter 1 The TIBCO Spotfire S+ Workbench
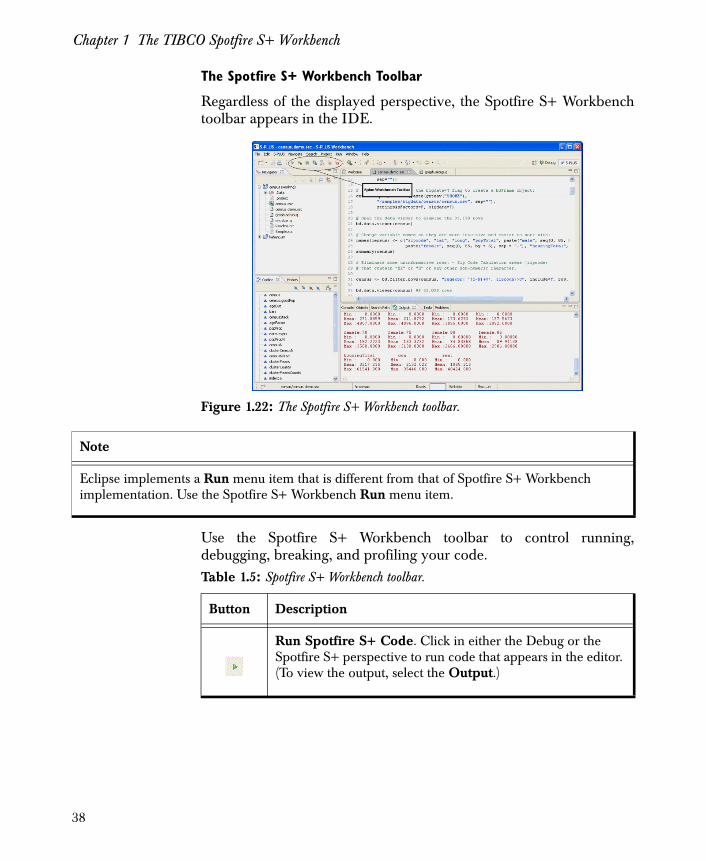
The Spotfire S+ Workbench Toolbar
Regardless of the displayed perspective, the Spotfire S+ Workbenchtoolbar appears in the IDE.
Use the Spotfire S+ Workbench toolbar to control running,debugging, breaking, and profiling your code.
Figure 1.22: The Spotfire S+ Workbench toolbar.
Note
Eclipse implements a Run menu item that is different from that of Spotfire S+ Workbench implementation. Use the Spotfire S+ Workbench Run menu item.
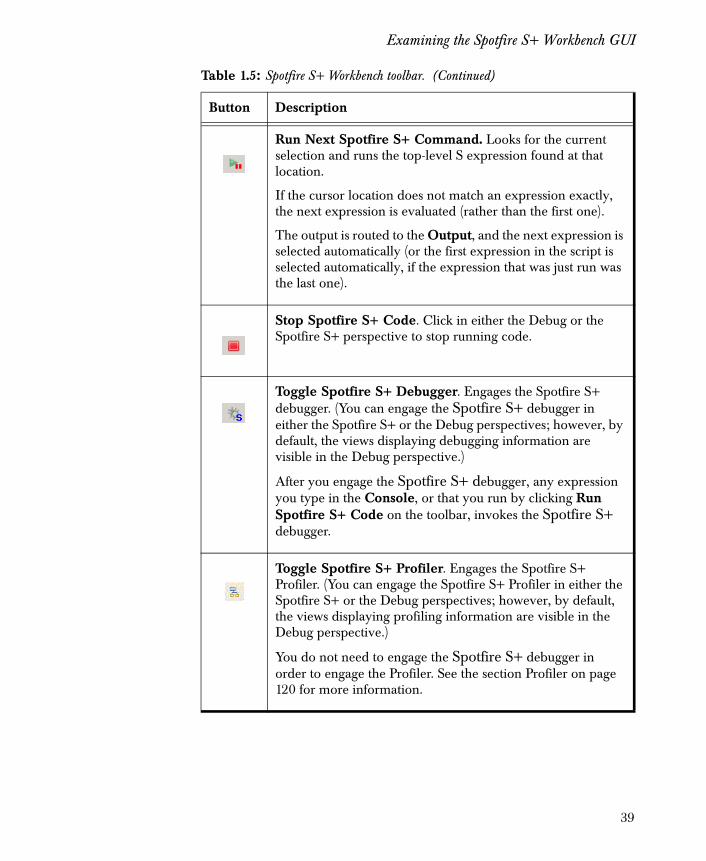
Table 1.5: Spotfire S+ Workbench toolbar.
Button Description
Run Spotfire S+ Code. Click in either the Debug or the Spotfire S+ perspective to run code that appears in the editor. (To view the output, select the Output.)
38
Examining the Spotfire S+ Workbench GUI
Run Next Spotfire S+ Command. Looks for the current selection and runs the top-level S expression found at that location.
If the cursor location does not match an expression exactly, the next expression is evaluated (rather than the first one).
The output is routed to the Output, and the next expression is selected automatically (or the first expression in the script is selected automatically, if the expression that was just run was the last one).
Stop Spotfire S+ Code. Click in either the Debug or the Spotfire S+ perspective to stop running code.
Toggle Spotfire S+ Debugger. Engages the Spotfire S+ debugger. (You can engage the Spotfire S+ debugger in either the Spotfire S+ or the Debug perspectives; however, by default, the views displaying debugging information are visible in the Debug perspective.)
After you engage the Spotfire S+ debugger, any expression you type in the Console, or that you run by clicking Run Spotfire S+ Code on the toolbar, invokes the Spotfire S+ debugger.
Toggle Spotfire S+ Profiler. Engages the Spotfire S+ Profiler. (You can engage the Spotfire S+ Profiler in either the Spotfire S+ or the Debug perspectives; however, by default, the views displaying profiling information are visible in the Debug perspective.)
You do not need to engage the Spotfire S+ debugger in order to engage the Profiler. See the section Profiler on page 120 for more information.
Table 1.5: Spotfire S+ Workbench toolbar. (Continued)
Button Description
39
Chapter 1 The TIBCO Spotfire S+ Workbench
View toolbars
For more information about individual views’ toolbars, see theindividual views’ descriptions. See the section Examining the Viewson page 43 for more information.
Spotfire S+ Workbench Status Bar
The Workbench features a status bar that provides importantinformation about the working project and the current view.
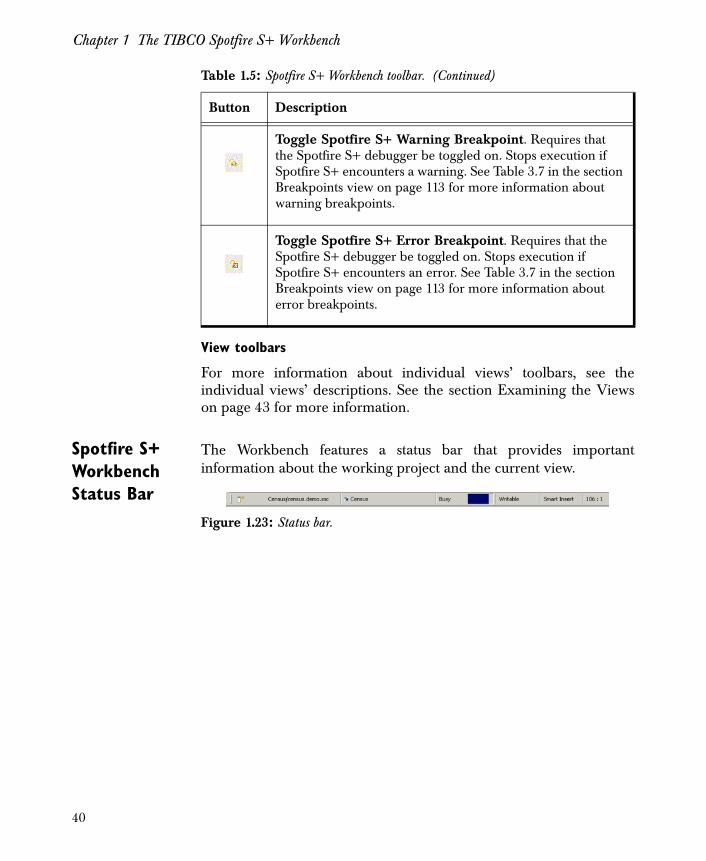
Toggle Spotfire S+ Warning Breakpoint. Requires that the Spotfire S+ debugger be toggled on. Stops execution if Spotfire S+ encounters a warning. See Table 3.7 in the section Breakpoints view on page 113 for more information about warning breakpoints.
Toggle Spotfire S+ Error Breakpoint. Requires that the Spotfire S+ debugger be toggled on. Stops execution if Spotfire S+ encounters an error. See Table 3.7 in the section Breakpoints view on page 113 for more information about error breakpoints.
Table 1.5: Spotfire S+ Workbench toolbar. (Continued)
Button Description
Figure 1.23: Status bar.
40
Examining the Spotfire S+ Workbench GUI
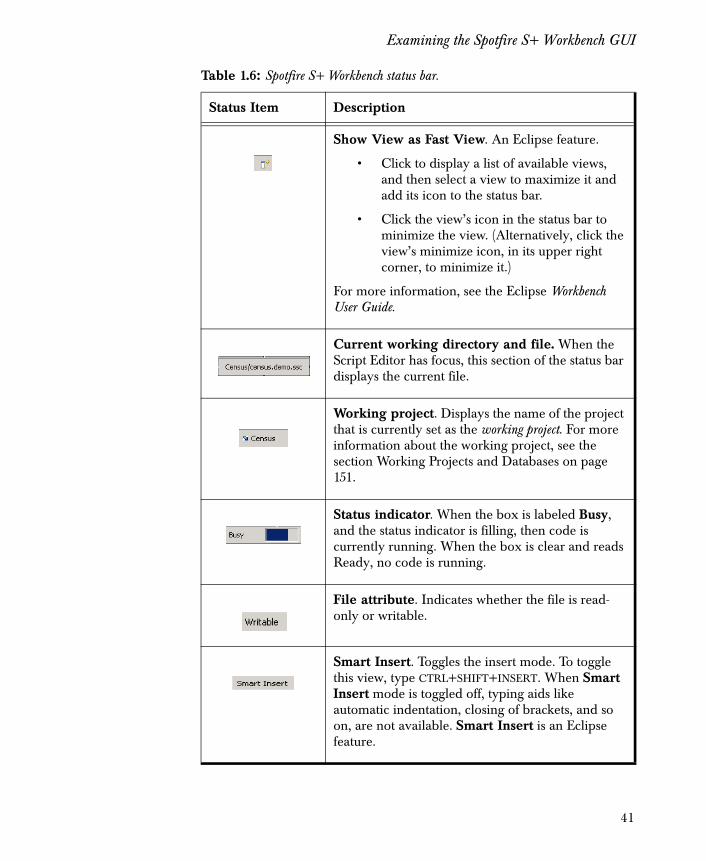
Table 1.6: Spotfire S+ Workbench status bar.
Status Item Description
Show View as Fast View. An Eclipse feature.
• Click to display a list of available views, and then select a view to maximize it and add its icon to the status bar.
• Click the view’s icon in the status bar to minimize the view. (Alternatively, click the view’s minimize icon, in its upper right corner, to minimize it.)
For more information, see the Eclipse Workbench User Guide.
Current working directory and file. When the Script Editor has focus, this section of the status bar displays the current file.
Working project. Displays the name of the project that is currently set as the working project. For more information about the working project, see the section Working Projects and Databases on page 151.
Status indicator. When the box is labeled Busy, and the status indicator is filling, then code is currently running. When the box is clear and reads Ready, no code is running.
File attribute. Indicates whether the file is read-only or writable.
Smart Insert. Toggles the insert mode. To toggle this view, type CTRL+SHIFT+INSERT. When Smart Insert mode is toggled off, typing aids like automatic indentation, closing of brackets, and so on, are not available. Smart Insert is an Eclipse feature.
41
Chapter 1 The TIBCO Spotfire S+ Workbench
Spotfire S+ Workbench Perspectives and Views
The Spotfire S+ Workbench plug-in for Eclipse includes twocustomized perspectives:
• The Spotfire S+ perspective
• The Debug perspective.
(See Table 1.1 for a short description of the perspectives.) By default,each perspective includes Eclipse views and customized Spotfire S+Workbench views.
Changing the Spotfire S+ Workbench Perspective
You can change the perspective to suit your development style bymoving, hiding, or closing views. For more information aboutcustomizing the views within the perspective, see the sectionCustomizing the Spotfire S+ Perspective Views on page 69. Forpractice exercises customizing the perspective, see the sectionCustomized Perspective Views on page 148.
• To customize the default Spotfire S+ perspective, on themenu, click Window � Customize Perspective. TheCustomize Perspective dialog has two pages: Shortcuts andCommands. Each of these pages describes global changesyou can make to the perspective.
• To save a changed perspective, click Window � SavePerspective As.
• To restore an unsaved perspective’s default settings, clickWindow � Reset Perspective.
• To open another perspective, click Window � OpenPerspective, and then select a perspective from the SelectPerspective dialog.
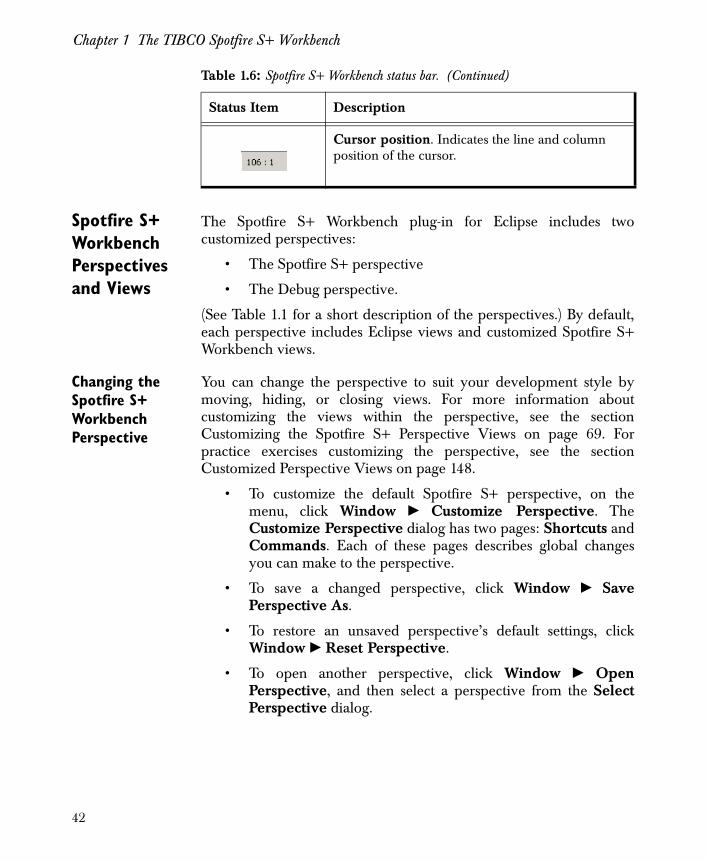
Cursor position. Indicates the line and column position of the cursor.
Table 1.6: Spotfire S+ Workbench status bar. (Continued)
Status Item Description
42
Examining the Spotfire S+ Workbench GUI
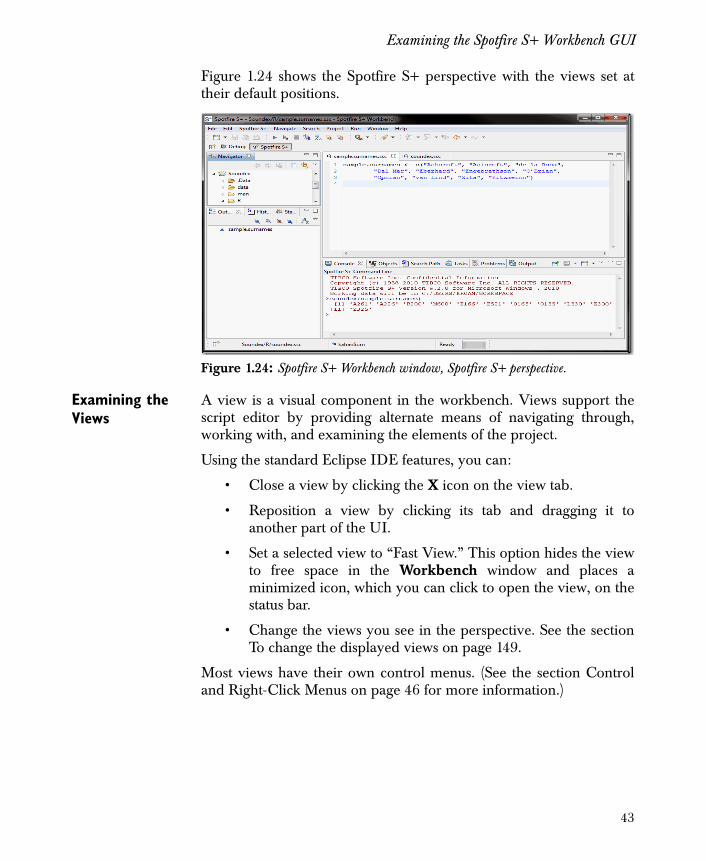
Figure 1.24 shows the Spotfire S+ perspective with the views set attheir default positions.
Examining the Views
A view is a visual component in the workbench. Views support thescript editor by providing alternate means of navigating through,working with, and examining the elements of the project.
Using the standard Eclipse IDE features, you can:
• Close a view by clicking the X icon on the view tab.
• Reposition a view by clicking its tab and dragging it toanother part of the UI.
• Set a selected view to “Fast View.” This option hides the viewto free space in the Workbench window and places aminimized icon, which you can click to open the view, on thestatus bar.
• Change the views you see in the perspective. See the sectionTo change the displayed views on page 149.
Most views have their own control menus. (See the section Controland Right-Click Menus on page 46 for more information.)
Figure 1.24: Spotfire S+ Workbench window, Spotfire S+ perspective.
43
Chapter 1 The TIBCO Spotfire S+ Workbench
Saving views items changed in views
When you modify an item in a view, it is saved immediately.Normally, only one instance of a particular type of view can exist inthe Workbench window.
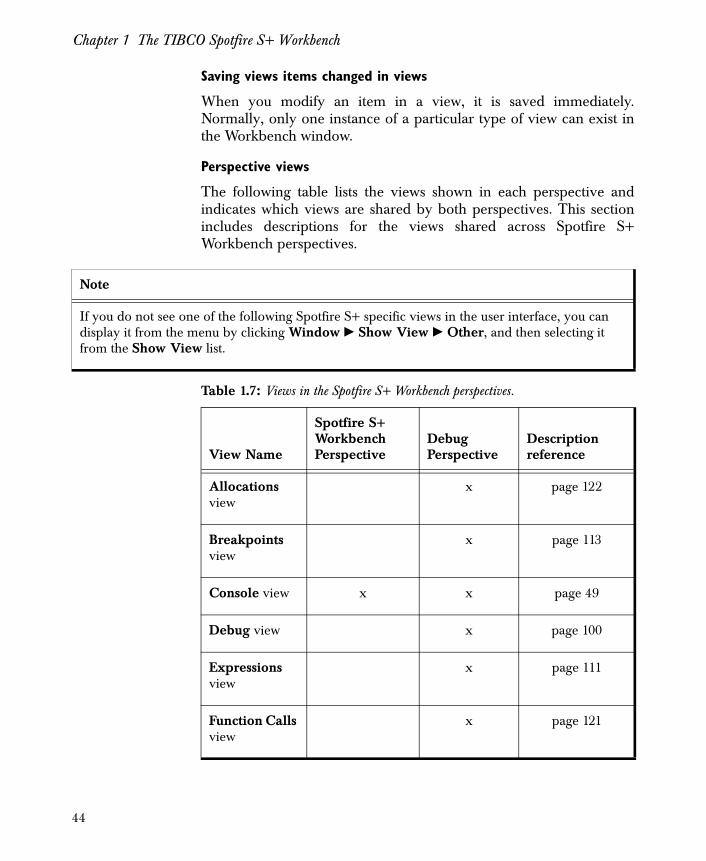
Perspective views
The following table lists the views shown in each perspective andindicates which views are shared by both perspectives. This sectionincludes descriptions for the views shared across Spotfire S+Workbench perspectives.
Note
If you do not see one of the following Spotfire S+ specific views in the user interface, you can display it from the menu by clicking Window � Show View � Other, and then selecting it from the Show View list.
Table 1.7: Views in the Spotfire S+ Workbench perspectives.
View Name
Spotfire S+ Workbench Perspective
Debug Perspective
Description reference
Allocations view
x page 122
Breakpoints view
x page 113
Console view x x page 49
Debug view x page 100
Expressions view
x page 111
Function Calls view
x page 121
44
Examining the Spotfire S+ Workbench GUI
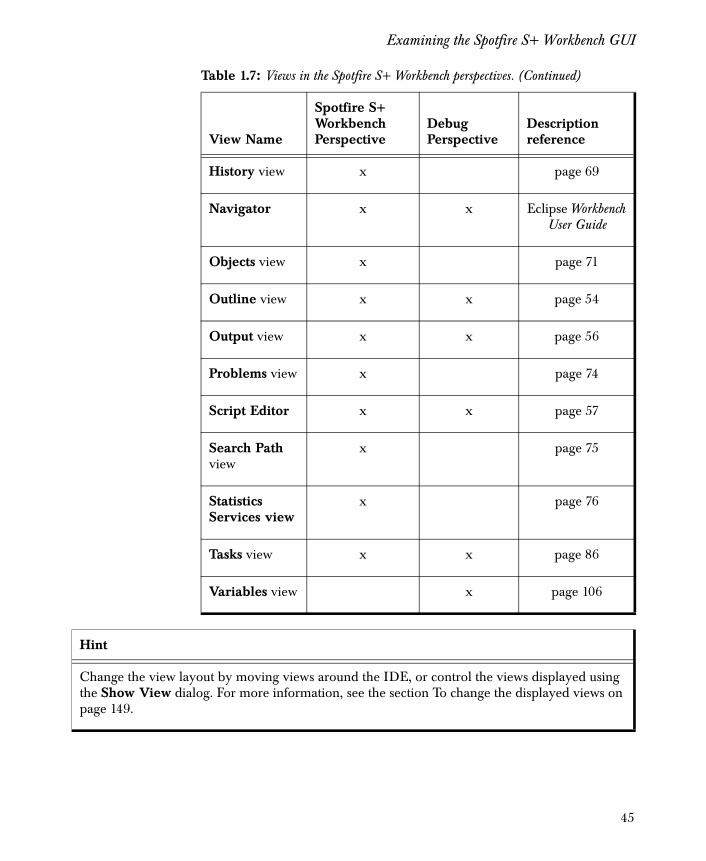
History view x page 69
Navigator x x Eclipse Workbench User Guide
Objects view x page 71
Outline view x x page 54
Output view x x page 56
Problems view x page 74
Script Editor x x page 57
Search Path view
x page 75
Statistics Services view
x page 76
Tasks view x x page 86
Variables view x page 106
Table 1.7: Views in the Spotfire S+ Workbench perspectives. (Continued)
View Name
Spotfire S+ Workbench Perspective
Debug Perspective
Description reference
Hint
Change the view layout by moving views around the IDE, or control the views displayed using the Show View dialog. For more information, see the section To change the displayed views on page 149.
45
Chapter 1 The TIBCO Spotfire S+ Workbench
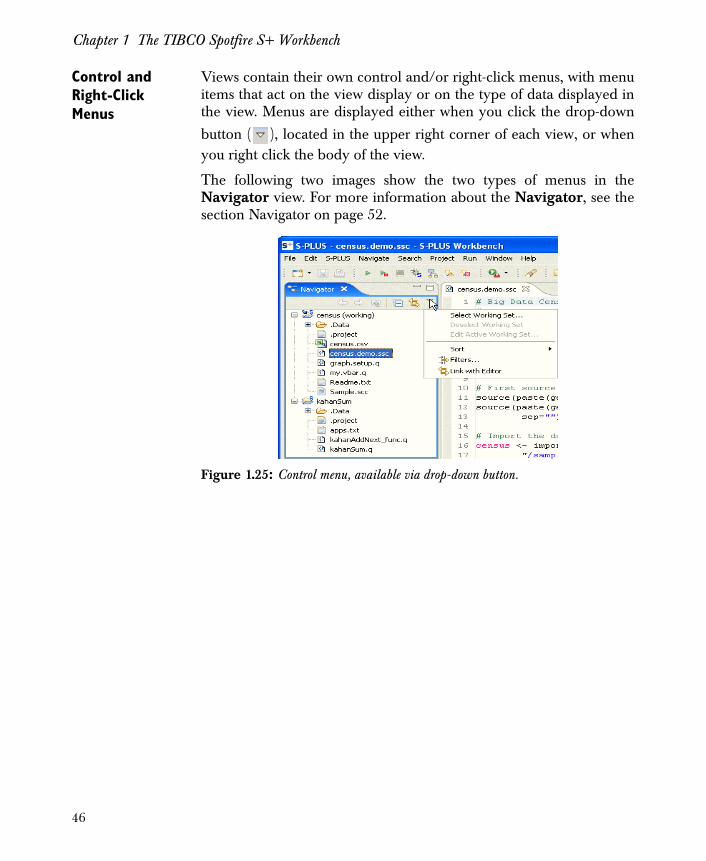
Control and Right-Click Menus
Views contain their own control and/or right-click menus, with menuitems that act on the view display or on the type of data displayed inthe view. Menus are displayed either when you click the drop-down
button ( ), located in the upper right corner of each view, or whenyou right click the body of the view.
The following two images show the two types of menus in theNavigator view. For more information about the Navigator, see thesection Navigator on page 52.
Figure 1.25: Control menu, available via drop-down button.
46
Examining the Spotfire S+ Workbench GUI
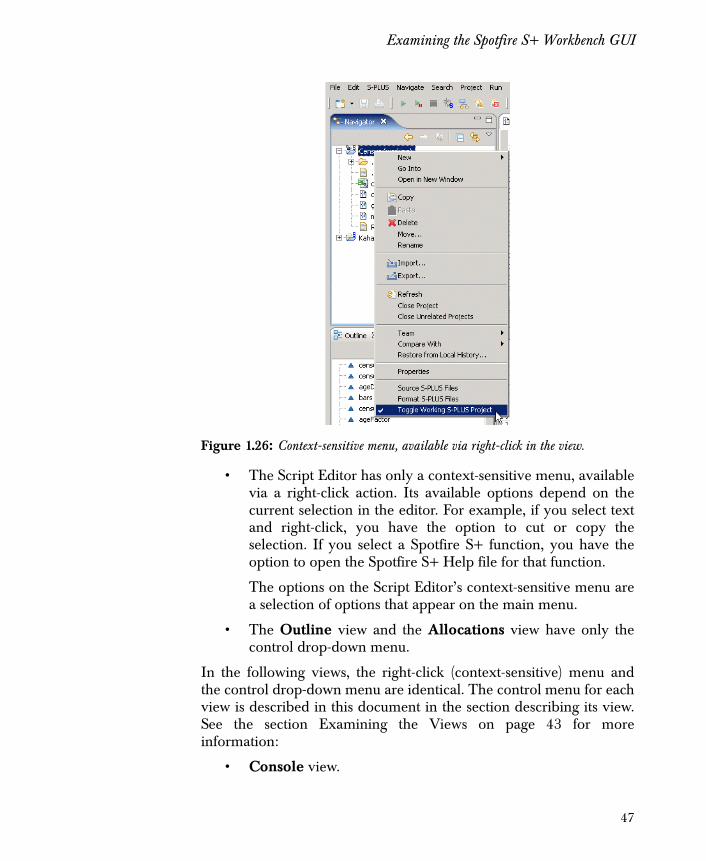
• The Script Editor has only a context-sensitive menu, availablevia a right-click action. Its available options depend on thecurrent selection in the editor. For example, if you select textand right-click, you have the option to cut or copy theselection. If you select a Spotfire S+ function, you have theoption to open the Spotfire S+ Help file for that function.
The options on the Script Editor’s context-sensitive menu area selection of options that appear on the main menu.
• The Outline view and the Allocations view have only thecontrol drop-down menu.
In the following views, the right-click (context-sensitive) menu andthe control drop-down menu are identical. The control menu for eachview is described in this document in the section describing its view.See the section Examining the Views on page 43 for moreinformation:
• Console view.
Figure 1.26: Context-sensitive menu, available via right-click in the view.
47
Chapter 1 The TIBCO Spotfire S+ Workbench
• Function Calls view.
• History view.
• Objects view.
• Output view.
• Search Path view.
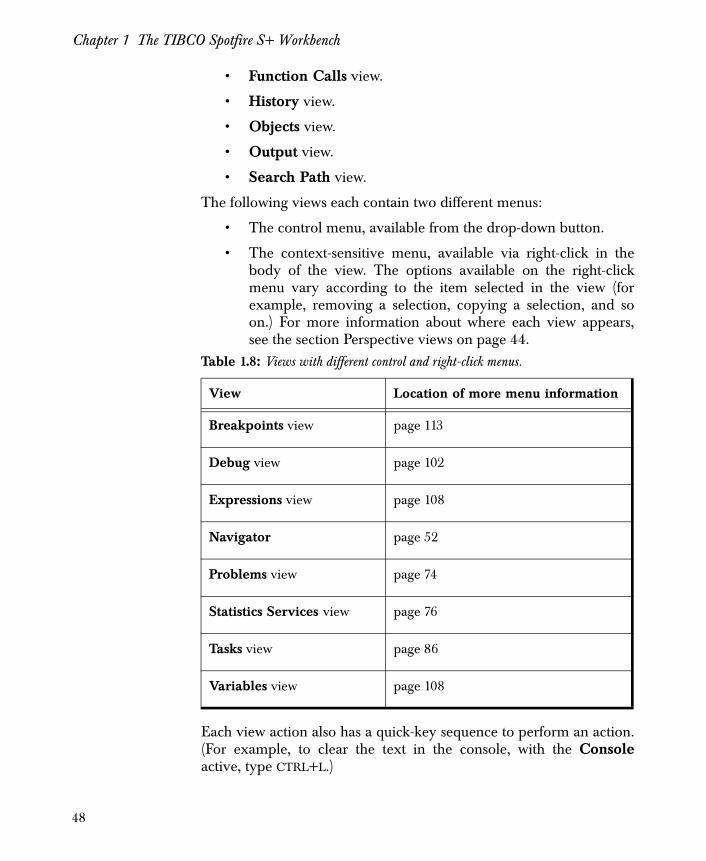
The following views each contain two different menus:
• The control menu, available from the drop-down button.
• The context-sensitive menu, available via right-click in thebody of the view. The options available on the right-clickmenu vary according to the item selected in the view (forexample, removing a selection, copying a selection, and soon.) For more information about where each view appears,see the section Perspective views on page 44.
Each view action also has a quick-key sequence to perform an action.(For example, to clear the text in the console, with the Consoleactive, type CTRL+L.)
Table 1.8: Views with different control and right-click menus.
View Location of more menu information
Breakpoints view page 113
Debug view page 102
Expressions view page 108
Navigator page 52
Problems view page 74
Statistics Services view page 76
Tasks view page 86
Variables view page 108
48
Examining the Spotfire S+ Workbench GUI
Default Shared Views
The following sections describe the views that are shown, by default,in both the Spotfire S+ perspective and the Debug perspective.
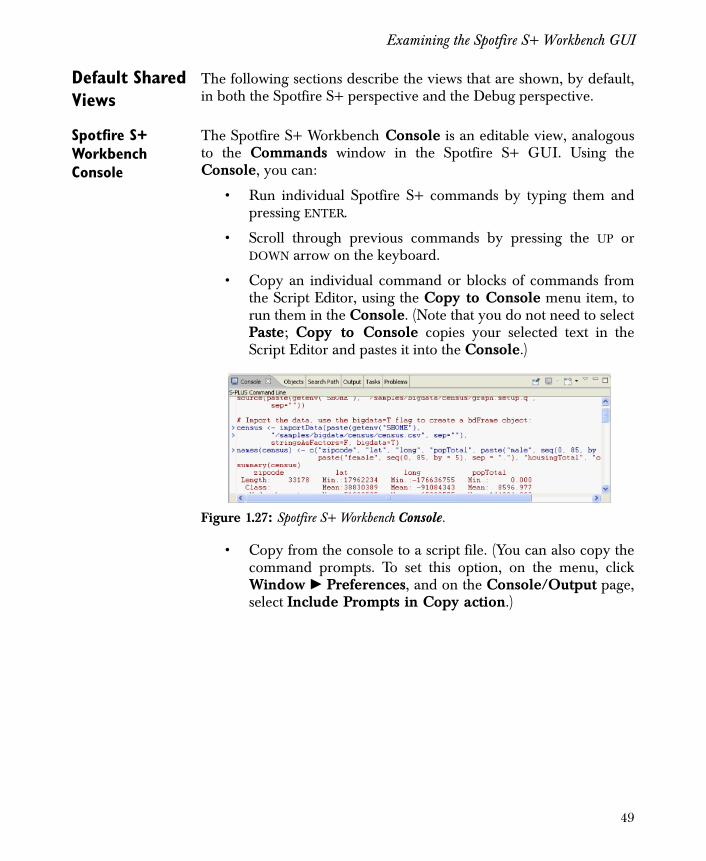
Spotfire S+ Workbench Console
The Spotfire S+ Workbench Console is an editable view, analogousto the Commands window in the Spotfire S+ GUI. Using theConsole, you can:
• Run individual Spotfire S+ commands by typing them andpressing ENTER.
• Scroll through previous commands by pressing the UP orDOWN arrow on the keyboard.
• Copy an individual command or blocks of commands fromthe Script Editor, using the Copy to Console menu item, torun them in the Console. (Note that you do not need to selectPaste; Copy to Console copies your selected text in theScript Editor and pastes it into the Console.)
• Copy from the console to a script file. (You can also copy thecommand prompts. To set this option, on the menu, clickWindow � Preferences, and on the Console/Output page,select Include Prompts in Copy action.)
Figure 1.27: Spotfire S+ Workbench Console.
49
Chapter 1 The TIBCO Spotfire S+ Workbench
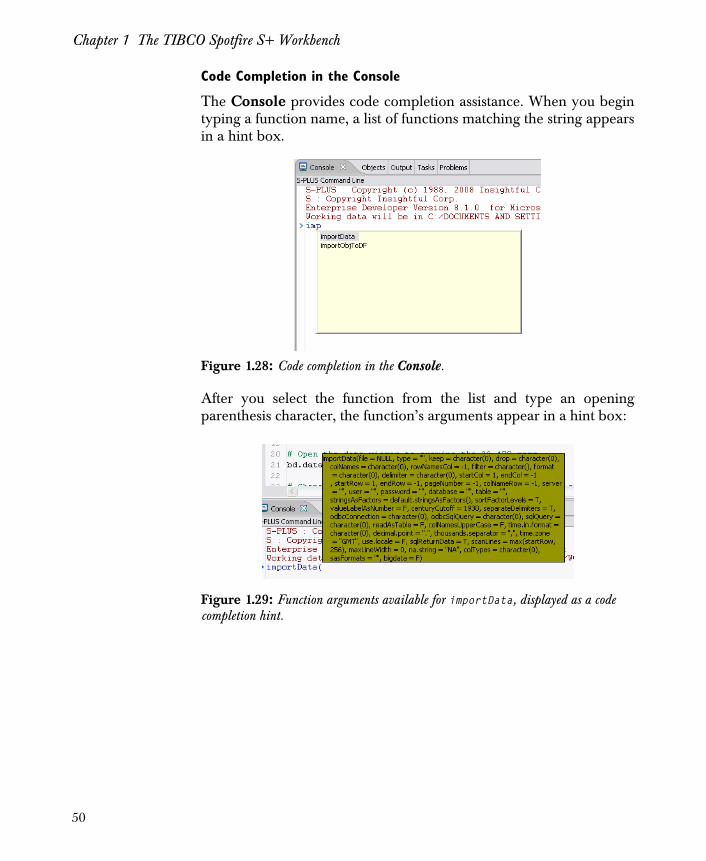
Code Completion in the Console
The Console provides code completion assistance. When you begintyping a function name, a list of functions matching the string appearsin a hint box.
After you select the function from the list and type an openingparenthesis character, the function’s arguments appear in a hint box:
Figure 1.28: Code completion in the Console.
Figure 1.29: Function arguments available for importData, displayed as a code completion hint.
50
Examining the Spotfire S+ Workbench GUI
The function’s arguments, as shown for importData in Figure 1.29, isdisplayed in the hint box until you type the closing parenthesischaracter.
Console control and right-click menus
The Console controls include these Eclipse options:
• Pin the view in place ( ).
• Toggle between open Console views ( ).
• Open a new Console ( ).
The Console control menu and right-click menu are the same. Youcan use the Console control menu (click or right-click the body ofthe Console) to perform the following tasks:
• Clear the contents of the console.
• Copy the selected text.
• Cut the selected text.
• Paste text from the clipboard to the console.
• Find a string.
• Select all text.
• Save the console contents to a file.
• Print the console contents.
• Open the Preferences dialog to set such options as font colorand style, among others.
For exercises using the Spotfire S+ Workbench Console, see thesection Copying Script Code to the Console on page 164. For moreinformation about the Spotfire S+ Commands window, see Chapter10, Using the Commands Window in the Spotfire S+ User’s Guide.
Note
For the code completion list, the Spotfire S+ Workbench reads the Search path on startup and includes all functions in loaded libraries. It refreshes that list periodically.
51
Chapter 1 The TIBCO Spotfire S+ Workbench
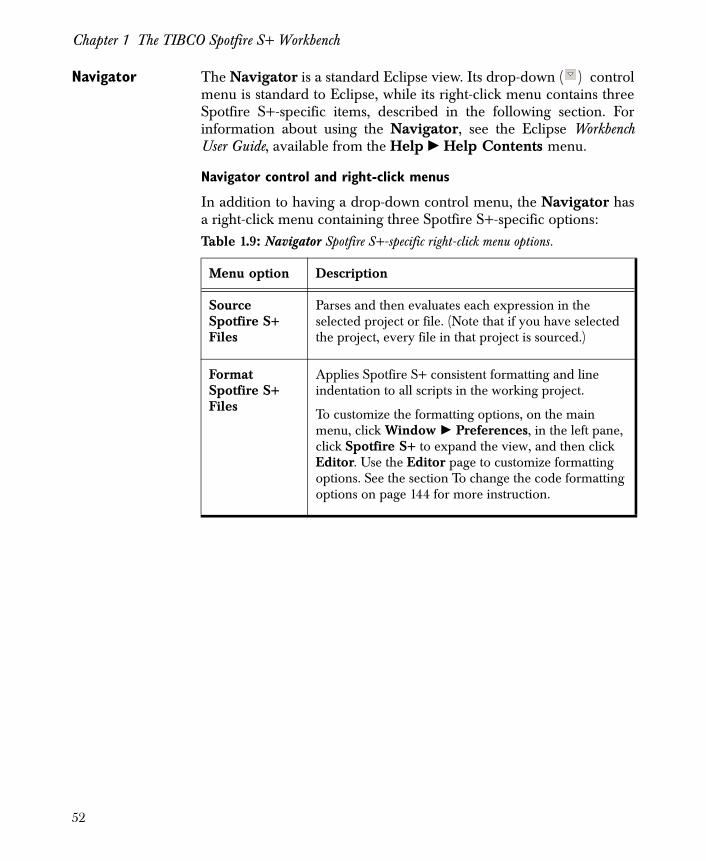
Navigator The Navigator is a standard Eclipse view. Its drop-down ( ) controlmenu is standard to Eclipse, while its right-click menu contains threeSpotfire S+-specific items, described in the following section. Forinformation about using the Navigator, see the Eclipse WorkbenchUser Guide, available from the Help � Help Contents menu.
Navigator control and right-click menus
In addition to having a drop-down control menu, the Navigator hasa right-click menu containing three Spotfire S+-specific options:Table 1.9: Navigator Spotfire S+-specific right-click menu options.
Menu option Description
Source Spotfire S+ Files
Parses and then evaluates each expression in the selected project or file. (Note that if you have selected the project, every file in that project is sourced.)
Format Spotfire S+ Files
Applies Spotfire S+ consistent formatting and line indentation to all scripts in the working project.
To customize the formatting options, on the main menu, click Window � Preferences, in the left pane, click Spotfire S+ to expand the view, and then click Editor. Use the Editor page to customize formatting options. See the section To change the code formatting options on page 144 for more instruction.
52
Examining the Spotfire S+ Workbench GUI
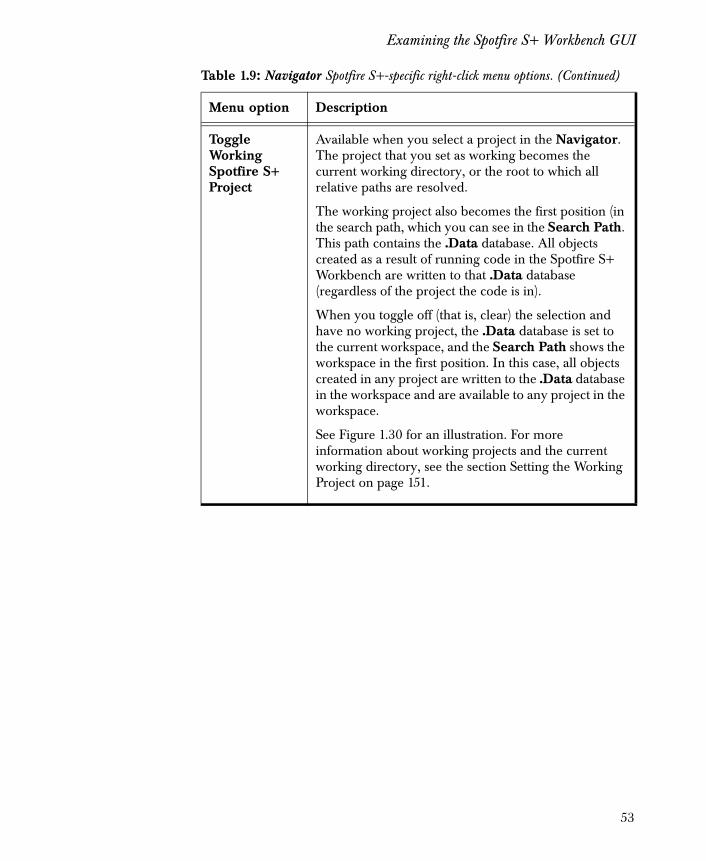
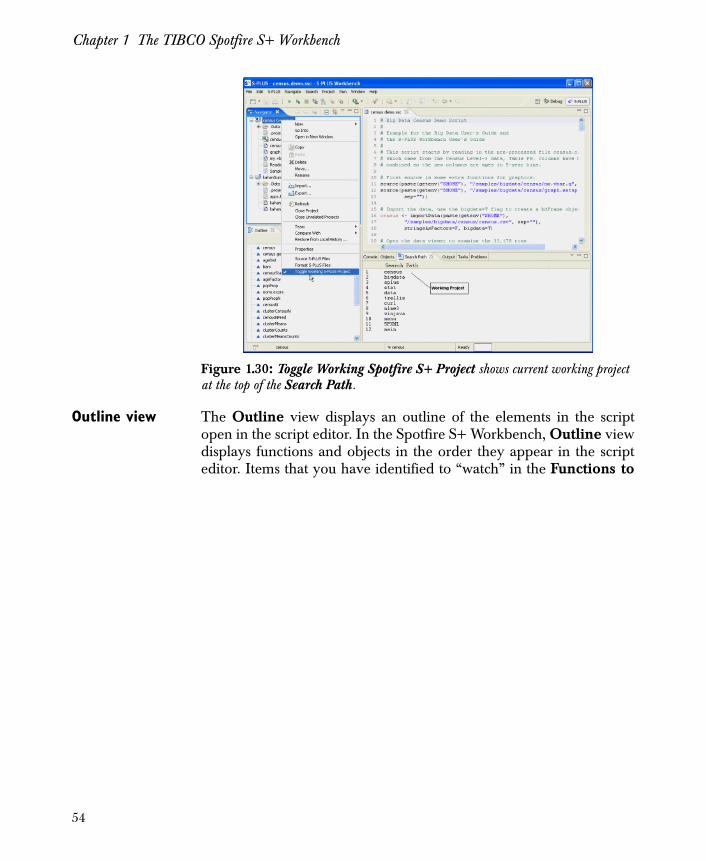
Toggle Working Spotfire S+ Project
Available when you select a project in the Navigator. The project that you set as working becomes the current working directory, or the root to which all relative paths are resolved.
The working project also becomes the first position (in the search path, which you can see in the Search Path. This path contains the .Data database. All objects created as a result of running code in the Spotfire S+ Workbench are written to that .Data database (regardless of the project the code is in).
When you toggle off (that is, clear) the selection and have no working project, the .Data database is set to the current workspace, and the Search Path shows the workspace in the first position. In this case, all objects created in any project are written to the .Data database in the workspace and are available to any project in the workspace.
See Figure 1.30 for an illustration. For more information about working projects and the current working directory, see the section Setting the Working Project on page 151.
Table 1.9: Navigator Spotfire S+-specific right-click menu options. (Continued)
Menu option Description
53
Chapter 1 The TIBCO Spotfire S+ Workbench
Outline view The Outline view displays an outline of the elements in the scriptopen in the script editor. In the Spotfire S+ Workbench, Outline viewdisplays functions and objects in the order they appear in the scripteditor. Items that you have identified to “watch” in the Functions to
Figure 1.30: Toggle Working Spotfire S+ Project shows current working project at the top of the Search Path.
54
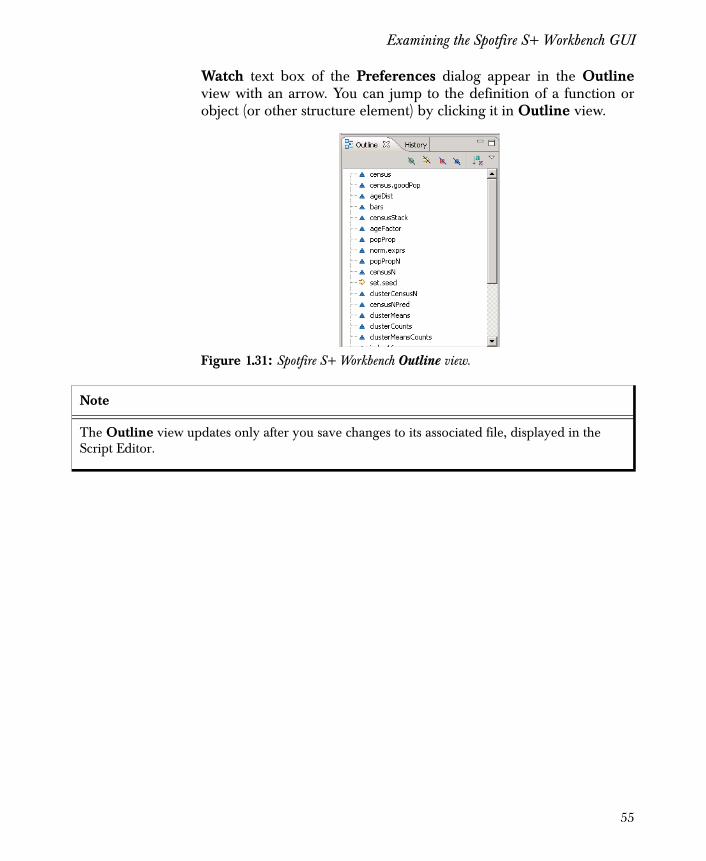
Examining the Spotfire S+ Workbench GUI
Watch text box of the Preferences dialog appear in the Outlineview with an arrow. You can jump to the definition of a function orobject (or other structure element) by clicking it in Outline view.
Figure 1.31: Spotfire S+ Workbench Outline view.
Note
The Outline view updates only after you save changes to its associated file, displayed in the Script Editor.
55
Chapter 1 The TIBCO Spotfire S+ Workbench
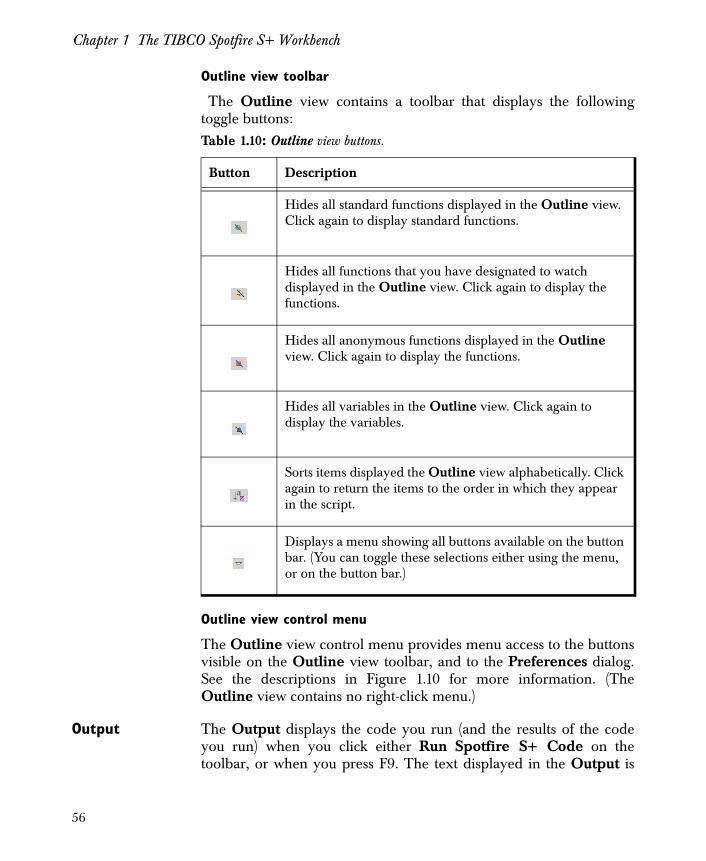
Outline view toolbar
The Outline view contains a toolbar that displays the followingtoggle buttons:
Outline view control menu
The Outline view control menu provides menu access to the buttonsvisible on the Outline view toolbar, and to the Preferences dialog.See the descriptions in Figure 1.10 for more information. (TheOutline view contains no right-click menu.)
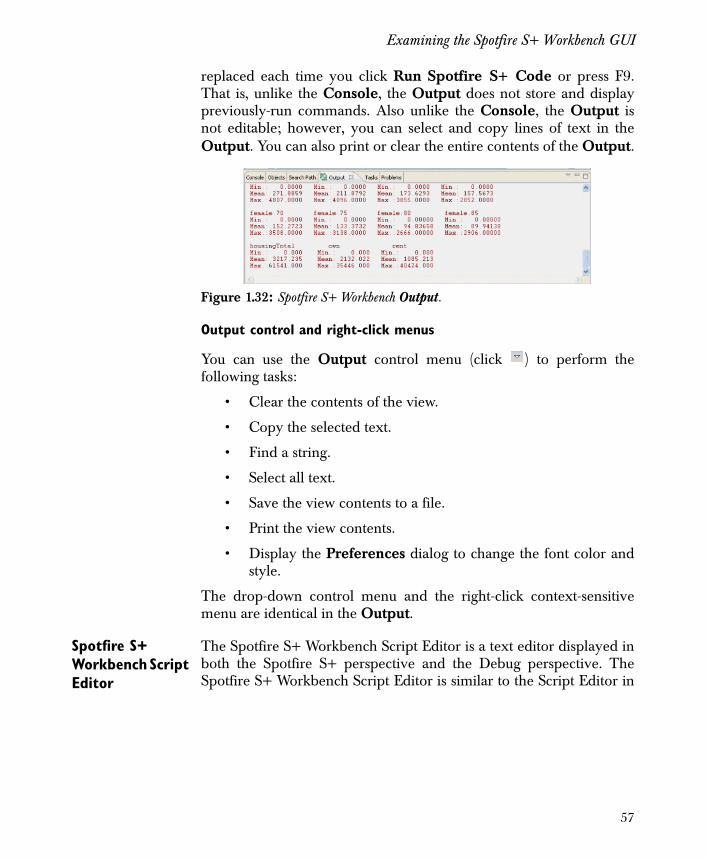
Output The Output displays the code you run (and the results of the codeyou run) when you click either Run Spotfire S+ Code on thetoolbar, or when you press F9. The text displayed in the Output is
Table 1.10: Outline view buttons.
Button Description
Hides all standard functions displayed in the Outline view. Click again to display standard functions.
Hides all functions that you have designated to watch displayed in the Outline view. Click again to display the functions.
Hides all anonymous functions displayed in the Outline view. Click again to display the functions.
Hides all variables in the Outline view. Click again to display the variables.
Sorts items displayed the Outline view alphabetically. Click again to return the items to the order in which they appear in the script.
Displays a menu showing all buttons available on the button bar. (You can toggle these selections either using the menu, or on the button bar.)
56
Examining the Spotfire S+ Workbench GUI
replaced each time you click Run Spotfire S+ Code or press F9.That is, unlike the Console, the Output does not store and displaypreviously-run commands. Also unlike the Console, the Output isnot editable; however, you can select and copy lines of text in theOutput. You can also print or clear the entire contents of the Output.
Output control and right-click menus
You can use the Output control menu (click ) to perform thefollowing tasks:
• Clear the contents of the view.
• Copy the selected text.
• Find a string.
• Select all text.
• Save the view contents to a file.
• Print the view contents.
• Display the Preferences dialog to change the font color andstyle.
The drop-down control menu and the right-click context-sensitivemenu are identical in the Output.
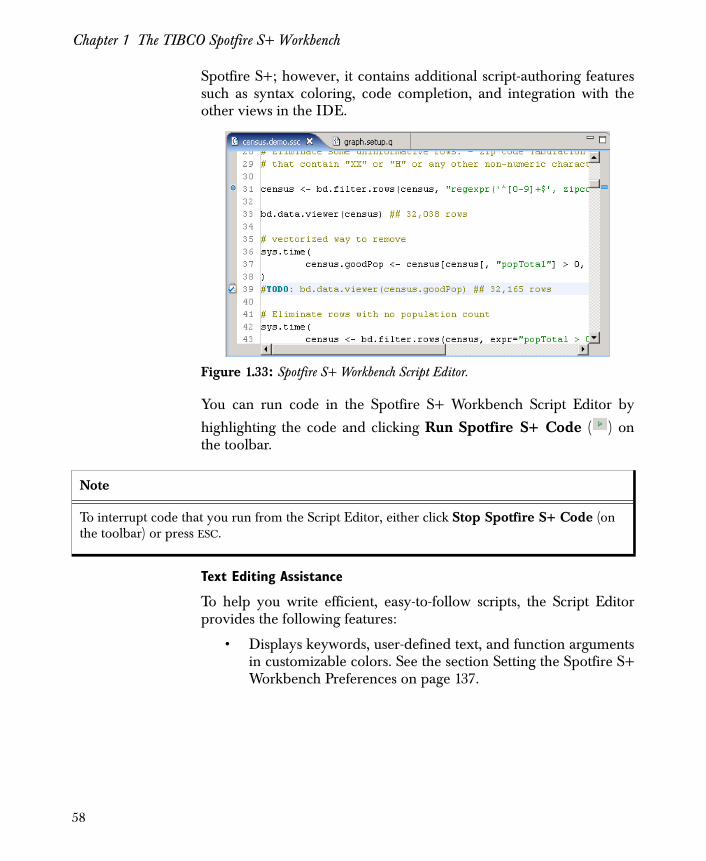
Spotfire S+ Workbench Script Editor
The Spotfire S+ Workbench Script Editor is a text editor displayed inboth the Spotfire S+ perspective and the Debug perspective. TheSpotfire S+ Workbench Script Editor is similar to the Script Editor in
Figure 1.32: Spotfire S+ Workbench Output.
57
Chapter 1 The TIBCO Spotfire S+ Workbench
Spotfire S+; however, it contains additional script-authoring featuressuch as syntax coloring, code completion, and integration with theother views in the IDE.
You can run code in the Spotfire S+ Workbench Script Editor by
highlighting the code and clicking Run Spotfire S+ Code ( ) onthe toolbar.
Text Editing Assistance
To help you write efficient, easy-to-follow scripts, the Script Editorprovides the following features:
• Displays keywords, user-defined text, and function argumentsin customizable colors. See the section Setting the Spotfire S+Workbench Preferences on page 137.
Figure 1.33: Spotfire S+ Workbench Script Editor.
Note
To interrupt code that you run from the Script Editor, either click Stop Spotfire S+ Code (on the toolbar) or press ESC.
58
Examining the Spotfire S+ Workbench GUI
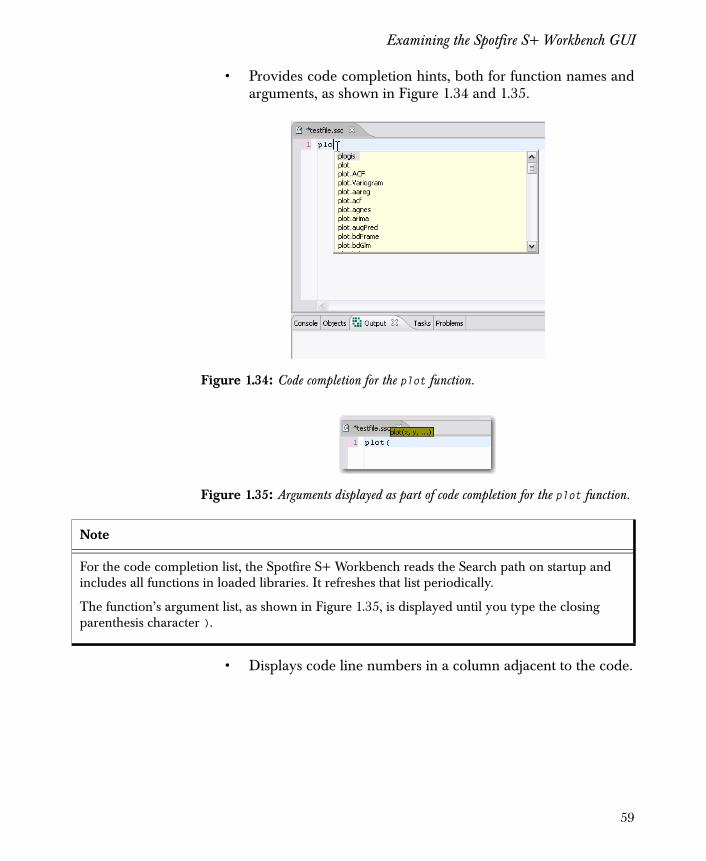
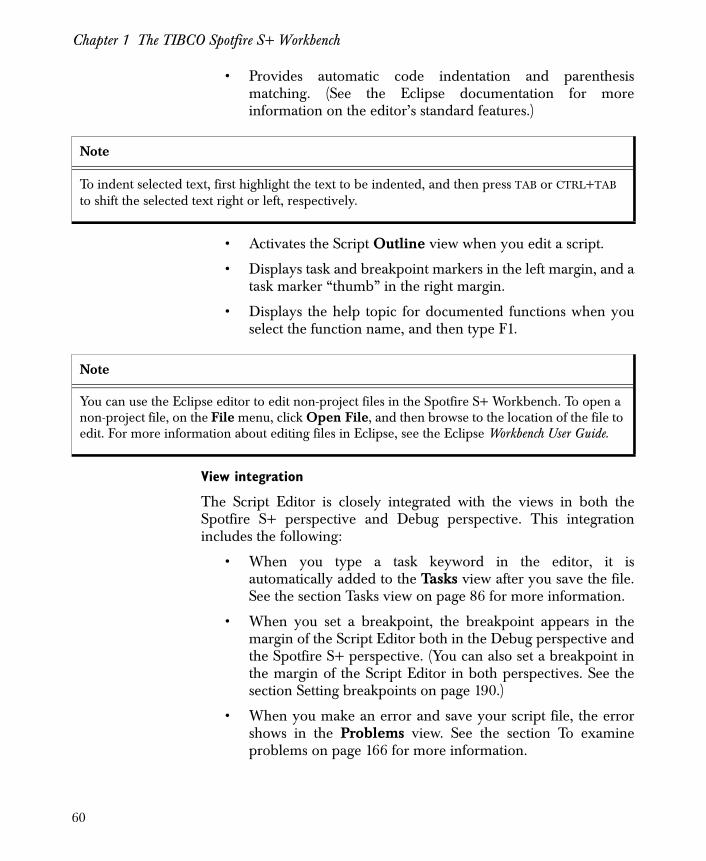
• Provides code completion hints, both for function names andarguments, as shown in Figure 1.34 and 1.35.
• Displays code line numbers in a column adjacent to the code.
Figure 1.34: Code completion for the plot function.
Figure 1.35: Arguments displayed as part of code completion for the plot function.
Note
For the code completion list, the Spotfire S+ Workbench reads the Search path on startup and includes all functions in loaded libraries. It refreshes that list periodically.
The function’s argument list, as shown in Figure 1.35, is displayed until you type the closing parenthesis character ).
59
Chapter 1 The TIBCO Spotfire S+ Workbench
• Provides automatic code indentation and parenthesismatching. (See the Eclipse documentation for moreinformation on the editor’s standard features.)
• Activates the Script Outline view when you edit a script.
• Displays task and breakpoint markers in the left margin, and atask marker “thumb” in the right margin.
• Displays the help topic for documented functions when youselect the function name, and then type F1.
View integration
The Script Editor is closely integrated with the views in both theSpotfire S+ perspective and Debug perspective. This integrationincludes the following:
• When you type a task keyword in the editor, it isautomatically added to the Tasks view after you save the file.See the section Tasks view on page 86 for more information.
• When you set a breakpoint, the breakpoint appears in themargin of the Script Editor both in the Debug perspective andthe Spotfire S+ perspective. (You can also set a breakpoint inthe margin of the Script Editor in both perspectives. See thesection Setting breakpoints on page 190.)
• When you make an error and save your script file, the errorshows in the Problems view. See the section To examineproblems on page 166 for more information.
Note
To indent selected text, first highlight the text to be indented, and then press TAB or CTRL+TAB to shift the selected text right or left, respectively.
Note
You can use the Eclipse editor to edit non-project files in the Spotfire S+ Workbench. To open a non-project file, on the File menu, click Open File, and then browse to the location of the file to edit. For more information about editing files in Eclipse, see the Eclipse Workbench User Guide.
60
Examining the Spotfire S+ Workbench GUI
• When you create a new object in the script, it appears in theOutline view. To make it appear in the Objects view, youmust run the script and refresh the Objects view.
Script Editor right-click menu
The right-click menu in the Script Editor combines actions from theEclipse main menu, including the options available from the SpotfireS+ menu, and the Preferences dialog.
See the section Spotfire S+ Menu on page 33 for information aboutthe Spotfire S+ options.
See section Setting the Spotfire S+ Workbench Preferences on page137 for information about setting Preferences options.
(The Script Editor has no drop-down control menu.)
61
Chapter 1 The TIBCO Spotfire S+ Workbench
COMMONLY-USED FEATURES IN ECLIPSE
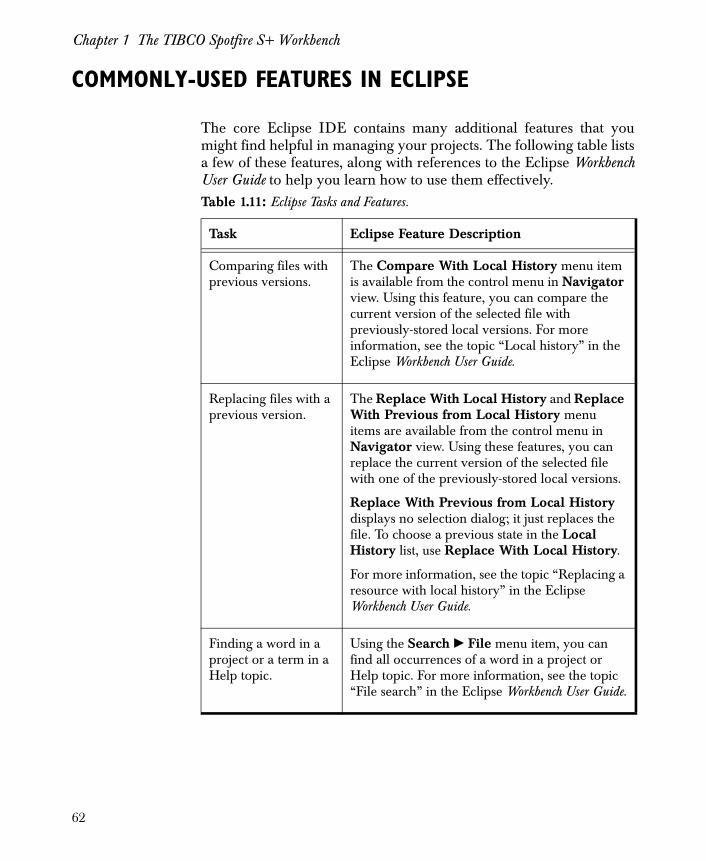
The core Eclipse IDE contains many additional features that youmight find helpful in managing your projects. The following table listsa few of these features, along with references to the Eclipse WorkbenchUser Guide to help you learn how to use them effectively.Table 1.11: Eclipse Tasks and Features.
Task Eclipse Feature Description
Comparing files with previous versions.
The Compare With Local History menu item is available from the control menu in Navigator view. Using this feature, you can compare the current version of the selected file with previously-stored local versions. For more information, see the topic “Local history” in the Eclipse Workbench User Guide.
Replacing files with a previous version.
The Replace With Local History and Replace With Previous from Local History menu items are available from the control menu in Navigator view. Using these features, you can replace the current version of the selected file with one of the previously-stored local versions.
Replace With Previous from Local History displays no selection dialog; it just replaces the file. To choose a previous state in the Local History list, use Replace With Local History.
For more information, see the topic “Replacing a resource with local history” in the Eclipse Workbench User Guide.
Finding a word in a project or a term in a Help topic.
Using the Search � File menu item, you can find all occurrences of a word in a project or Help topic. For more information, see the topic “File search” in the Eclipse Workbench User Guide.
62
Commonly-Used Features in Eclipse
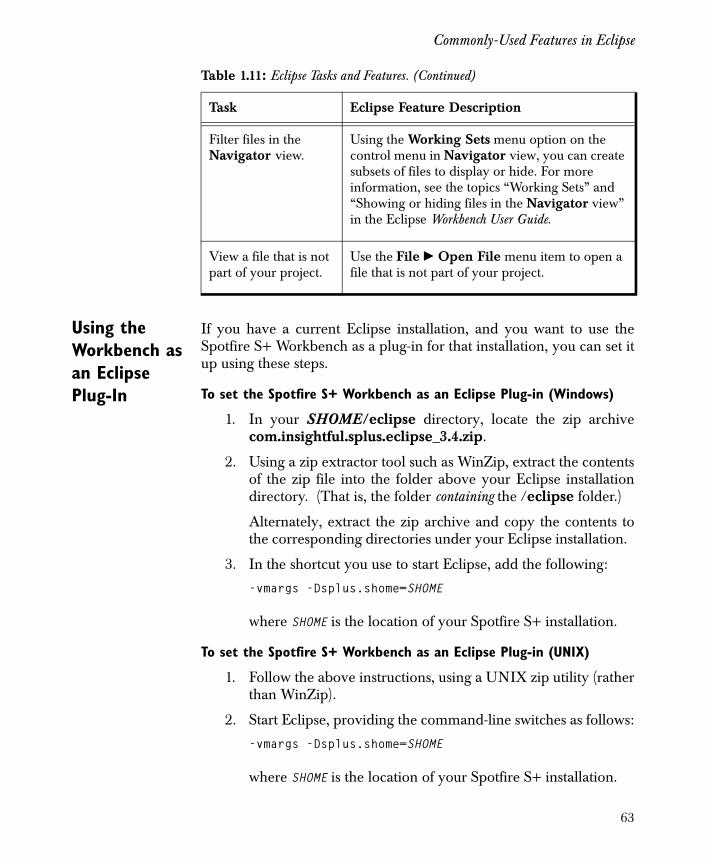
Using the Workbench as an Eclipse Plug-In
If you have a current Eclipse installation, and you want to use theSpotfire S+ Workbench as a plug-in for that installation, you can set itup using these steps.
To set the Spotfire S+ Workbench as an Eclipse Plug-in (Windows)
1. In your SHOME/eclipse directory, locate the zip archivecom.insightful.splus.eclipse_3.4.zip.
2. Using a zip extractor tool such as WinZip, extract the contentsof the zip file into the folder above your Eclipse installationdirectory. (That is, the folder containing the /eclipse folder.)
Alternately, extract the zip archive and copy the contents tothe corresponding directories under your Eclipse installation.
3. In the shortcut you use to start Eclipse, add the following:
-vmargs -Dsplus.shome=SHOME
where SHOME is the location of your Spotfire S+ installation.
To set the Spotfire S+ Workbench as an Eclipse Plug-in (UNIX)
1. Follow the above instructions, using a UNIX zip utility (ratherthan WinZip).
2. Start Eclipse, providing the command-line switches as follows:
-vmargs -Dsplus.shome=SHOME
where SHOME is the location of your Spotfire S+ installation.
Filter files in the Navigator view.
Using the Working Sets menu option on the control menu in Navigator view, you can create subsets of files to display or hide. For more information, see the topics “Working Sets” and “Showing or hiding files in the Navigator view” in the Eclipse Workbench User Guide.
View a file that is not part of your project.
Use the File � Open File menu item to open a file that is not part of your project.
Table 1.11: Eclipse Tasks and Features. (Continued)
Task Eclipse Feature Description
63

Chapter 1 The TIBCO Spotfire S+ Workbench
64
Introduction 66
Spotfire S+ Perspective Views 68Customizing the Spotfire S+ Perspective Views 69History 69Objects 71Problems view 74Search Path 75Statistics Services view 76Statistics Services Dialogs 82Monitor Server Jobs view 85Tasks view 86
THE TIBCO SPOTFIRE S+ PERSPECTIVE 2
65
Chapter 2 The TIBCO Spotfire S+ Perspective
INTRODUCTION
TIBCO Spotfire S+ Workbench perspectives define the appearanceand behavior of the Spotfire S+ Workbench Eclipse plug-in,including the Spotfire S+ Script Editor, views, menus, and toolbars.The Spotfire S+ perspective combines Spotfire S+ Workbench viewsand options so you can accomplish specific types of tasks and workwith specific types of resources.
• For more information about the Spotfire S+ Debuggerperspective options and views, see Chapter 3.
• For practice instruction using the features in the Spotfire S+perspective, as well as the Spotfire S+ Workbench and Debugperspective, see Chapter 4, TIBCO Spotfire S+ WorkbenchTasks.
Note
You can change a perspective to suit your development style by moving, hiding, or closing views. For more information about customizing the views within the perspective, see the section Changing the Spotfire S+ Workbench Perspective on page 42, or see the section Customized Perspective Views on page 148.
66
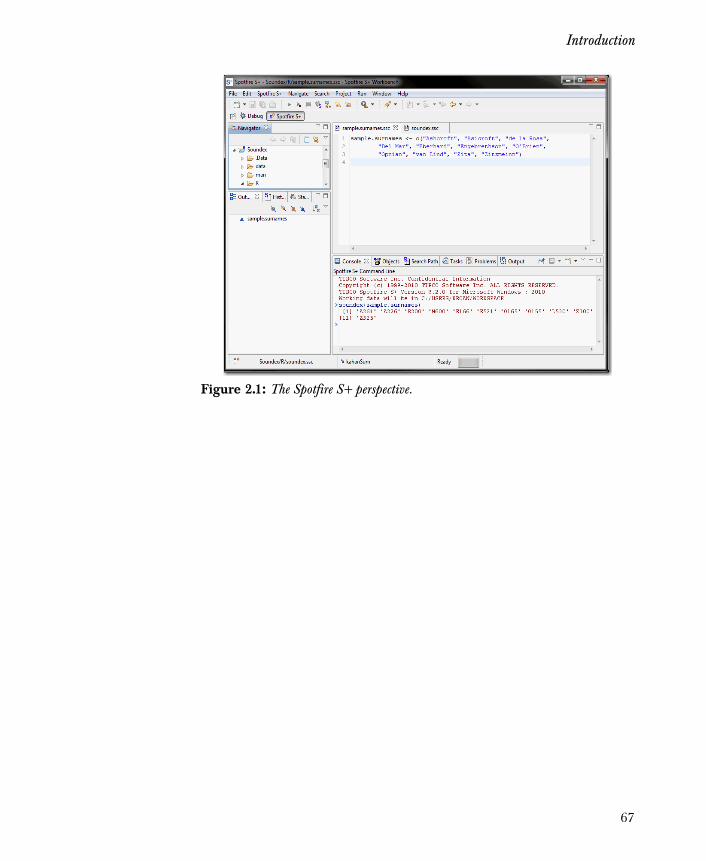
Introduction
Figure 2.1: The Spotfire S+ perspective.
67
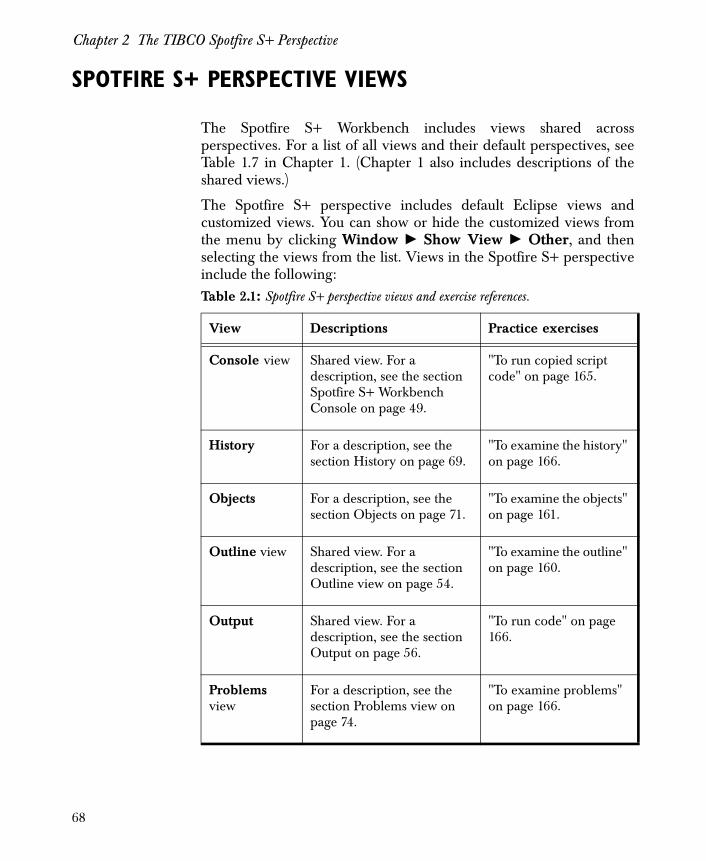
Chapter 2 The TIBCO Spotfire S+ Perspective
SPOTFIRE S+ PERSPECTIVE VIEWS
The Spotfire S+ Workbench includes views shared acrossperspectives. For a list of all views and their default perspectives, seeTable 1.7 in Chapter 1. (Chapter 1 also includes descriptions of theshared views.)
The Spotfire S+ perspective includes default Eclipse views andcustomized views. You can show or hide the customized views fromthe menu by clicking Window � Show View � Other, and thenselecting the views from the list. Views in the Spotfire S+ perspectiveinclude the following:Table 2.1: Spotfire S+ perspective views and exercise references.
View Descriptions Practice exercises
Console view Shared view. For a description, see the section Spotfire S+ Workbench Console on page 49.
"To run copied script code" on page 165.
History For a description, see the section History on page 69.
"To examine the history" on page 166.
Objects For a description, see the section Objects on page 71.
"To examine the objects" on page 161.
Outline view Shared view. For a description, see the section Outline view on page 54.
"To examine the outline" on page 160.
Output Shared view. For a description, see the section Output on page 56.
"To run code" on page 166.
Problems view
For a description, see the section Problems view on page 74.
"To examine problems" on page 166.
68
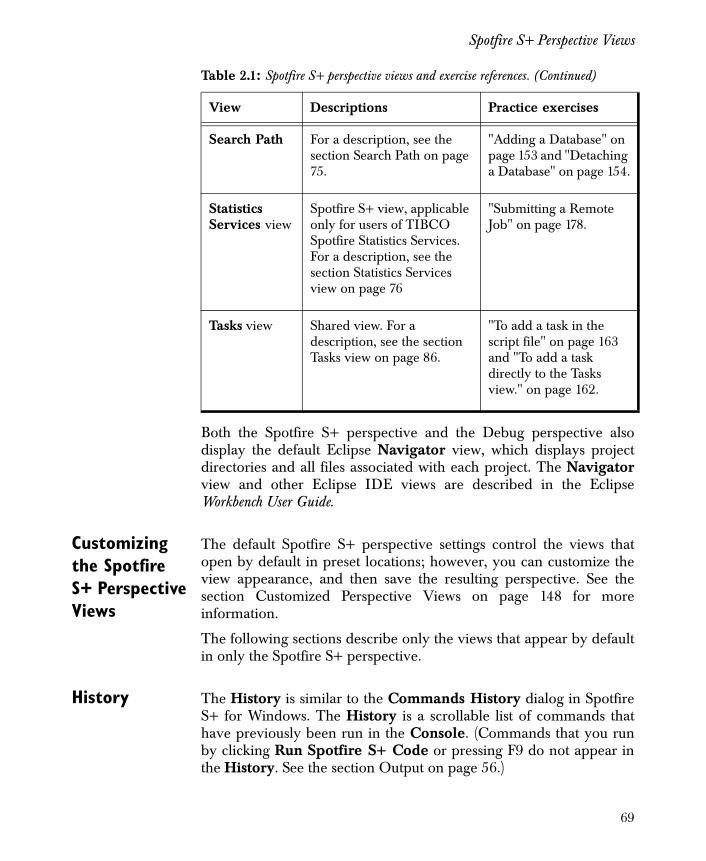
Spotfire S+ Perspective Views
Both the Spotfire S+ perspective and the Debug perspective alsodisplay the default Eclipse Navigator view, which displays projectdirectories and all files associated with each project. The Navigatorview and other Eclipse IDE views are described in the EclipseWorkbench User Guide.
Customizing the Spotfire S+ Perspective Views
The default Spotfire S+ perspective settings control the views thatopen by default in preset locations; however, you can customize theview appearance, and then save the resulting perspective. See thesection Customized Perspective Views on page 148 for moreinformation.
The following sections describe only the views that appear by defaultin only the Spotfire S+ perspective.
History The History is similar to the Commands History dialog in SpotfireS+ for Windows. The History is a scrollable list of commands thathave previously been run in the Console. (Commands that you runby clicking Run Spotfire S+ Code or pressing F9 do not appear inthe History. See the section Output on page 56.)
Search Path For a description, see the section Search Path on page 75.
"Adding a Database" on page 153 and "Detaching a Database" on page 154.
Statistics Services view
Spotfire S+ view, applicable only for users of TIBCO Spotfire Statistics Services. For a description, see the section Statistics Services view on page 76
"Submitting a Remote Job" on page 178.
Tasks view Shared view. For a description, see the section Tasks view on page 86.
"To add a task in the script file" on page 163 and "To add a task directly to the Tasks view." on page 162.
Table 2.1: Spotfire S+ perspective views and exercise references. (Continued)
View Descriptions Practice exercises
69
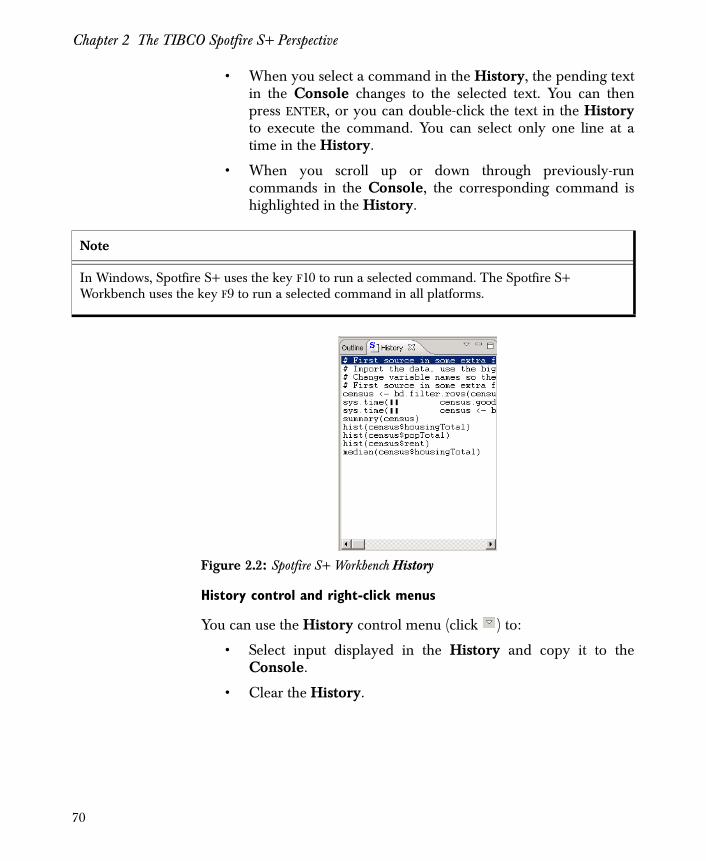
Chapter 2 The TIBCO Spotfire S+ Perspective
• When you select a command in the History, the pending textin the Console changes to the selected text. You can thenpress ENTER, or you can double-click the text in the Historyto execute the command. You can select only one line at atime in the History.
• When you scroll up or down through previously-runcommands in the Console, the corresponding command ishighlighted in the History.
History control and right-click menus
You can use the History control menu (click ) to:
• Select input displayed in the History and copy it to theConsole.
• Clear the History.
Note
In Windows, Spotfire S+ uses the key F10 to run a selected command. The Spotfire S+ Workbench uses the key F9 to run a selected command in all platforms.
Figure 2.2: Spotfire S+ Workbench History
70
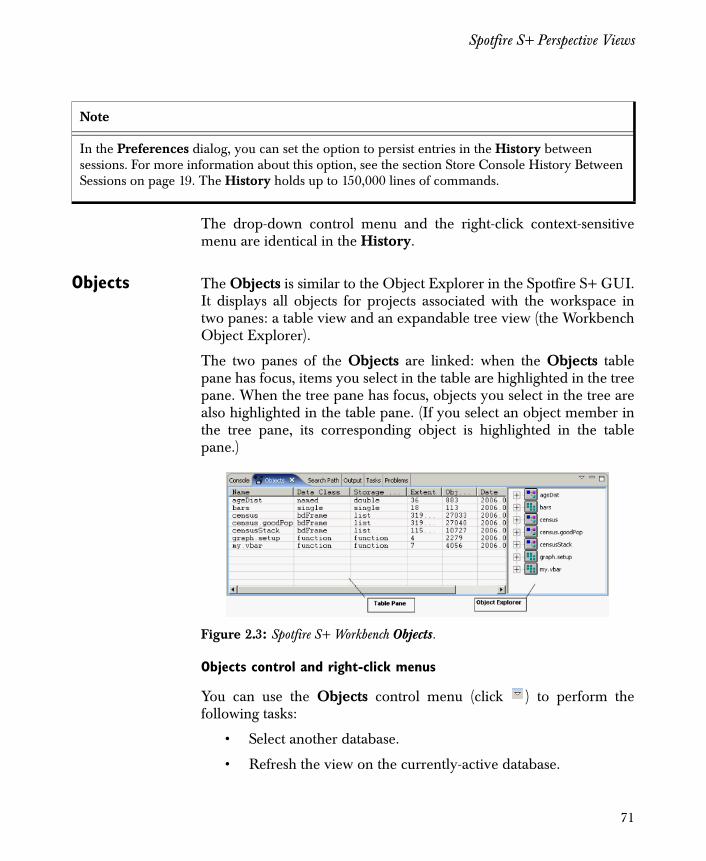
Spotfire S+ Perspective Views
The drop-down control menu and the right-click context-sensitivemenu are identical in the History.
Objects The Objects is similar to the Object Explorer in the Spotfire S+ GUI.It displays all objects for projects associated with the workspace intwo panes: a table view and an expandable tree view (the WorkbenchObject Explorer).
The two panes of the Objects are linked: when the Objects tablepane has focus, items you select in the table are highlighted in the treepane. When the tree pane has focus, objects you select in the tree arealso highlighted in the table pane. (If you select an object member inthe tree pane, its corresponding object is highlighted in the tablepane.)
Objects control and right-click menus
You can use the Objects control menu (click ) to perform thefollowing tasks:
• Select another database.
• Refresh the view on the currently-active database.
Note
In the Preferences dialog, you can set the option to persist entries in the History between sessions. For more information about this option, see the section Store Console History Between Sessions on page 19. The History holds up to 150,000 lines of commands.
Figure 2.3: Spotfire S+ Workbench Objects.
71
Chapter 2 The TIBCO Spotfire S+ Perspective
• Remove the selected object from the currently-activedatabase.
• Show or hide Spotfire S+ system objects, such as.Last.value, .Data, and .Random.seed. (These objects arehidden by default.)
• Change the number of items displayed in the tree viewmembers.
The drop-down control menu and the right-click context-sensitivemenu are identical in the Objects.
Objects table pane
The Objects includes a table pane displaying a list of the names andtypes of objects in Spotfire S+ databases. The Objects table includesthe following information about each object:
• name
• data class
• storage mode
• extent
• size
• creation or change date.
By default, the Spotfire S+ system objects, such as .Random.seed and.Last.value are hidden. You can display these objects by togglingthe option on the Objects control menu.
Note
When you run code that creates objects in a Spotfire S+ script, the Objects is not automatically refreshed to display the new objects. To refresh Objects and display newly-created objects, right-
click the Objects (or click the control menu button ), and then from the menu, click Refresh.
Warning
If you select a large database, such as splus, in the Objects, it can take a long time to display the contents in the table and tree view panes.
72
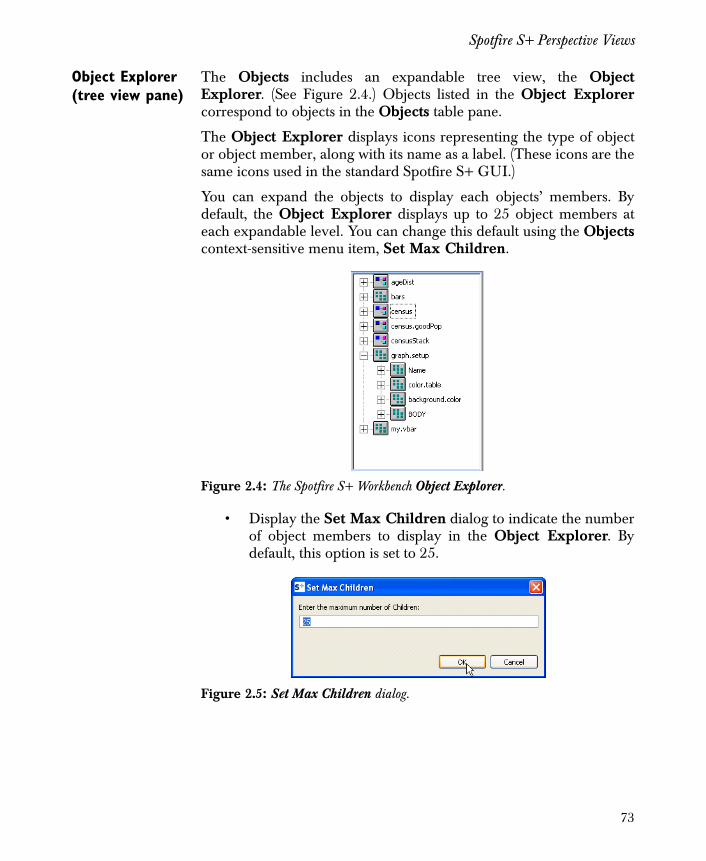
Spotfire S+ Perspective Views
Object Explorer (tree view pane)
The Objects includes an expandable tree view, the ObjectExplorer. (See Figure 2.4.) Objects listed in the Object Explorercorrespond to objects in the Objects table pane.
The Object Explorer displays icons representing the type of objector object member, along with its name as a label. (These icons are thesame icons used in the standard Spotfire S+ GUI.)
You can expand the objects to display each objects’ members. Bydefault, the Object Explorer displays up to 25 object members ateach expandable level. You can change this default using the Objectscontext-sensitive menu item, Set Max Children.
• Display the Set Max Children dialog to indicate the numberof object members to display in the Object Explorer. Bydefault, this option is set to 25.
Figure 2.4: The Spotfire S+ Workbench Object Explorer.
Figure 2.5: Set Max Children dialog.
73
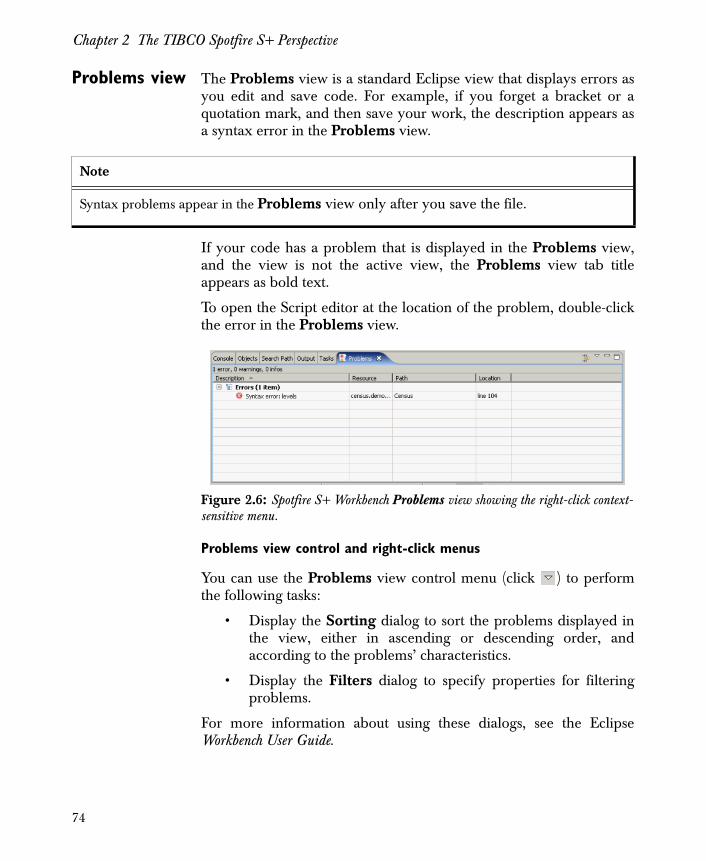
Chapter 2 The TIBCO Spotfire S+ Perspective
Problems view The Problems view is a standard Eclipse view that displays errors asyou edit and save code. For example, if you forget a bracket or aquotation mark, and then save your work, the description appears asa syntax error in the Problems view.
If your code has a problem that is displayed in the Problems view,and the view is not the active view, the Problems view tab titleappears as bold text.
To open the Script editor at the location of the problem, double-clickthe error in the Problems view.
Problems view control and right-click menus
You can use the Problems view control menu (click ) to performthe following tasks:
• Display the Sorting dialog to sort the problems displayed inthe view, either in ascending or descending order, andaccording to the problems’ characteristics.
• Display the Filters dialog to specify properties for filteringproblems.
For more information about using these dialogs, see the EclipseWorkbench User Guide.
Note
Syntax problems appear in the Problems view only after you save the file.
Figure 2.6: Spotfire S+ Workbench Problems view showing the right-click context-sensitive menu.
74
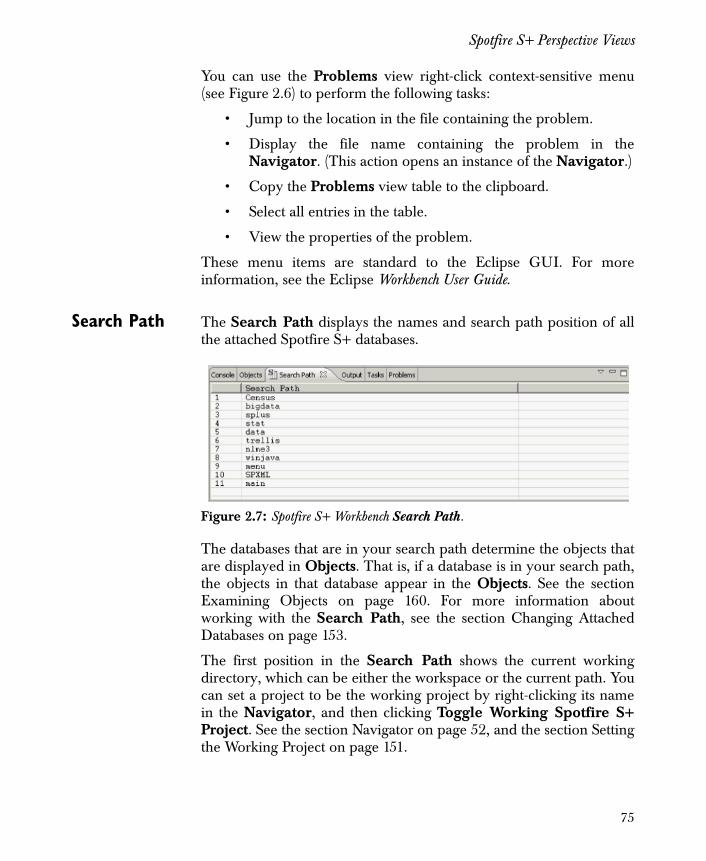
Spotfire S+ Perspective Views
You can use the Problems view right-click context-sensitive menu(see Figure 2.6) to perform the following tasks:
• Jump to the location in the file containing the problem.
• Display the file name containing the problem in theNavigator. (This action opens an instance of the Navigator.)
• Copy the Problems view table to the clipboard.
• Select all entries in the table.
• View the properties of the problem.
These menu items are standard to the Eclipse GUI. For moreinformation, see the Eclipse Workbench User Guide.
Search Path The Search Path displays the names and search path position of allthe attached Spotfire S+ databases.
The databases that are in your search path determine the objects thatare displayed in Objects. That is, if a database is in your search path,the objects in that database appear in the Objects. See the sectionExamining Objects on page 160. For more information aboutworking with the Search Path, see the section Changing AttachedDatabases on page 153.
The first position in the Search Path shows the current workingdirectory, which can be either the workspace or the current path. Youcan set a project to be the working project by right-clicking its namein the Navigator, and then clicking Toggle Working Spotfire S+Project. See the section Navigator on page 52, and the section Settingthe Working Project on page 151.
Figure 2.7: Spotfire S+ Workbench Search Path.
75
Chapter 2 The TIBCO Spotfire S+ Perspective
Search Path control and right-click menus
You can use the Search Path control menu (click ) to:
• Attach a library.
• Attach a module.
• Attach a directory.
• Detach the currently-selected database in the view.
• Refresh the current view.
The drop-down control menu and the right-click context-sensitivemenu are identical in the Search Path.
Statistics Services view
The Statistics Services view provides controls for connecting to oneor more running TIBCO Spotfire Statistics Services server(s) andperforming a variety of tasks, including:
• Upload and download files, including data files.
• Delete files, including data files.
• Preview data contents and data summary information.
• Upload and download packages.
• View files and packages on the server.
• Run jobs on the server.
• View job results.
• View and save to the local environment return values.
• Schedule jobs.
• Cancel scheduled jobs.
• Monitor jobs.
Note
When you use the control menu to add to (or remove from) the Search Path a library, module, or directory, the view automatically refreshes. When you run code to add or remove a library, module, or directory, the view is not automatically refreshed. To refresh the view, right-click the Search Path (or click the control menu button, and then from the menu, click Refresh.
76
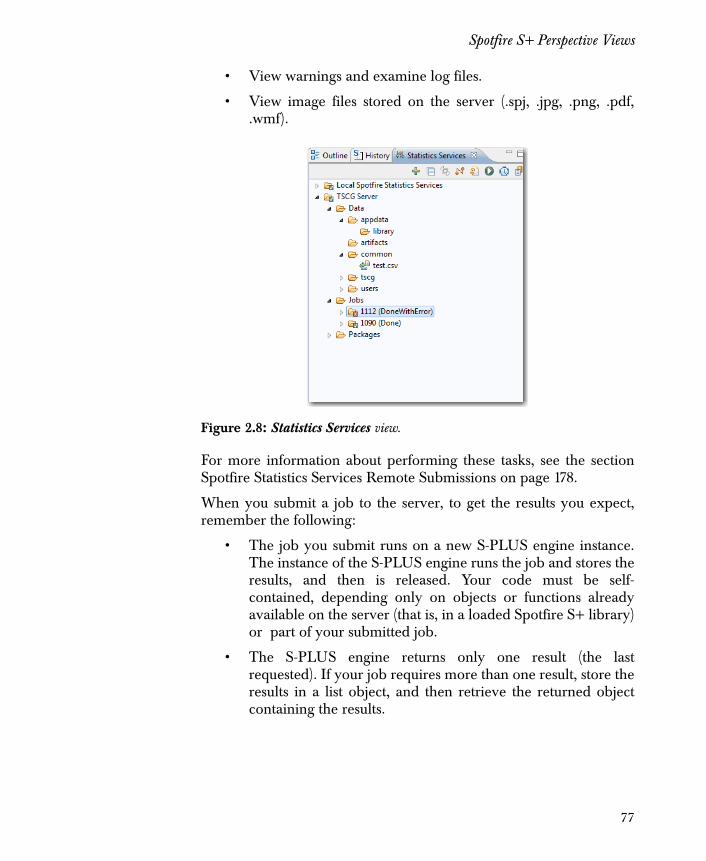
Spotfire S+ Perspective Views
• View warnings and examine log files.
• View image files stored on the server (.spj, .jpg, .png, .pdf,.wmf).
For more information about performing these tasks, see the sectionSpotfire Statistics Services Remote Submissions on page 178.
When you submit a job to the server, to get the results you expect,remember the following:
• The job you submit runs on a new S-PLUS engine instance.The instance of the S-PLUS engine runs the job and stores theresults, and then is released. Your code must be self-contained, depending only on objects or functions alreadyavailable on the server (that is, in a loaded Spotfire S+ library)or part of your submitted job.
• The S-PLUS engine returns only one result (the lastrequested). If your job requires more than one result, store theresults in a list object, and then retrieve the returned objectcontaining the results.
Figure 2.8: Statistics Services view.
77
Chapter 2 The TIBCO Spotfire S+ Perspective
• If your server request produces a large data set, werecommend that you save it in the Results directory of thejob. (This is the default location, unless you specify anabsolute path.) You can download the file from this location,and then view the results.
Default Folders The Statistics Services view shows the folder structure for theselected TIBCO Spotfire Statistics Services. Table 2.2: Statistics Services view folders.
Folder Description
Data Contains files and folders for data files. You can add individual files to this folder. To add a folder, see your server administrator.
The types of data read by the S-PLUS engine are listed in the help file for importData. See the section Statistics Services Options on page 25 for information about filtering and expanding the list of available data types.
78
Spotfire S+ Perspective Views
Jobs Lists the jobs, in the order that they are submitted, with the most recent jobs first. The job folder name consists of the job ID and status (for example, 205 (Done) or 205 (Waiting)). Job names whose folders have not been opened appear in boldface font. You can delete completed jobs that you no longer need, or you can interrupt jobs that are waiting to run.
All job folders include the following elements:
• Results: Contains the engine.log file and any other files (such as graphic files) created as a result of running the job. Double-click the file engine.log to displays its contents in the Output view. Double-click an image file (such as .spj) to display it in a graphics viewer.
• Output: Displays the Output view.
• Return Value: Displays the return value in the output window for this job. The return value consists of:
• The string retVal.servername.job#, where servername is the name of the server containing the S-PLUS engine that ran the job, and job# is the job ID.
• The script’s return value.
• Script: Opens a new instance of the Script Editor view containing the contents of the script that was run for this job.
Packages Includes any packages installed or uploaded to Spotfire Statistics Services. For example, if your organization uses TIBCO Spotfire Clinical Graphics, when you expand the Packages folder, you see the three protected packages required to run this server: gom, graphlet, and tscg.
Any package you upload is displayed in this folder. If you have completed and uploaded the Soundex example, you see the unprotected package folder Soundex. (See the section Spotfire Statistics Services Remote Submissions on page 178.)
Table 2.2: Statistics Services view folders. (Continued)
Folder Description
79
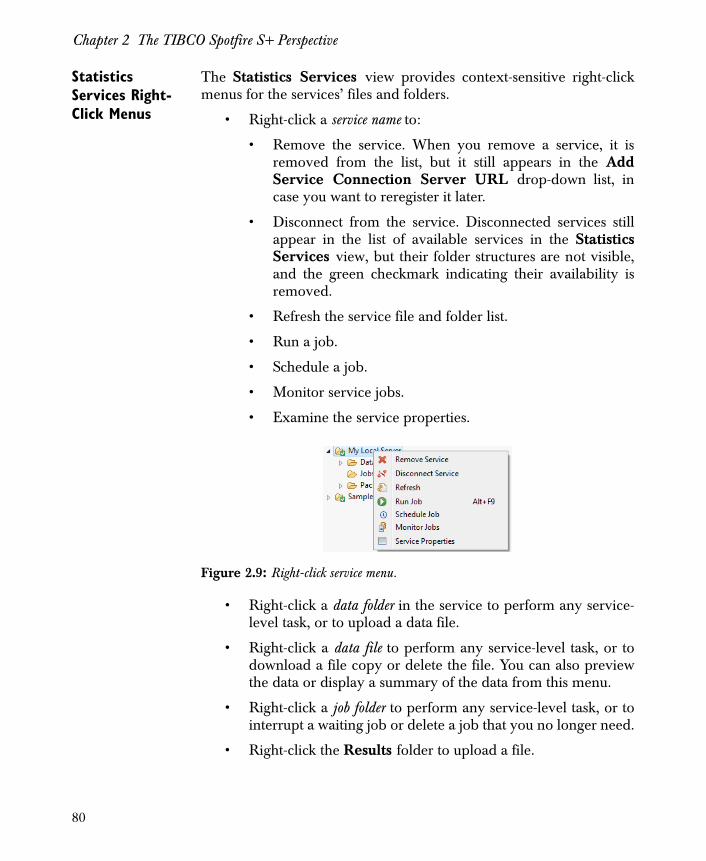
Chapter 2 The TIBCO Spotfire S+ Perspective
Statistics Services Right-Click Menus
The Statistics Services view provides context-sensitive right-clickmenus for the services’ files and folders.
• Right-click a service name to:
• Remove the service. When you remove a service, it isremoved from the list, but it still appears in the AddService Connection Server URL drop-down list, incase you want to reregister it later.
• Disconnect from the service. Disconnected services stillappear in the list of available services in the StatisticsServices view, but their folder structures are not visible,and the green checkmark indicating their availability isremoved.
• Refresh the service file and folder list.
• Run a job.
• Schedule a job.
• Monitor service jobs.
• Examine the service properties.
• Right-click a data folder in the service to perform any service-level task, or to upload a data file.
• Right-click a data file to perform any service-level task, or todownload a file copy or delete the file. You can also previewthe data or display a summary of the data from this menu.
• Right-click a job folder to perform any service-level task, or tointerrupt a waiting job or delete a job that you no longer need.
• Right-click the Results folder to upload a file.
Figure 2.9: Right-click service menu.
80
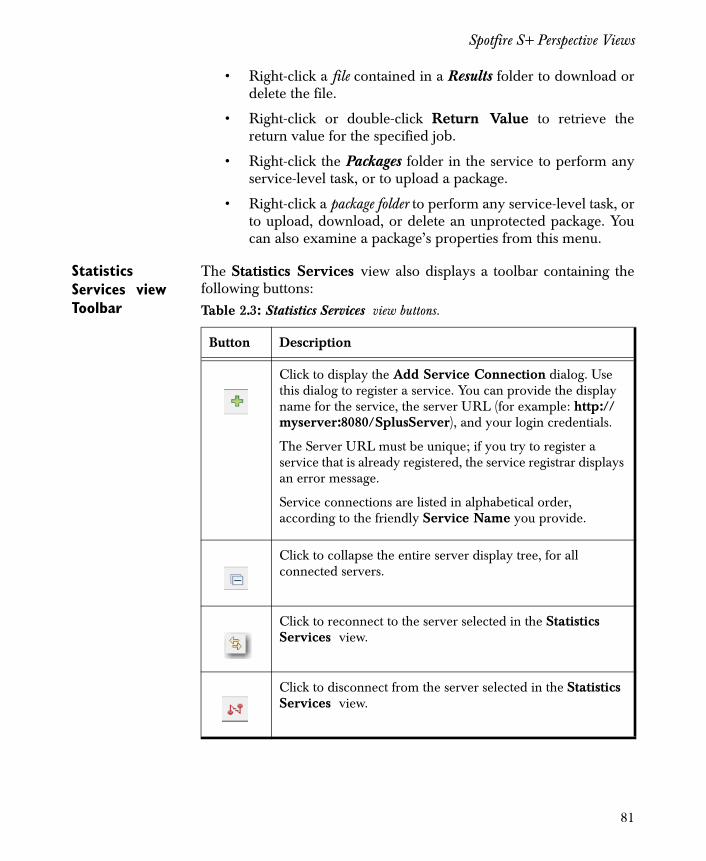
Spotfire S+ Perspective Views
• Right-click a file contained in a Results folder to download ordelete the file.
• Right-click or double-click Return Value to retrieve thereturn value for the specified job.
• Right-click the Packages folder in the service to perform anyservice-level task, or to upload a package.
• Right-click a package folder to perform any service-level task, orto upload, download, or delete an unprotected package. Youcan also examine a package’s properties from this menu.
Statistics Services view Toolbar
The Statistics Services view also displays a toolbar containing thefollowing buttons:Table 2.3: Statistics Services view buttons.
Button Description
Click to display the Add Service Connection dialog. Use this dialog to register a service. You can provide the display name for the service, the server URL (for example: http://myserver:8080/SplusServer), and your login credentials.
The Server URL must be unique; if you try to register a service that is already registered, the service registrar displays an error message.
Service connections are listed in alphabetical order, according to the friendly Service Name you provide.
Click to collapse the entire server display tree, for all connected servers.
Click to reconnect to the server selected in the Statistics Services view.
Click to disconnect from the server selected in the Statistics Services view.
81
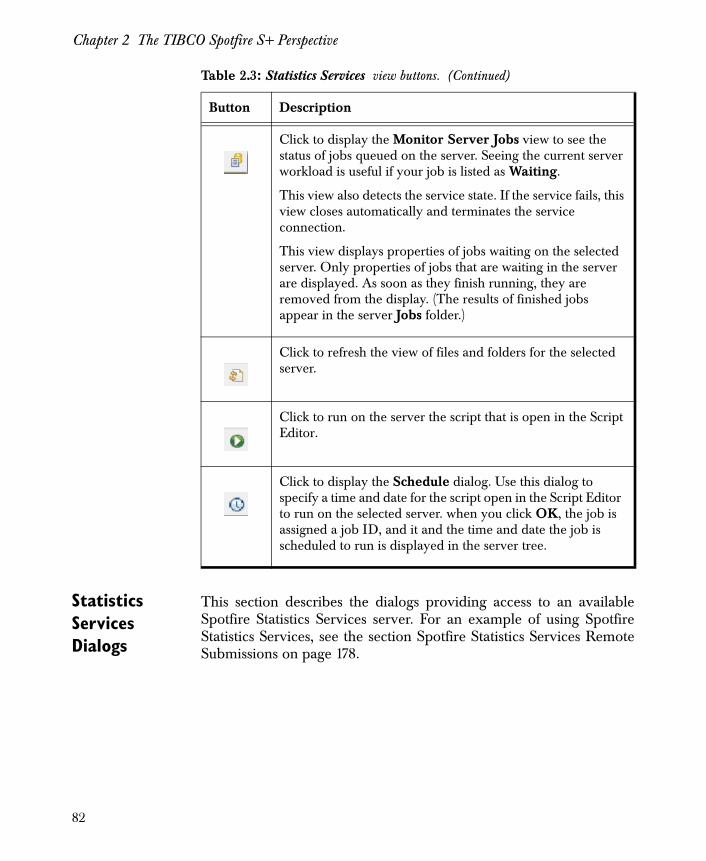
Chapter 2 The TIBCO Spotfire S+ Perspective
Statistics Services Dialogs
This section describes the dialogs providing access to an availableSpotfire Statistics Services server. For an example of using SpotfireStatistics Services, see the section Spotfire Statistics Services RemoteSubmissions on page 178.
Click to display the Monitor Server Jobs view to see the status of jobs queued on the server. Seeing the current server workload is useful if your job is listed as Waiting.
This view also detects the service state. If the service fails, this view closes automatically and terminates the service connection.
This view displays properties of jobs waiting on the selected server. Only properties of jobs that are waiting in the server are displayed. As soon as they finish running, they are removed from the display. (The results of finished jobs appear in the server Jobs folder.)
Click to refresh the view of files and folders for the selected server.
Click to run on the server the script that is open in the Script Editor.
Click to display the Schedule dialog. Use this dialog to specify a time and date for the script open in the Script Editor to run on the selected server. when you click OK, the job is assigned a job ID, and it and the time and date the job is scheduled to run is displayed in the server tree.
Table 2.3: Statistics Services view buttons. (Continued)
Button Description
82
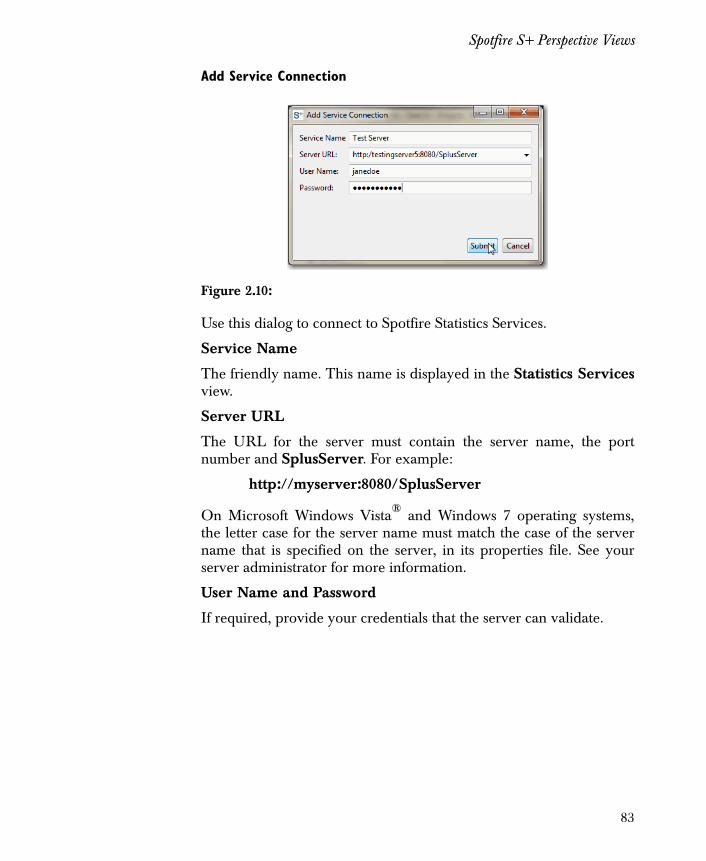
Spotfire S+ Perspective Views
Add Service Connection
Use this dialog to connect to Spotfire Statistics Services.
Service Name
The friendly name. This name is displayed in the Statistics Servicesview.
Server URL
The URL for the server must contain the server name, the portnumber and SplusServer. For example:
http://myserver:8080/SplusServer
On Microsoft Windows Vista® and Windows 7 operating systems,the letter case for the server name must match the case of the servername that is specified on the server, in its properties file. See yourserver administrator for more information.
User Name and Password
If required, provide your credentials that the server can validate.
Figure 2.10:
83
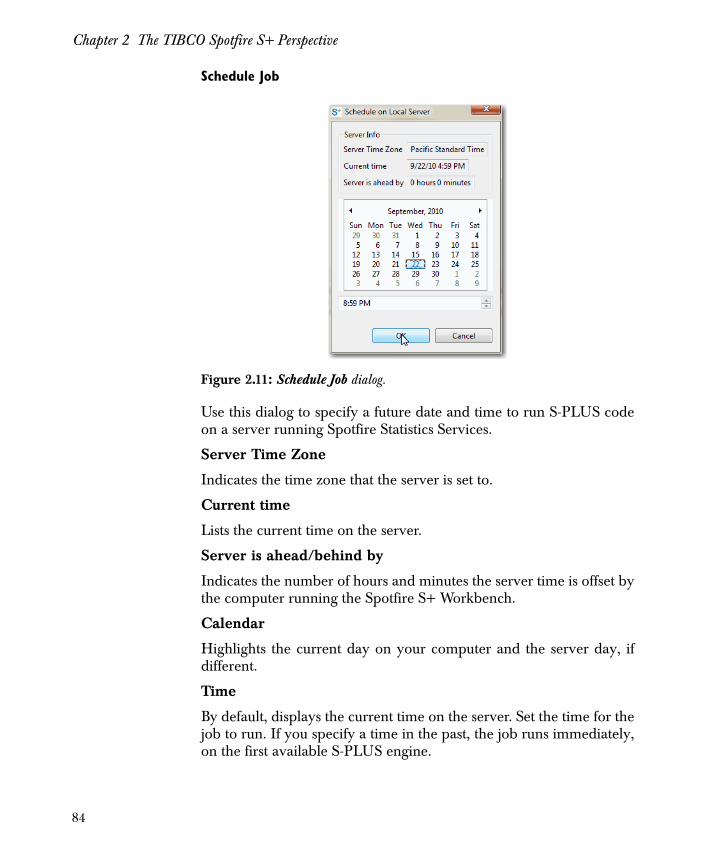
Chapter 2 The TIBCO Spotfire S+ Perspective
Schedule Job
Use this dialog to specify a future date and time to run S-PLUS codeon a server running Spotfire Statistics Services.
Server Time Zone
Indicates the time zone that the server is set to.
Current time
Lists the current time on the server.
Server is ahead/behind by
Indicates the number of hours and minutes the server time is offset bythe computer running the Spotfire S+ Workbench.
Calendar
Highlights the current day on your computer and the server day, ifdifferent.
Time
By default, displays the current time on the server. Set the time for thejob to run. If you specify a time in the past, the job runs immediately,on the first available S-PLUS engine.
Figure 2.11: Schedule Job dialog.
84
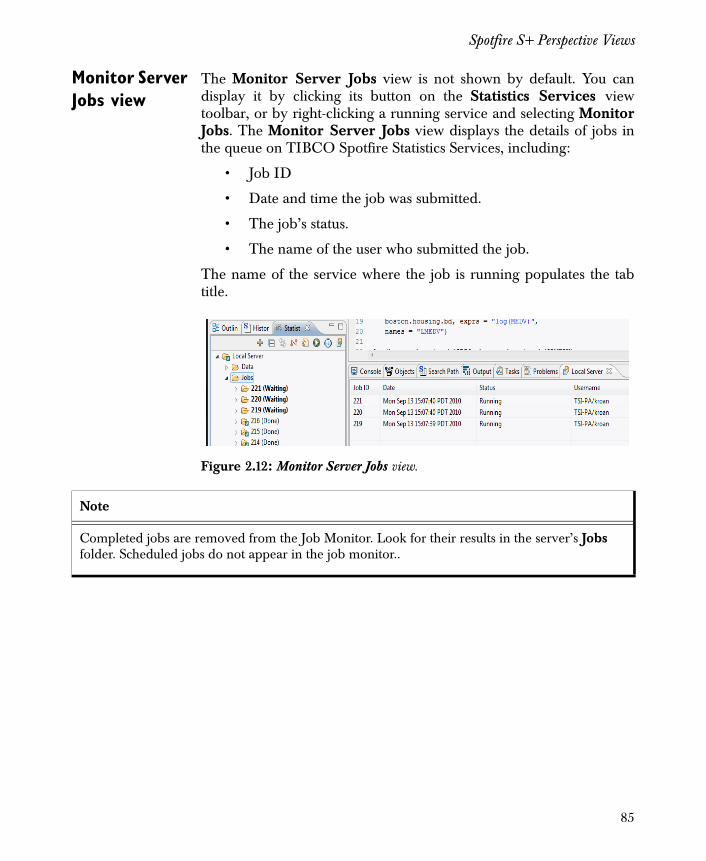
Spotfire S+ Perspective Views
Monitor Server Jobs view
The Monitor Server Jobs view is not shown by default. You candisplay it by clicking its button on the Statistics Services viewtoolbar, or by right-clicking a running service and selecting MonitorJobs. The Monitor Server Jobs view displays the details of jobs inthe queue on TIBCO Spotfire Statistics Services, including:
• Job ID
• Date and time the job was submitted.
• The job’s status.
• The name of the user who submitted the job.
The name of the service where the job is running populates the tabtitle.
Figure 2.12: Monitor Server Jobs view.
Note
Completed jobs are removed from the Job Monitor. Look for their results in the server’s Jobs folder. Scheduled jobs do not appear in the job monitor..
85
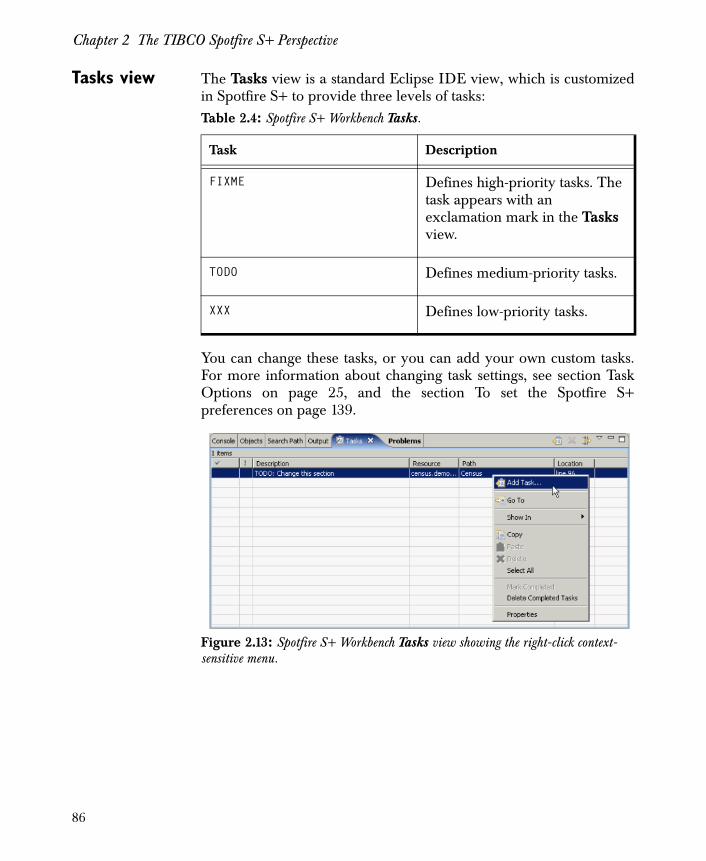
Chapter 2 The TIBCO Spotfire S+ Perspective
Tasks view The Tasks view is a standard Eclipse IDE view, which is customizedin Spotfire S+ to provide three levels of tasks:
You can change these tasks, or you can add your own custom tasks.For more information about changing task settings, see section TaskOptions on page 25, and the section To set the Spotfire S+preferences on page 139.
Table 2.4: Spotfire S+ Workbench Tasks.
Task Description
FIXME Defines high-priority tasks. The task appears with an exclamation mark in the Tasks view.
TODO Defines medium-priority tasks.
XXX Defines low-priority tasks.
Figure 2.13: Spotfire S+ Workbench Tasks view showing the right-click context-sensitive menu.
86
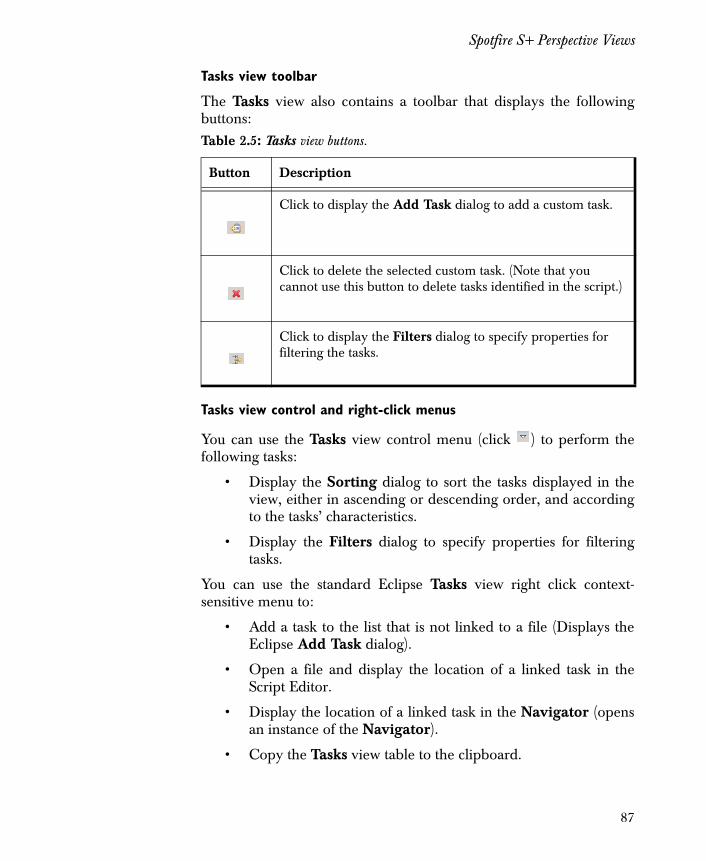
Spotfire S+ Perspective Views
Tasks view toolbar
The Tasks view also contains a toolbar that displays the followingbuttons:
Tasks view control and right-click menus
You can use the Tasks view control menu (click ) to perform thefollowing tasks:
• Display the Sorting dialog to sort the tasks displayed in theview, either in ascending or descending order, and accordingto the tasks’ characteristics.
• Display the Filters dialog to specify properties for filteringtasks.
You can use the standard Eclipse Tasks view right click context-sensitive menu to:
• Add a task to the list that is not linked to a file (Displays theEclipse Add Task dialog).
• Open a file and display the location of a linked task in theScript Editor.
• Display the location of a linked task in the Navigator (opensan instance of the Navigator).
• Copy the Tasks view table to the clipboard.
Table 2.5: Tasks view buttons.
Button Description
Click to display the Add Task dialog to add a custom task.
Click to delete the selected custom task. (Note that you cannot use this button to delete tasks identified in the script.)
Click to display the Filters dialog to specify properties for filtering the tasks.
87
Chapter 2 The TIBCO Spotfire S+ Perspective
• Select all entries in the table.
• Delete all tasks marked as completed (that is, containing acheck mark in the first column).
• View the properties of the task.
For more information about the basic Eclipse Tasks view, see theEclipse Workbench User Guide.
88
Introduction 90
Debug Perspective Options and Preferences 92Setting Preferences 93Debug Mode 93Debug Run Menu Options 94
Debug Perspective Views 98Profiler 120Profiler views 121
TIBCO SPOTFIRE S+ WORKBENCH DEBUG PERSPECTIVE 3
89
Chapter 3 TIBCO Spotfire S+ Workbench Debug Perspective
INTRODUCTION
The TIBCO Spotfire S+ Workbench includes the Debug perspective,which is based on the Eclipse standard debugging perspective.
From the Debug perspective, you can observe the run-time behaviorof your program and determine the location of semantic errors. TheSpotfire S+ debugger understands features that are built into theSpotfire S+ programming language and its associated libraries. Withthe Spotfire S+ debugger, you can break (suspend) execution of yourprogram to examine your code and evaluate variables.
After you have written your code and resolved any syntax errors, youcan use the Spotfire S+ debugger to correct any logic errors that keepyour code from running correctly. Using the Spotfire S+ debugger,you can:
• Control your code testing by setting break points, steppinginto, though, and out of code, and pausing or terminating theprocess at any point using the Spotfire S+ debugger features.
• Set, disable, enable, or remove breakpoints while you aredebugging.
• View variable and expression values at breakpoints whilestepping through your code.
• Track resource allocation and function use.
Note
Because a significant amount of computation is required when you run a debugger, you should expect to see Spotfire S+ running at a slower speed than usual when you toggle the Workbench to Debug mode. Try this simple test for a demonstration:
1. With Debug mode off, examine the results of running:
sys.time(lm(fuel.frame)) sys.time(validate()).
2. Toggle on Debug mode and rerun the commands.
3. Examine the difference.
90
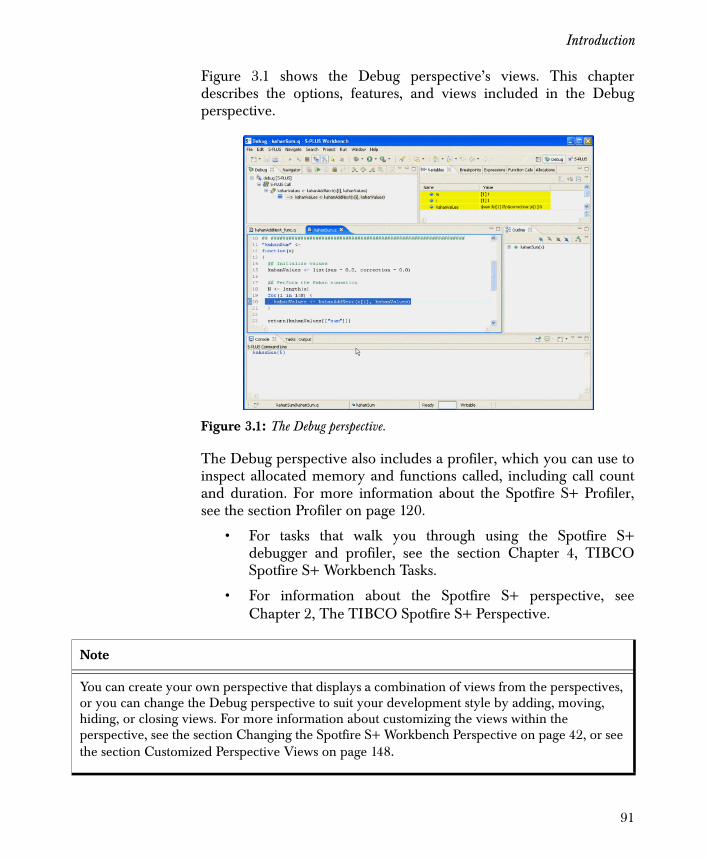
Introduction
Figure 3.1 shows the Debug perspective’s views. This chapterdescribes the options, features, and views included in the Debugperspective.
The Debug perspective also includes a profiler, which you can use toinspect allocated memory and functions called, including call countand duration. For more information about the Spotfire S+ Profiler,see the section Profiler on page 120.
• For tasks that walk you through using the Spotfire S+debugger and profiler, see the section Chapter 4, TIBCOSpotfire S+ Workbench Tasks.
• For information about the Spotfire S+ perspective, seeChapter 2, The TIBCO Spotfire S+ Perspective.
Figure 3.1: The Debug perspective.
Note
You can create your own perspective that displays a combination of views from the perspectives, or you can change the Debug perspective to suit your development style by adding, moving, hiding, or closing views. For more information about customizing the views within the perspective, see the section Changing the Spotfire S+ Workbench Perspective on page 42, or see the section Customized Perspective Views on page 148.
91
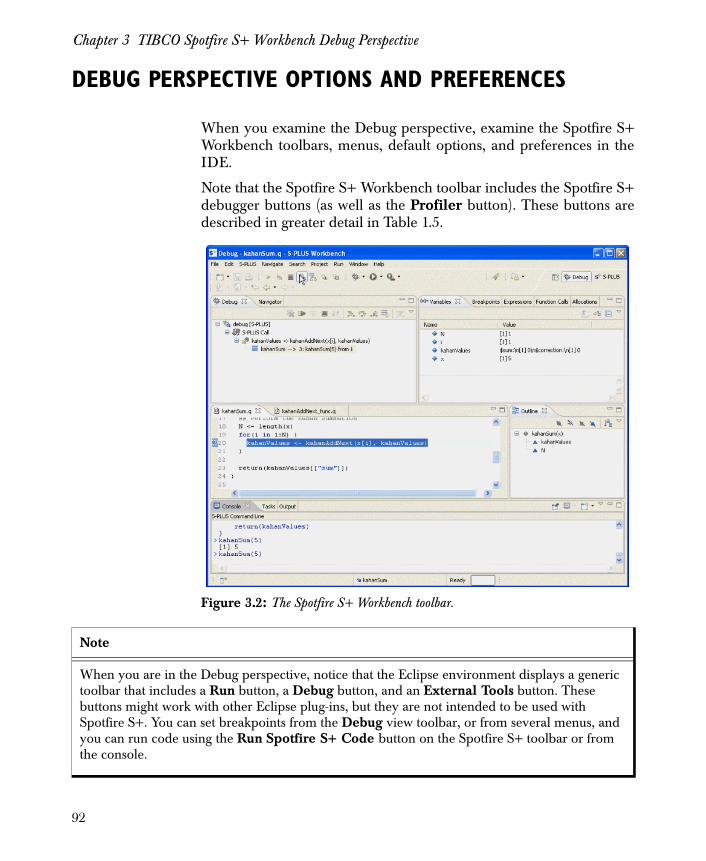
Chapter 3 TIBCO Spotfire S+ Workbench Debug Perspective
DEBUG PERSPECTIVE OPTIONS AND PREFERENCES
When you examine the Debug perspective, examine the Spotfire S+Workbench toolbars, menus, default options, and preferences in theIDE.
Note that the Spotfire S+ Workbench toolbar includes the Spotfire S+debugger buttons (as well as the Profiler button). These buttons aredescribed in greater detail in Table 1.5.
Figure 3.2: The Spotfire S+ Workbench toolbar.
Note
When you are in the Debug perspective, notice that the Eclipse environment displays a generic toolbar that includes a Run button, a Debug button, and an External Tools button. These buttons might work with other Eclipse plug-ins, but they are not intended to be used with Spotfire S+. You can set breakpoints from the Debug view toolbar, or from several menus, and you can run code using the Run Spotfire S+ Code button on the Spotfire S+ toolbar or from the console.
92
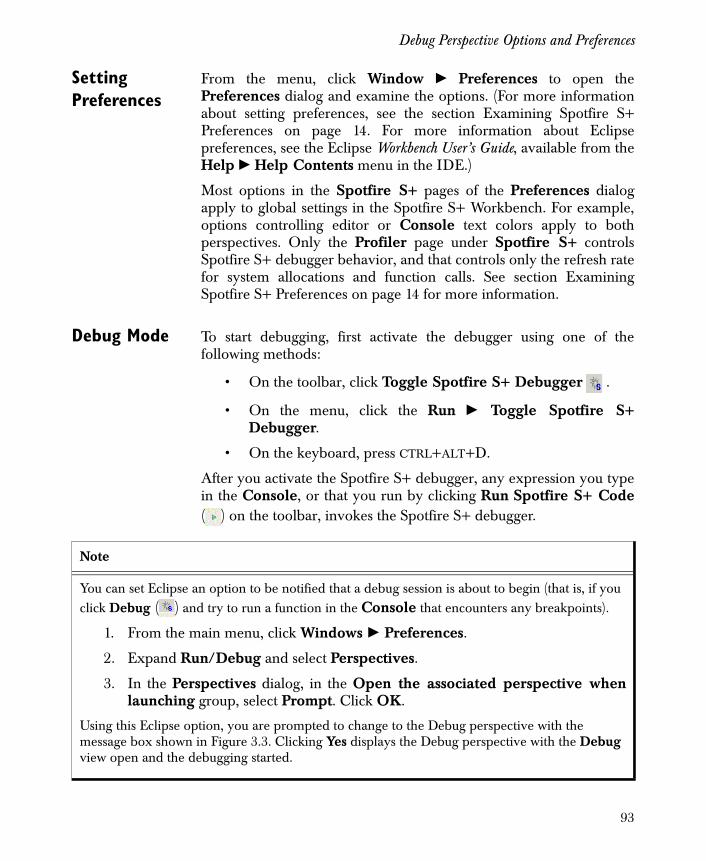
Debug Perspective Options and Preferences
Setting Preferences
From the menu, click Window � Preferences to open thePreferences dialog and examine the options. (For more informationabout setting preferences, see the section Examining Spotfire S+Preferences on page 14. For more information about Eclipsepreferences, see the Eclipse Workbench User’s Guide, available from theHelp � Help Contents menu in the IDE.)
Most options in the Spotfire S+ pages of the Preferences dialogapply to global settings in the Spotfire S+ Workbench. For example,options controlling editor or Console text colors apply to bothperspectives. Only the Profiler page under Spotfire S+ controlsSpotfire S+ debugger behavior, and that controls only the refresh ratefor system allocations and function calls. See section ExaminingSpotfire S+ Preferences on page 14 for more information.
Debug Mode To start debugging, first activate the debugger using one of thefollowing methods:
• On the toolbar, click Toggle Spotfire S+ Debugger .
• On the menu, click the Run � Toggle Spotfire S+Debugger.
• On the keyboard, press CTRL+ALT+D.
After you activate the Spotfire S+ debugger, any expression you typein the Console, or that you run by clicking Run Spotfire S+ Code( ) on the toolbar, invokes the Spotfire S+ debugger.
Note
You can set Eclipse an option to be notified that a debug session is about to begin (that is, if you click Debug ( ) and try to run a function in the Console that encounters any breakpoints).
1. From the main menu, click Windows � Preferences.
2. Expand Run/Debug and select Perspectives.
3. In the Perspectives dialog, in the Open the associated perspective whenlaunching group, select Prompt. Click OK.
Using this Eclipse option, you are prompted to change to the Debug perspective with the message box shown in Figure 3.3. Clicking Yes displays the Debug perspective with the Debug view open and the debugging started.
93
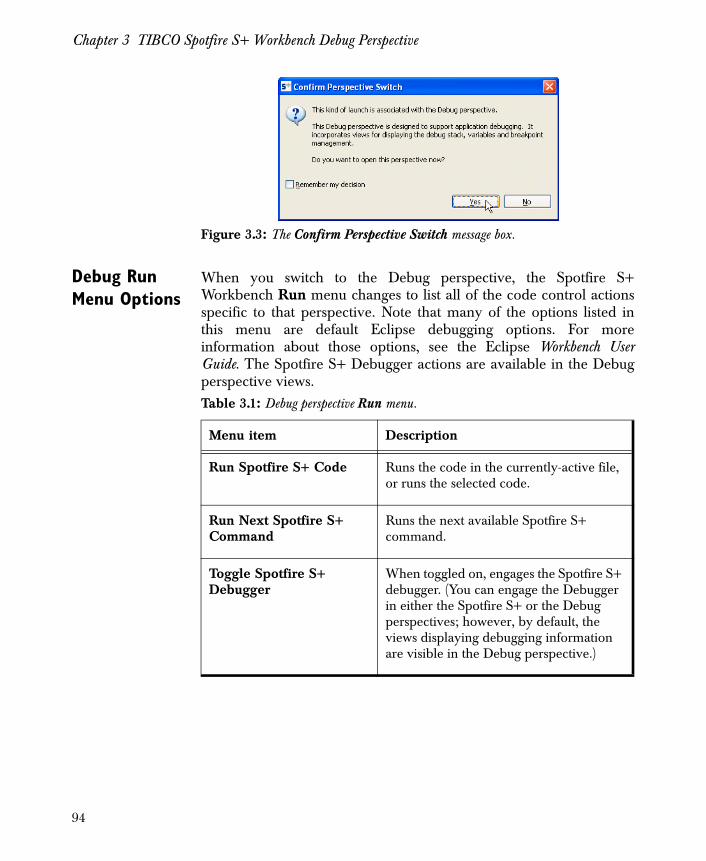
Chapter 3 TIBCO Spotfire S+ Workbench Debug Perspective
Debug Run Menu Options
When you switch to the Debug perspective, the Spotfire S+Workbench Run menu changes to list all of the code control actionsspecific to that perspective. Note that many of the options listed inthis menu are default Eclipse debugging options. For moreinformation about those options, see the Eclipse Workbench UserGuide. The Spotfire S+ Debugger actions are available in the Debugperspective views.
Figure 3.3: The Confirm Perspective Switch message box.
Table 3.1: Debug perspective Run menu.
Menu item Description
Run Spotfire S+ Code Runs the code in the currently-active file, or runs the selected code.
Run Next Spotfire S+ Command
Runs the next available Spotfire S+ command.
Toggle Spotfire S+ Debugger
When toggled on, engages the Spotfire S+ debugger. (You can engage the Debugger in either the Spotfire S+ or the Debug perspectives; however, by default, the views displaying debugging information are visible in the Debug perspective.)
94
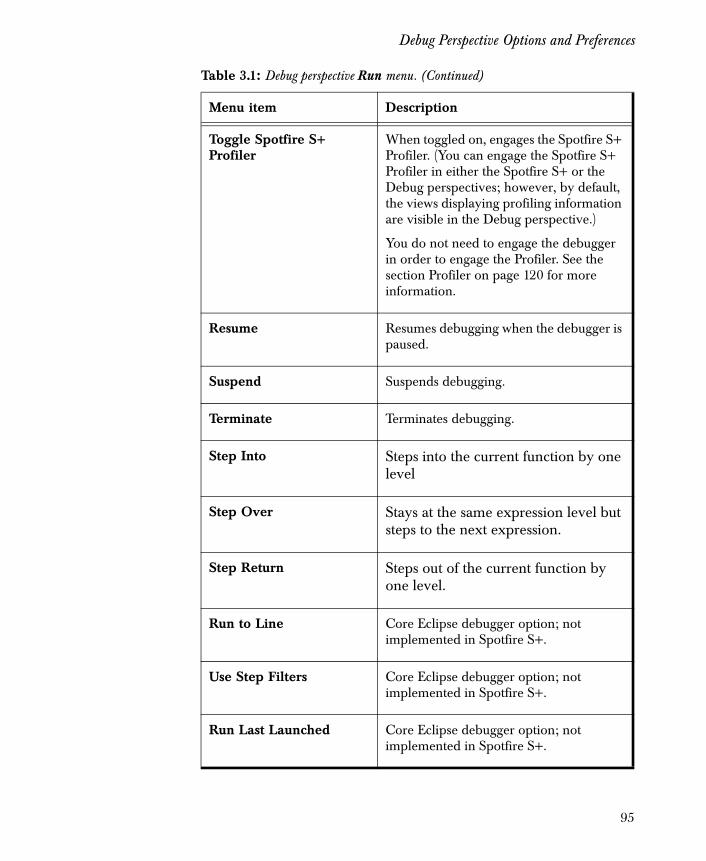
Debug Perspective Options and Preferences
Toggle Spotfire S+ Profiler
When toggled on, engages the Spotfire S+ Profiler. (You can engage the Spotfire S+ Profiler in either the Spotfire S+ or the Debug perspectives; however, by default, the views displaying profiling information are visible in the Debug perspective.)
You do not need to engage the debugger in order to engage the Profiler. See the section Profiler on page 120 for more information.
Resume Resumes debugging when the debugger is paused.
Suspend Suspends debugging.
Terminate Terminates debugging.
Step Into Steps into the current function by one level
Step Over Stays at the same expression level but steps to the next expression.
Step Return Steps out of the current function by one level.
Run to Line Core Eclipse debugger option; not implemented in Spotfire S+.
Use Step Filters Core Eclipse debugger option; not implemented in Spotfire S+.
Run Last Launched Core Eclipse debugger option; not implemented in Spotfire S+.
Table 3.1: Debug perspective Run menu. (Continued)
Menu item Description
95
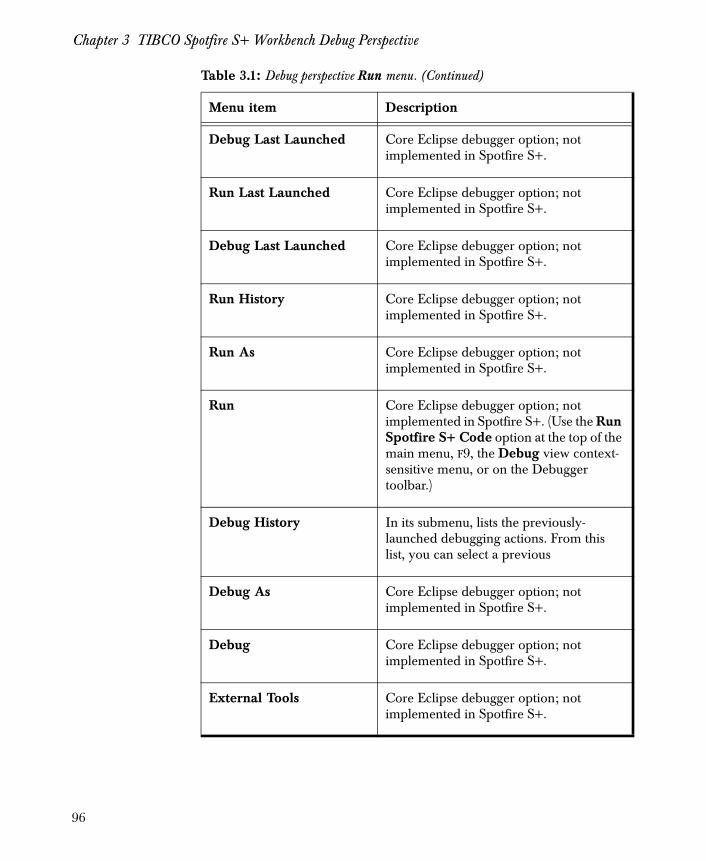
Chapter 3 TIBCO Spotfire S+ Workbench Debug Perspective
Debug Last Launched Core Eclipse debugger option; not implemented in Spotfire S+.
Run Last Launched Core Eclipse debugger option; not implemented in Spotfire S+.
Debug Last Launched Core Eclipse debugger option; not implemented in Spotfire S+.
Run History Core Eclipse debugger option; not implemented in Spotfire S+.
Run As Core Eclipse debugger option; not implemented in Spotfire S+.
Run Core Eclipse debugger option; not implemented in Spotfire S+. (Use the Run Spotfire S+ Code option at the top of the main menu, F9, the Debug view context-sensitive menu, or on the Debugger toolbar.)
Debug History In its submenu, lists the previously-launched debugging actions. From this list, you can select a previous
Debug As Core Eclipse debugger option; not implemented in Spotfire S+.
Debug Core Eclipse debugger option; not implemented in Spotfire S+.
External Tools Core Eclipse debugger option; not implemented in Spotfire S+.
Table 3.1: Debug perspective Run menu. (Continued)
Menu item Description
96
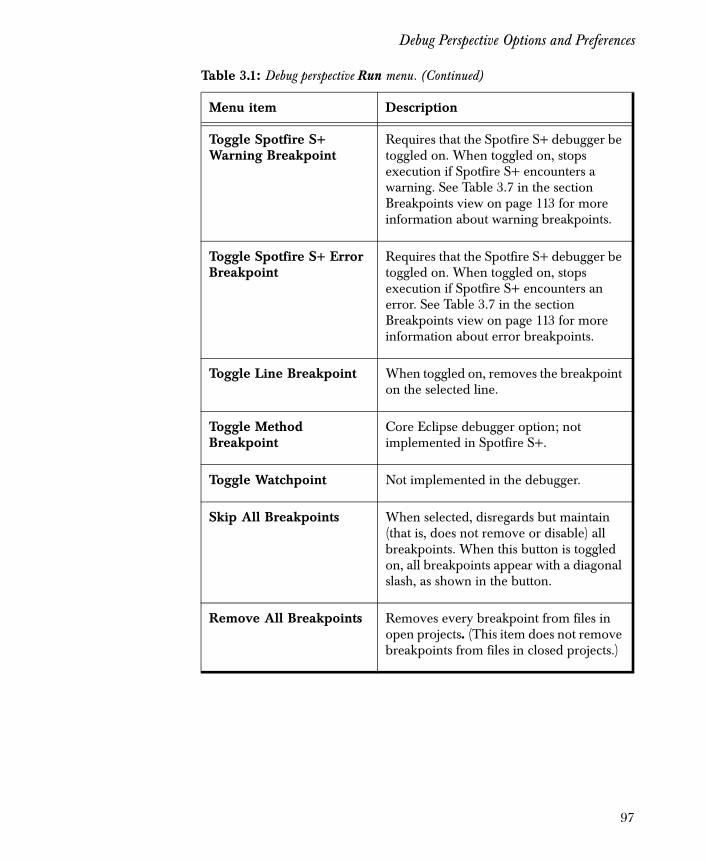
Debug Perspective Options and Preferences
Toggle Spotfire S+ Warning Breakpoint
Requires that the Spotfire S+ debugger be toggled on. When toggled on, stops execution if Spotfire S+ encounters a warning. See Table 3.7 in the section Breakpoints view on page 113 for more information about warning breakpoints.
Toggle Spotfire S+ Error Breakpoint
Requires that the Spotfire S+ debugger be toggled on. When toggled on, stops execution if Spotfire S+ encounters an error. See Table 3.7 in the section Breakpoints view on page 113 for more information about error breakpoints.
Toggle Line Breakpoint When toggled on, removes the breakpoint on the selected line.
Toggle Method Breakpoint
Core Eclipse debugger option; not implemented in Spotfire S+.
Toggle Watchpoint Not implemented in the debugger.
Skip All Breakpoints When selected, disregards but maintain (that is, does not remove or disable) all breakpoints. When this button is toggled on, all breakpoints appear with a diagonal slash, as shown in the button.
Remove All Breakpoints Removes every breakpoint from files in open projects. (This item does not remove breakpoints from files in closed projects.)
Table 3.1: Debug perspective Run menu. (Continued)
Menu item Description
97
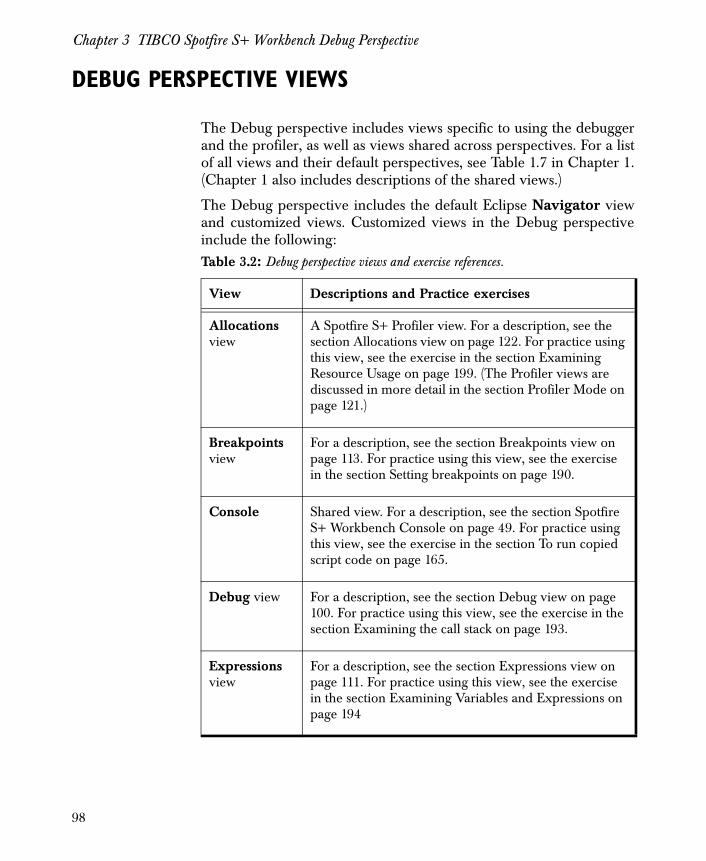
Chapter 3 TIBCO Spotfire S+ Workbench Debug Perspective
DEBUG PERSPECTIVE VIEWS
The Debug perspective includes views specific to using the debuggerand the profiler, as well as views shared across perspectives. For a listof all views and their default perspectives, see Table 1.7 in Chapter 1.(Chapter 1 also includes descriptions of the shared views.)
The Debug perspective includes the default Eclipse Navigator viewand customized views. Customized views in the Debug perspectiveinclude the following:Table 3.2: Debug perspective views and exercise references.
View Descriptions and Practice exercises
Allocations view
A Spotfire S+ Profiler view. For a description, see the section Allocations view on page 122. For practice using this view, see the exercise in the section Examining Resource Usage on page 199. (The Profiler views are discussed in more detail in the section Profiler Mode on page 121.)
Breakpoints view
For a description, see the section Breakpoints view on page 113. For practice using this view, see the exercise in the section Setting breakpoints on page 190.
Console Shared view. For a description, see the section Spotfire S+ Workbench Console on page 49. For practice using this view, see the exercise in the section To run copied script code on page 165.
Debug view For a description, see the section Debug view on page 100. For practice using this view, see the exercise in the section Examining the call stack on page 193.
Expressions view
For a description, see the section Expressions view on page 111. For practice using this view, see the exercise in the section Examining Variables and Expressions on page 194
98
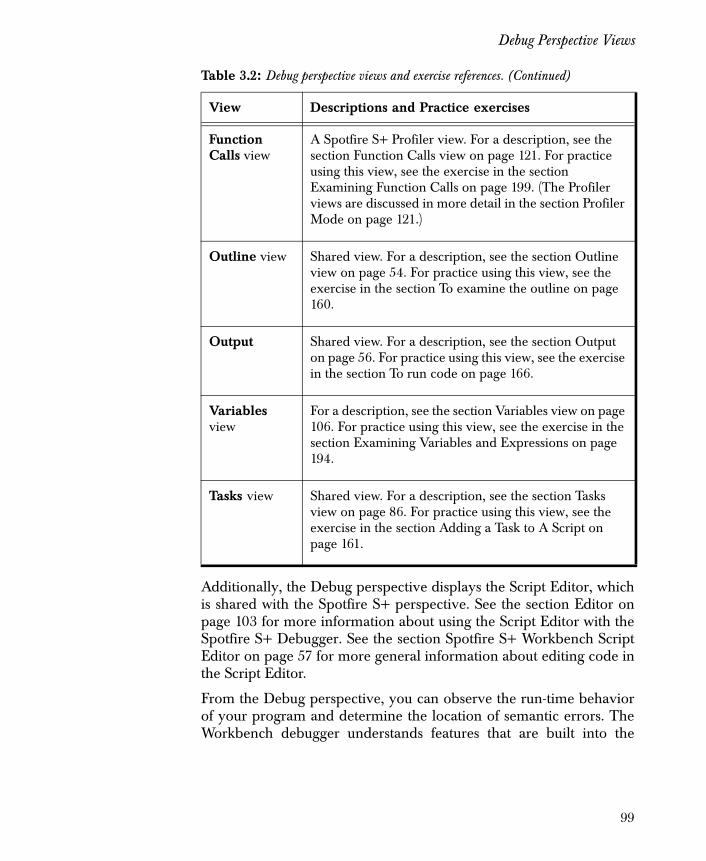
Debug Perspective Views
Additionally, the Debug perspective displays the Script Editor, whichis shared with the Spotfire S+ perspective. See the section Editor onpage 103 for more information about using the Script Editor with theSpotfire S+ Debugger. See the section Spotfire S+ Workbench ScriptEditor on page 57 for more general information about editing code inthe Script Editor.
From the Debug perspective, you can observe the run-time behaviorof your program and determine the location of semantic errors. TheWorkbench debugger understands features that are built into the
Function Calls view
A Spotfire S+ Profiler view. For a description, see the section Function Calls view on page 121. For practice using this view, see the exercise in the section Examining Function Calls on page 199. (The Profiler views are discussed in more detail in the section Profiler Mode on page 121.)
Outline view Shared view. For a description, see the section Outline view on page 54. For practice using this view, see the exercise in the section To examine the outline on page 160.
Output Shared view. For a description, see the section Output on page 56. For practice using this view, see the exercise in the section To run code on page 166.
Variables view
For a description, see the section Variables view on page 106. For practice using this view, see the exercise in the section Examining Variables and Expressions on page 194.
Tasks view Shared view. For a description, see the section Tasks view on page 86. For practice using this view, see the exercise in the section Adding a Task to A Script on page 161.
Table 3.2: Debug perspective views and exercise references. (Continued)
View Descriptions and Practice exercises
99
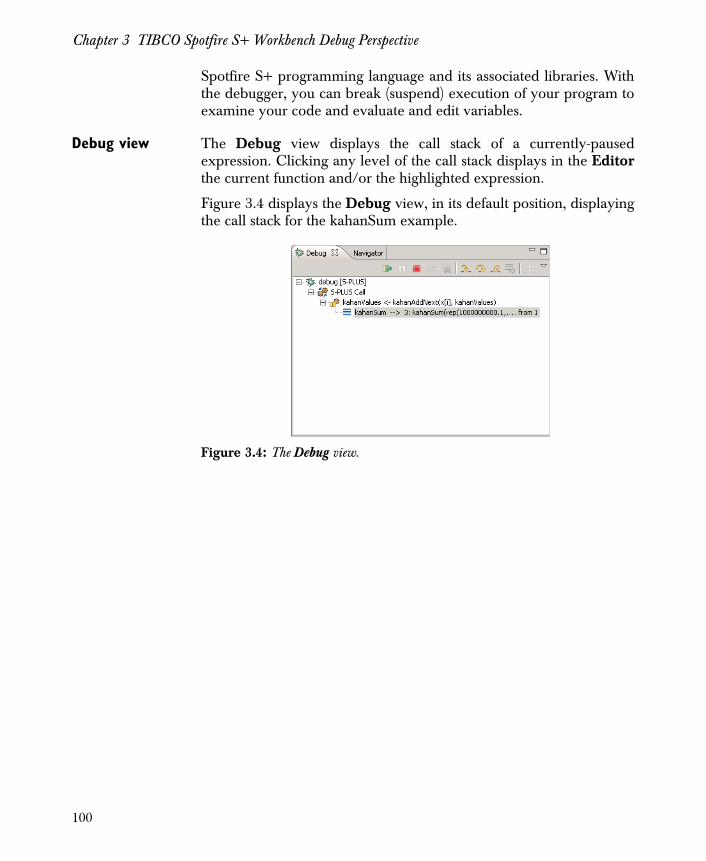
Chapter 3 TIBCO Spotfire S+ Workbench Debug Perspective
Spotfire S+ programming language and its associated libraries. Withthe debugger, you can break (suspend) execution of your program toexamine your code and evaluate and edit variables.
Debug view The Debug view displays the call stack of a currently-pausedexpression. Clicking any level of the call stack displays in the Editorthe current function and/or the highlighted expression.
Figure 3.4 displays the Debug view, in its default position, displayingthe call stack for the kahanSum example.
Figure 3.4: The Debug view.
100
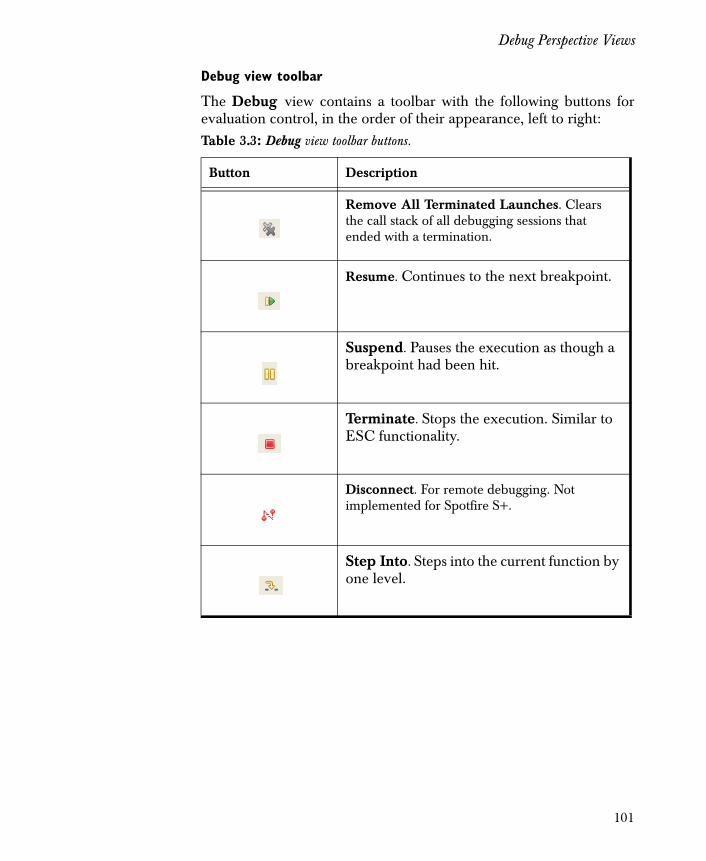
Debug Perspective Views
Debug view toolbar
The Debug view contains a toolbar with the following buttons forevaluation control, in the order of their appearance, left to right:Table 3.3: Debug view toolbar buttons.
Button Description
Remove All Terminated Launches. Clears the call stack of all debugging sessions that ended with a termination.
Resume. Continues to the next breakpoint.
Suspend. Pauses the execution as though a breakpoint had been hit.
Terminate. Stops the execution. Similar to ESC functionality.
Disconnect. For remote debugging. Not implemented for Spotfire S+.
Step Into. Steps into the current function by one level.
101
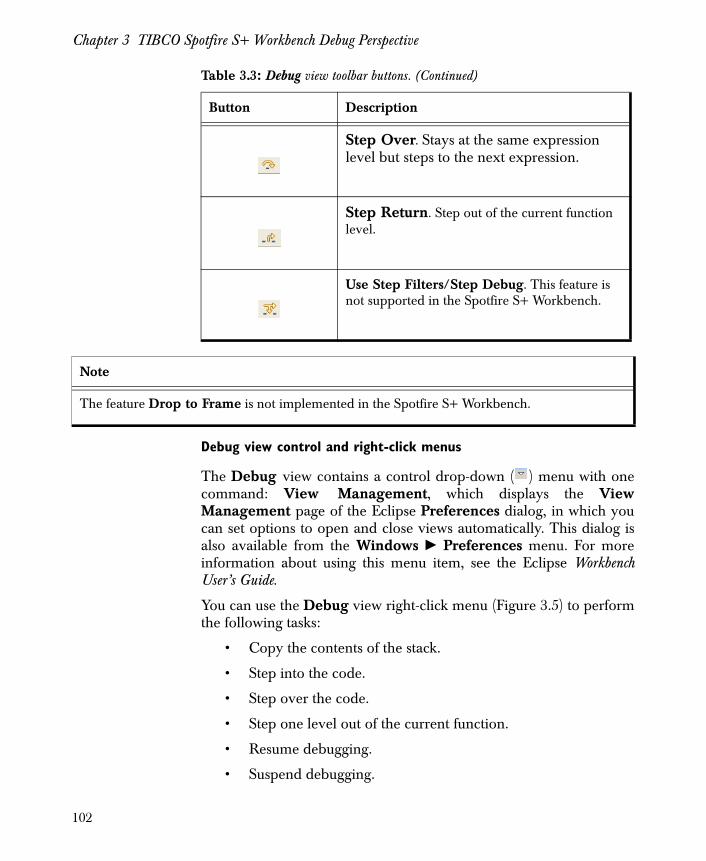
Chapter 3 TIBCO Spotfire S+ Workbench Debug Perspective
Debug view control and right-click menus
The Debug view contains a control drop-down ( ) menu with onecommand: View Management, which displays the ViewManagement page of the Eclipse Preferences dialog, in which youcan set options to open and close views automatically. This dialog isalso available from the Windows � Preferences menu. For moreinformation about using this menu item, see the Eclipse WorkbenchUser’s Guide.
You can use the Debug view right-click menu (Figure 3.5) to performthe following tasks:
• Copy the contents of the stack.
• Step into the code.
• Step over the code.
• Step one level out of the current function.
• Resume debugging.
• Suspend debugging.
Step Over. Stays at the same expression level but steps to the next expression.
Step Return. Step out of the current function level.
Use Step Filters/Step Debug. This feature is not supported in the Spotfire S+ Workbench.
Table 3.3: Debug view toolbar buttons. (Continued)
Button Description
Note
The feature Drop to Frame is not implemented in the Spotfire S+ Workbench.
102
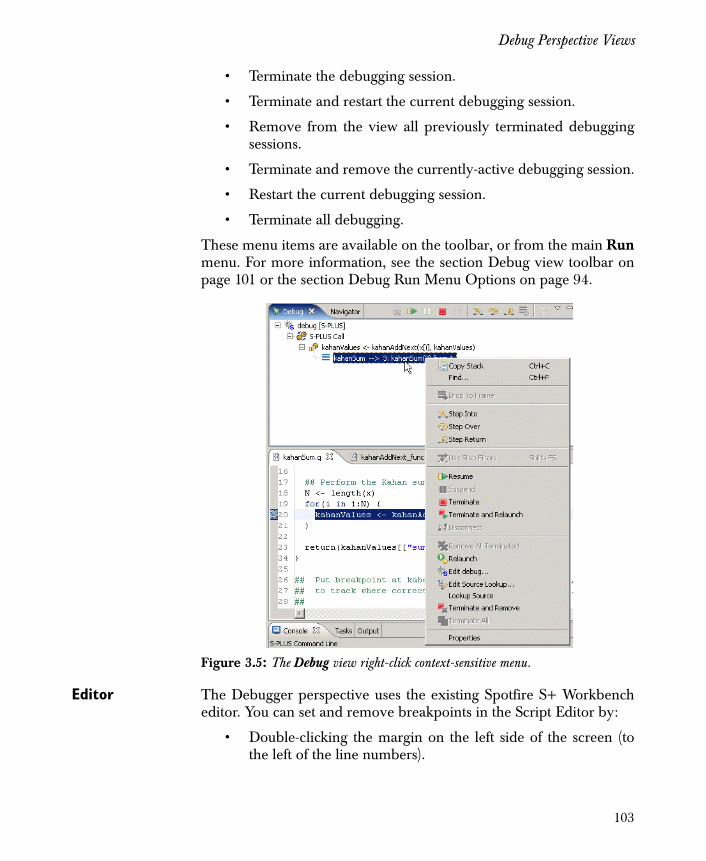
Debug Perspective Views
• Terminate the debugging session.
• Terminate and restart the current debugging session.
• Remove from the view all previously terminated debuggingsessions.
• Terminate and remove the currently-active debugging session.
• Restart the current debugging session.
• Terminate all debugging.
These menu items are available on the toolbar, or from the main Runmenu. For more information, see the section Debug view toolbar onpage 101 or the section Debug Run Menu Options on page 94.
Editor The Debugger perspective uses the existing Spotfire S+ Workbencheditor. You can set and remove breakpoints in the Script Editor by:
• Double-clicking the margin on the left side of the screen (tothe left of the line numbers).
Figure 3.5: The Debug view right-click context-sensitive menu.
103
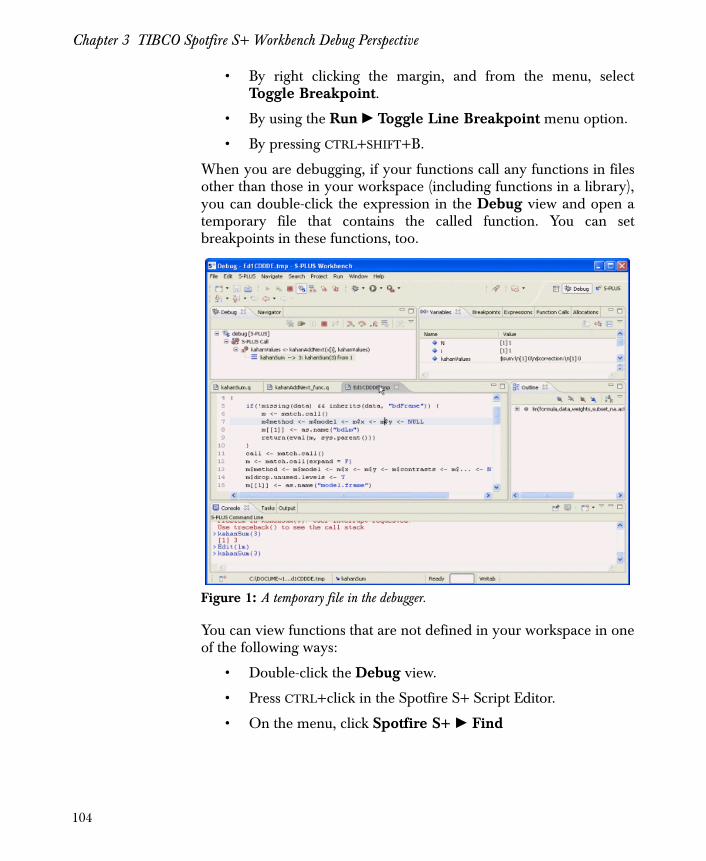
Chapter 3 TIBCO Spotfire S+ Workbench Debug Perspective
• By right clicking the margin, and from the menu, selectToggle Breakpoint.
• By using the Run � Toggle Line Breakpoint menu option.
• By pressing CTRL+SHIFT+B.
When you are debugging, if your functions call any functions in filesother than those in your workspace (including functions in a library),you can double-click the expression in the Debug view and open atemporary file that contains the called function. You can setbreakpoints in these functions, too.
You can view functions that are not defined in your workspace in oneof the following ways:
• Double-click the Debug view.
• Press CTRL+click in the Spotfire S+ Script Editor.
• On the menu, click Spotfire S+ � Find
Figure 1: A temporary file in the debugger.
104
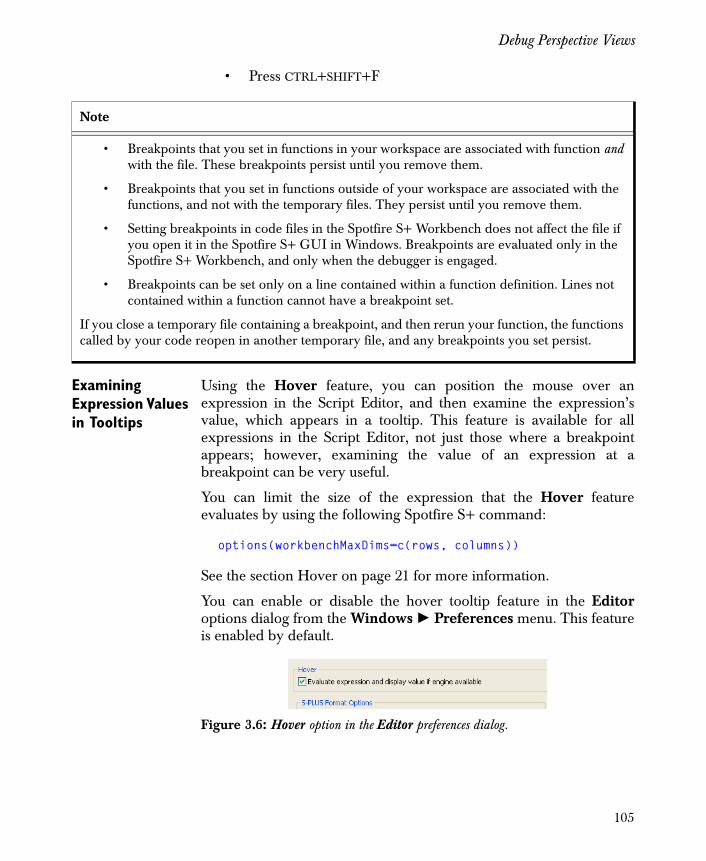
Debug Perspective Views
• Press CTRL+SHIFT+F
Examining Expression Values in Tooltips
Using the Hover feature, you can position the mouse over anexpression in the Script Editor, and then examine the expression’svalue, which appears in a tooltip. This feature is available for allexpressions in the Script Editor, not just those where a breakpointappears; however, examining the value of an expression at abreakpoint can be very useful.
You can limit the size of the expression that the Hover featureevaluates by using the following Spotfire S+ command:
options(workbenchMaxDims=c(rows, columns))
See the section Hover on page 21 for more information.
You can enable or disable the hover tooltip feature in the Editoroptions dialog from the Windows � Preferences menu. This featureis enabled by default.
Note
• Breakpoints that you set in functions in your workspace are associated with function and with the file. These breakpoints persist until you remove them.
• Breakpoints that you set in functions outside of your workspace are associated with the functions, and not with the temporary files. They persist until you remove them.
• Setting breakpoints in code files in the Spotfire S+ Workbench does not affect the file if you open it in the Spotfire S+ GUI in Windows. Breakpoints are evaluated only in the Spotfire S+ Workbench, and only when the debugger is engaged.
• Breakpoints can be set only on a line contained within a function definition. Lines not contained within a function cannot have a breakpoint set.
If you close a temporary file containing a breakpoint, and then rerun your function, the functions called by your code reopen in another temporary file, and any breakpoints you set persist.
Figure 3.6: Hover option in the Editor preferences dialog.
105
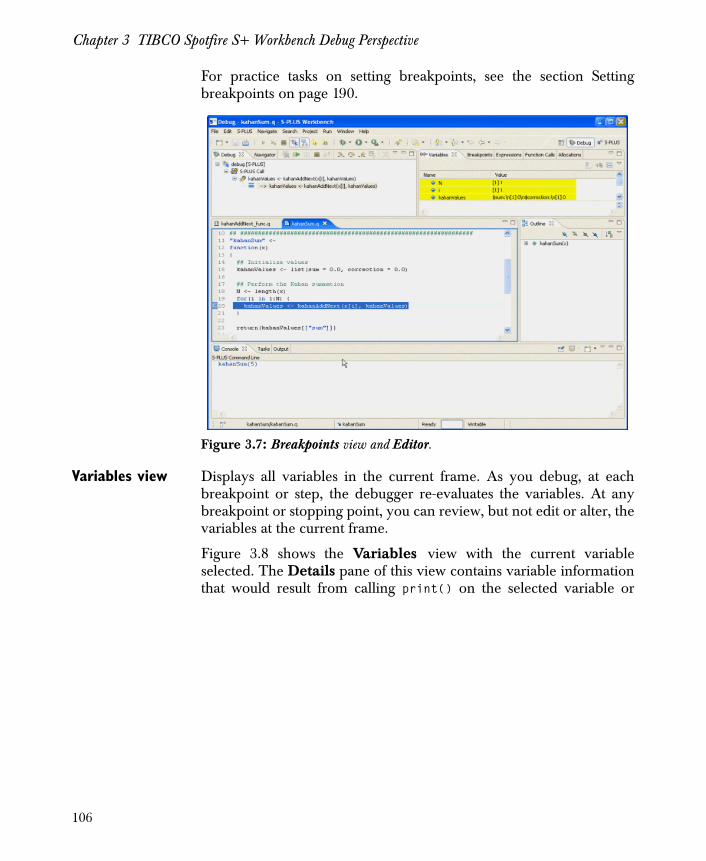
Chapter 3 TIBCO Spotfire S+ Workbench Debug Perspective
For practice tasks on setting breakpoints, see the section Settingbreakpoints on page 190.
Variables view Displays all variables in the current frame. As you debug, at eachbreakpoint or step, the debugger re-evaluates the variables. At anybreakpoint or stopping point, you can review, but not edit or alter, thevariables at the current frame.
Figure 3.8 shows the Variables view with the current variableselected. The Details pane of this view contains variable informationthat would result from calling print() on the selected variable or
Figure 3.7: Breakpoints view and Editor.
106
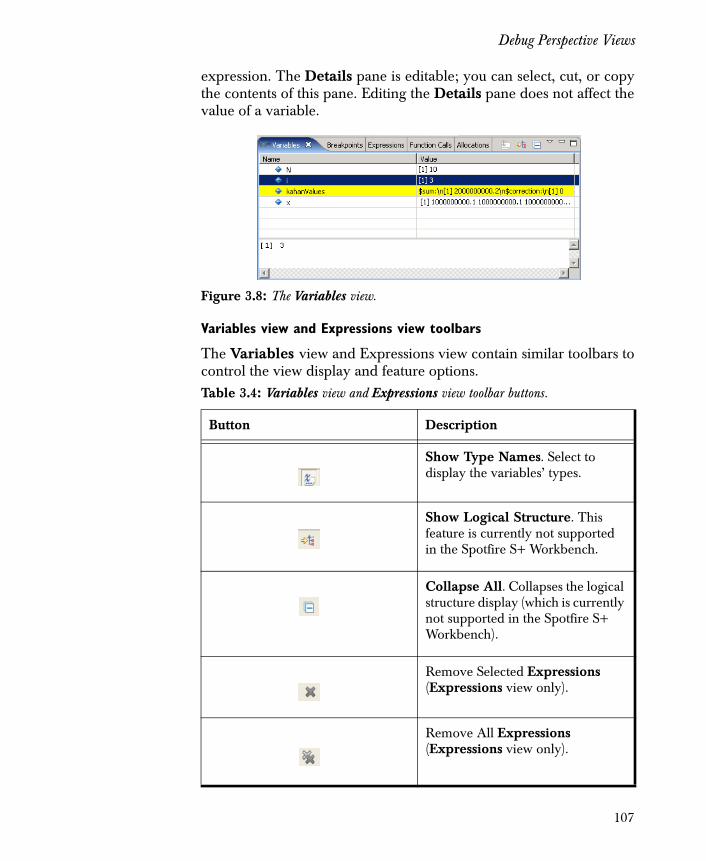
Debug Perspective Views
expression. The Details pane is editable; you can select, cut, or copythe contents of this pane. Editing the Details pane does not affect thevalue of a variable.
Variables view and Expressions view toolbars
The Variables view and Expressions view contain similar toolbars tocontrol the view display and feature options.
Figure 3.8: The Variables view.
Table 3.4: Variables view and Expressions view toolbar buttons.
Button Description
Show Type Names. Select to display the variables’ types.
Show Logical Structure. This feature is currently not supported in the Spotfire S+ Workbench.
Collapse All. Collapses the logical structure display (which is currently not supported in the Spotfire S+ Workbench).
Remove Selected Expressions (Expressions view only).
Remove All Expressions (Expressions view only).
107
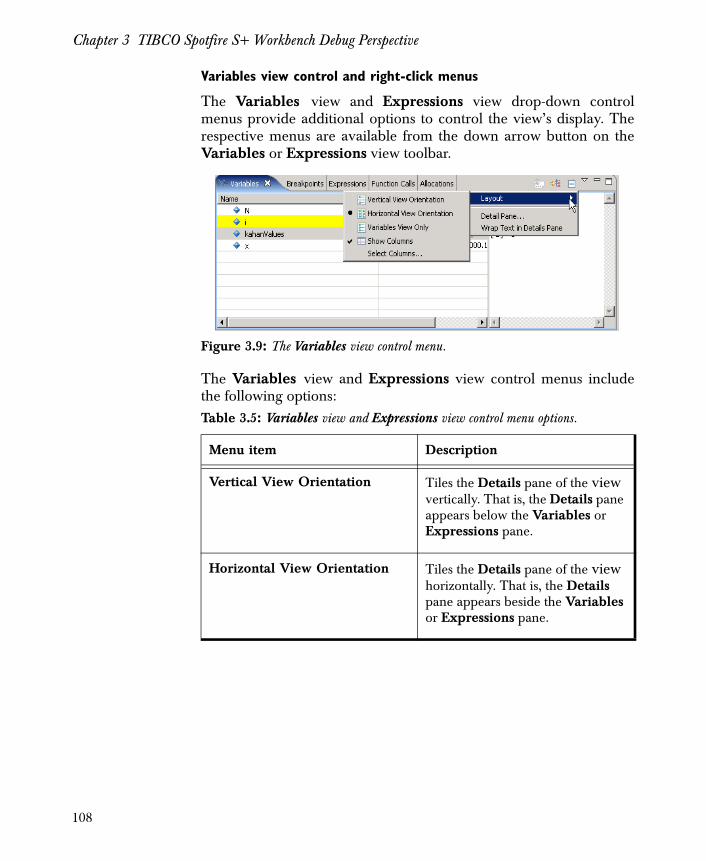
Chapter 3 TIBCO Spotfire S+ Workbench Debug Perspective
Variables view control and right-click menus
The Variables view and Expressions view drop-down controlmenus provide additional options to control the view’s display. Therespective menus are available from the down arrow button on theVariables or Expressions view toolbar.
The Variables view and Expressions view control menus includethe following options:
Figure 3.9: The Variables view control menu.
Table 3.5: Variables view and Expressions view control menu options.
Menu item Description
Vertical View Orientation Tiles the Details pane of the view vertically. That is, the Details pane appears below the Variables or Expressions pane.
Horizontal View Orientation Tiles the Details pane of the view horizontally. That is, the Details pane appears beside the Variables or Expressions pane.
108
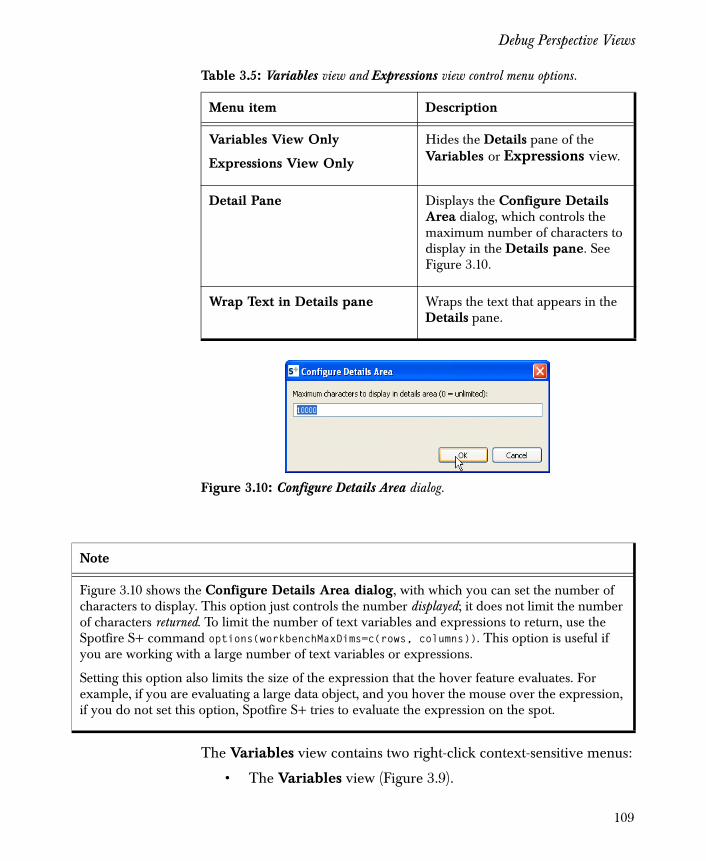
Debug Perspective Views
The Variables view contains two right-click context-sensitive menus:
• The Variables view (Figure 3.9).
Variables View Only
Expressions View Only
Hides the Details pane of the Variables or Expressions view.
Detail Pane Displays the Configure Details Area dialog, which controls the maximum number of characters to display in the Details pane. See Figure 3.10.
Wrap Text in Details pane Wraps the text that appears in the Details pane.
Figure 3.10: Configure Details Area dialog.
Table 3.5: Variables view and Expressions view control menu options.
Menu item Description
Note
Figure 3.10 shows the Configure Details Area dialog, with which you can set the number of characters to display. This option just controls the number displayed; it does not limit the number of characters returned. To limit the number of text variables and expressions to return, use the Spotfire S+ command options(workbenchMaxDims=c(rows, columns)). This option is useful if you are working with a large number of text variables or expressions.
Setting this option also limits the size of the expression that the hover feature evaluates. For example, if you are evaluating a large data object, and you hover the mouse over the expression, if you do not set this option, Spotfire S+ tries to evaluate the expression on the spot.
109
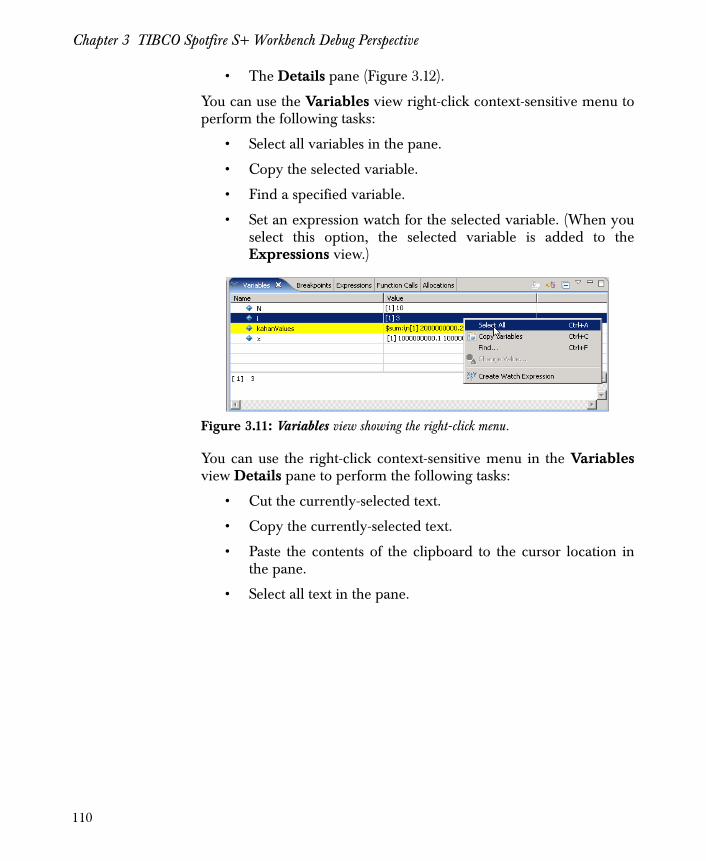
Chapter 3 TIBCO Spotfire S+ Workbench Debug Perspective
• The Details pane (Figure 3.12).
You can use the Variables view right-click context-sensitive menu toperform the following tasks:
• Select all variables in the pane.
• Copy the selected variable.
• Find a specified variable.
• Set an expression watch for the selected variable. (When youselect this option, the selected variable is added to theExpressions view.)
You can use the right-click context-sensitive menu in the Variablesview Details pane to perform the following tasks:
• Cut the currently-selected text.
• Copy the currently-selected text.
• Paste the contents of the clipboard to the cursor location inthe pane.
• Select all text in the pane.
Figure 3.11: Variables view showing the right-click menu.
110
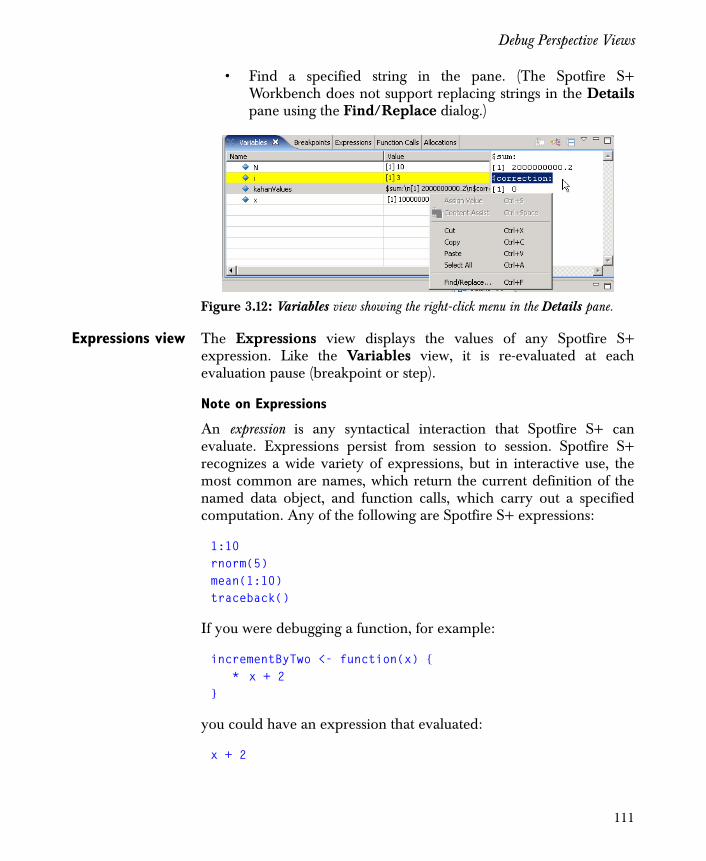
Debug Perspective Views
• Find a specified string in the pane. (The Spotfire S+Workbench does not support replacing strings in the Detailspane using the Find/Replace dialog.)
Expressions view The Expressions view displays the values of any Spotfire S+expression. Like the Variables view, it is re-evaluated at eachevaluation pause (breakpoint or step).
Note on Expressions
An expression is any syntactical interaction that Spotfire S+ canevaluate. Expressions persist from session to session. Spotfire S+recognizes a wide variety of expressions, but in interactive use, themost common are names, which return the current definition of thenamed data object, and function calls, which carry out a specifiedcomputation. Any of the following are Spotfire S+ expressions:
1:10rnorm(5)mean(1:10)traceback()
If you were debugging a function, for example:
incrementByTwo <- function(x) { * x + 2}
you could have an expression that evaluated:
x + 2
Figure 3.12: Variables view showing the right-click menu in the Details pane.
111
Chapter 3 TIBCO Spotfire S+ Workbench Debug Perspective
at the breakpoint (denoted with the * in the above functiondefinition).
For more information about expressions, see the Programmer’s Guide,or see the Spotfire S+ Help topic ExpressionLanguage.
The Expressions view toolbar buttons are the same as those of theVariables view, with the addition of the Remove and Remove Allbuttons. See Table 3.4 for more information.
The Expressions view contains two right-click context-sensitivemenus:
• The Expressions view (Figure 3.13)
• The Details pane (Figure 3.12).
You can use the Expressions view right-click context-sensitive menuto perform the following tasks:
• Select all expressions in the pane.
• Copy the selected expression.
• Remove the selected expression.
• Remove all expressions in the view.
• Add an expression to watch (opens the Add WatchExpression dialog, in which you can provide an expressionand indicate whether to enable or disable it).
• Re-evaluate the expressions.
• Disable the currently-selected expression.
• Enable the currently-selected expression (if it was previouslydisabled).
Note
If you leave in the Expressions view expressions that are no longer in scope for your current debugging session, you might notice that the debugger slows significantly to evaluate the expression that is no longer in scope. To keep the debugger from slowing down, remove expressions that are no longer in scope for your current debugging session.
112
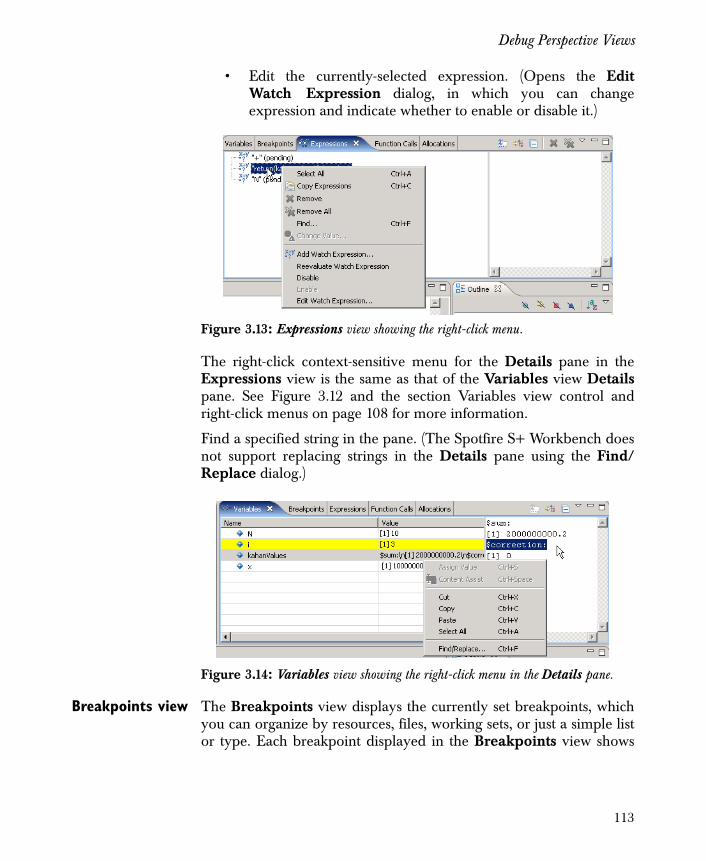
Debug Perspective Views
• Edit the currently-selected expression. (Opens the EditWatch Expression dialog, in which you can changeexpression and indicate whether to enable or disable it.)
The right-click context-sensitive menu for the Details pane in theExpressions view is the same as that of the Variables view Detailspane. See Figure 3.12 and the section Variables view control andright-click menus on page 108 for more information.
Find a specified string in the pane. (The Spotfire S+ Workbench doesnot support replacing strings in the Details pane using the Find/Replace dialog.)
Breakpoints view The Breakpoints view displays the currently set breakpoints, whichyou can organize by resources, files, working sets, or just a simple listor type. Each breakpoint displayed in the Breakpoints view shows
Figure 3.13: Expressions view showing the right-click menu.
Figure 3.14: Variables view showing the right-click menu in the Details pane.
113
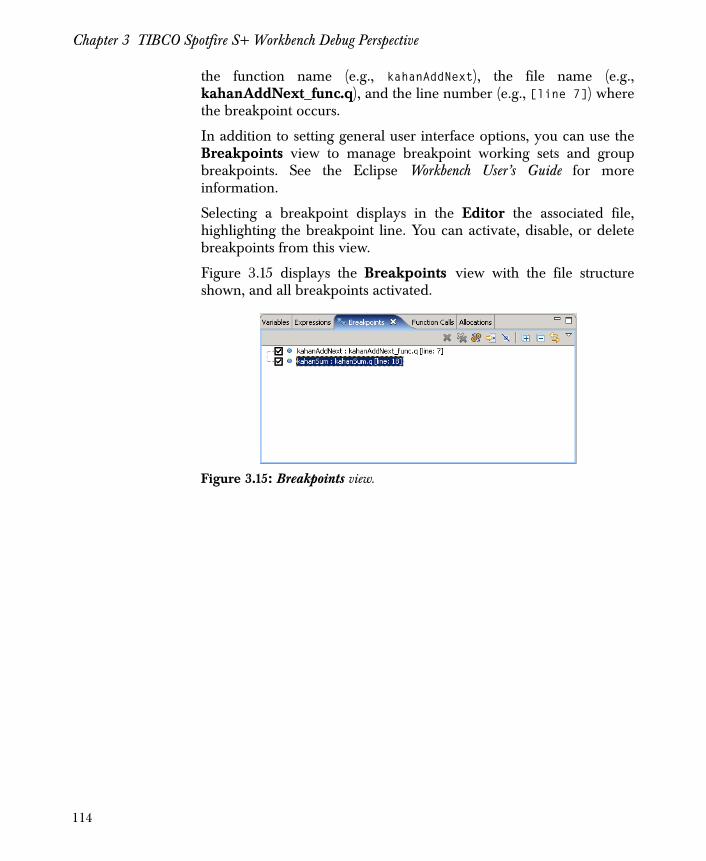
Chapter 3 TIBCO Spotfire S+ Workbench Debug Perspective
the function name (e.g., kahanAddNext), the file name (e.g.,kahanAddNext_func.q), and the line number (e.g., [line 7]) wherethe breakpoint occurs.
In addition to setting general user interface options, you can use theBreakpoints view to manage breakpoint working sets and groupbreakpoints. See the Eclipse Workbench User’s Guide for moreinformation.
Selecting a breakpoint displays in the Editor the associated file,highlighting the breakpoint line. You can activate, disable, or deletebreakpoints from this view.
Figure 3.15 displays the Breakpoints view with the file structureshown, and all breakpoints activated.
Figure 3.15: Breakpoints view.
114
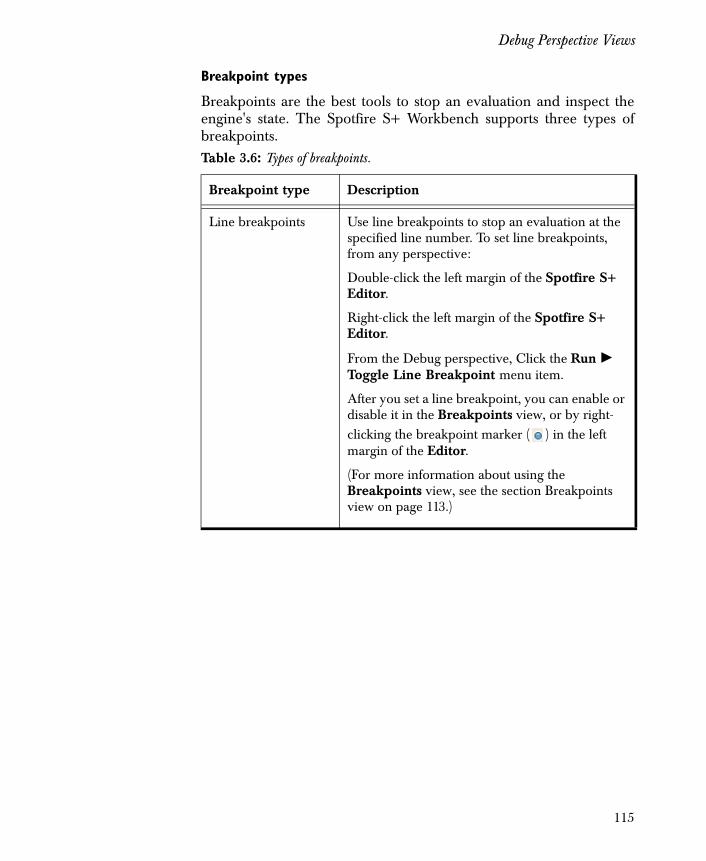
Debug Perspective Views
Breakpoint types
Breakpoints are the best tools to stop an evaluation and inspect theengine's state. The Spotfire S+ Workbench supports three types ofbreakpoints. Table 3.6: Types of breakpoints.
Breakpoint type Description
Line breakpoints Use line breakpoints to stop an evaluation at the specified line number. To set line breakpoints, from any perspective:
Double-click the left margin of the Spotfire S+ Editor.
Right-click the left margin of the Spotfire S+ Editor.
From the Debug perspective, Click the Run � Toggle Line Breakpoint menu item.
After you set a line breakpoint, you can enable or disable it in the Breakpoints view, or by right-clicking the breakpoint marker ( ) in the left margin of the Editor.
(For more information about using the Breakpoints view, see the section Breakpoints view on page 113.)
115
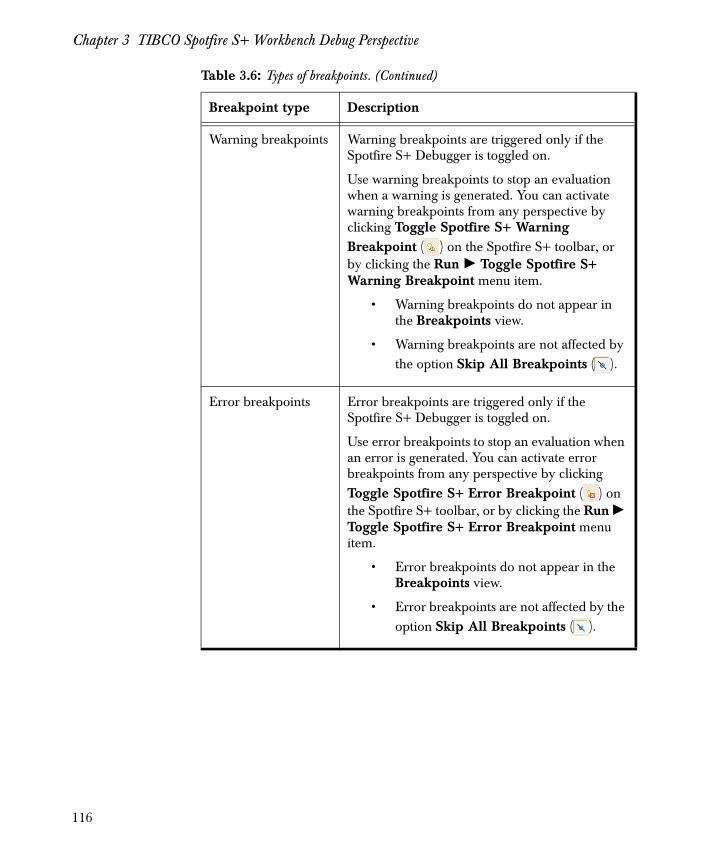
Chapter 3 TIBCO Spotfire S+ Workbench Debug Perspective
Warning breakpoints Warning breakpoints are triggered only if the Spotfire S+ Debugger is toggled on.
Use warning breakpoints to stop an evaluation when a warning is generated. You can activate warning breakpoints from any perspective by clicking Toggle Spotfire S+ Warning Breakpoint ( ) on the Spotfire S+ toolbar, or by clicking the Run � Toggle Spotfire S+ Warning Breakpoint menu item.
• Warning breakpoints do not appear in the Breakpoints view.
• Warning breakpoints are not affected by the option Skip All Breakpoints ( ).
Error breakpoints Error breakpoints are triggered only if the Spotfire S+ Debugger is toggled on.
Use error breakpoints to stop an evaluation when an error is generated. You can activate error breakpoints from any perspective by clicking Toggle Spotfire S+ Error Breakpoint ( ) on the Spotfire S+ toolbar, or by clicking the Run � Toggle Spotfire S+ Error Breakpoint menu item.
• Error breakpoints do not appear in the Breakpoints view.
• Error breakpoints are not affected by the option Skip All Breakpoints ( ).
Table 3.6: Types of breakpoints. (Continued)
Breakpoint type Description
116
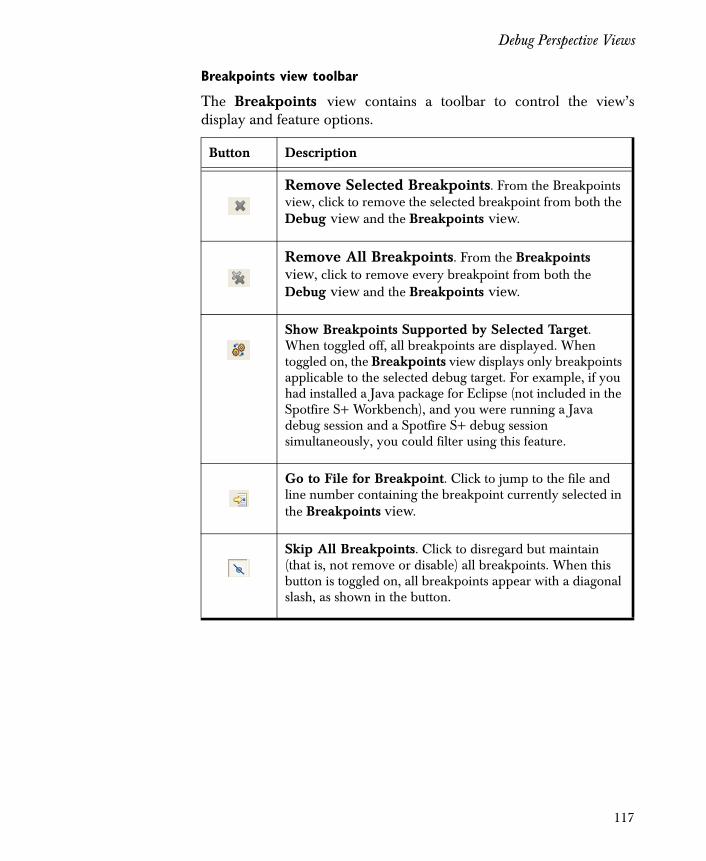
Debug Perspective Views
Breakpoints view toolbar
The Breakpoints view contains a toolbar to control the view’sdisplay and feature options.
Button Description
Remove Selected Breakpoints. From the Breakpoints view, click to remove the selected breakpoint from both the Debug view and the Breakpoints view.
Remove All Breakpoints. From the Breakpoints view, click to remove every breakpoint from both the Debug view and the Breakpoints view.
Show Breakpoints Supported by Selected Target. When toggled off, all breakpoints are displayed. When toggled on, the Breakpoints view displays only breakpoints applicable to the selected debug target. For example, if you had installed a Java package for Eclipse (not included in the Spotfire S+ Workbench), and you were running a Java debug session and a Spotfire S+ debug session simultaneously, you could filter using this feature.
Go to File for Breakpoint. Click to jump to the file and line number containing the breakpoint currently selected in the Breakpoints view.
Skip All Breakpoints. Click to disregard but maintain (that is, not remove or disable) all breakpoints. When this button is toggled on, all breakpoints appear with a diagonal slash, as shown in the button.
117
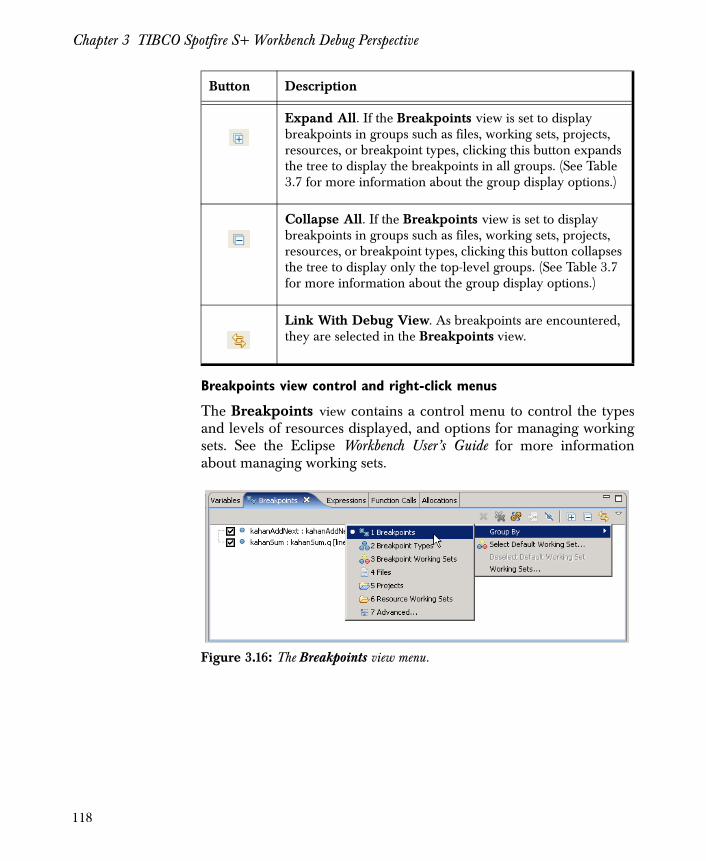
Chapter 3 TIBCO Spotfire S+ Workbench Debug Perspective
Breakpoints view control and right-click menus
The Breakpoints view contains a control menu to control the typesand levels of resources displayed, and options for managing workingsets. See the Eclipse Workbench User’s Guide for more informationabout managing working sets.
Expand All. If the Breakpoints view is set to display breakpoints in groups such as files, working sets, projects, resources, or breakpoint types, clicking this button expands the tree to display the breakpoints in all groups. (See Table 3.7 for more information about the group display options.)
Collapse All. If the Breakpoints view is set to display breakpoints in groups such as files, working sets, projects, resources, or breakpoint types, clicking this button collapses the tree to display only the top-level groups. (See Table 3.7 for more information about the group display options.)
Link With Debug View. As breakpoints are encountered, they are selected in the Breakpoints view.
Figure 3.16: The Breakpoints view menu.
Button Description
118
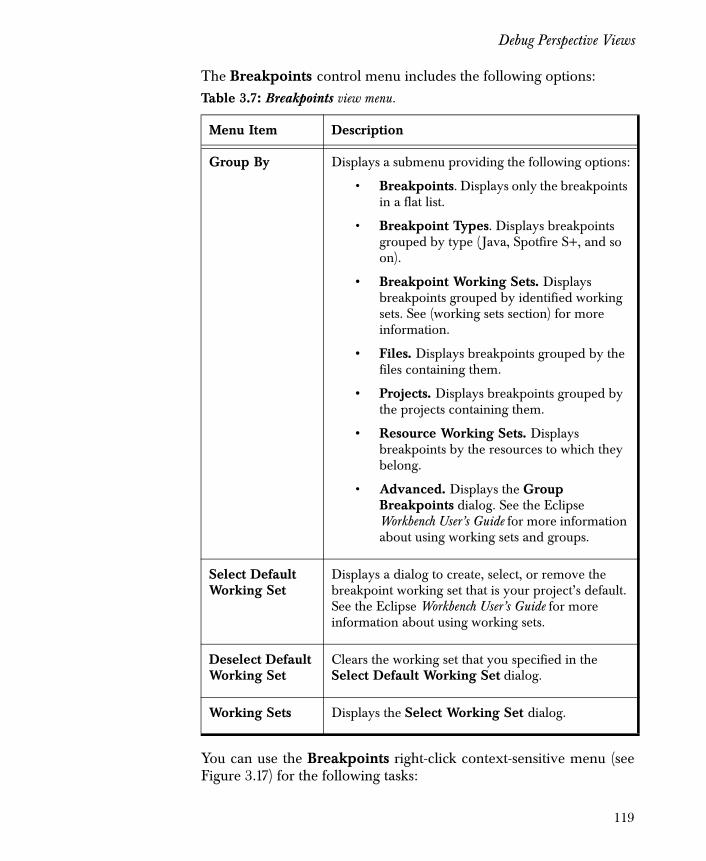
Debug Perspective Views
The Breakpoints control menu includes the following options:
You can use the Breakpoints right-click context-sensitive menu (seeFigure 3.17) for the following tasks:
Table 3.7: Breakpoints view menu.
Menu Item Description
Group By Displays a submenu providing the following options:
• Breakpoints. Displays only the breakpoints in a flat list.
• Breakpoint Types. Displays breakpoints grouped by type ( Java, Spotfire S+, and so on).
• Breakpoint Working Sets. Displays breakpoints grouped by identified working sets. See (working sets section) for more information.
• Files. Displays breakpoints grouped by the files containing them.
• Projects. Displays breakpoints grouped by the projects containing them.
• Resource Working Sets. Displays breakpoints by the resources to which they belong.
• Advanced. Displays the Group Breakpoints dialog. See the Eclipse Workbench User’s Guide for more information about using working sets and groups.
Select Default Working Set
Displays a dialog to create, select, or remove the breakpoint working set that is your project’s default. See the Eclipse Workbench User’s Guide for more information about using working sets.
Deselect Default Working Set
Clears the working set that you specified in the Select Default Working Set dialog.
Working Sets Displays the Select Working Set dialog.
119
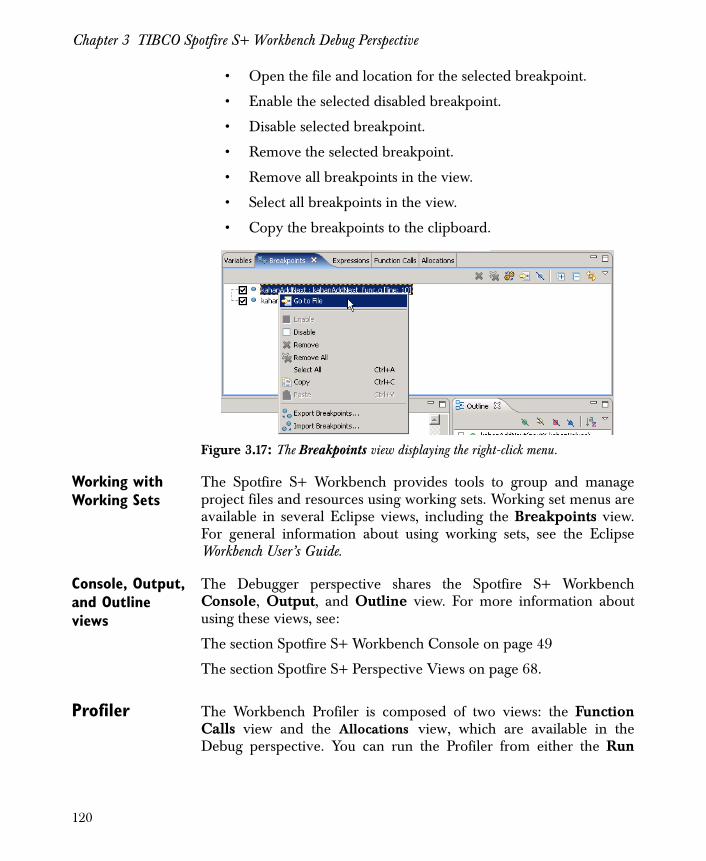
Chapter 3 TIBCO Spotfire S+ Workbench Debug Perspective
• Open the file and location for the selected breakpoint.
• Enable the selected disabled breakpoint.
• Disable selected breakpoint.
• Remove the selected breakpoint.
• Remove all breakpoints in the view.
• Select all breakpoints in the view.
• Copy the breakpoints to the clipboard.
Working with Working Sets
The Spotfire S+ Workbench provides tools to group and manageproject files and resources using working sets. Working set menus areavailable in several Eclipse views, including the Breakpoints view.For general information about using working sets, see the EclipseWorkbench User’s Guide.
Console, Output, and Outline views
The Debugger perspective shares the Spotfire S+ WorkbenchConsole, Output, and Outline view. For more information aboutusing these views, see:
The section Spotfire S+ Workbench Console on page 49
The section Spotfire S+ Perspective Views on page 68.
Profiler The Workbench Profiler is composed of two views: the FunctionCalls view and the Allocations view, which are available in theDebug perspective. You can run the Profiler from either the Run
Figure 3.17: The Breakpoints view displaying the right-click menu.
120
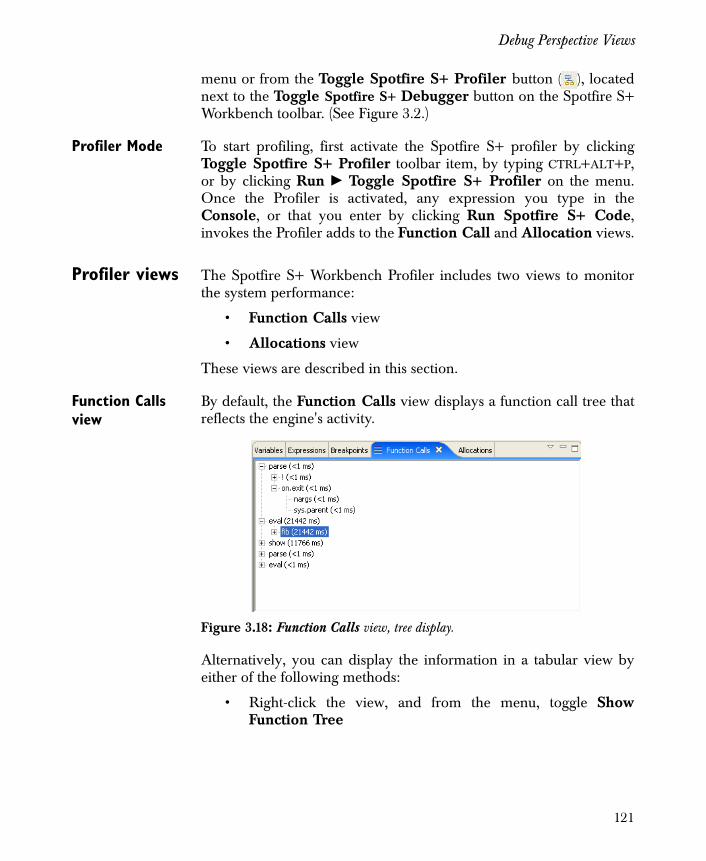
Debug Perspective Views
menu or from the Toggle Spotfire S+ Profiler button ( ), locatednext to the Toggle Spotfire S+ Debugger button on the Spotfire S+Workbench toolbar. (See Figure 3.2.)
Profiler Mode To start profiling, first activate the Spotfire S+ profiler by clickingToggle Spotfire S+ Profiler toolbar item, by typing CTRL+ALT+P,or by clicking Run � Toggle Spotfire S+ Profiler on the menu.Once the Profiler is activated, any expression you type in theConsole, or that you enter by clicking Run Spotfire S+ Code,invokes the Profiler adds to the Function Call and Allocation views.
Profiler views The Spotfire S+ Workbench Profiler includes two views to monitorthe system performance:
• Function Calls view
• Allocations view
These views are described in this section.
Function Calls view
By default, the Function Calls view displays a function call tree thatreflects the engine's activity.
Alternatively, you can display the information in a tabular view byeither of the following methods:
• Right-click the view, and from the menu, toggle ShowFunction Tree
Figure 3.18: Function Calls view, tree display.
121
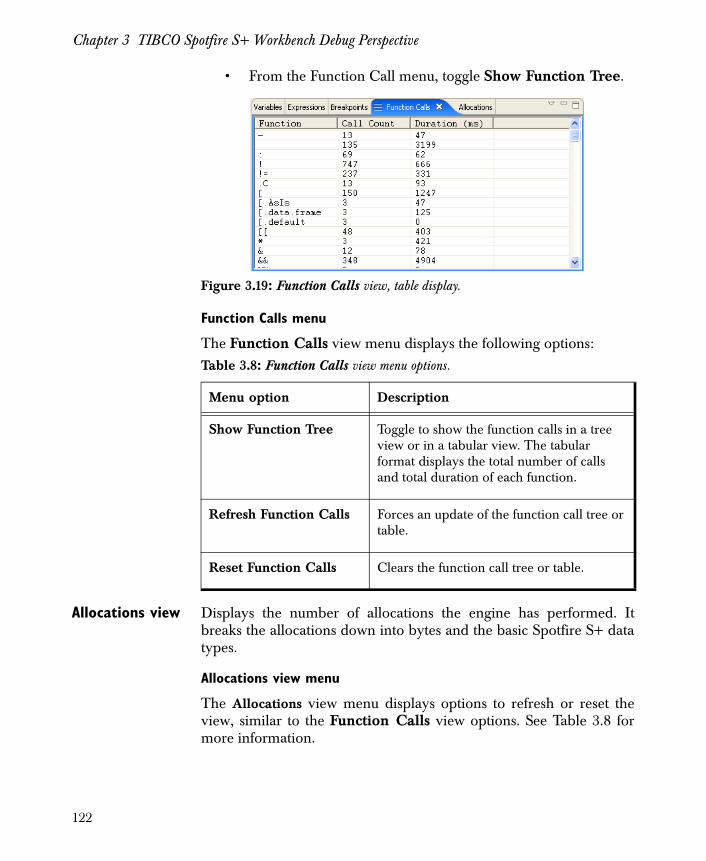
Chapter 3 TIBCO Spotfire S+ Workbench Debug Perspective
• From the Function Call menu, toggle Show Function Tree.
Function Calls menu
The Function Calls view menu displays the following options:
Allocations view Displays the number of allocations the engine has performed. Itbreaks the allocations down into bytes and the basic Spotfire S+ datatypes.
Allocations view menu
The Allocations view menu displays options to refresh or reset theview, similar to the Function Calls view options. See Table 3.8 formore information.
Figure 3.19: Function Calls view, table display.
Table 3.8: Function Calls view menu options.
Menu option Description
Show Function Tree Toggle to show the function calls in a tree view or in a tabular view. The tabular format displays the total number of calls and total duration of each function.
Refresh Function Calls Forces an update of the function call tree or table.
Reset Function Calls Clears the function call tree or table.
122
Introduction 125
Spotfire S+ Workbench Projects 126Setting the Workspace 126Workbench First View 127Creating a Project 128Setting the Spotfire S+ Workbench Preferences 137
Customized Perspective Views 148
Working Projects and Databases 151Setting the Working Project 151Changing Attached Databases 153
Spotfire S+ Project Files and Views 156Creating a Script 156Editing Code in the Script Editor 157Running Code 163Closing and Reopening the Project 167
Packages in the Workbench 168Creating a New Package Project 168Building the Package 170Downloading Package Source Files from a Repository 172Downloading a Binary Package from a Repository 174Updating a Package from a Repository 176
Spotfire Statistics Services Remote Submissions 178Submitting a Remote Job 178Managing Data Files on Spotfire Statistics Services 184Exporting a Package to Spotfire Statistics Services 186
Spotfire S+ Workbench Debugger Tasks 188Kahan Example 188
TIBCO SPOTFIRE S+ WORKBENCH TASKS 4
123
Chapter 4 TIBCO Spotfire S+ Workbench Tasks
Opening the Debug Perspective 188Launching the debugger 189Setting breakpoints 190Starting execution 192Examining the call stack 193Examining Variables and Expressions 194Setting a Watch Expression 195Stepping into, over, and out of a function 197Examining Resource Usage 199Examining Function Calls 199
124
Introduction
INTRODUCTION
This chapter provides the basic tasks that demonstrate using theTIBCO Spotfire S+ Workbench. For information about basic EclipseIDE tasks, see the Eclipse Workbench User Guide.
This chapter includes:
General Spotfire S+ Workbench tasks, including:
• Setting the Workspace, page 126
• Quick Start, page 127
• Setting the Spotfire S+ Workbench Preferences, page 137
• Customized Perspective Views, page 148
• Specifying Working Projects and Databases, page 151
• Working with Spotfire S+ Project Files and Views, page 156
This chapter also includes tasks that introduce you to using the viewsand features in the Spotfire S+ perspective. For more information, seethe section Spotfire S+ Workbench Projects on page 126.
Finally, this chapter includes tasks that introduce you to using theviews and features in the Debug perspective. For more information,see the section Spotfire S+ Workbench Debugger Tasks on page 188.
125
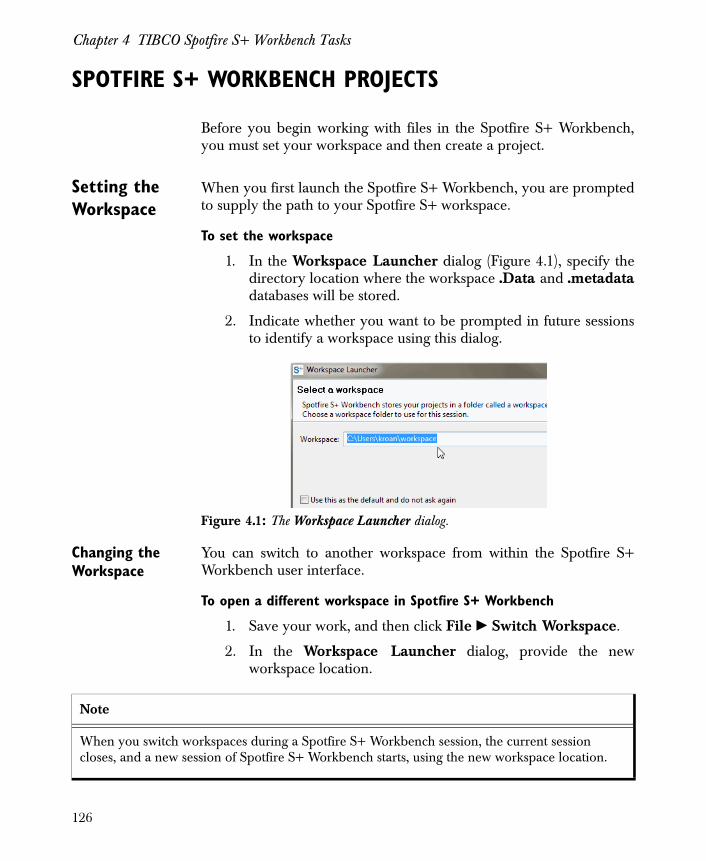
Chapter 4 TIBCO Spotfire S+ Workbench Tasks
SPOTFIRE S+ WORKBENCH PROJECTS
Before you begin working with files in the Spotfire S+ Workbench,you must set your workspace and then create a project.
Setting the Workspace
When you first launch the Spotfire S+ Workbench, you are promptedto supply the path to your Spotfire S+ workspace.
To set the workspace
1. In the Workspace Launcher dialog (Figure 4.1), specify thedirectory location where the workspace .Data and .metadatadatabases will be stored.
2. Indicate whether you want to be prompted in future sessionsto identify a workspace using this dialog.
Changing the Workspace
You can switch to another workspace from within the Spotfire S+Workbench user interface.
To open a different workspace in Spotfire S+ Workbench
1. Save your work, and then click File � Switch Workspace.
2. In the Workspace Launcher dialog, provide the newworkspace location.
Figure 4.1: The Workspace Launcher dialog.
Note
When you switch workspaces during a Spotfire S+ Workbench session, the current session closes, and a new session of Spotfire S+ Workbench starts, using the new workspace location.
126
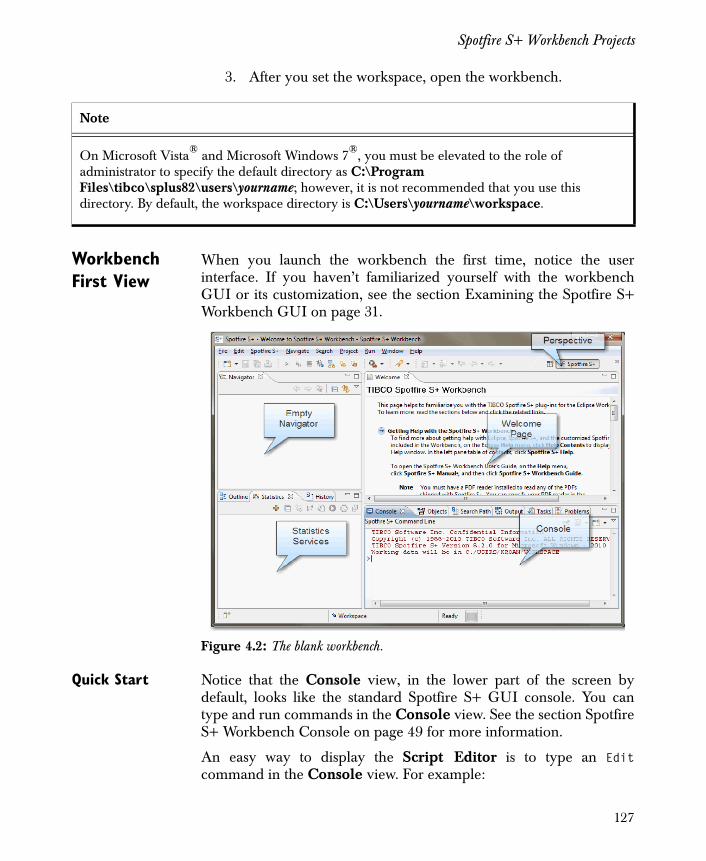
Spotfire S+ Workbench Projects
3. After you set the workspace, open the workbench.
Workbench First View
When you launch the workbench the first time, notice the userinterface. If you haven’t familiarized yourself with the workbenchGUI or its customization, see the section Examining the Spotfire S+Workbench GUI on page 31.
Quick Start Notice that the Console view, in the lower part of the screen bydefault, looks like the standard Spotfire S+ GUI console. You cantype and run commands in the Console view. See the section SpotfireS+ Workbench Console on page 49 for more information.
An easy way to display the Script Editor is to type an Editcommand in the Console view. For example:
Note
On Microsoft Vista® and Microsoft Windows 7®, you must be elevated to the role of administrator to specify the default directory as C:\Program Files\tibco\splus82\users\yourname; however, it is not recommended that you use this directory. By default, the workspace directory is C:\Users\yourname\workspace.
Figure 4.2: The blank workbench.
127
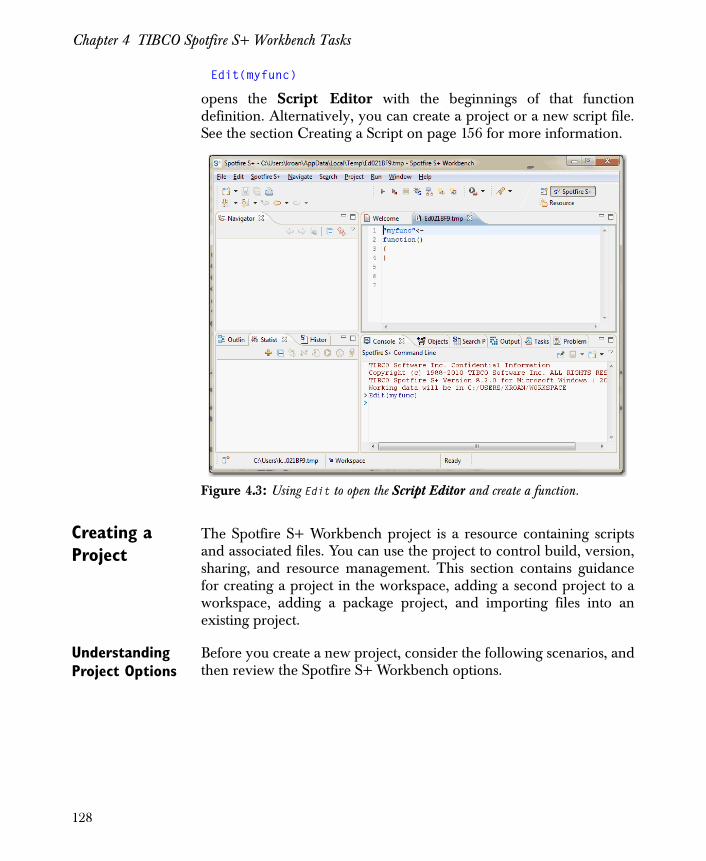
Chapter 4 TIBCO Spotfire S+ Workbench Tasks
Edit(myfunc)
opens the Script Editor with the beginnings of that functiondefinition. Alternatively, you can create a project or a new script file.See the section Creating a Script on page 156 for more information.
Creating a Project
The Spotfire S+ Workbench project is a resource containing scriptsand associated files. You can use the project to control build, version,sharing, and resource management. This section contains guidancefor creating a project in the workspace, adding a second project to aworkspace, adding a package project, and importing files into anexisting project.
Understanding Project Options
Before you create a new project, consider the following scenarios, andthen review the Spotfire S+ Workbench options.
Figure 4.3: Using Edit to open the Script Editor and create a function.
128
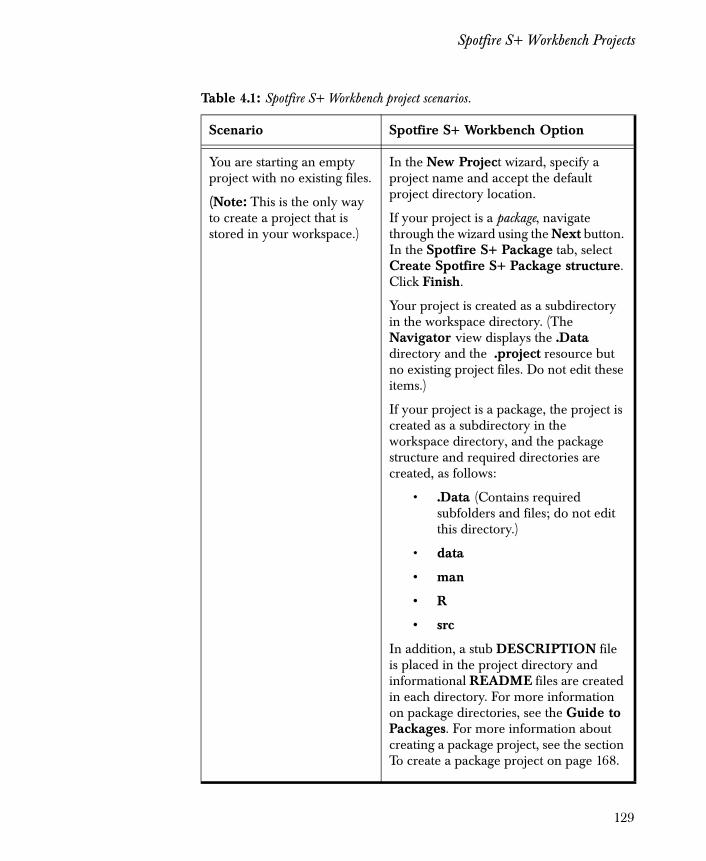
Spotfire S+ Workbench Projects
Table 4.1: Spotfire S+ Workbench project scenarios.
Scenario Spotfire S+ Workbench Option
You are starting an empty project with no existing files.
(Note: This is the only way to create a project that is stored in your workspace.)
In the New Project wizard, specify a project name and accept the default project directory location.
If your project is a package, navigate through the wizard using the Next button. In the Spotfire S+ Package tab, select Create Spotfire S+ Package structure. Click Finish.
Your project is created as a subdirectory in the workspace directory. (The Navigator view displays the .Data directory and the .project resource but no existing project files. Do not edit these items.)
If your project is a package, the project is created as a subdirectory in the workspace directory, and the package structure and required directories are created, as follows:
• .Data (Contains required subfolders and files; do not edit this directory.)
• data
• man
• R
• src
In addition, a stub DESCRIPTION file is placed in the project directory and informational README files are created in each directory. For more information on package directories, see the Guide to Packages. For more information about creating a package project, see the section To create a package project on page 168.
129
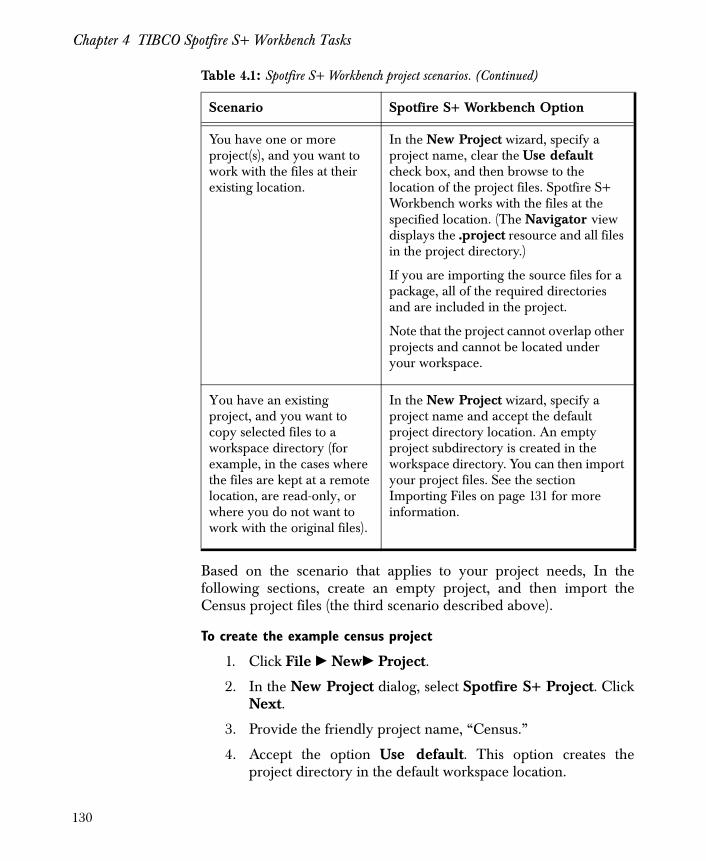
Chapter 4 TIBCO Spotfire S+ Workbench Tasks
Based on the scenario that applies to your project needs, In thefollowing sections, create an empty project, and then import theCensus project files (the third scenario described above).
To create the example census project
1. Click File � New� Project.
2. In the New Project dialog, select Spotfire S+ Project. ClickNext.
3. Provide the friendly project name, “Census.”
4. Accept the option Use default. This option creates theproject directory in the default workspace location.
You have one or more project(s), and you want to work with the files at their existing location.
In the New Project wizard, specify a project name, clear the Use default check box, and then browse to the location of the project files. Spotfire S+ Workbench works with the files at the specified location. (The Navigator view displays the .project resource and all files in the project directory.)
If you are importing the source files for a package, all of the required directories and are included in the project.
Note that the project cannot overlap other projects and cannot be located under your workspace.
You have an existing project, and you want to copy selected files to a workspace directory (for example, in the cases where the files are kept at a remote location, are read-only, or where you do not want to work with the original files).
In the New Project wizard, specify a project name and accept the default project directory location. An empty project subdirectory is created in the workspace directory. You can then import your project files. See the section Importing Files on page 131 for more information.
Table 4.1: Spotfire S+ Workbench project scenarios. (Continued)
Scenario Spotfire S+ Workbench Option
130
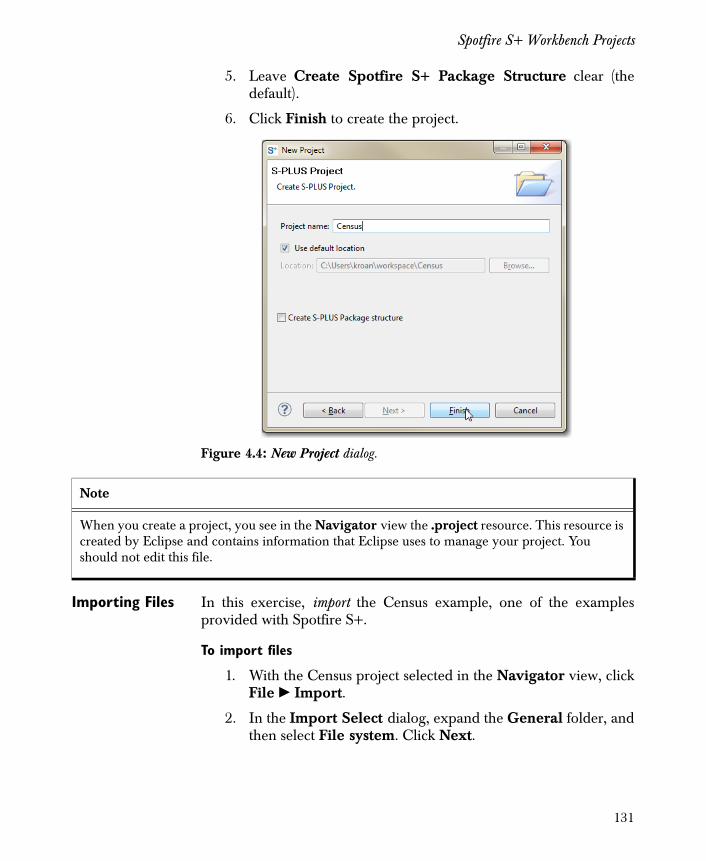
Spotfire S+ Workbench Projects
5. Leave Create Spotfire S+ Package Structure clear (thedefault).
6. Click Finish to create the project.
Importing Files In this exercise, import the Census example, one of the examplesprovided with Spotfire S+.
To import files
1. With the Census project selected in the Navigator view, clickFile � Import.
2. In the Import Select dialog, expand the General folder, andthen select File system. Click Next.
Figure 4.4: New Project dialog.
Note
When you create a project, you see in the Navigator view the .project resource. This resource is created by Eclipse and contains information that Eclipse uses to manage your project. You should not edit this file.
131
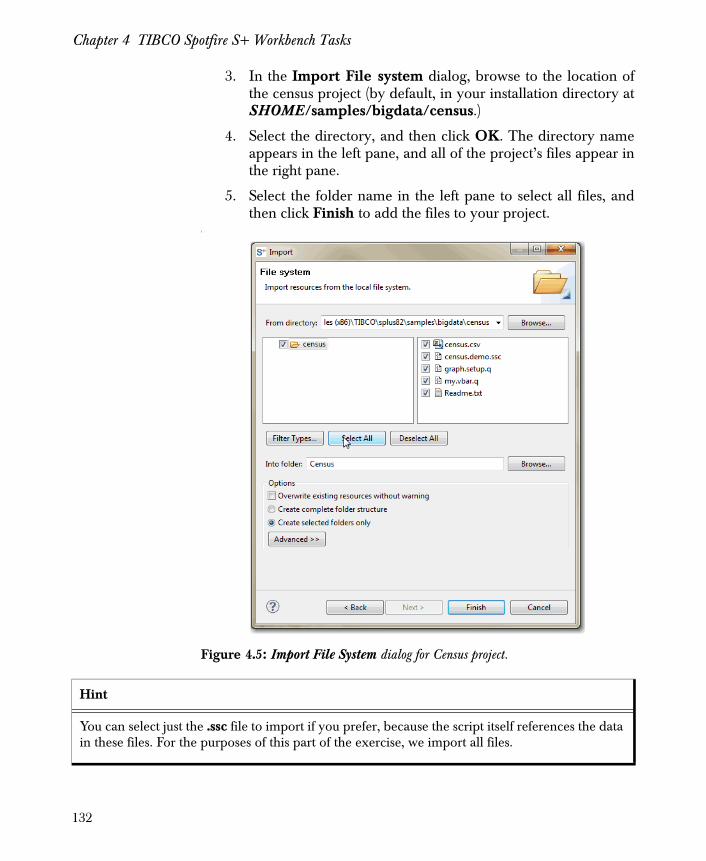
Chapter 4 TIBCO Spotfire S+ Workbench Tasks
3. In the Import File system dialog, browse to the location ofthe census project (by default, in your installation directory atSHOME/samples/bigdata/census.)
4. Select the directory, and then click OK. The directory nameappears in the left pane, and all of the project’s files appear inthe right pane.
5. Select the folder name in the left pane to select all files, andthen click Finish to add the files to your project.
f
Figure 4.5: Import File System dialog for Census project.
Hint
You can select just the .ssc file to import if you prefer, because the script itself references the data in these files. For the purposes of this part of the exercise, we import all files.
132
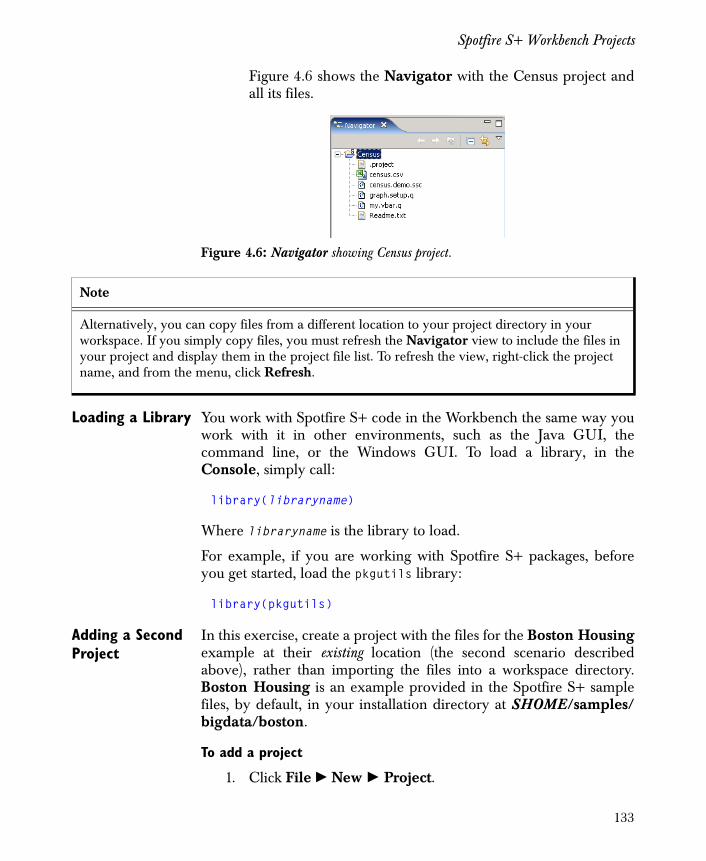
Spotfire S+ Workbench Projects
Figure 4.6 shows the Navigator with the Census project andall its files.
Loading a Library You work with Spotfire S+ code in the Workbench the same way youwork with it in other environments, such as the Java GUI, thecommand line, or the Windows GUI. To load a library, in theConsole, simply call:
library(libraryname)
Where libraryname is the library to load.
For example, if you are working with Spotfire S+ packages, beforeyou get started, load the pkgutils library:
library(pkgutils)
Adding a Second Project
In this exercise, create a project with the files for the Boston Housingexample at their existing location (the second scenario describedabove), rather than importing the files into a workspace directory.Boston Housing is an example provided in the Spotfire S+ samplefiles, by default, in your installation directory at SHOME/samples/bigdata/boston.
To add a project
1. Click File � New � Project.
Figure 4.6: Navigator showing Census project.
Note
Alternatively, you can copy files from a different location to your project directory in your workspace. If you simply copy files, you must refresh the Navigator view to include the files in your project and display them in the project file list. To refresh the view, right-click the project name, and from the menu, click Refresh.
133
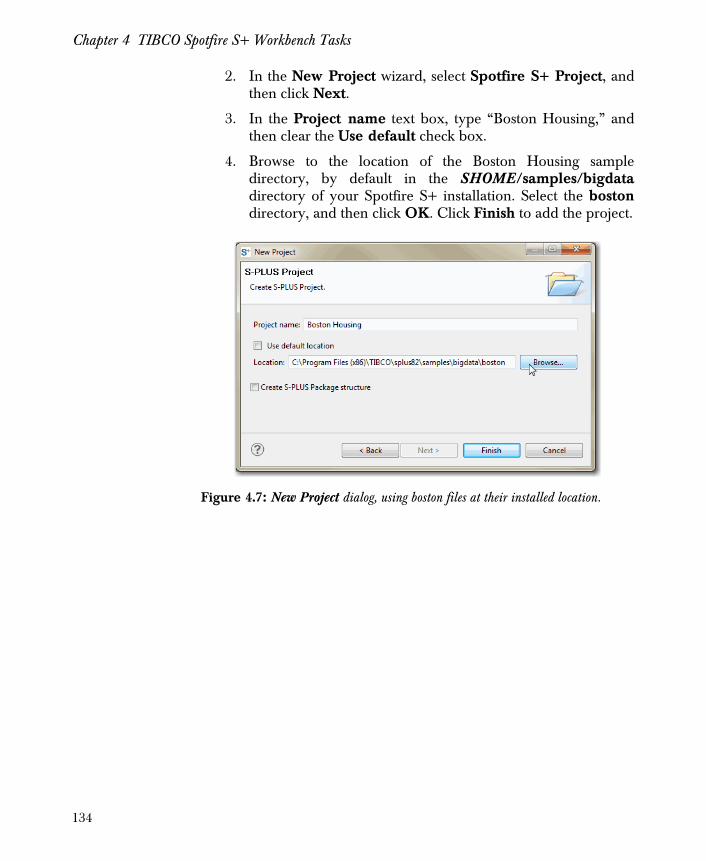
Chapter 4 TIBCO Spotfire S+ Workbench Tasks
2. In the New Project wizard, select Spotfire S+ Project, andthen click Next.
3. In the Project name text box, type “Boston Housing,” andthen clear the Use default check box.
4. Browse to the location of the Boston Housing sampledirectory, by default in the SHOME/samples/bigdatadirectory of your Spotfire S+ installation. Select the bostondirectory, and then click OK. Click Finish to add the project.
Figure 4.7: New Project dialog, using boston files at their installed location.
134
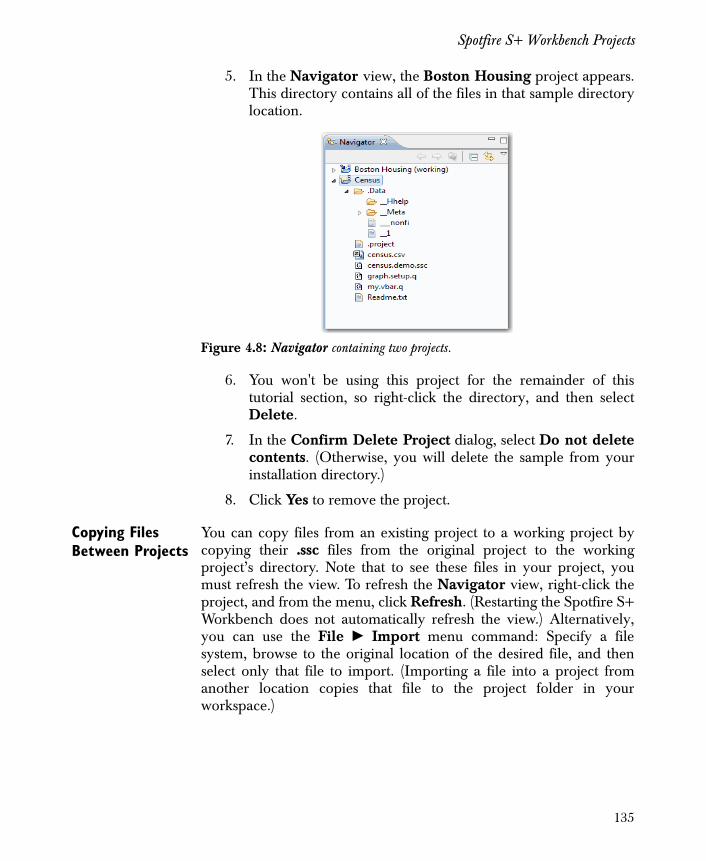
Spotfire S+ Workbench Projects
5. In the Navigator view, the Boston Housing project appears.This directory contains all of the files in that sample directorylocation.
6. You won't be using this project for the remainder of thistutorial section, so right-click the directory, and then selectDelete.
7. In the Confirm Delete Project dialog, select Do not deletecontents. (Otherwise, you will delete the sample from yourinstallation directory.)
8. Click Yes to remove the project.
Copying Files Between Projects
You can copy files from an existing project to a working project bycopying their .ssc files from the original project to the workingproject’s directory. Note that to see these files in your project, youmust refresh the view. To refresh the Navigator view, right-click theproject, and from the menu, click Refresh. (Restarting the Spotfire S+Workbench does not automatically refresh the view.) Alternatively,you can use the File � Import menu command: Specify a filesystem, browse to the original location of the desired file, and thenselect only that file to import. (Importing a file into a project fromanother location copies that file to the project folder in yourworkspace.)
Figure 4.8: Navigator containing two projects.
135
Chapter 4 TIBCO Spotfire S+ Workbench Tasks
Adding the Sample Debugging Project
In this exercise, add another project, importing the sample files, asyou did in the section To create the example census project on page130. This second project is the project you will use later in this chapterto practice debugging tasks.
Follow the directions for creating a project on pages 130 to page 133,but instead of importing the Census project, import the kahanSumproject, located in your installation directory at SHOME/samples/kahanSum.
To add the kahanSum project
1. Click File � New � Project.
2. In the New Project dialog, select Spotfire S+ Project. ClickNext.
3. Provide the friendly project name, “kahanSum.”
4. Accept the option Use default. This option creates theproject directory in the default workspace location.
5. Click Finish to create the project.
6. With the kahanSum project selected in the Navigator view,click File � Import.
7. In the Import Select dialog, select File system, and thenclick Next.
8. In the Import File system dialog, browse to the location ofthe census project (by default, in your installation directory at/samples/kahanSum.)
9. Select the directory, and then click OK. The directory nameappears in the left pane, and all of the project’s files appear inthe right pane.
10. Click Select All, and then click Finish to add the files to yourproject.
136
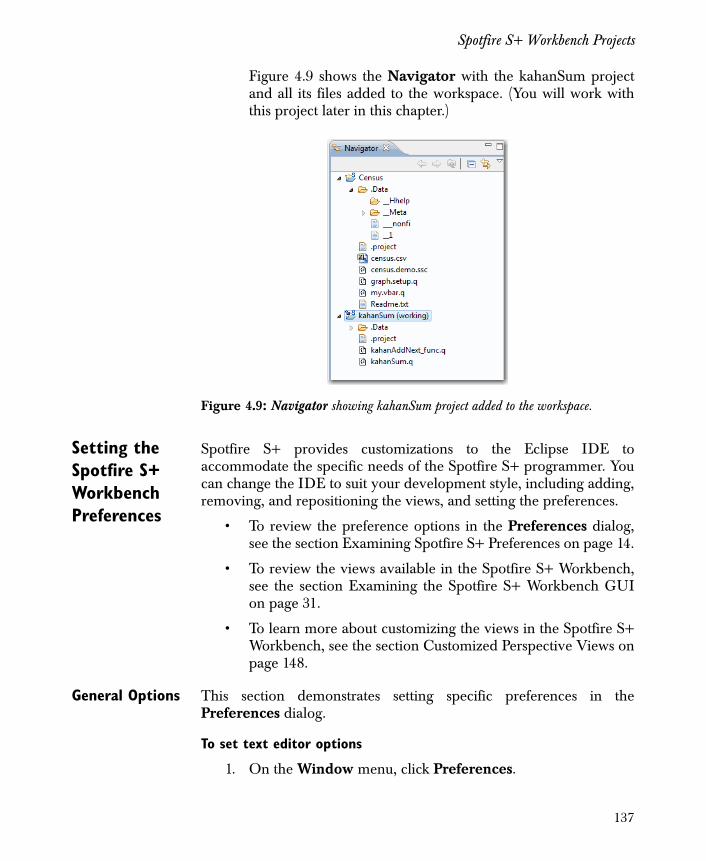
Spotfire S+ Workbench Projects
Figure 4.9 shows the Navigator with the kahanSum projectand all its files added to the workspace. (You will work withthis project later in this chapter.)
Setting the Spotfire S+ Workbench Preferences
Spotfire S+ provides customizations to the Eclipse IDE toaccommodate the specific needs of the Spotfire S+ programmer. Youcan change the IDE to suit your development style, including adding,removing, and repositioning the views, and setting the preferences.
• To review the preference options in the Preferences dialog,see the section Examining Spotfire S+ Preferences on page 14.
• To review the views available in the Spotfire S+ Workbench,see the section Examining the Spotfire S+ Workbench GUIon page 31.
• To learn more about customizing the views in the Spotfire S+Workbench, see the section Customized Perspective Views onpage 148.
General Options This section demonstrates setting specific preferences in thePreferences dialog.
To set text editor options
1. On the Window menu, click Preferences.
Figure 4.9: Navigator showing kahanSum project added to the workspace.
137
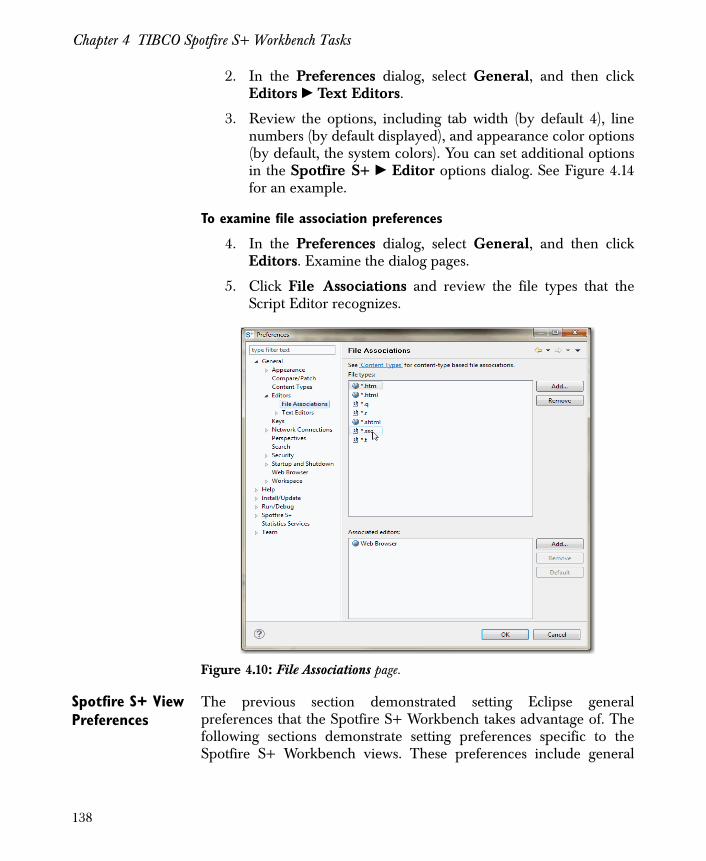
Chapter 4 TIBCO Spotfire S+ Workbench Tasks
2. In the Preferences dialog, select General, and then clickEditors � Text Editors.
3. Review the options, including tab width (by default 4), linenumbers (by default displayed), and appearance color options(by default, the system colors). You can set additional optionsin the Spotfire S+ � Editor options dialog. See Figure 4.14for an example.
To examine file association preferences
4. In the Preferences dialog, select General, and then clickEditors. Examine the dialog pages.
5. Click File Associations and review the file types that theScript Editor recognizes.
Spotfire S+ View Preferences
The previous section demonstrated setting Eclipse generalpreferences that the Spotfire S+ Workbench takes advantage of. Thefollowing sections demonstrate setting preferences specific to theSpotfire S+ Workbench views. These preferences include general
Figure 4.10: File Associations page.
138
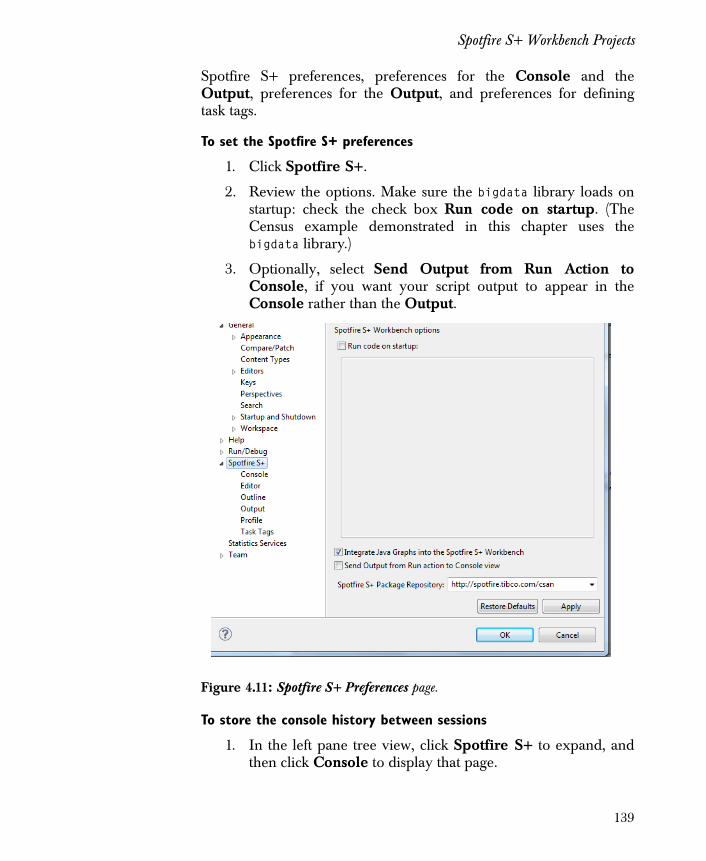
Spotfire S+ Workbench Projects
Spotfire S+ preferences, preferences for the Console and theOutput, preferences for the Output, and preferences for definingtask tags.
To set the Spotfire S+ preferences
1. Click Spotfire S+.
2. Review the options. Make sure the bigdata library loads onstartup: check the check box Run code on startup. (TheCensus example demonstrated in this chapter uses thebigdata library.)
3. Optionally, select Send Output from Run Action toConsole, if you want your script output to appear in theConsole rather than the Output.
To store the console history between sessions
1. In the left pane tree view, click Spotfire S+ to expand, andthen click Console to display that page.
Figure 4.11: Spotfire S+ Preferences page.
139
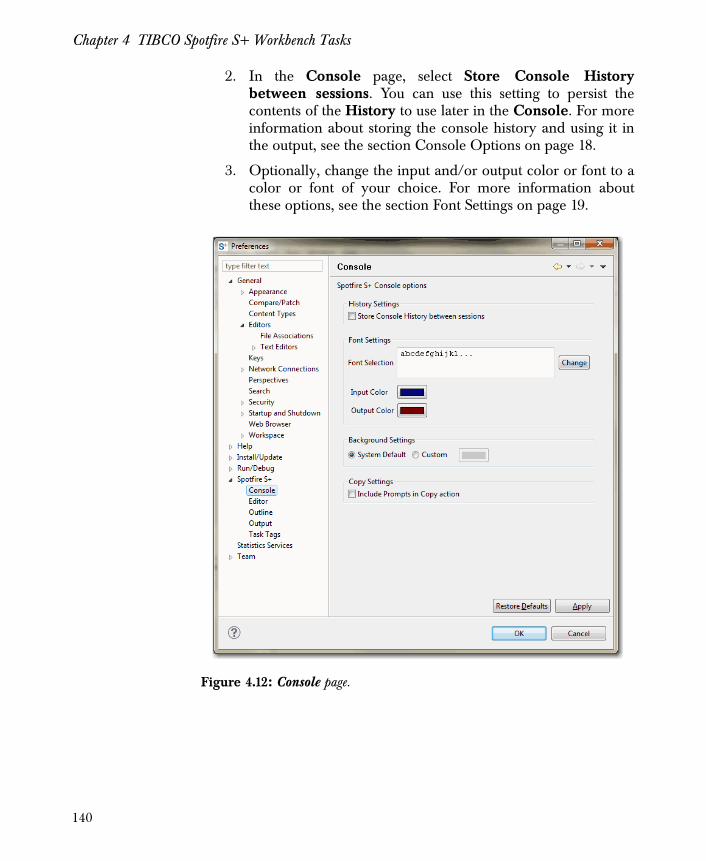
Chapter 4 TIBCO Spotfire S+ Workbench Tasks
2. In the Console page, select Store Console Historybetween sessions. You can use this setting to persist thecontents of the History to use later in the Console. For moreinformation about storing the console history and using it inthe output, see the section Console Options on page 18.
3. Optionally, change the input and/or output color or font to acolor or font of your choice. For more information aboutthese options, see the section Font Settings on page 19.
Figure 4.12: Console page.
140
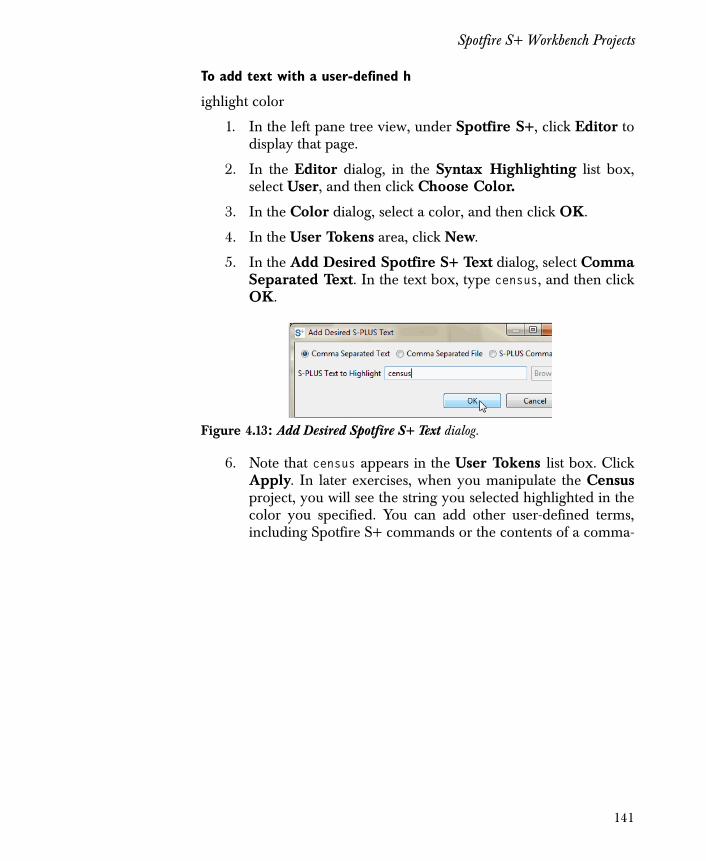
Spotfire S+ Workbench Projects
To add text with a user-defined h
ighlight color
1. In the left pane tree view, under Spotfire S+, click Editor todisplay that page.
2. In the Editor dialog, in the Syntax Highlighting list box,select User, and then click Choose Color.
3. In the Color dialog, select a color, and then click OK.
4. In the User Tokens area, click New.
5. In the Add Desired Spotfire S+ Text dialog, select CommaSeparated Text. In the text box, type census, and then clickOK.
6. Note that census appears in the User Tokens list box. ClickApply. In later exercises, when you manipulate the Censusproject, you will see the string you selected highlighted in thecolor you specified. You can add other user-defined terms,including Spotfire S+ commands or the contents of a comma-
Figure 4.13: Add Desired Spotfire S+ Text dialog.
141
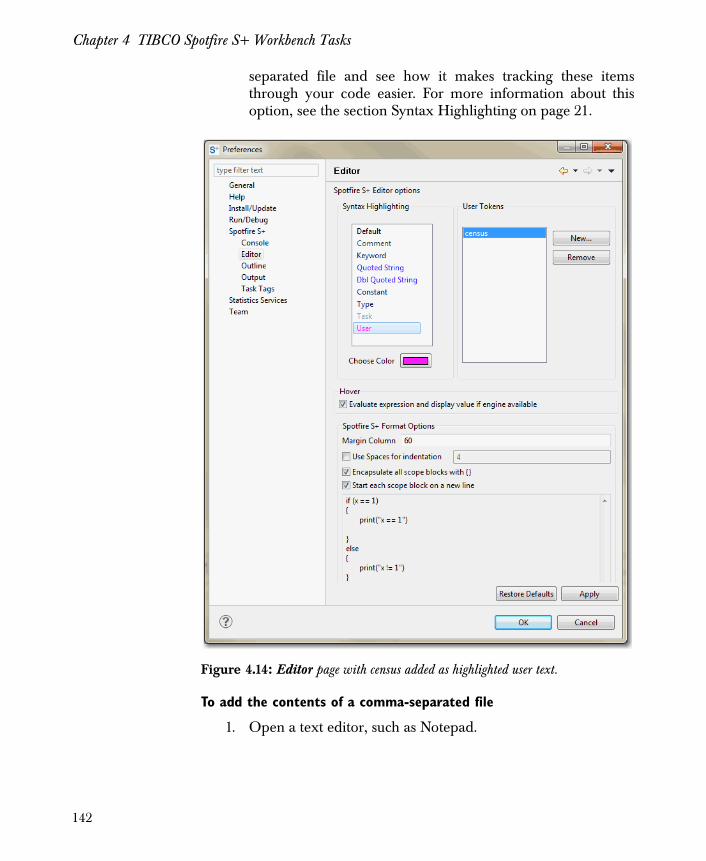
Chapter 4 TIBCO Spotfire S+ Workbench Tasks
separated file and see how it makes tracking these itemsthrough your code easier. For more information about thisoption, see the section Syntax Highlighting on page 21.
To add the contents of a comma-separated file
1. Open a text editor, such as Notepad.
Figure 4.14: Editor page with census added as highlighted user text.
142
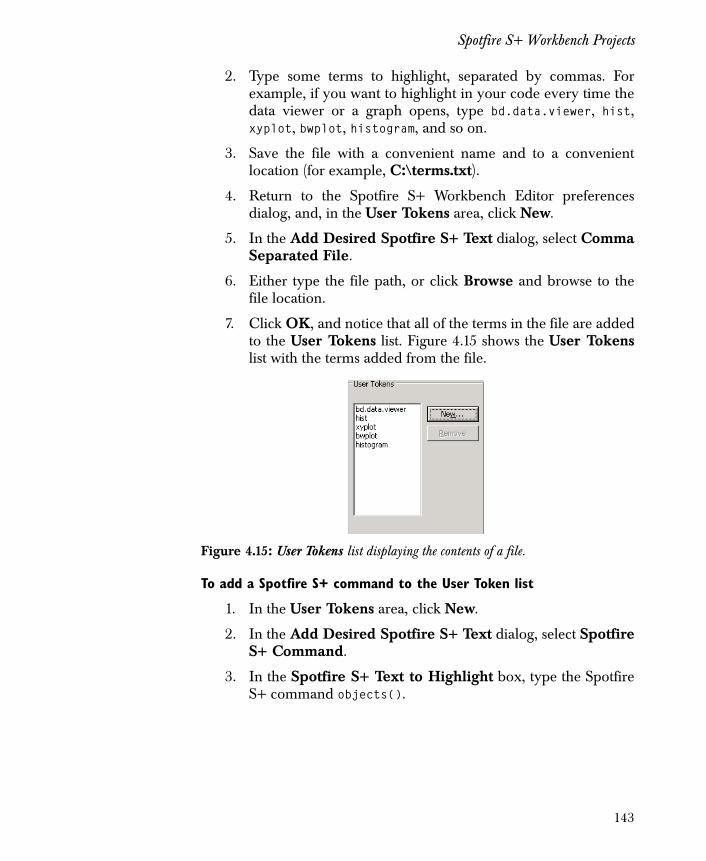
Spotfire S+ Workbench Projects
2. Type some terms to highlight, separated by commas. Forexample, if you want to highlight in your code every time thedata viewer or a graph opens, type bd.data.viewer, hist,xyplot, bwplot, histogram, and so on.
3. Save the file with a convenient name and to a convenientlocation (for example, C:\terms.txt).
4. Return to the Spotfire S+ Workbench Editor preferencesdialog, and, in the User Tokens area, click New.
5. In the Add Desired Spotfire S+ Text dialog, select CommaSeparated File.
6. Either type the file path, or click Browse and browse to thefile location.
7. Click OK, and notice that all of the terms in the file are addedto the User Tokens list. Figure 4.15 shows the User Tokenslist with the terms added from the file.
To add a Spotfire S+ command to the User Token list
1. In the User Tokens area, click New.
2. In the Add Desired Spotfire S+ Text dialog, select SpotfireS+ Command.
3. In the Spotfire S+ Text to Highlight box, type the SpotfireS+ command objects().
Figure 4.15: User Tokens list displaying the contents of a file.
143
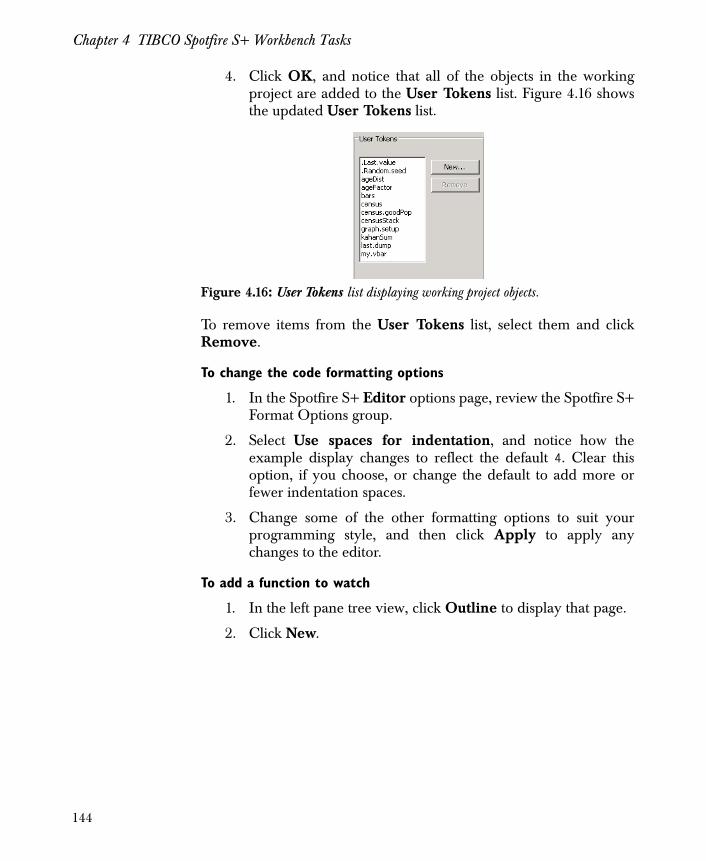
Chapter 4 TIBCO Spotfire S+ Workbench Tasks
4. Click OK, and notice that all of the objects in the workingproject are added to the User Tokens list. Figure 4.16 showsthe updated User Tokens list.
To remove items from the User Tokens list, select them and clickRemove.
To change the code formatting options
1. In the Spotfire S+ Editor options page, review the Spotfire S+Format Options group.
2. Select Use spaces for indentation, and notice how theexample display changes to reflect the default 4. Clear thisoption, if you choose, or change the default to add more orfewer indentation spaces.
3. Change some of the other formatting options to suit yourprogramming style, and then click Apply to apply anychanges to the editor.
To add a function to watch
1. In the left pane tree view, click Outline to display that page.
2. Click New.
Figure 4.16: User Tokens list displaying working project objects.
144
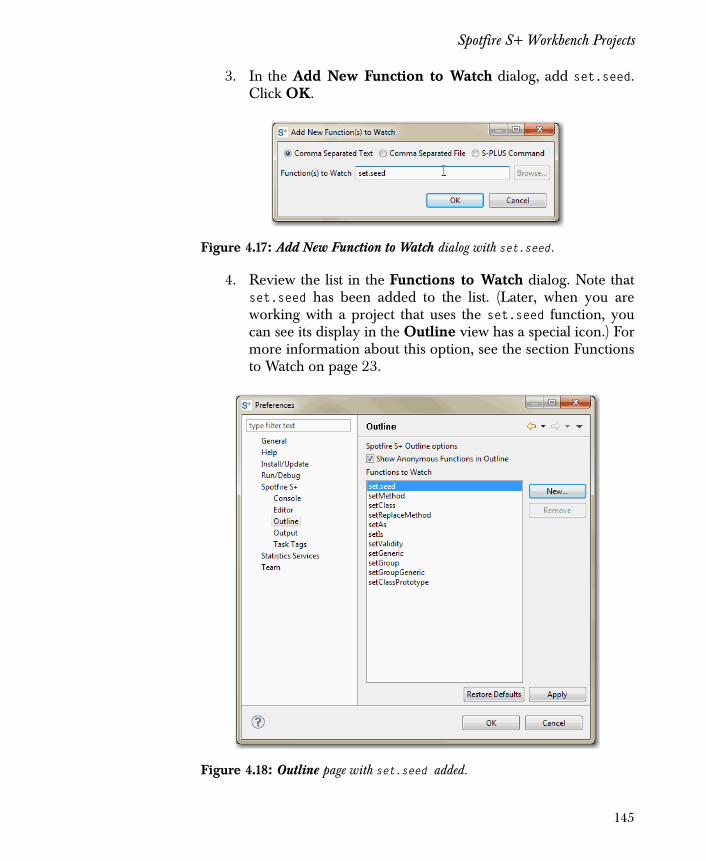
Spotfire S+ Workbench Projects
3. In the Add New Function to Watch dialog, add set.seed.Click OK.
4. Review the list in the Functions to Watch dialog. Note thatset.seed has been added to the list. (Later, when you areworking with a project that uses the set.seed function, youcan see its display in the Outline view has a special icon.) Formore information about this option, see the section Functionsto Watch on page 23.
Figure 4.17: Add New Function to Watch dialog with set.seed.
Figure 4.18: Outline page with set.seed added.
145
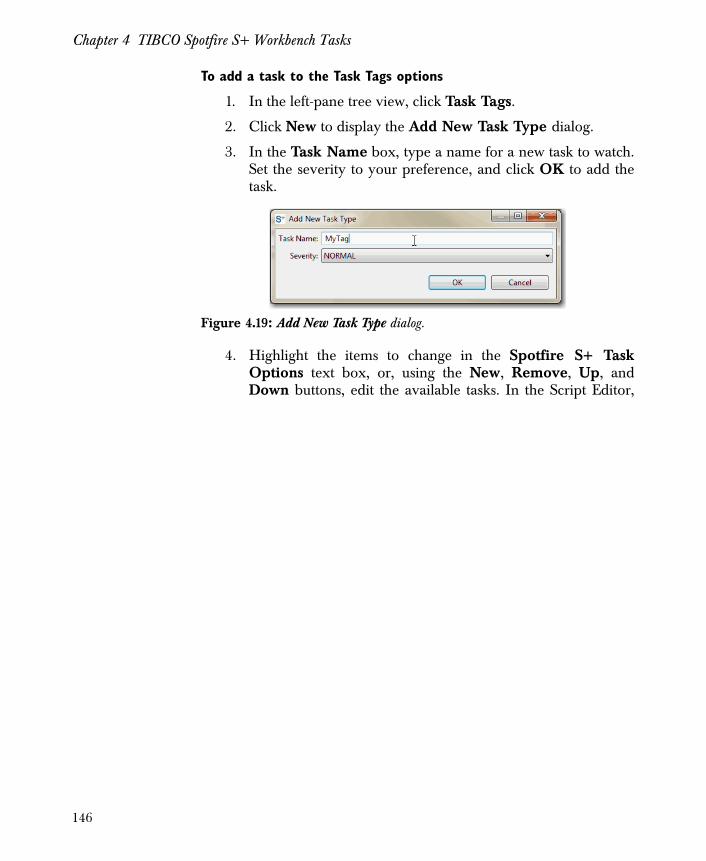
Chapter 4 TIBCO Spotfire S+ Workbench Tasks
To add a task to the Task Tags options
1. In the left-pane tree view, click Task Tags.
2. Click New to display the Add New Task Type dialog.
3. In the Task Name box, type a name for a new task to watch.Set the severity to your preference, and click OK to add thetask.
4. Highlight the items to change in the Spotfire S+ TaskOptions text box, or, using the New, Remove, Up, andDown buttons, edit the available tasks. In the Script Editor,
Figure 4.19: Add New Task Type dialog.
146
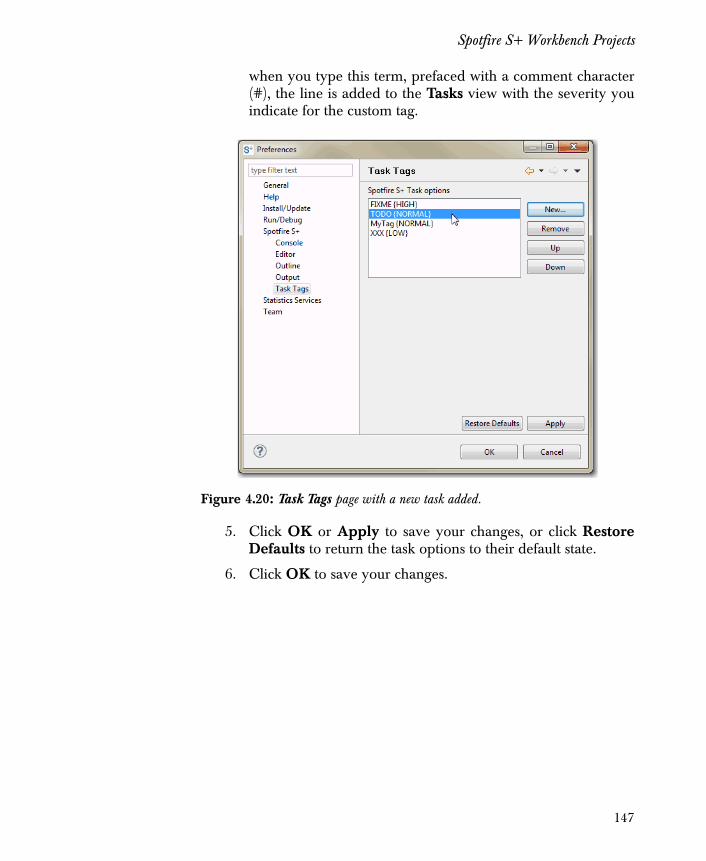
Spotfire S+ Workbench Projects
when you type this term, prefaced with a comment character(#), the line is added to the Tasks view with the severity youindicate for the custom tag.
5. Click OK or Apply to save your changes, or click RestoreDefaults to return the task options to their default state.
6. Click OK to save your changes.
Figure 4.20: Task Tags page with a new task added.
147
Chapter 4 TIBCO Spotfire S+ Workbench Tasks
CUSTOMIZED PERSPECTIVE VIEWS
The layout of the Spotfire S+ perspective presents the Navigatorview, Outline view, Statistics Services view, and History on the leftside of the window. The Console, Objects, Search Path, Output,Tasks view, and Problems view are tiled across the bottom of thewindow. The Script Editor pane is empty.
To customize the Spotfire S+ perspective
1. Click the Outline view tab and drag the view beside theNavigator view. The Outline view now tiles with theNavigator view.
2. Click the History tab and drag the view to the right; it nowtiles with the other views.
3. Right-click the Tasks view tab and select Fast View. TheTasks view minimizes and appears as an icon in the window’sstatus bar.
Note
If you do not see one of the following Spotfire S+ specific views in the user interface, you can display it from the menu by clicking Window � Show View � Other, and then selecting it from the Show View list.
148
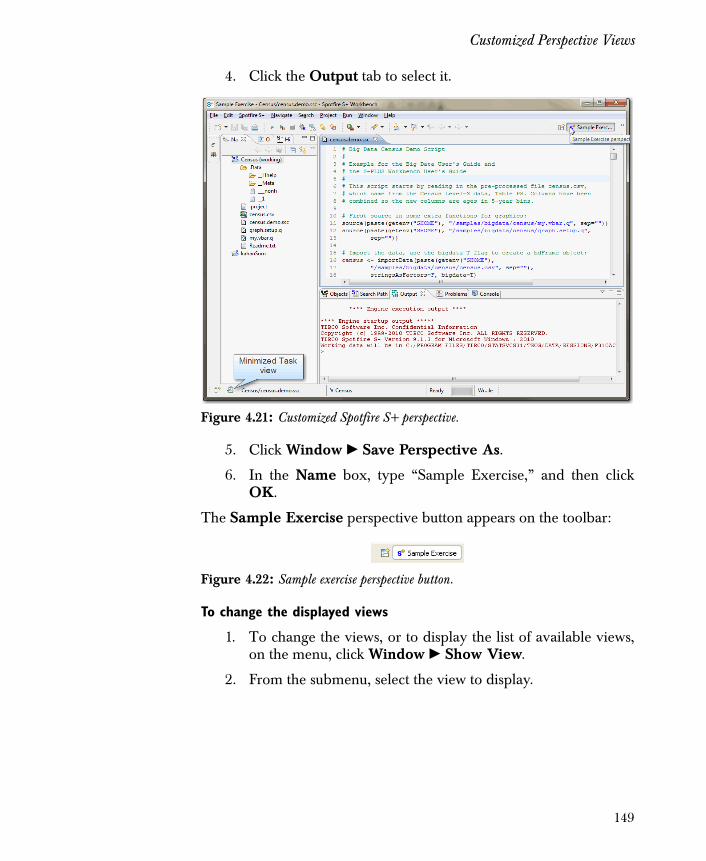
Customized Perspective Views
4. Click the Output tab to select it.
5. Click Window � Save Perspective As.
6. In the Name box, type “Sample Exercise,” and then clickOK.
The Sample Exercise perspective button appears on the toolbar:
To change the displayed views
1. To change the views, or to display the list of available views,on the menu, click Window � Show View.
2. From the submenu, select the view to display.
Figure 4.21: Customized Spotfire S+ perspective.
Figure 4.22: Sample exercise perspective button.
149
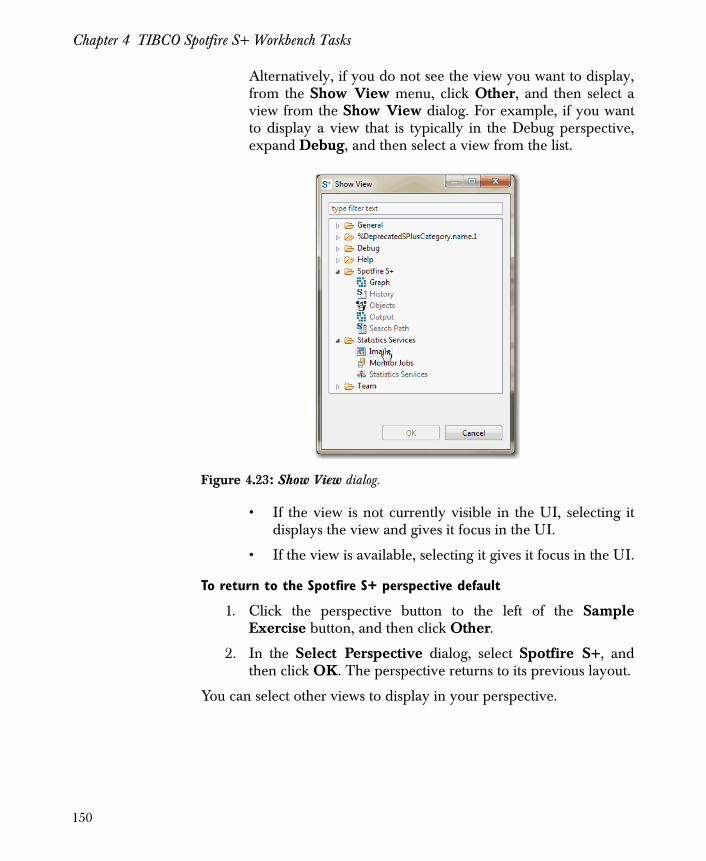
Chapter 4 TIBCO Spotfire S+ Workbench Tasks
Alternatively, if you do not see the view you want to display,from the Show View menu, click Other, and then select aview from the Show View dialog. For example, if you wantto display a view that is typically in the Debug perspective,expand Debug, and then select a view from the list.
• If the view is not currently visible in the UI, selecting itdisplays the view and gives it focus in the UI.
• If the view is available, selecting it gives it focus in the UI.
To return to the Spotfire S+ perspective default
1. Click the perspective button to the left of the SampleExercise button, and then click Other.
2. In the Select Perspective dialog, select Spotfire S+, andthen click OK. The perspective returns to its previous layout.
You can select other views to display in your perspective.
Figure 4.23: Show View dialog.
150
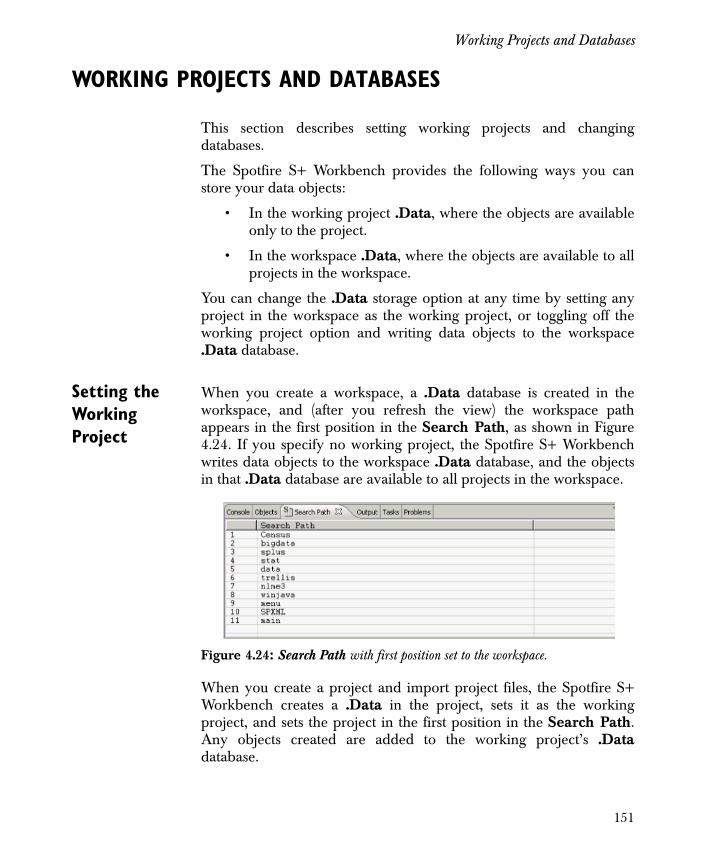
Working Projects and Databases
WORKING PROJECTS AND DATABASES
This section describes setting working projects and changingdatabases.
The Spotfire S+ Workbench provides the following ways you canstore your data objects:
• In the working project .Data, where the objects are availableonly to the project.
• In the workspace .Data, where the objects are available to allprojects in the workspace.
You can change the .Data storage option at any time by setting anyproject in the workspace as the working project, or toggling off theworking project option and writing data objects to the workspace.Data database.
Setting the Working Project
When you create a workspace, a .Data database is created in theworkspace, and (after you refresh the view) the workspace pathappears in the first position in the Search Path, as shown in Figure4.24. If you specify no working project, the Spotfire S+ Workbenchwrites data objects to the workspace .Data database, and the objectsin that .Data database are available to all projects in the workspace.
When you create a project and import project files, the Spotfire S+Workbench creates a .Data in the project, sets it as the workingproject, and sets the project in the first position in the Search Path.Any objects created are added to the working project’s .Datadatabase.
Figure 4.24: Search Path with first position set to the workspace.
151
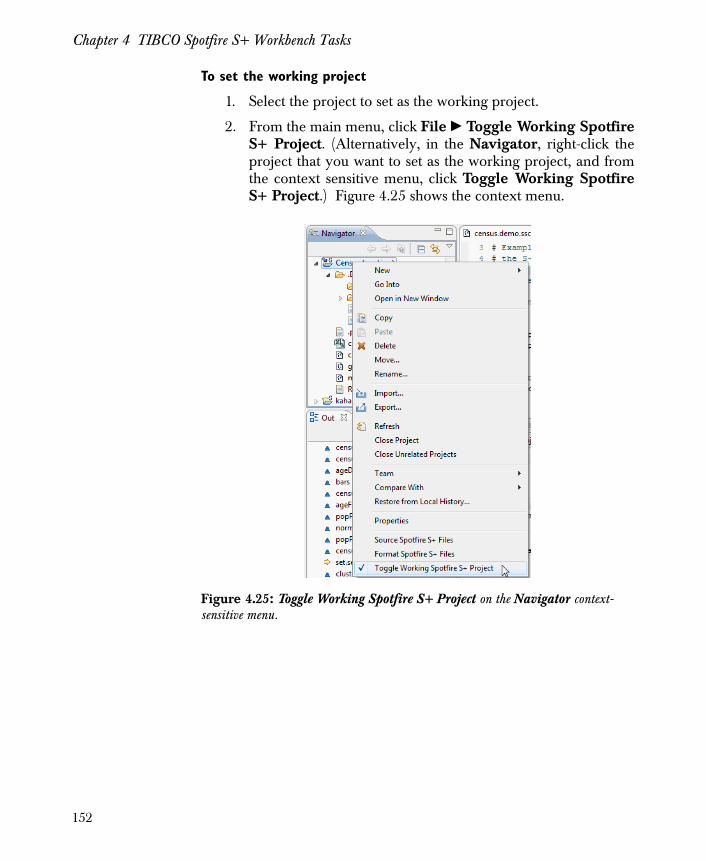
Chapter 4 TIBCO Spotfire S+ Workbench Tasks
To set the working project
1. Select the project to set as the working project.
2. From the main menu, click File � Toggle Working SpotfireS+ Project. (Alternatively, in the Navigator, right-click theproject that you want to set as the working project, and fromthe context sensitive menu, click Toggle Working SpotfireS+ Project.) Figure 4.25 shows the context menu.
Figure 4.25: Toggle Working Spotfire S+ Project on the Navigator context-sensitive menu.
152
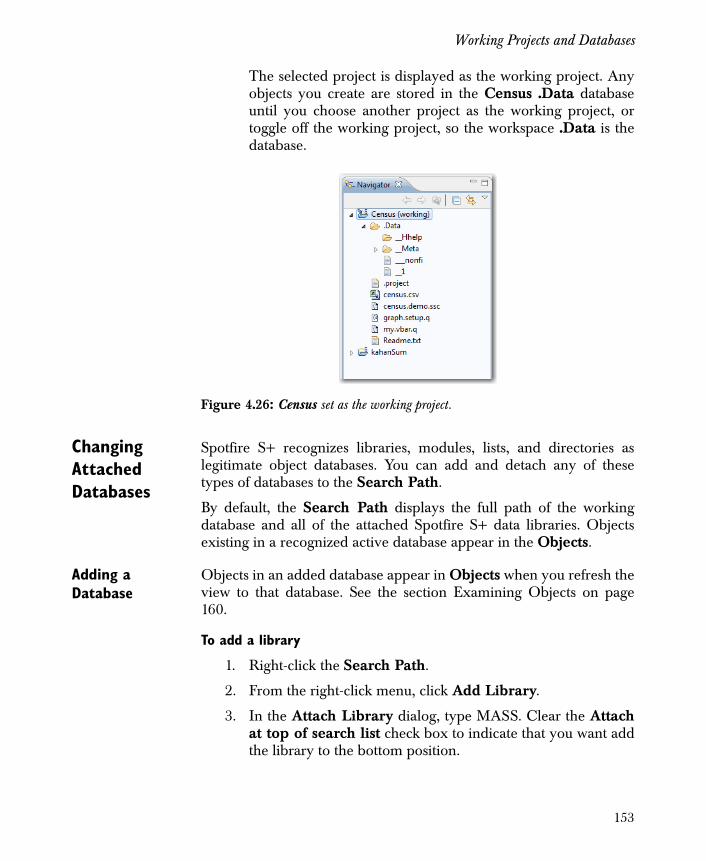
Working Projects and Databases
The selected project is displayed as the working project. Anyobjects you create are stored in the Census .Data databaseuntil you choose another project as the working project, ortoggle off the working project, so the workspace .Data is thedatabase.
Changing Attached Databases
Spotfire S+ recognizes libraries, modules, lists, and directories aslegitimate object databases. You can add and detach any of thesetypes of databases to the Search Path.
By default, the Search Path displays the full path of the workingdatabase and all of the attached Spotfire S+ data libraries. Objectsexisting in a recognized active database appear in the Objects.
Adding a Database
Objects in an added database appear in Objects when you refresh theview to that database. See the section Examining Objects on page160.
To add a library
1. Right-click the Search Path.
2. From the right-click menu, click Add Library.
3. In the Attach Library dialog, type MASS. Clear the Attachat top of search list check box to indicate that you want addthe library to the bottom position.
Figure 4.26: Census set as the working project.
153
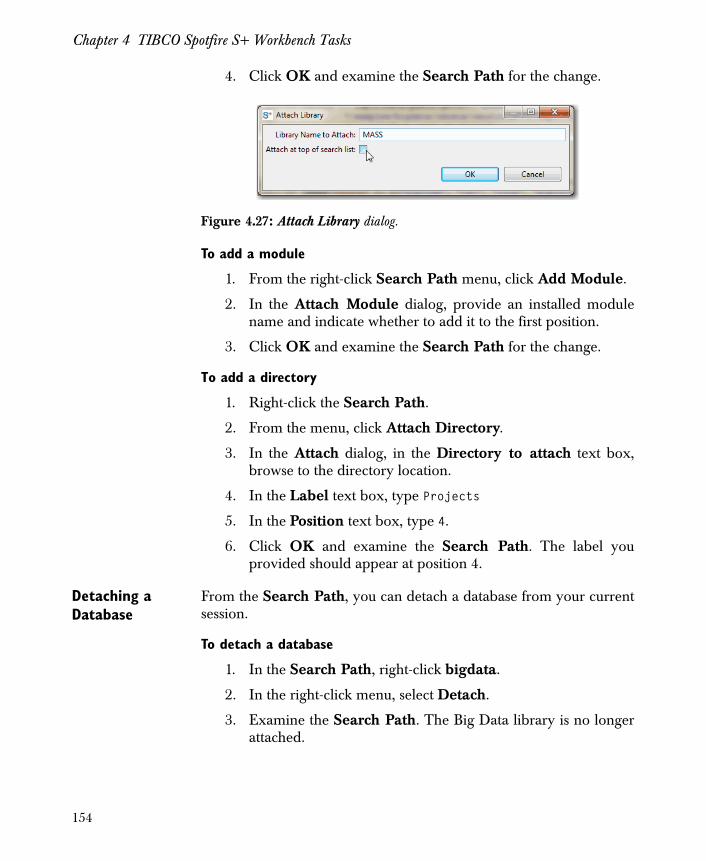
Chapter 4 TIBCO Spotfire S+ Workbench Tasks
4. Click OK and examine the Search Path for the change.
To add a module
1. From the right-click Search Path menu, click Add Module.
2. In the Attach Module dialog, provide an installed modulename and indicate whether to add it to the first position.
3. Click OK and examine the Search Path for the change.
To add a directory
1. Right-click the Search Path.
2. From the menu, click Attach Directory.
3. In the Attach dialog, in the Directory to attach text box,browse to the directory location.
4. In the Label text box, type Projects
5. In the Position text box, type 4.
6. Click OK and examine the Search Path. The label youprovided should appear at position 4.
Detaching a Database
From the Search Path, you can detach a database from your currentsession.
To detach a database
1. In the Search Path, right-click bigdata.
2. In the right-click menu, select Detach.
3. Examine the Search Path. The Big Data library is no longerattached.
Figure 4.27: Attach Library dialog.
154
Working Projects and Databases
Refreshing the View
When you refresh the view, any changes to the Search Path thathave not been reflected in a recent change are displayed. Forexample, if you add a library by calling the load function in a SpotfireS+ script, the change is not immediately displayed in the SearchPath.
To refresh the view
1. Using the Console, reattach the Big Data library. In theConsole, type
library(bigdata, first = T)
2. Right-click the Search Path.
3. In the right-click menu, click Refresh. Notice that the BigData library appears as attached in the first position (position2).
155
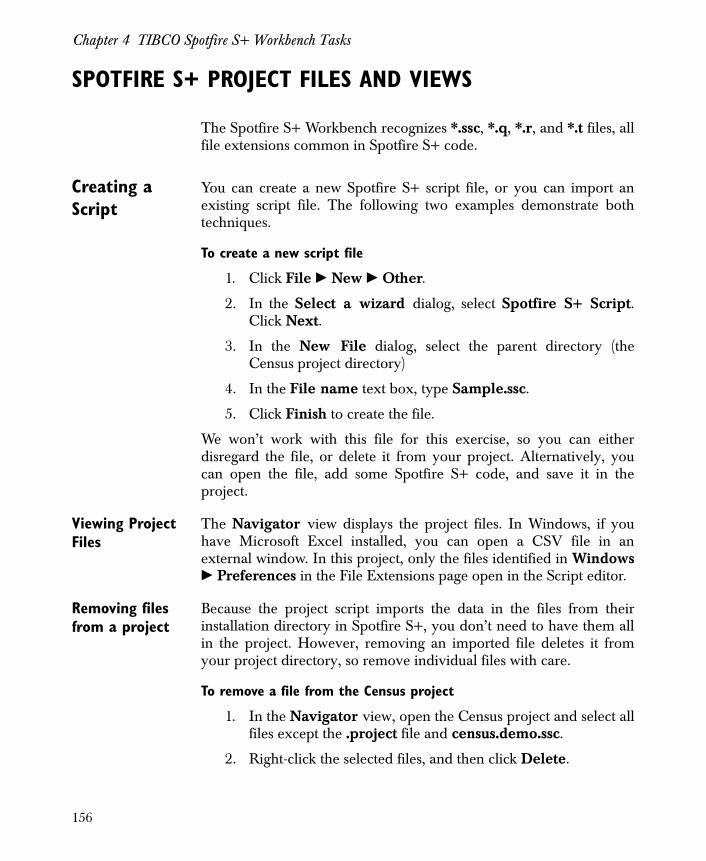
Chapter 4 TIBCO Spotfire S+ Workbench Tasks
SPOTFIRE S+ PROJECT FILES AND VIEWS
The Spotfire S+ Workbench recognizes *.ssc, *.q, *.r, and *.t files, allfile extensions common in Spotfire S+ code.
Creating a Script
You can create a new Spotfire S+ script file, or you can import anexisting script file. The following two examples demonstrate bothtechniques.
To create a new script file
1. Click File � New � Other.
2. In the Select a wizard dialog, select Spotfire S+ Script.Click Next.
3. In the New File dialog, select the parent directory (theCensus project directory)
4. In the File name text box, type Sample.ssc.
5. Click Finish to create the file.
We won’t work with this file for this exercise, so you can eitherdisregard the file, or delete it from your project. Alternatively, youcan open the file, add some Spotfire S+ code, and save it in theproject.
Viewing Project Files
The Navigator view displays the project files. In Windows, if youhave Microsoft Excel installed, you can open a CSV file in anexternal window. In this project, only the files identified in Windows� Preferences in the File Extensions page open in the Script editor.
Removing files from a project
Because the project script imports the data in the files from theirinstallation directory in Spotfire S+, you don’t need to have them allin the project. However, removing an imported file deletes it fromyour project directory, so remove individual files with care.
To remove a file from the Census project
1. In the Navigator view, open the Census project and select allfiles except the .project file and census.demo.ssc.
2. Right-click the selected files, and then click Delete.
156
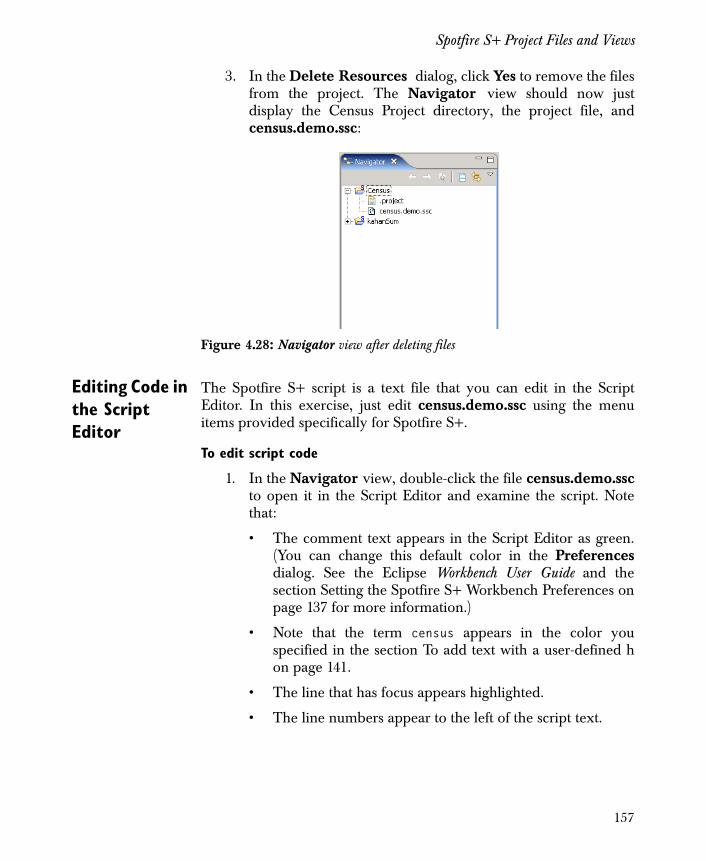
Spotfire S+ Project Files and Views
3. In the Delete Resources dialog, click Yes to remove the filesfrom the project. The Navigator view should now justdisplay the Census Project directory, the project file, andcensus.demo.ssc:
Editing Code in the Script Editor
The Spotfire S+ script is a text file that you can edit in the ScriptEditor. In this exercise, just edit census.demo.ssc using the menuitems provided specifically for Spotfire S+.
To edit script code
1. In the Navigator view, double-click the file census.demo.sscto open it in the Script Editor and examine the script. Notethat:
• The comment text appears in the Script Editor as green.(You can change this default color in the Preferencesdialog. See the Eclipse Workbench User Guide and thesection Setting the Spotfire S+ Workbench Preferences onpage 137 for more information.)
• Note that the term census appears in the color youspecified in the section To add text with a user-defined hon page 141.
• The line that has focus appears highlighted.
• The line numbers appear to the left of the script text.
Figure 4.28: Navigator view after deleting files
157
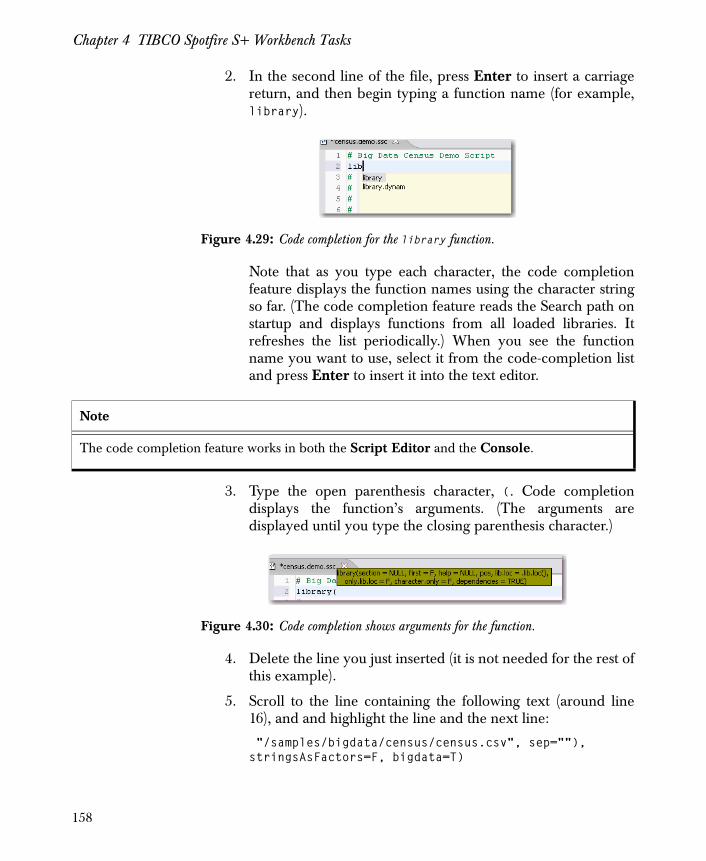
Chapter 4 TIBCO Spotfire S+ Workbench Tasks
2. In the second line of the file, press Enter to insert a carriagereturn, and then begin typing a function name (for example,library).
Note that as you type each character, the code completionfeature displays the function names using the character stringso far. (The code completion feature reads the Search path onstartup and displays functions from all loaded libraries. Itrefreshes the list periodically.) When you see the functionname you want to use, select it from the code-completion listand press Enter to insert it into the text editor.
3. Type the open parenthesis character, (. Code completiondisplays the function’s arguments. (The arguments aredisplayed until you type the closing parenthesis character.)
4. Delete the line you just inserted (it is not needed for the rest ofthis example).
5. Scroll to the line containing the following text (around line16), and and highlight the line and the next line:
"/samples/bigdata/census/census.csv", sep=""),stringsAsFactors=F, bigdata=T)
Figure 4.29: Code completion for the library function.
Note
The code completion feature works in both the Script Editor and the Console.
Figure 4.30: Code completion shows arguments for the function.
158
Spotfire S+ Project Files and Views
6. Click Spotfire S+ � Shift Left. The code shifts to the left.
7. Click Spotfire S+ � Format. This command formats theentire script. Note that the formatting change you made in theprevious step has been reverted. Also note that the linenumbers for formatted functions are highlighted.
8. Click Spotfire S+ � Toggle Comment to add a commentcharacter. Notice that the script text color changes to indicatethat the line is no longer a comment.
9. Repeat step 6, or type CTRL+SHIFT+# to remove thecomment.
To edit a function definition
1. In the Script Editor, select the function whose definition youwant to edit.
2. Press the ctrl key and click the function again.
3. The function definition opens in a temporary file in the ScriptEditor.
Alternatively, you can open a function for edit by right-clicking thefunction name, and from the menu, click Find “functonname”. Findsearches files currently open in the Script Editor, then files in theworking project, and finally in the Spotfire S+ database for thefunction definition.
To find all references to a function
1. Right-click the function whose references you want to find.
Hint
The line numbers for any line changed in your script are highlighted until the next time you save your work.
Note
Any code changes you make in an editor are not recognized by Spotfire S+ until you source the code.
159
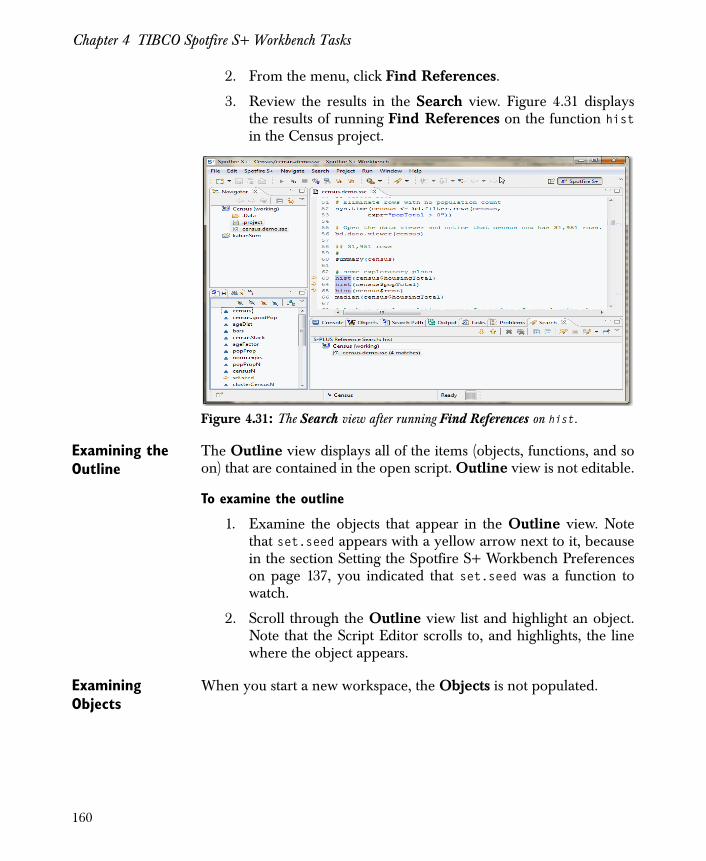
Chapter 4 TIBCO Spotfire S+ Workbench Tasks
2. From the menu, click Find References.
3. Review the results in the Search view. Figure 4.31 displaysthe results of running Find References on the function histin the Census project.
Examining the Outline
The Outline view displays all of the items (objects, functions, and soon) that are contained in the open script. Outline view is not editable.
To examine the outline
1. Examine the objects that appear in the Outline view. Notethat set.seed appears with a yellow arrow next to it, becausein the section Setting the Spotfire S+ Workbench Preferenceson page 137, you indicated that set.seed was a function towatch.
2. Scroll through the Outline view list and highlight an object.Note that the Script Editor scrolls to, and highlights, the linewhere the object appears.
Examining Objects
When you start a new workspace, the Objects is not populated.
Figure 4.31: The Search view after running Find References on hist.
160
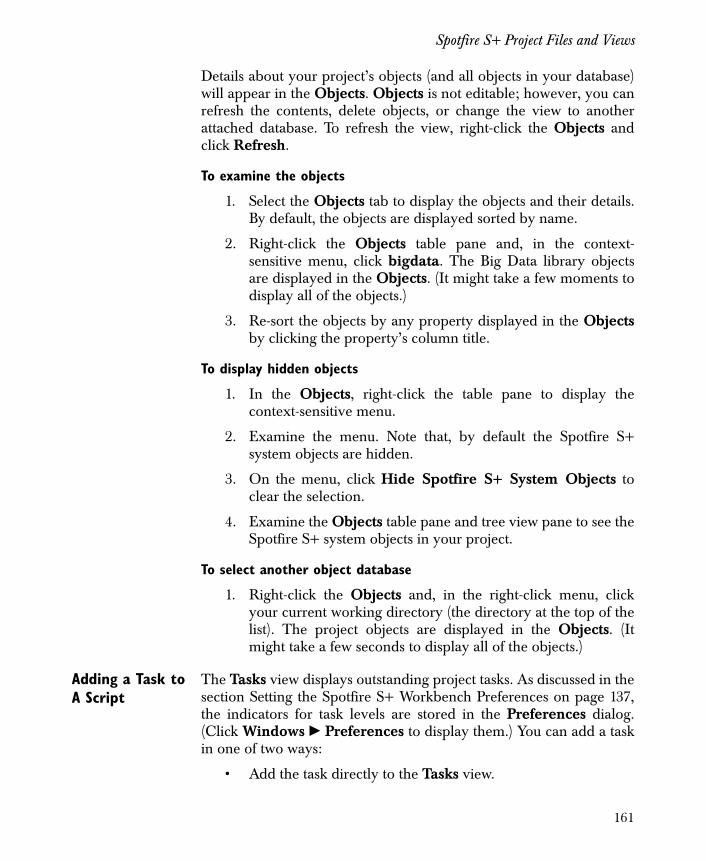
Spotfire S+ Project Files and Views
Details about your project’s objects (and all objects in your database)will appear in the Objects. Objects is not editable; however, you canrefresh the contents, delete objects, or change the view to anotherattached database. To refresh the view, right-click the Objects andclick Refresh.
To examine the objects
1. Select the Objects tab to display the objects and their details.By default, the objects are displayed sorted by name.
2. Right-click the Objects table pane and, in the context-sensitive menu, click bigdata. The Big Data library objectsare displayed in the Objects. (It might take a few moments todisplay all of the objects.)
3. Re-sort the objects by any property displayed in the Objectsby clicking the property’s column title.
To display hidden objects
1. In the Objects, right-click the table pane to display thecontext-sensitive menu.
2. Examine the menu. Note that, by default the Spotfire S+system objects are hidden.
3. On the menu, click Hide Spotfire S+ System Objects toclear the selection.
4. Examine the Objects table pane and tree view pane to see theSpotfire S+ system objects in your project.
To select another object database
1. Right-click the Objects and, in the right-click menu, clickyour current working directory (the directory at the top of thelist). The project objects are displayed in the Objects. (Itmight take a few seconds to display all of the objects.)
Adding a Task to A Script
The Tasks view displays outstanding project tasks. As discussed in thesection Setting the Spotfire S+ Workbench Preferences on page 137,the indicators for task levels are stored in the Preferences dialog.(Click Windows � Preferences to display them.) You can add a taskin one of two ways:
• Add the task directly to the Tasks view.
161
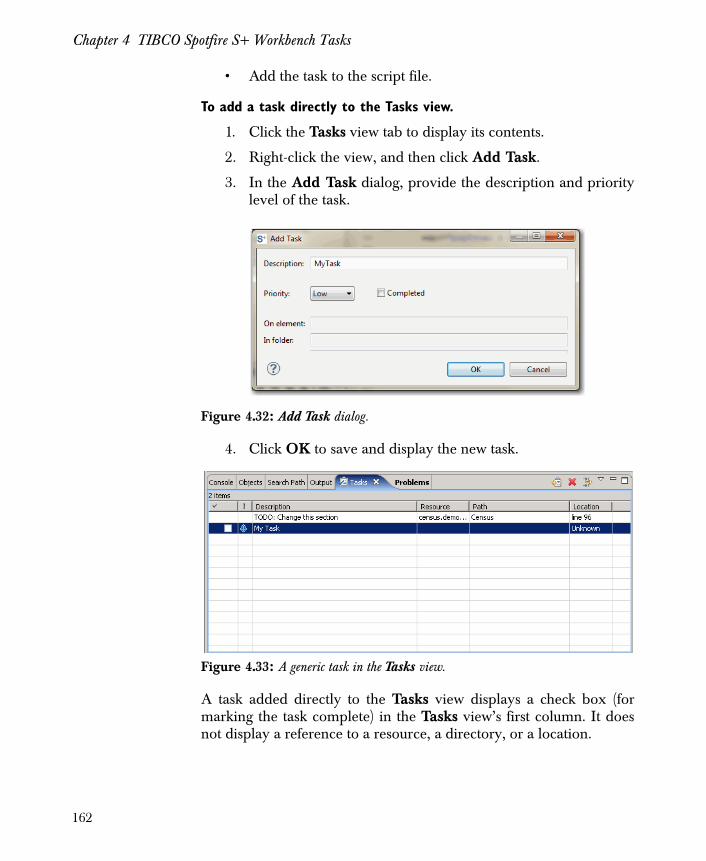
Chapter 4 TIBCO Spotfire S+ Workbench Tasks
• Add the task to the script file.
To add a task directly to the Tasks view.
1. Click the Tasks view tab to display its contents.
2. Right-click the view, and then click Add Task.
3. In the Add Task dialog, provide the description and prioritylevel of the task.
4. Click OK to save and display the new task.
A task added directly to the Tasks view displays a check box (formarking the task complete) in the Tasks view’s first column. It doesnot display a reference to a resource, a directory, or a location.
Figure 4.32: Add Task dialog.
Figure 4.33: A generic task in the Tasks view.
162
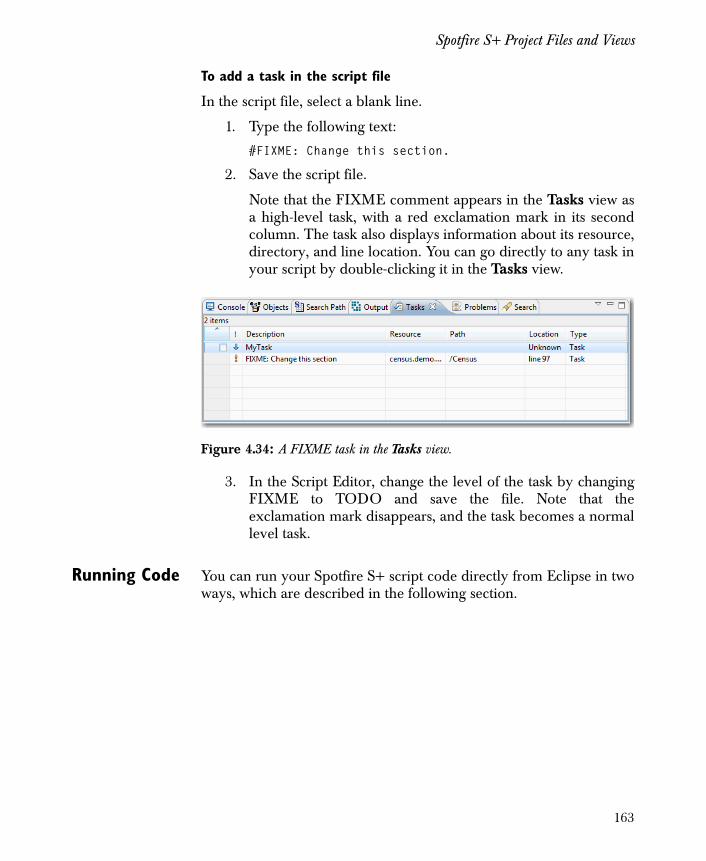
Spotfire S+ Project Files and Views
To add a task in the script file
In the script file, select a blank line.
1. Type the following text:
#FIXME: Change this section.
2. Save the script file.
Note that the FIXME comment appears in the Tasks view asa high-level task, with a red exclamation mark in its secondcolumn. The task also displays information about its resource,directory, and line location. You can go directly to any task inyour script by double-clicking it in the Tasks view.
3. In the Script Editor, change the level of the task by changingFIXME to TODO and save the file. Note that theexclamation mark disappears, and the task becomes a normallevel task.
Running Code You can run your Spotfire S+ script code directly from Eclipse in twoways, which are described in the following section.
Figure 4.34: A FIXME task in the Tasks view.
163
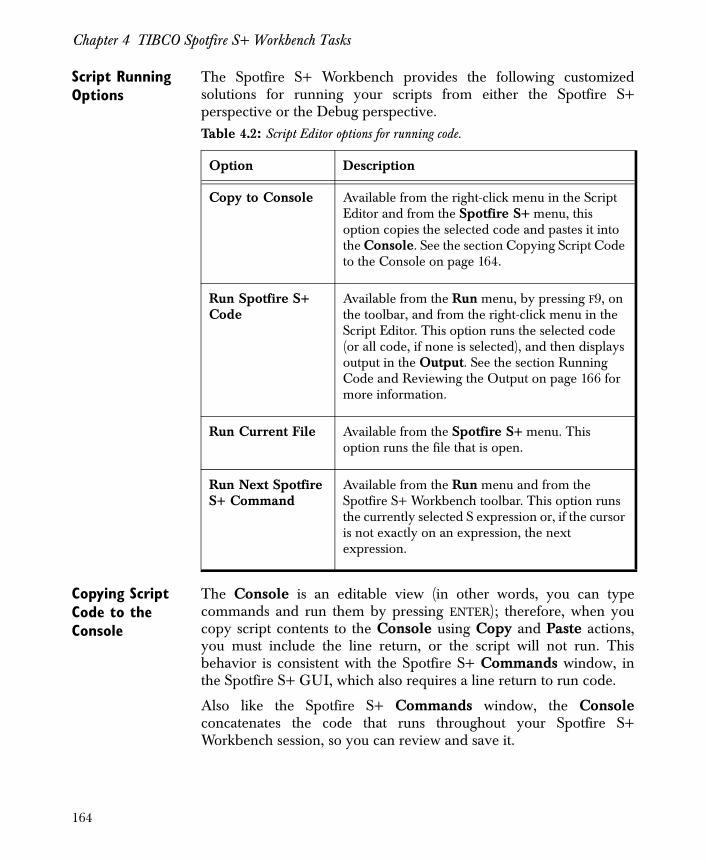
Chapter 4 TIBCO Spotfire S+ Workbench Tasks
Script Running Options
The Spotfire S+ Workbench provides the following customizedsolutions for running your scripts from either the Spotfire S+perspective or the Debug perspective.
Copying Script Code to the Console
The Console is an editable view (in other words, you can typecommands and run them by pressing ENTER); therefore, when youcopy script contents to the Console using Copy and Paste actions,you must include the line return, or the script will not run. Thisbehavior is consistent with the Spotfire S+ Commands window, inthe Spotfire S+ GUI, which also requires a line return to run code.
Also like the Spotfire S+ Commands window, the Consoleconcatenates the code that runs throughout your Spotfire S+Workbench session, so you can review and save it.
Table 4.2: Script Editor options for running code.
Option Description
Copy to Console Available from the right-click menu in the Script Editor and from the Spotfire S+ menu, this option copies the selected code and pastes it into the Console. See the section Copying Script Code to the Console on page 164.
Run Spotfire S+ Code
Available from the Run menu, by pressing F9, on the toolbar, and from the right-click menu in the Script Editor. This option runs the selected code (or all code, if none is selected), and then displays output in the Output. See the section Running Code and Reviewing the Output on page 166 for more information.
Run Current File Available from the Spotfire S+ menu. This option runs the file that is open.
Run Next Spotfire S+ Command
Available from the Run menu and from the Spotfire S+ Workbench toolbar. This option runs the currently selected S expression or, if the cursor is not exactly on an expression, the next expression.
164
Spotfire S+ Project Files and Views
To run copied script code
1. From within the Census project’s script, select lines 1 - 13 inthe script. Be sure to select the line return at the end of line 13.
2. Right-click the code and click Copy to Console. The selectedcode is copied immediately to the Console and runs. You donot need to paste it in the Console.
3. Repeat steps 1 and 2 for lines 15-18.
4. Finally, repeat steps 1 and 2 for a few more lines.
(You can select all of the code, but if you do so, it appears inthe History as one line. By following the steps above, theHistory reflects the three different calls to run the code. Seethe section Examining the History on page 165 for moreinformation.)
Copying Script Code from the Console view
You can select and copy code from the Console.
• To copy just code, select the code in the console that you wantto copy, right-click the Console, and from the menu, clickCopy.
• To copy code and the prompts (> and +) in the Console, setthe Window � Preferences option Include Prompts inCopy action on the Console/Output page. After you set thisoption, any lines you select and copy using the right-clickCopy action includes both code and prompts.
• To copy the entire contents of the Console, right-click theview, and on the menu, click Select All, and then right-clickagain and select Copy.
Examining the History
This exercise uses the script code run in the section Copying ScriptCode to the Console on page 164.
The History reflects the code run in the Console. Note that theHistory displays each selection you make, even if it is more than onecommand, on one line, and if the line extends beyond about 50characters, the History displays an ellipse (...) to indicate more code.To display each line of code in the History, you must run the linesindividually.
165
Chapter 4 TIBCO Spotfire S+ Workbench Tasks
To examine the history
1. To examine and rerun code from the History.
2. Click the History tab to give it focus.
3. Right-click the first line of code, and click Select input. Thecode is copied to the Console. You must return to theConsole and press ENTER to run the code.
(Alternatively, double-click the code in the History to copy itto the Console and run it.)
You can scroll through the individual entries in the History; as youscroll, the selection appears in the Console. To run a selected item,switch from the History to the Console and press ENTER at the endof the code line.
Running Code and Reviewing the Output
You can run code directly from the Script Editor by using the RunSpotfire S+ Code feature.
To run code
1. Select the Output tab.
2. In the Script Editor, select the code to run (or, to run thewhole script, select nothing), and press F9, or on the toolbar,click RunSpotfire S+ Code.
The Output displays the run code and any Spotfire S+messages.
To run the current expression
• On the Spotfire S+ toolbar, click Run Next Spotfire S+Command. The currently-selected S expression runs, and thenext expression is selected. (If the cursor location does notmatch an expression exactly, the next expression is evaluated.
Fixing Problems in the Code
Introduce a programmatic problem in the script to examine theresults in the Problems view.
To examine problems
1. In the Script Editor, on line 13 of the script, remove theclosing parenthesis.
166
Spotfire S+ Project Files and Views
2. Save the file. Note that the Problems view tab shows boldtext.
3. Click the Problems view tab to display the view.
4. Click the problem description. Note that the Script Editorhighlights the line where the code is broken.
5. In the Script Editor, replace the missing parenthesis and saveyour file. Note that the problem disappears from theProblems view.
Closing and Reopening the Project
The Spotfire S+ Workbench maintains a list of your projects in theNavigator view, even after you close all associated files.
To close the project
1. Select the project to close.
2. Right-click the Navigator view and, from the menu, clickClose Project.
3. Examine the Objects and note that it still displays project orworkspace objects.
To reopen the closed project
1. Select the project.
2. Right-click the Navigator view and, from the menu, clickOpen Project.
In the next section, examine the Debug perspective using a differentexample, creating a new project. You can close the Census project atthis point, if you choose.
167
Chapter 4 TIBCO Spotfire S+ Workbench Tasks
PACKAGES IN THE WORKBENCH
The Spotfire S+ Workbench supports creating or using Spotfire S+packages by providing a simple mechanism to:
• Create a package project structure that includes all requiredfiles and folders.
• Find and install either package source files or binary files fromeither the CSAN Web site (http://spotfire.tibco.com/csan)or other repository.
• Update either the source files or binary packages from eitherthe CSAN Web site or other repository.
• Export a package to a specified repository, either as a sourceor a binary package.
Creating a New Package Project
In this exercise, create a project for the soundex example, which isdescribed in the Guide to Packages.
To create a package project
1. If you have not already done so, install the package utilites.
install.pkgutils()
2. Click File � New� Project.
3. In the New Project dialog, select Spotfire S+ Project. ClickNext.
4. Provide the friendly project name, “Soundex.” Accept theoption Use default location. This option creates the projectdirectory in the default workspace location.
5. Select Create Spotfire S+ Package Structure.
6. Click Finish to create the project.
To create the package project structure, the wizard loads thepkgutils library (if it is not loaded already), and then it callspackage.skeleton .
7. Click File � New � Other, and in the New dialog, selectSpotfire S+ Script. Click Next.
168
Packages in the Workbench
8. In the New File dialog, select Soundex/R as the parentfolder, and in the File name box, type soundex.ssc.
9. Click Finish.
10. In the Script Editor, define the soundex function:
"soundex"<-function(x) {
base <- gsub("[^A-Z]", "", toupper(gsub("^.*[ \t]","", gsub("[ \t]*$", "", x))))
basecode <- gsub("[AEIOUY]", "", gsub("[R]+", "6",gsub("[MN]+", "5", gsub("[L]+", "4",gsub("[DT]+", "3", gsub("[CGJKQSXZ]+", "2",gsub("[BFPV]+", "1", gsub("[HW]", "", base))))))))
sprintf("%4.4s", paste(substring(base, 1, 1), ifelse(regexpr("^[HWAEIOUY]", base) == 1,
basecode, substring(basecode, 2)), "000", sep = ""))
}
11. Save the file.
12. Run the function by selecting the code in the Script Editorand clicking Run.
13. Repeat Step 7, this time creating a script file namedsample.surnames.ssc
14. In the Script Editor, create the following object:
sample.surnames <- c("Ashcroft", "Asicroft","de la Rosa", "Del Mar", "Eberhard","Engebrethson", "O’Brien", "Opnian", "van Lind","Zita", "Zitzmeinn")
15. Save the file, and then instantiate the object by selecting thecode in the Script Editor and clicking Run.
16. In the Console, call the soundex function, passing in thesample.surnames object:
soundex(sample.surnames)
17. Create the soundex .Rd file:
169
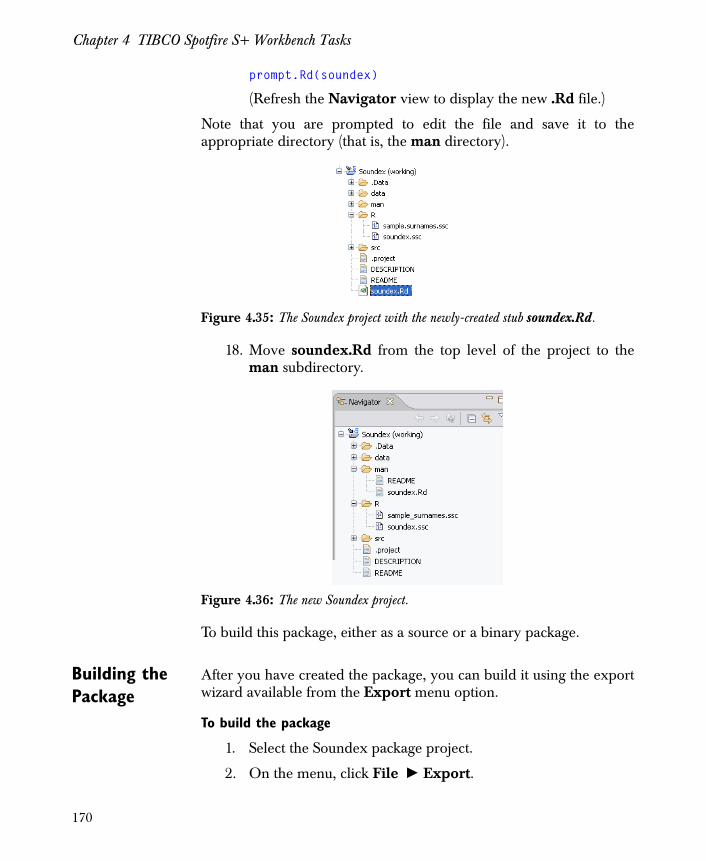
Chapter 4 TIBCO Spotfire S+ Workbench Tasks
prompt.Rd(soundex)
(Refresh the Navigator view to display the new .Rd file.)
Note that you are prompted to edit the file and save it to theappropriate directory (that is, the man directory).
18. Move soundex.Rd from the top level of the project to theman subdirectory.
To build this package, either as a source or a binary package.
Building the Package
After you have created the package, you can build it using the exportwizard available from the Export menu option.
To build the package
1. Select the Soundex package project.
2. On the menu, click File � Export.
Figure 4.35: The Soundex project with the newly-created stub soundex.Rd.
Figure 4.36: The new Soundex project.
170
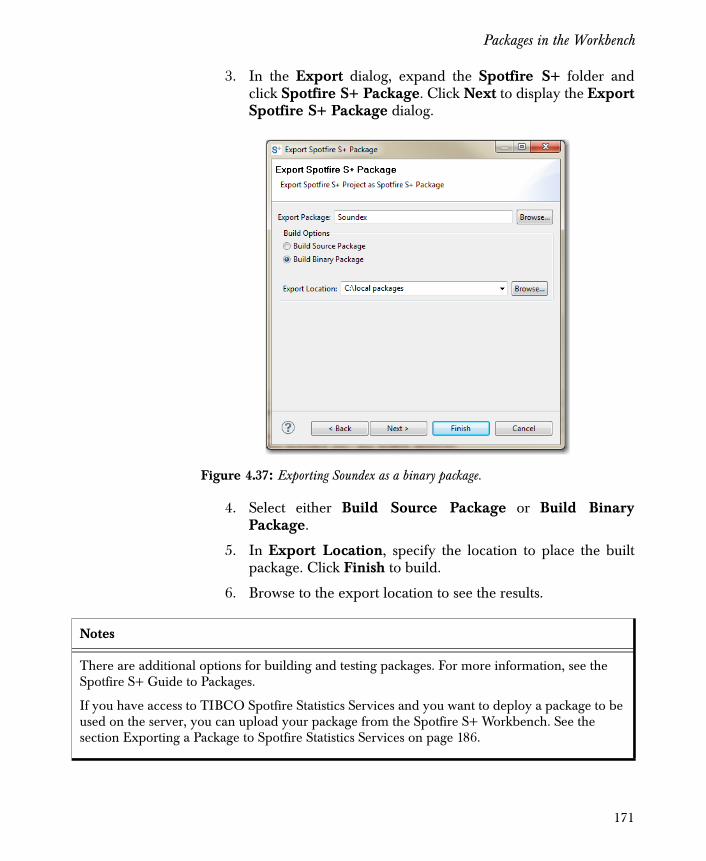
Packages in the Workbench
3. In the Export dialog, expand the Spotfire S+ folder andclick Spotfire S+ Package. Click Next to display the ExportSpotfire S+ Package dialog.
4. Select either Build Source Package or Build BinaryPackage.
5. In Export Location, specify the location to place the builtpackage. Click Finish to build.
6. Browse to the export location to see the results.
Figure 4.37: Exporting Soundex as a binary package.
Notes
There are additional options for building and testing packages. For more information, see the Spotfire S+ Guide to Packages.
If you have access to TIBCO Spotfire Statistics Services and you want to deploy a package to be used on the server, you can upload your package from the Spotfire S+ Workbench. See the section Exporting a Package to Spotfire Statistics Services on page 186.
171
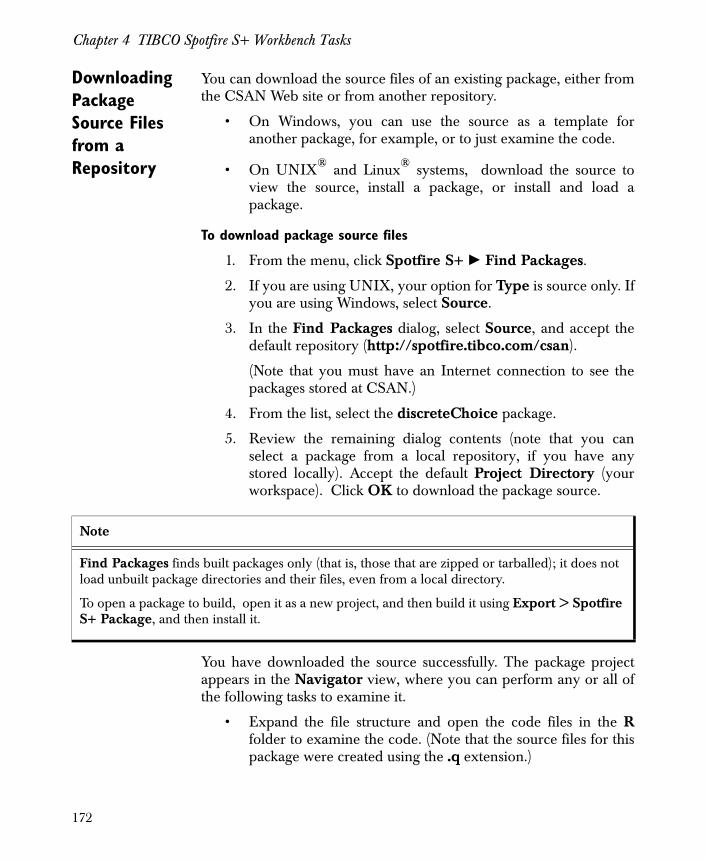
Chapter 4 TIBCO Spotfire S+ Workbench Tasks
Downloading Package Source Files from a Repository
You can download the source files of an existing package, either fromthe CSAN Web site or from another repository.
• On Windows, you can use the source as a template foranother package, for example, or to just examine the code.
• On UNIX® and Linux® systems, download the source toview the source, install a package, or install and load apackage.
To download package source files
1. From the menu, click Spotfire S+ � Find Packages.
2. If you are using UNIX, your option for Type is source only. Ifyou are using Windows, select Source.
3. In the Find Packages dialog, select Source, and accept thedefault repository (http://spotfire.tibco.com/csan).
(Note that you must have an Internet connection to see thepackages stored at CSAN.)
4. From the list, select the discreteChoice package.
5. Review the remaining dialog contents (note that you canselect a package from a local repository, if you have anystored locally). Accept the default Project Directory (yourworkspace). Click OK to download the package source.
You have downloaded the source successfully. The package projectappears in the Navigator view, where you can perform any or all ofthe following tasks to examine it.
• Expand the file structure and open the code files in the Rfolder to examine the code. (Note that the source files for thispackage were created using the .q extension.)
Note
Find Packages finds built packages only (that is, those that are zipped or tarballed); it does not load unbuilt package directories and their files, even from a local directory.
To open a package to build, open it as a new project, and then build it using Export > Spotfire S+ Package, and then install it.
172
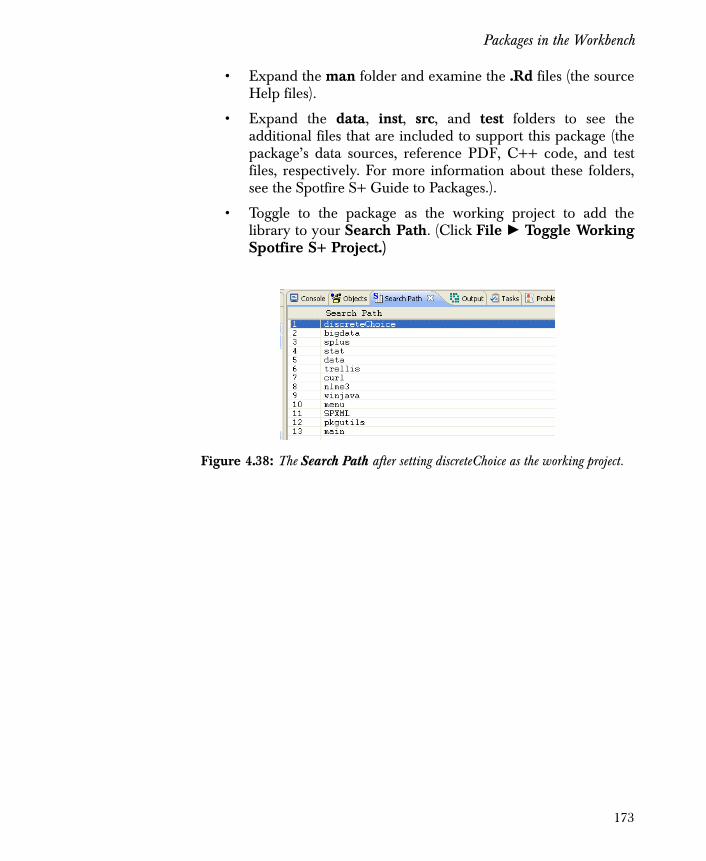
Packages in the Workbench
• Expand the man folder and examine the .Rd files (the sourceHelp files).
• Expand the data, inst, src, and test folders to see theadditional files that are included to support this package (thepackage’s data sources, reference PDF, C++ code, and testfiles, respectively. For more information about these folders,see the Spotfire S+ Guide to Packages.).
• Toggle to the package as the working project to add thelibrary to your Search Path. (Click File � Toggle WorkingSpotfire S+ Project.)
Figure 4.38: The Search Path after setting discreteChoice as the working project.
173
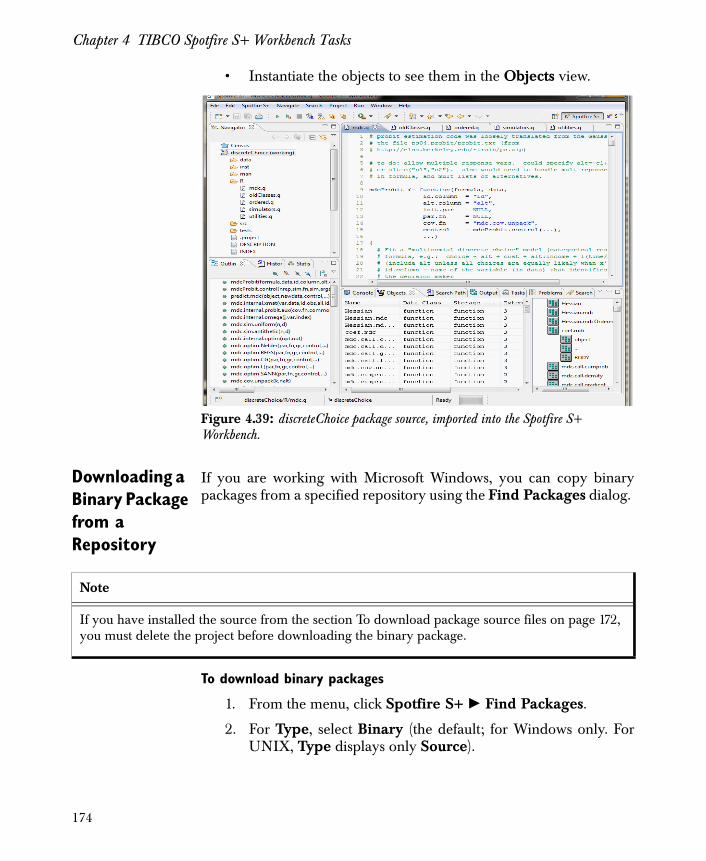
Chapter 4 TIBCO Spotfire S+ Workbench Tasks
• Instantiate the objects to see them in the Objects view.
Downloading a Binary Package from a Repository
If you are working with Microsoft Windows, you can copy binarypackages from a specified repository using the Find Packages dialog.
To download binary packages
1. From the menu, click Spotfire S+ � Find Packages.
2. For Type, select Binary (the default; for Windows only. ForUNIX, Type displays only Source).
Figure 4.39: discreteChoice package source, imported into the Spotfire S+ Workbench.
Note
If you have installed the source from the section To download package source files on page 172, you must delete the project before downloading the binary package.
174
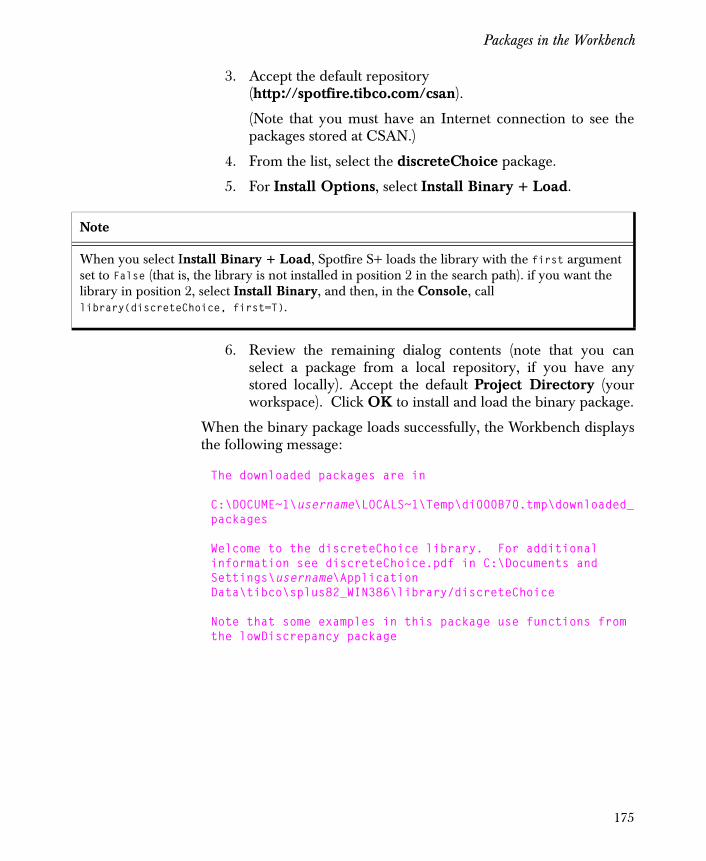
Packages in the Workbench
3. Accept the default repository (http://spotfire.tibco.com/csan).
(Note that you must have an Internet connection to see thepackages stored at CSAN.)
4. From the list, select the discreteChoice package.
5. For Install Options, select Install Binary + Load.
6. Review the remaining dialog contents (note that you canselect a package from a local repository, if you have anystored locally). Accept the default Project Directory (yourworkspace). Click OK to install and load the binary package.
When the binary package loads successfully, the Workbench displaysthe following message:
The downloaded packages are in
C:\DOCUME~1\username\LOCALS~1\Temp\di000B70.tmp\downloaded_packages
Welcome to the discreteChoice library. For additional information see discreteChoice.pdf in C:\Documents andSettings\username\Application Data\tibco\splus82_WIN386\library/discreteChoice
Note that some examples in this package use functions from the lowDiscrepancy package
Note
When you select Install Binary + Load, Spotfire S+ loads the library with the first argument set to False (that is, the library is not installed in position 2 in the search path). if you want the library in position 2, select Install Binary, and then, in the Console, call library(discreteChoice, first=T).
175
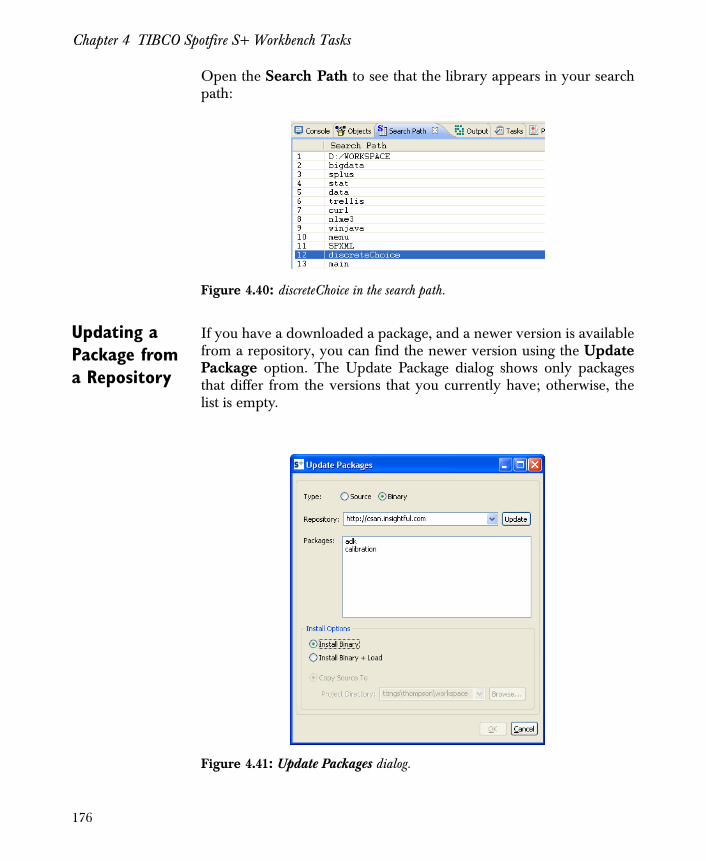
Chapter 4 TIBCO Spotfire S+ Workbench Tasks
Open the Search Path to see that the library appears in your searchpath:
Updating a Package from a Repository
If you have a downloaded a package, and a newer version is availablefrom a repository, you can find the newer version using the UpdatePackage option. The Update Package dialog shows only packagesthat differ from the versions that you currently have; otherwise, thelist is empty.
Figure 4.40: discreteChoice in the search path.
Figure 4.41: Update Packages dialog.
176
Packages in the Workbench
To update a package
1. From the menu, click Spotfire S+ � Update Packages.
2. On Windows, in the Update Packages dialog, select the type(either Source or Binary). UNIX updates only sourcepackages.
3. Select the repository where the newer package exists.
4. From the list, select the package to update, and then select theInstall Options:
• Install Binary
• Install Binary + Load
• Copy Source to Project Directory
177
Chapter 4 TIBCO Spotfire S+ Workbench Tasks
SPOTFIRE STATISTICS SERVICES REMOTE SUBMISSIONS
By default, the Spotfire S+ Workbench displays the StatisticsServices view. To use this feature, you must have access to SpotfireStatistics Services, a TIBCO service that you can use to run jobs on aremote S-PLUS engine. See your server adminsitrator for moreinformation.
This section walks through
• Adding a new connection to Spotfire Statistics Services.
• Connecting to an existing Spotfire Statistics Services server.
• Submitting a job.
• Examining the contents of the resulting job’s folder.
• Scheduling a job.
• Monitoring jobs.
• Uploading a package.
• Deleting a package.
For a description of the menu items and dialogs for this feature, seethe section Statistics Services view on page 76.
Submitting a Remote Job
In the following example, send a job to Spotfire Statistics Services.First, add a connection to the server. Then practice disconnectingand reconnecting. Create a simple project with a script and send it toSpotfire Statistics Services. Examine the results.
To add a connection
1. On the Spotfire Statistics Services view toolbar, click AddConnection ( ).
2. In the dialog Add Service Connection, provide a friendlyname, a server URL, and your user credentials (name andpassword). You are required to provide a password only ifauthentication is enabled on the server. Note that yourpassword is persisted only for the duration of the currentWorkbench session, and you must provide your credentials
178
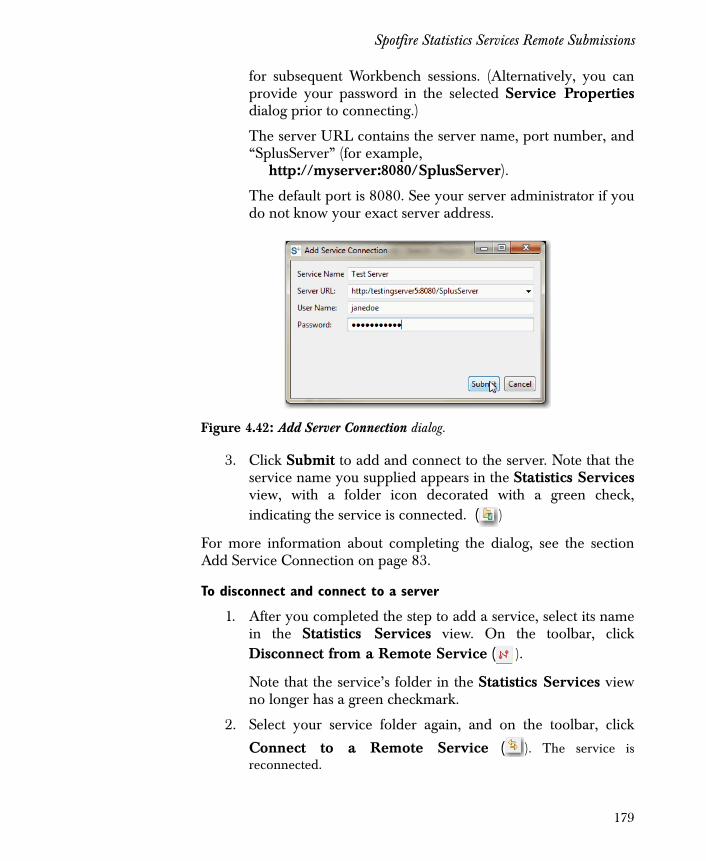
Spotfire Statistics Services Remote Submissions
for subsequent Workbench sessions. (Alternatively, you canprovide your password in the selected Service Propertiesdialog prior to connecting.)
The server URL contains the server name, port number, and“SplusServer” (for example, http://myserver:8080/SplusServer).
The default port is 8080. See your server administrator if youdo not know your exact server address.
3. Click Submit to add and connect to the server. Note that theservice name you supplied appears in the Statistics Servicesview, with a folder icon decorated with a green check,indicating the service is connected. ( )
For more information about completing the dialog, see the sectionAdd Service Connection on page 83.
To disconnect and connect to a server
1. After you completed the step to add a service, select its namein the Statistics Services view. On the toolbar, clickDisconnect from a Remote Service ( ).
Note that the service’s folder in the Statistics Services viewno longer has a green checkmark.
2. Select your service folder again, and on the toolbar, click
Connect to a Remote Service ( ). The service isreconnected.
Figure 4.42: Add Server Connection dialog.
179
Chapter 4 TIBCO Spotfire S+ Workbench Tasks
To submit a job
1. Create a new project called sample_scripts and make it yourworking project. Create a new file, a Spotfire S+ script, in theproject and call it samplescript1.ssc.
2. Copy and paste the following example code into the ScriptEditor:
java.graph("mygraph.spj", format="SPJ") show.settings() dev.off()
• Remember that you can run jobs on Spotfire StatisticsServices only from the Script Editor, not from theConsole.
• You can run either the entire script, or you can run onlythe selected code.
3. In the Spotfire Statistics Services view, select the servicewhere you want to run the example.
4. In the Spotfire Statistics Services view, on the toolbar, clickRun ( ).
5. Note that the service folder expands the Jobs folder to displaythe folder for the running job. When the run is done, if it hasrun successfully, a green checkmark appears on the folder,and the folder name changes from JobID (Waiting) to JobID(Done). (This job is short, so it should run immediately.)
To examine a job
1. Expand the job folder containing the job run in the previoussteps. Note that when you expand the folder, the labelchanges from boldface to regular typeface to indicate youhave examined it.
Note
Make sure you click the Run button on the Statistics Services view toolbar to run your script in the Spotfire Statistics Services S-PLUS engine. The Run button on the Workbench toolbar runs your job in your local S-PLUS engine.
180
Spotfire Statistics Services Remote Submissions
2. Expand the Results folder and examine the contents:engine.log and mygraph.spj.
• Double-click engine.log to display its contents in theOutput view.
• Double-click mygraph.spj to display the graph resultingfrom the code in a Graph Window.
3. Double-click Return Value. Its contents are displayed in theOutput view and includes the following:
> retVal.ComputerName.JobID
null device 1
(dev.off returns the number of the current device after thedevice was shut down. By default, it is 1.)
4. Double-click Script. Its contents are displayed in a new ScriptEditor. The script’s label bears an identifier, as follows:scriptjob_ComputerName_JobID_scriptGUID.
The contents of the Script Editor should match the code thatyou ran. You can close this script.
To schedule a job.
1. Leave the script window open, and in the Spotfire StatisticsServices view, select your service.
2. In the Statistics Services view, click schedule ( ).
3. Examine the dialog for current time and date, and check theserver time zone, and if your server is running at a timedifferent from your computer. (If so, adjust the exampleaccordingly.)
181
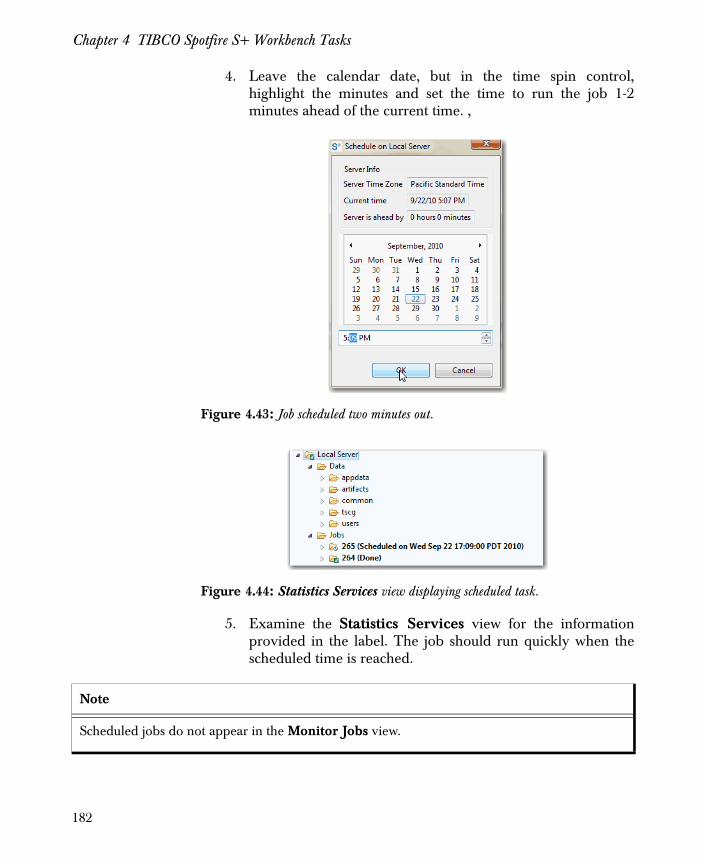
Chapter 4 TIBCO Spotfire S+ Workbench Tasks
4. Leave the calendar date, but in the time spin control,highlight the minutes and set the time to run the job 1-2minutes ahead of the current time. ,
5. Examine the Statistics Services view for the informationprovided in the label. The job should run quickly when thescheduled time is reached.
Figure 4.43: Job scheduled two minutes out.
Figure 4.44: Statistics Services view displaying scheduled task.
Note
Scheduled jobs do not appear in the Monitor Jobs view.
182
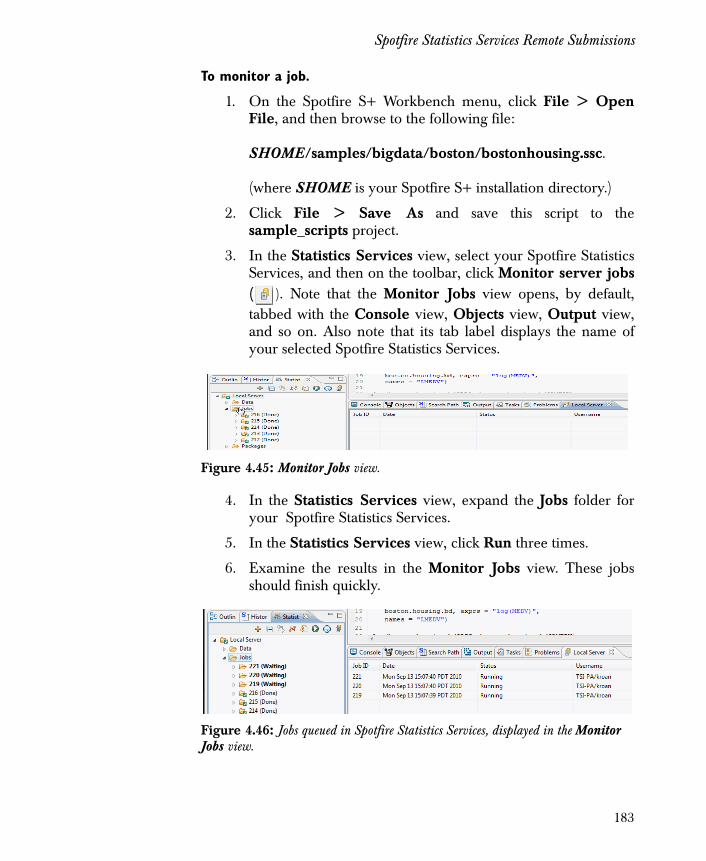
Spotfire Statistics Services Remote Submissions
To monitor a job.
1. On the Spotfire S+ Workbench menu, click File > OpenFile, and then browse to the following file:
SHOME/samples/bigdata/boston/bostonhousing.ssc.
(where SHOME is your Spotfire S+ installation directory.)
2. Click File > Save As and save this script to thesample_scripts project.
3. In the Statistics Services view, select your Spotfire StatisticsServices, and then on the toolbar, click Monitor server jobs( ). Note that the Monitor Jobs view opens, by default,tabbed with the Console view, Objects view, Output view,and so on. Also note that its tab label displays the name ofyour selected Spotfire Statistics Services.
4. In the Statistics Services view, expand the Jobs folder foryour Spotfire Statistics Services.
5. In the Statistics Services view, click Run three times.
6. Examine the results in the Monitor Jobs view. These jobsshould finish quickly.
Figure 4.45: Monitor Jobs view.
Figure 4.46: Jobs queued in Spotfire Statistics Services, displayed in the Monitor Jobs view.
183
Chapter 4 TIBCO Spotfire S+ Workbench Tasks
Managing Data Files on Spotfire Statistics Services
You can upload and download files, including data files, from theStatistics Services view.
To upload a data file
1. Select the running service, and expand its folder.
2. Select the Data folder, or one of its subfolders (depending onwhere you want to store your data file).
3. Right click the folder, and from the right-click menu, selectUpload File.
4. Browse to the location of your data file. For example, browseto:
SHOME/samples/bigdata/stocks
5. Select a file to upload (for example, cbe.csv), and then clickOpen (OK on UNIX). The file is added to your Data folder.
To preview a data file and get the summary information
1. Expand the Data folder to find the file you just uploaded.
184
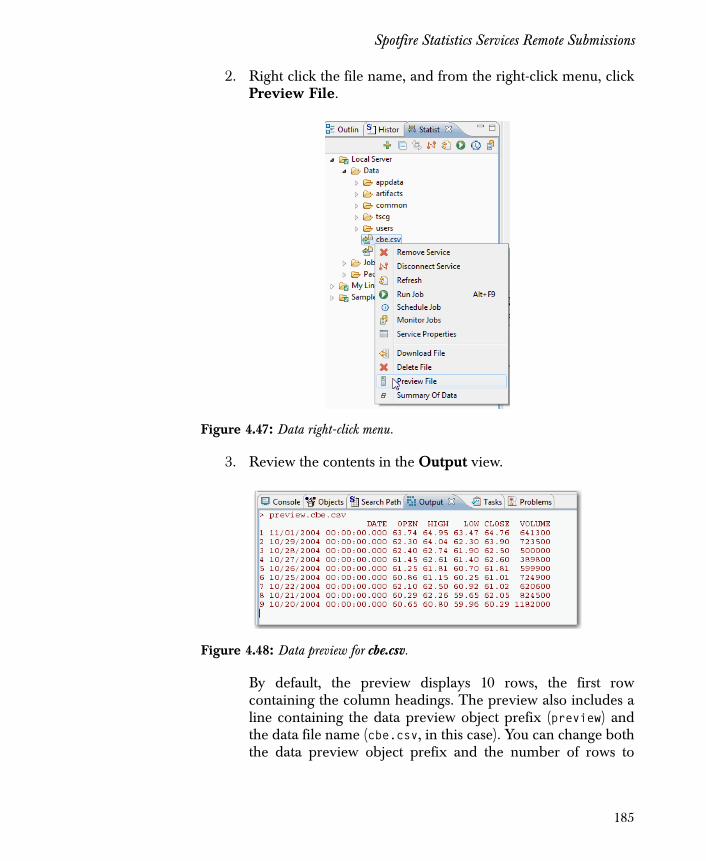
Spotfire Statistics Services Remote Submissions
2. Right click the file name, and from the right-click menu, clickPreview File.
3. Review the contents in the Output view.
By default, the preview displays 10 rows, the first rowcontaining the column headings. The preview also includes aline containing the data preview object prefix (preview) andthe data file name (cbe.csv, in this case). You can change boththe data preview object prefix and the number of rows to
Figure 4.47: Data right-click menu.
Figure 4.48: Data preview for cbe.csv.
185
Chapter 4 TIBCO Spotfire S+ Workbench Tasks
preview in the Window > Preferences dialog. See thesection Statistics Services Options on page 25 for moreinformation.
4. Right click the data file again, and this time, select Summaryof Data.
5. Review the results in the Output view, including the datasummary value prefix (also editable in the Window >Preferences dialog).
To download a data file
1. Right click the file a third time, and from the menu, selectDownload File.
2. Browse to a location to store the file, or click Cancel.
To delete a data file
• Right click the file in the Data directory, and from the menuclick Delete File. Click OK.
Exporting a Package to Spotfire Statistics Services
In this task, export the Soundex package that you created previously,in the section Creating a New Package Project on page 168.
To upload a package to Spotfire Statistics Services
1. In the Statistics Services view, make sure you are connectedto the remote service. (For more information about this seethe section To add a connection on page 178.
2. In the Navigator view, select the Soundex package, whichyou created as part of the exercise in the section Building thePackage on page 170.
3. Click File > Export.
4. In the Export dialog, expand Statistics Services, and thenselect Spotfire S+ Package Upload.
5. Click Next.
6. In the Select server to deploy to drop-down, select yourSpotfire Statistics Services from the list.
7. Click Finish.
186
Spotfire Statistics Services Remote Submissions
8. In the Statistics Services view, for your service, expand thePackages folder. The Soundex package should appear.
9. In the Script Editor, type library(Soundex), and run it fromthe server.
10. In the Script Editor, type search(), and run it from the server.
11. In the Statistics Services view, expand the job you just ran,and double-click Return Value. The Output view displaysthe search path. Soundex should appear on the list.
Notes
• You must have Perl version 5.8 or later to export a package.
• Exporting as a package for Windows builds a binary.
• The package must be in the S-PLUS engine’s INIT file on the server to be loaded and used when the S-PLUS engine is loaded. See your server administrator if you want to have this option set. Alternatively, before using functions in an uploaded package, type library(packagename).
• The package is uploaded to the server as an unprotected package. (That is, you can delete it later.)
See the TIBCO Spotfire Guide to Packages for more information.
187
Chapter 4 TIBCO Spotfire S+ Workbench Tasks
SPOTFIRE S+ WORKBENCH DEBUGGER TASKS
This section describes basic tasks you will want to know how toperform on a simple file set.
Kahan Example
In numerical analysis, the Kahan summation algorithm minimizes theerror when adding a sequence of finite precision floating pointnumbers. (It is also called compensated summation. This algorithm isattributed to William Kahan.)
The Spotfire S+ Debugger example uses a simple Kahan summationalgorithm captured in two files. If you have not already done so,create this project and import the example files. See the sectionAdding the Sample Debugging Project on page 136.
The project’s two files are as follows:
• kahanSum.q contains the function kahanSum.
• kahanAddNext_func.q contains the function, kahanAddNext,which is called by the function kahanSum.
Opening the Debug Perspective
Before using the Workbench Debugger and Profiler, you must openthe Debug perspective. If you have closed your project in theprevious exercise and want to continue practicing using the SpotfireS+ Debugger, first re-open your project, and open the two files in theScript Editor. Next, change to the Debug perspective.
For a more in-depth description of the Debug perspective, see thesection Debug Perspective Options and Preferences on page 92.
To open the Debug perspective
1. On the perspective toolbar, click Open Perspective.
Note
If you open a file using the File � Open File menu command, and that file is not in a Spotfire S+ Workbench project, you cannot set a breakpoint in that file.
The following instruction works with the kahanSum example, located in your SHOME/samples/directory. To create a kahanSum project, follow the steps to create a project (see the section Quick Start on page 127).
188
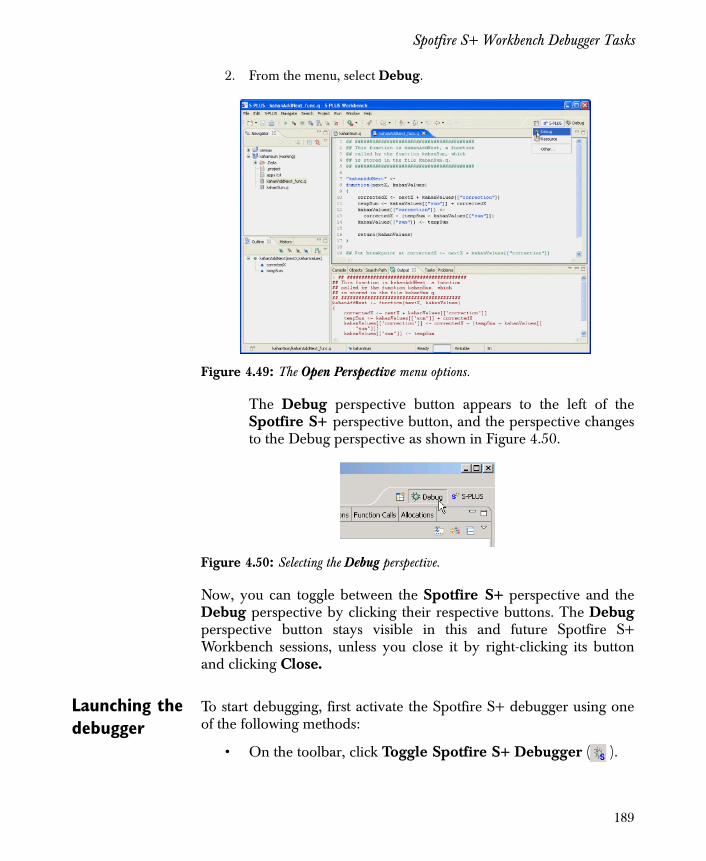
Spotfire S+ Workbench Debugger Tasks
2. From the menu, select Debug.
The Debug perspective button appears to the left of theSpotfire S+ perspective button, and the perspective changesto the Debug perspective as shown in Figure 4.50.
Now, you can toggle between the Spotfire S+ perspective and theDebug perspective by clicking their respective buttons. The Debugperspective button stays visible in this and future Spotfire S+Workbench sessions, unless you close it by right-clicking its buttonand clicking Close.
Launching the debugger
To start debugging, first activate the Spotfire S+ debugger using oneof the following methods:
• On the toolbar, click Toggle Spotfire S+ Debugger ( ).
Figure 4.49: The Open Perspective menu options.
Figure 4.50: Selecting the Debug perspective.
189
Chapter 4 TIBCO Spotfire S+ Workbench Tasks
• On the menu, click the Run � Toggle Spotfire S+ Debugger.
• On the keyboard, press CTRL+ALT+D.
After you activate the debugger, any expression you type in theConsole, or that you run by clicking Run Spotfire S+ Code ( ) onthe toolbar, invokes the debugger.
Setting breakpoints
One of the most basic debugging tasks is setting a breakpoint. Setbreakpoints at locations in your code where you want to evaluatevariables. In this exercise, set the breakpoints in the Script Editor. Fora more in-depth description of the Script Editor, see section SpotfireS+ Workbench Script Editor on page 57.
To set the breakpoints
1. From the Project files, open the file kahanAddNext_func.qin the Script Editor. (Note that to work with the debugger,your
2. Find the line in the code that reads: correctedX <- nextX + kahanValues[["correction"]].
3. In the left margin, right-click to display the menu, and thenselect Toggle Breakpoint. (Double-clicking the left marginnext to the code line also adds the breakpoint.)
4. Open the file kahanSum.q in the Script Editor.
5. Find the line in the code that reads: kahanValues <- kahanAddNext(x[i], kahanValues).
190
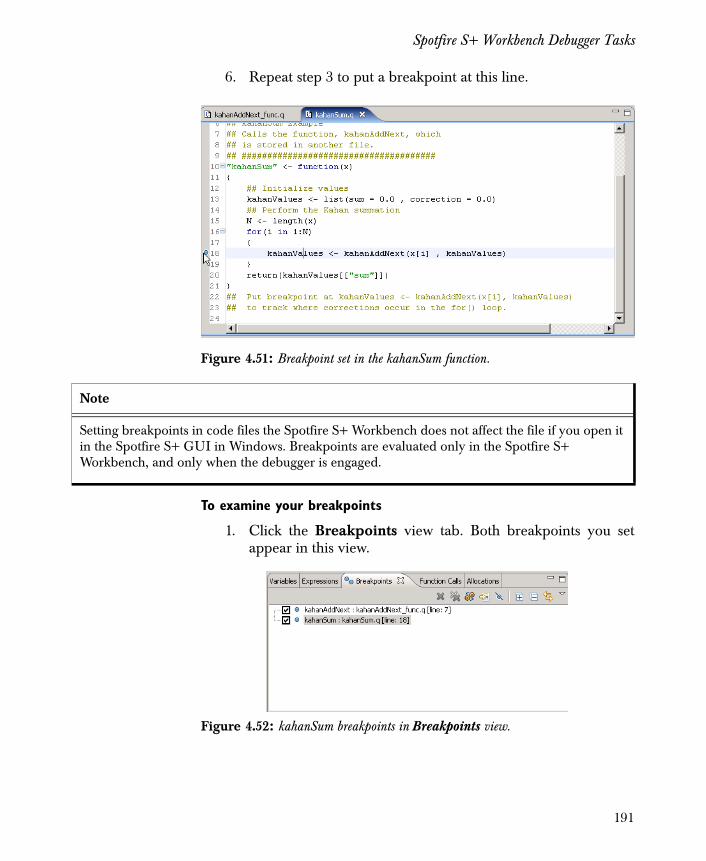
Spotfire S+ Workbench Debugger Tasks
6. Repeat step 3 to put a breakpoint at this line.
To examine your breakpoints
1. Click the Breakpoints view tab. Both breakpoints you setappear in this view.
Figure 4.51: Breakpoint set in the kahanSum function.
Note
Setting breakpoints in code files the Spotfire S+ Workbench does not affect the file if you open it in the Spotfire S+ GUI in Windows. Breakpoints are evaluated only in the Spotfire S+ Workbench, and only when the debugger is engaged.
Figure 4.52: kahanSum breakpoints in Breakpoints view.
191
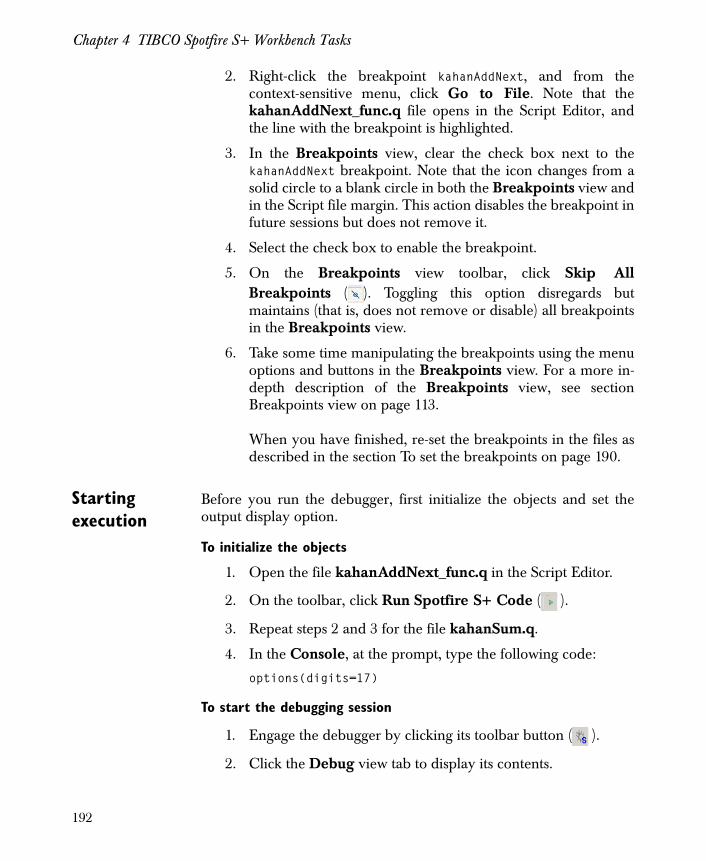
Chapter 4 TIBCO Spotfire S+ Workbench Tasks
2. Right-click the breakpoint kahanAddNext, and from thecontext-sensitive menu, click Go to File. Note that thekahanAddNext_func.q file opens in the Script Editor, andthe line with the breakpoint is highlighted.
3. In the Breakpoints view, clear the check box next to thekahanAddNext breakpoint. Note that the icon changes from asolid circle to a blank circle in both the Breakpoints view andin the Script file margin. This action disables the breakpoint infuture sessions but does not remove it.
4. Select the check box to enable the breakpoint.
5. On the Breakpoints view toolbar, click Skip AllBreakpoints ( ). Toggling this option disregards butmaintains (that is, does not remove or disable) all breakpointsin the Breakpoints view.
6. Take some time manipulating the breakpoints using the menuoptions and buttons in the Breakpoints view. For a more in-depth description of the Breakpoints view, see sectionBreakpoints view on page 113.
When you have finished, re-set the breakpoints in the files asdescribed in the section To set the breakpoints on page 190.
Starting execution
Before you run the debugger, first initialize the objects and set theoutput display option.
To initialize the objects
1. Open the file kahanAddNext_func.q in the Script Editor.
2. On the toolbar, click Run Spotfire S+ Code ( ).
3. Repeat steps 2 and 3 for the file kahanSum.q.
4. In the Console, at the prompt, type the following code:
options(digits=17)
To start the debugging session
1. Engage the debugger by clicking its toolbar button ( ).
2. Click the Debug view tab to display its contents.
192
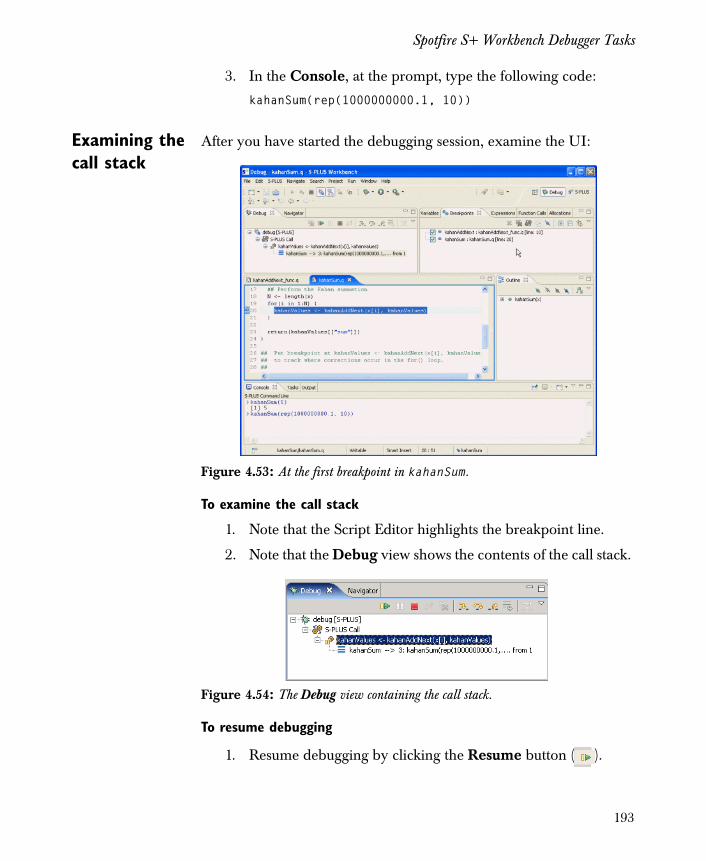
Spotfire S+ Workbench Debugger Tasks
3. In the Console, at the prompt, type the following code:
kahanSum(rep(1000000000.1, 10))
Examining the call stack
After you have started the debugging session, examine the UI:
To examine the call stack
1. Note that the Script Editor highlights the breakpoint line.
2. Note that the Debug view shows the contents of the call stack.
To resume debugging
1. Resume debugging by clicking the Resume button ( ).
Figure 4.53: At the first breakpoint in kahanSum.
Figure 4.54: The Debug view containing the call stack.
193
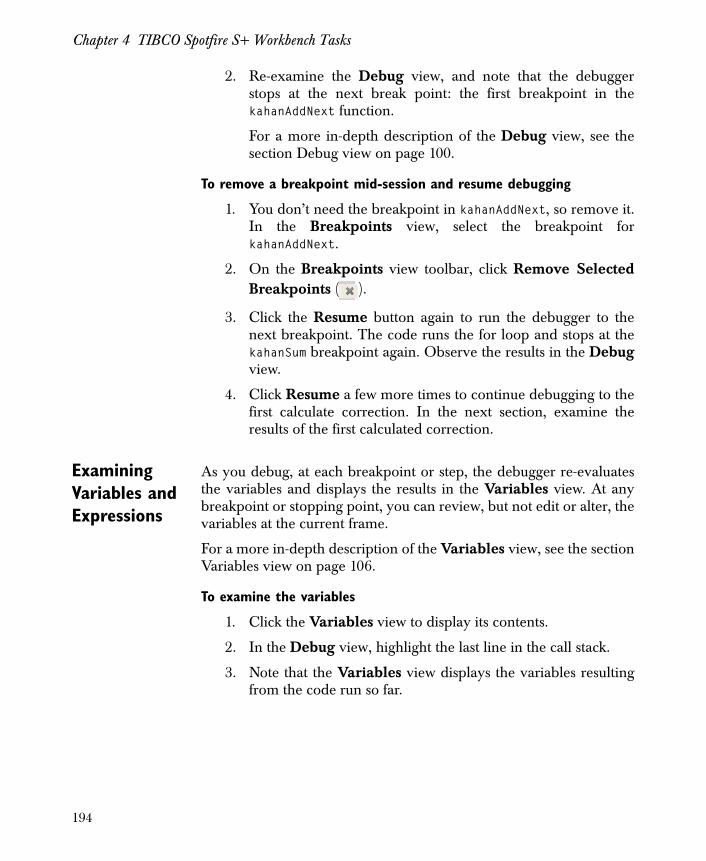
Chapter 4 TIBCO Spotfire S+ Workbench Tasks
2. Re-examine the Debug view, and note that the debuggerstops at the next break point: the first breakpoint in thekahanAddNext function.
For a more in-depth description of the Debug view, see thesection Debug view on page 100.
To remove a breakpoint mid-session and resume debugging
1. You don’t need the breakpoint in kahanAddNext, so remove it.In the Breakpoints view, select the breakpoint forkahanAddNext.
2. On the Breakpoints view toolbar, click Remove SelectedBreakpoints ( ).
3. Click the Resume button again to run the debugger to thenext breakpoint. The code runs the for loop and stops at thekahanSum breakpoint again. Observe the results in the Debugview.
4. Click Resume a few more times to continue debugging to thefirst calculate correction. In the next section, examine theresults of the first calculated correction.
Examining Variables and Expressions
As you debug, at each breakpoint or step, the debugger re-evaluatesthe variables and displays the results in the Variables view. At anybreakpoint or stopping point, you can review, but not edit or alter, thevariables at the current frame.
For a more in-depth description of the Variables view, see the sectionVariables view on page 106.
To examine the variables
1. Click the Variables view to display its contents.
2. In the Debug view, highlight the last line in the call stack.
3. Note that the Variables view displays the variables resultingfrom the code run so far.
194
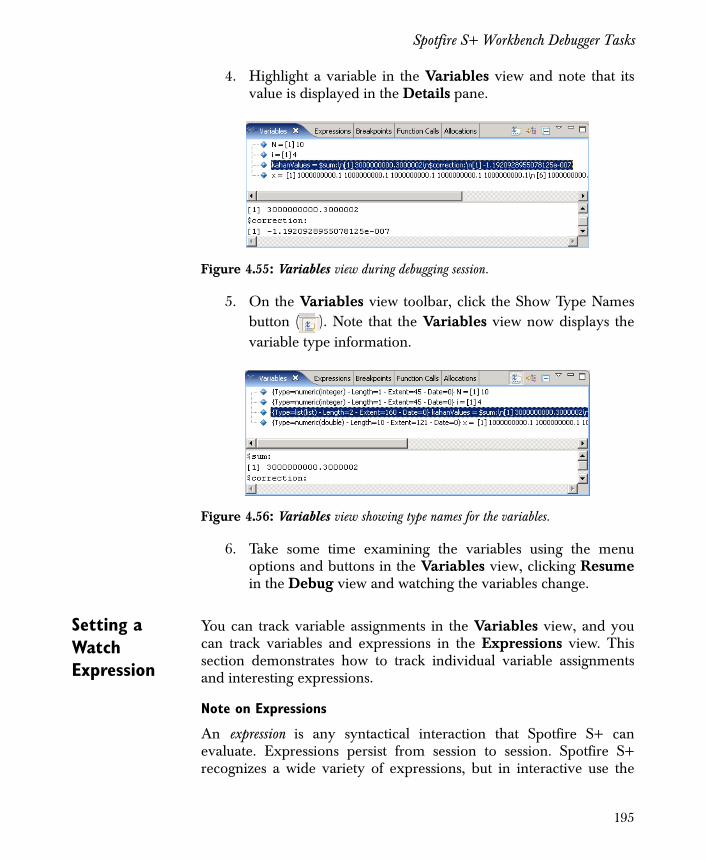
Spotfire S+ Workbench Debugger Tasks
4. Highlight a variable in the Variables view and note that itsvalue is displayed in the Details pane.
5. On the Variables view toolbar, click the Show Type Namesbutton ( ). Note that the Variables view now displays thevariable type information.
6. Take some time examining the variables using the menuoptions and buttons in the Variables view, clicking Resumein the Debug view and watching the variables change.
Setting a Watch Expression
You can track variable assignments in the Variables view, and youcan track variables and expressions in the Expressions view. Thissection demonstrates how to track individual variable assignmentsand interesting expressions.
Note on Expressions
An expression is any syntactical interaction that Spotfire S+ canevaluate. Expressions persist from session to session. Spotfire S+recognizes a wide variety of expressions, but in interactive use the
Figure 4.55: Variables view during debugging session.
Figure 4.56: Variables view showing type names for the variables.
195

Chapter 4 TIBCO Spotfire S+ Workbench Tasks
most common are names, which return the current definition of thenamed data object, and function calls, which carry out a specifiedcomputation. Any of the following are Spotfire S+ expressions:
1:10rnorm(5)mean(1:10)traceback()
If you were debugging a function, for example:
incrementByTwo <- function(x) { * x + 2}
you could have an expression that evaluated:
x + 2
at the breakpoint (denoted with the * in the above functiondefinition).
For more information about expressions, see the Programmer’s Guide,or see the Spotfire S+ Help topic ExpressionLanguage.
To watch expressions
1. Right-click the Expressions view to display the context-sensitive menu.
2. From the menu, select Add Watch Expression.
3. In the Add Watch Expression dialog, type the following:
kahanValues[["sum"]]
Figure 4.57: Add Watch Expression dialog with expression added.
196
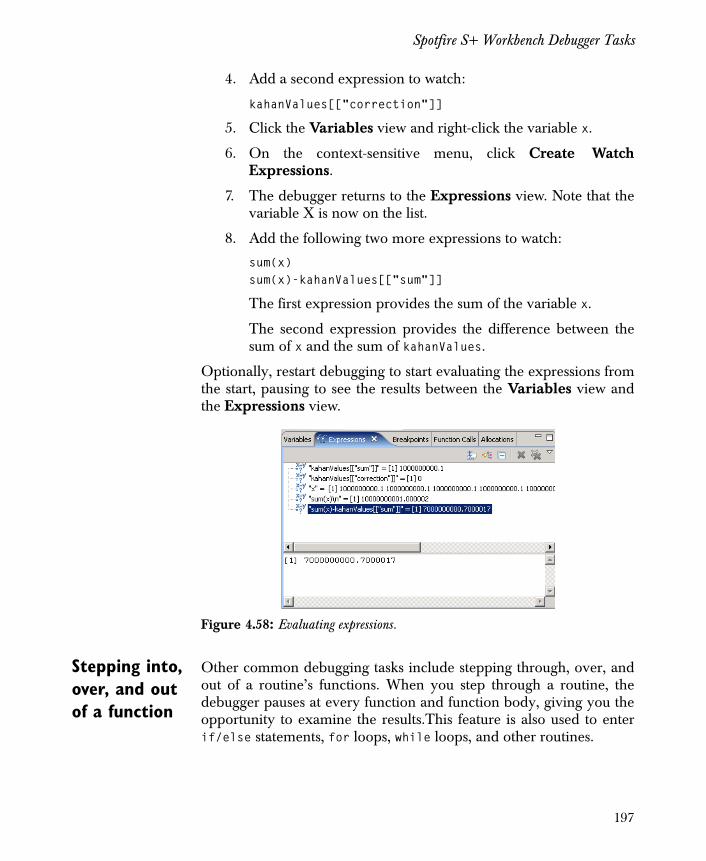
Spotfire S+ Workbench Debugger Tasks
4. Add a second expression to watch:
kahanValues[["correction"]]
5. Click the Variables view and right-click the variable x.
6. On the context-sensitive menu, click Create WatchExpressions.
7. The debugger returns to the Expressions view. Note that thevariable X is now on the list.
8. Add the following two more expressions to watch:
sum(x)sum(x)-kahanValues[["sum"]]
The first expression provides the sum of the variable x.
The second expression provides the difference between thesum of x and the sum of kahanValues.
Optionally, restart debugging to start evaluating the expressions fromthe start, pausing to see the results between the Variables view andthe Expressions view.
Stepping into, over, and out of a function
Other common debugging tasks include stepping through, over, andout of a routine’s functions. When you step through a routine, thedebugger pauses at every function and function body, giving you theopportunity to examine the results.This feature is also used to enterif/else statements, for loops, while loops, and other routines.
Figure 4.58: Evaluating expressions.
197
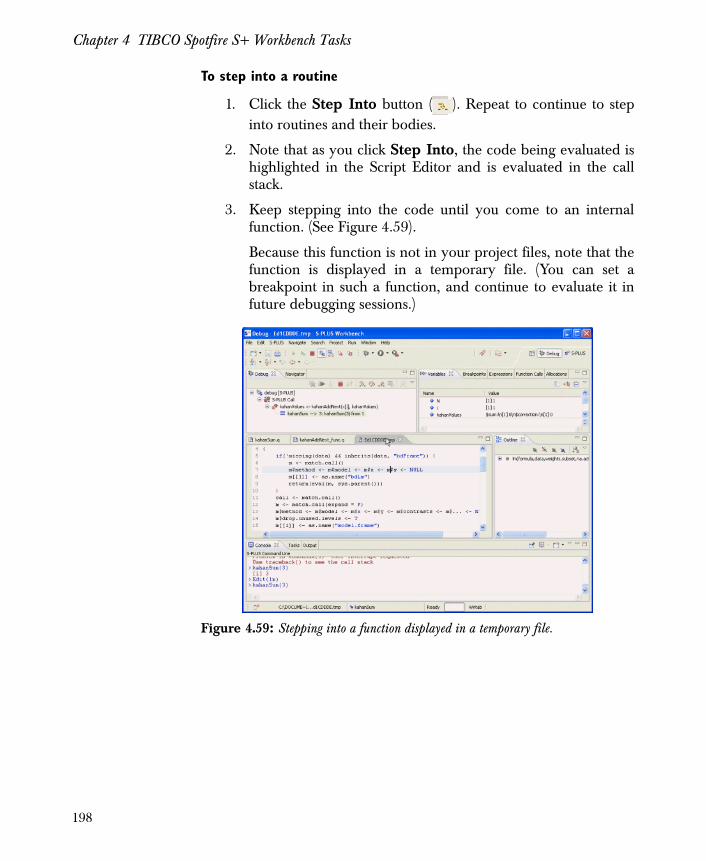
Chapter 4 TIBCO Spotfire S+ Workbench Tasks
To step into a routine
1. Click the Step Into button ( ). Repeat to continue to stepinto routines and their bodies.
2. Note that as you click Step Into, the code being evaluated ishighlighted in the Script Editor and is evaluated in the callstack.
3. Keep stepping into the code until you come to an internalfunction. (See Figure 4.59).
Because this function is not in your project files, note that thefunction is displayed in a temporary file. (You can set abreakpoint in such a function, and continue to evaluate it infuture debugging sessions.)
Figure 4.59: Stepping into a function displayed in a temporary file.
198
Spotfire S+ Workbench Debugger Tasks
You can also step over a function ( ), or you can step out of a
function ( ), using the buttons on the Debug view toolbar.
Examining Resource Usage
You can track resource allocation usage by engaging the Spotfire S+Workbench Profiler.
To track resource usage
1. On the Spotfire S+ Workbench main menu, click the Profilerbutton ( ) to toggle it on.
2. Click the Allocations view tab.
3. Examine the resource usage. Note that it is sortedalphabetically by type. Click the Type column head; note thatthe view is now sorted in reverse.
4. Click the Amount column head; note that the view is nowsorted by amount, smallest to largest.
5. Click Amount again; note that it re-sorts, largest to smallest.
6. Click the drop-down menu, and then click ResetAllocations. Note that the table is cleared.
Examining Function Calls
In the next section, examine the functions used in the example. Youcan examine the functions either in an expandable tree view or in atable view. (Make sure the Profiler is engaged by toggling on theProfiler button on the main menu.)
To track functions used
1. Click the Function Calls view tab.
Note
If you are debugging using the Run button, rather than running a function via the Console view, when you reach the last expression, you can find yourself in internal Spotfire S+ code. To avoid this situation, type the name of the function and parameters in the Console view instead. See the section Debugging Using the Run Button on page 206 for more information.
199
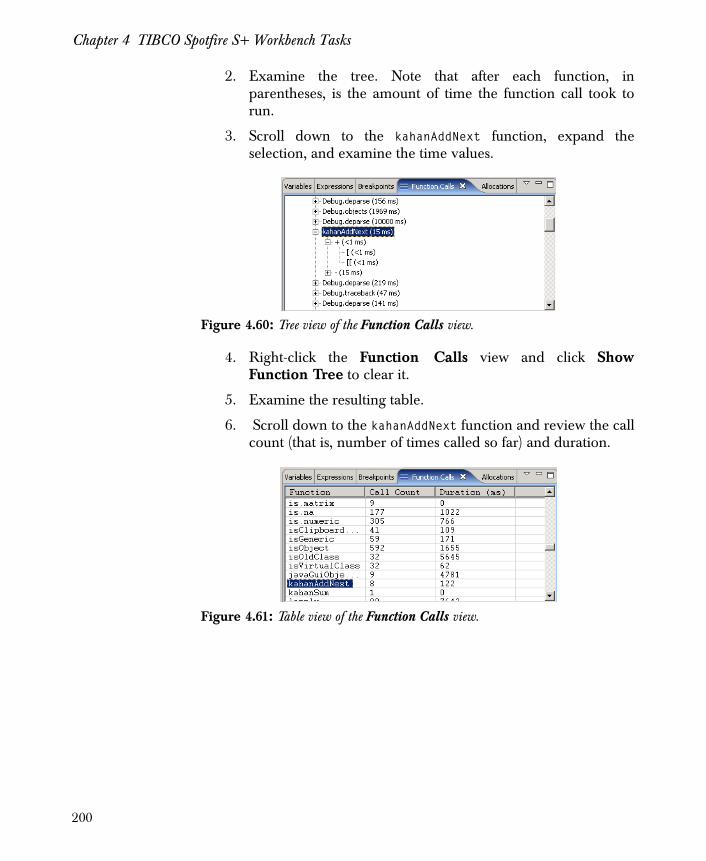
Chapter 4 TIBCO Spotfire S+ Workbench Tasks
2. Examine the tree. Note that after each function, inparentheses, is the amount of time the function call took torun.
3. Scroll down to the kahanAddNext function, expand theselection, and examine the time values.
4. Right-click the Function Calls view and click ShowFunction Tree to clear it.
5. Examine the resulting table.
6. Scroll down to the kahanAddNext function and review the callcount (that is, number of times called so far) and duration.
Figure 4.60: Tree view of the Function Calls view.
Figure 4.61: Table view of the Function Calls view.
200
Introduction 202
“Workspace in Use” Error 203
Working with Calls to Spotfire S+ GUI Functions 204
View is Not Visible 205
Debugging Using the Run Button 206
Subclipse Add-in Error with Workbench 207
TROUBLESHOOTING 5
201

Chapter 5 Troubleshooting
INTRODUCTION
This section provides information about using TIBCO Spotfire S+code in the Workbench, and presents workarounds and solutions forspecial cases you might encounter.
202
“Workspace in Use” Error
“WORKSPACE IN USE” ERROR
Occasionally, when you start the Spotfire S+ Workbench, you mightsee an error that the workspace is already in use when you have notbeen running a Workbench session.
This problem occurs when you switch computers or versions ofUNIX, and you have changes to absolute paths to a given directory.
1. Check your computer to ensure that the path listed in theWorkspace Selection dialog exists.
2. After you set the appropriate path to an existing workspace, ifthe problem persists, check for a .lock file in theWORKSPACE/.metadata directory. Delete this file.
3. If you do not find a .lock file, check the running processes tosee if old Eclipse processes are running that point to theworkspace. End the processes and try re-starting the SpotfireS+ Workbench.
203
Chapter 5 Troubleshooting
WORKING WITH CALLS TO SPOTFIRE S+ GUI FUNCTIONS
While you are working with Spotfire S+, you might encounterlibraries or sample code that include calls to Spotfire S+ GUIfunctions. For example, the nSurvival library includes calls toguiCreate and guiRemove functions in their .First.lib and.Last.lib objects, respectively.
To solve this problem, in .First.lib and .Last.lib functions, wrapthe code that creates and removes Windows GUI elements inconditional statements. For example:
if(interactive() && platform() == "WIN386" && getenv("S_ECLIPSE") == "") {##...Code that creates or removes Windows GUI elements...##}
204
View is Not Visible
VIEW IS NOT VISIBLE
If you accidentally close a view, or if the view you want to see is notvisible, on the Windows � Show View menu, select the view todisplay. If the view to display is not on this list, click Other to displaythe Show View dialog, and then select the folder, and then the viewto display.
205
Chapter 5 Troubleshooting
DEBUGGING USING THE RUN BUTTON
When you use the Run button to invoke a debug session rather thanusing the Console, and you come to the last expression and clickStep, Step In, or Step Out, you can end up in internal Spotfire S+functions that are called by your code.
This behavior occurs because any time you click Run, the expressionthat Spotfire S+ runs is wrapped in a complex S expression designedto capture parse errors, syntax errors, and so on.
To avoid finding yourself in this internal code, run the function bytyping it in the Console.
206
Subclipse Add-in Error with Workbench
SUBCLIPSE ADD-IN ERROR WITH WORKBENCH
If you are running the Subclipse add-in while you run the Spotfire S+
Workbench in Microsoft Windows®, you might see the followingerror when you switch between projects:
"Unknown problem executing expression (interrupt?)"
It is possible to remove this problem by performing an SVN Cleanupoperation in the Workbench.
207

Chapter 5 Troubleshooting
208
Symbols.Data
working 53.Data database 12.metadata database 12
Aadd a task
in script file 163Allocations view 44, 98anonymous functions
showing in outline 23
Bbackground color 21background color in Console view
changing 19, 24Breakpoint
types 115breakpoints
Line 115Breakpoints view 44, 98, 113Breakpoints view menu
Deselect Default Working Set 119
Select Default Working Set 119Working Sets 119
Breakpoints view toolbar 117build packages 170
Cchanging databases
adding a directory 154adding a library 153adding a module 154
clear History view 70code completion 50, 59, 158code indenting 60code problems
locating 74collapsing breakpoints 118color options
user-defined 21commands
persisting history 19scroll through 49
comparing versions 62console fonts 19, 24Console view 44, 48, 68, 98Console view menu 47, 51copy
project files between projects 135
copy history to the Console view 70copying code
from the Console view 165copying from script to console 164Copy to Console 34create a Workbench project 126current working directory 53customized menus 31customized toolbars 31
INDEX
209

Index
Ddatabases
detaching 76examining search path 75manipulating 71
debugger 206Debug perspective 90Debug perspective views 98Debug view 98Debug view toolbar 101Define Folding Region 33defining color
user terms 21deselecting default working set
Breakpoints view menu 119Details pane
Expressions view 113Variables view 110
devicedefault 17
dialogFilters 74, 87Outline options 23Preferences 14Select Perspective 150Show View 150Sorting 74, 87Task Tags 25Workspace Launcher 126
directoryattaching 76
down arrow 49
EEclipse 3edit code 157editing
function definitions 159editor 57empty project
creating 129environment variables 10existing files
creating a project for 130existing project
importing files for 130expanding breakpoints 118Export dialog 171expression evaluating
hovering 21, 105expressions 195
limiting return 109Expressions view 98
Details pane 113Expressions view control menu 108Expressions view toolbar 112external files
opening 63
Ffile associations 14files
formatting 52opening files not in your project
31filtering files 63Filters dialog 74, 87find
function calls 34FIXME
high-priority tasks 86font settings
console and output 19, 24format code 33Format Spotfire S+ Files 52Function Calls view 99function definition
editing 34, 159function definitions
editing 159function help 8functions
watching 23
GGo to File for Breakpoint 117
210
Index
Group By 119
Hhelp
displaying 60help menu 37high-priority tasks 86history
persisting 19History view 68, 69, 165hover 109hovering
evaluating expression 21, 105
IIDE defaults
Spotfire S+ perspective 14importing files 130Import menu command 135indenting
code 60internal Spotfire S+ functions
in temporary files 206interrupt code 58
Jjava.new.plot.action 17Java graph 17Java virtual machine 10
Llibrary
attaching 76Line breakpoints 115line limits
History view 71line numbers 157
displaying 59low-priority tasks 86
Mmedium-priority tasks 86menu
Console view 47, 51help 37Objects view 71Problems view 74, 75Run 36Spotfire S+ 33Tasks view 87Window 37
menuscustomized 31
moduleattaching 76
monitor a job 183multiple projects 133
NNavigator view 69, 156New Project wizard 31
Create Spotfire S+ Package structure 129
OObject Explorer
Workbench 73object members
changing number displayed in Objects view 73
objectsexamining 72
Objects view 68, 71Objects view menu 71opening external files 31, 60Outline dialog 23Outline view 54, 68, 99Outline view toolbar 56output fonts 19, 24Output View 99Output view 56, 68
211
Index
Ppackage 129, 168packages
building 170PDF reader
specifying 9Perspective 4perspective 42
Debug 90Spotfire S+ 67
pkgutils 168Preferences
debugging 93preferences 14
setting 138Preferences dialog 14Problems view 68, 74, 166Problems view menu 74, 75profiler 91project files
copying 135removing 156
Rrefreshing
Objects view 72Problems view 74Search Path view 76views 155
remote job 178Remove All Breakpoints 117removing
project files 156restoring files 62reviewing objects 72run 36Run Current File 164Run menu 36run next command 36running code 36, 58, 163, 164
on startup 16running scripts 164running Spotfire S+ code 38, 41
Sschedule a job 181Schedule Job 84script
creating 156Script Editor 57
in the Debug perspective 99script output
sending to console 17, 139searching terms 62Search Path View 75Search Path view 69, 153selecting the default working set
Breakpoints view menu 119Select Perspective dialog 150server 178setting memory heap size 11, 12setting return limits
variables and expressions 109shared views 44show anonymous functions 23Show Breakpoints Supported by
Selected Target 117Show View dialog 150simultaneous sessions 3Skip All Breakpoints 117Sorting dialog 74, 87soundex 168Source Spotfire S+ Files 52specifying a PDF reader 9splus.environment.vars 10Spotfire S+
internal functions 206Spotfire S+ Debugger
toggling 39, 41Spotfire S+ error breakpoint
toggling 42Spotfire S+error breakpoint
toggling 40Spotfire S+ menu 33
Find 34Find Packages 36Find References 34Format 33
212
Index
Open Spotfire S+ Help File 34Run Current File 33Run Selection 33Shift Left 33Shift Right 33Toggle Comment 33Update Packages 35
Spotfire S+ Packages 9Spotfire S+ Package Upload 186Spotfire S+ perspective 67Spotfire S+ perspective views 68Spotfire S+ Profiler
toggling 39, 41Spotfire S+ warning breakpoint
toggling 40Spotfire S+warning breakpoint
toggling 41Spotfire S+ Workbench 3Spotfire S+ Workbench Properties
dialog 10starting the Workbench 10Statistics Services view 69step into
internal Spotfire S+ code 206stop 36store console history 19
Ttable pane
Objects view 72task levels 86Tasks view 69Tasks view menu 87Tasks view toolbar 87task tags
defining 25Task Tags dialog 25text variables
limiting return 109TODO
medium-priority tasks 86toggle Debug mode 36toggle Profile mode 37
toggle Spotfire S+ error breakpoint 37
toggle Spotfire S+ warning breakpoint 37
Toggle Working Spotfire S+ Project 53
toggling comments 33toggling Spotfire S+ Debugger 39,
41toggling Spotfire S+ error
breakpoint 40, 42toggling Spotfire S+ Profiler 39, 41toggling Spotfire S+ warning
breakpoint 40, 41toolbar
Breakpoints 117Debug view 101Expressions view 112Outline view 56Spotfire S+ Workbench 38Tasks view 87
toolbarscustomized 31
tooltip 21, 105tree view pane
Objects view 73
Uup arrow 49
VVariables view 99, 107
Details pane 110Variables view control menu 108view
Allocations 98Breakpoints 98Console 98Debug 98definition 43Expressions 98Function Calls 99Monitor Jobs 183
213
Index
Outline 99Output 99refreshing 76Search Path 75, 153Statistics Services 178Variables 99
viewschanging display 149customizing 148Debug perspective 98shared 44Spotfire S+ perspective 68
Wwatching functions 23Window menu 37Workbench Project 5
Workbench projectcreating 126
Workbench Script Editor 6Workbench User Guide 7Workbench View 6working directory
setting current 53Working Sets
Breakpoints view menu 119Workspace 5workspace 12, 126
changing 126Workspace Launcher dialog 126
XXXX 86
214


