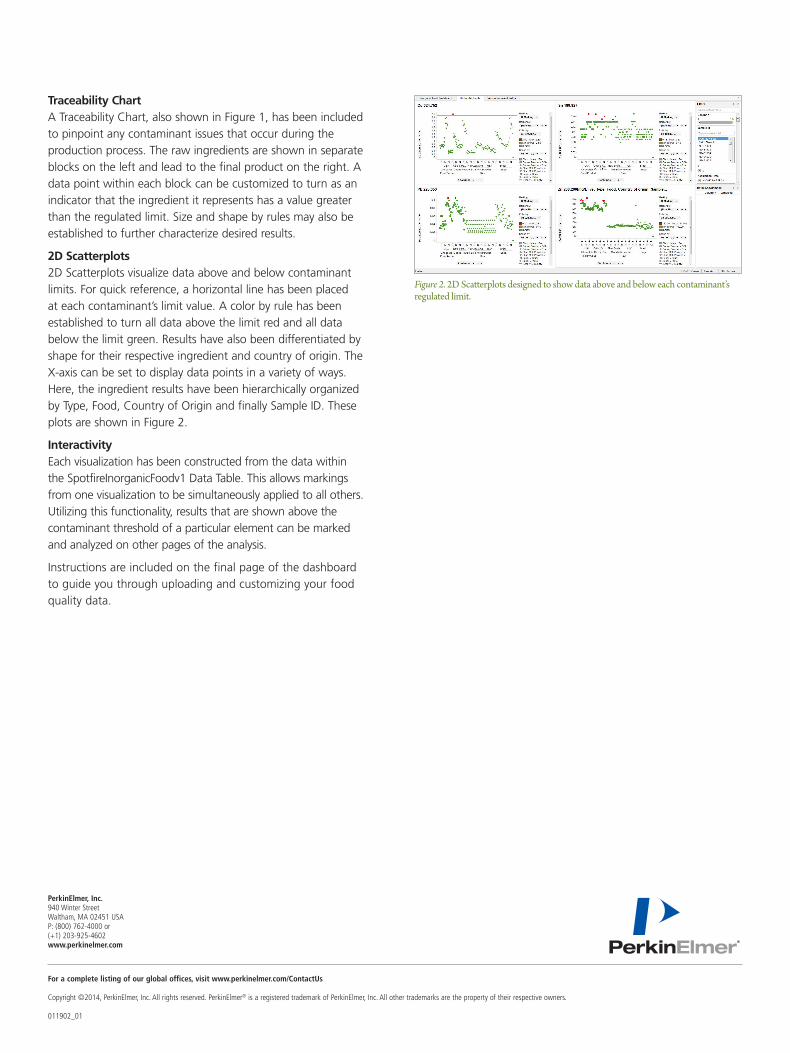
+ All Categories
Home > Documents > TIBCO Spotfire Software for Inorganic Food Dashboard Analyses... · Title: TIBCO Spotfire Software...

TIBCO Spotfire Software for Inorganic Food Dashboard Analyses... · Title: TIBCO Spotfire Software...

Date post: 04-Jun-2018
Category:
Upload: vuongliem
View: 223 times
Download: 0 times
Share this document with a friend
2
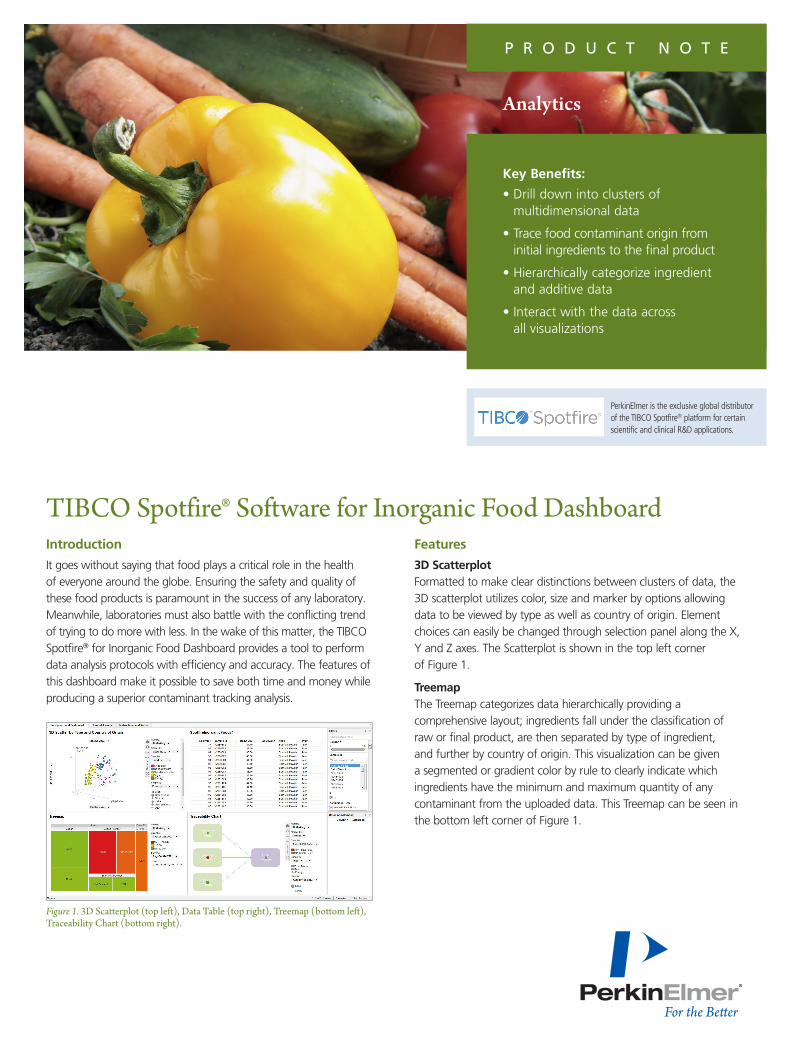
Analytics PRODUCT NOTE Key Benefits: • Drill down into clusters of multidimensional data • Trace food contaminant origin from initial ingredients to the final product • Hierarchically categorize ingredient and additive data • Interact with the data across all visualizations PerkinElmer is the exclusive global distributor of the TIBCO Spotfire ® platform for certain scientific and clinical R&D applications. Introduction It goes without saying that food plays a critical role in the health of everyone around the globe. Ensuring the safety and quality of these food products is paramount in the success of any laboratory. Meanwhile, laboratories must also battle with the conflicting trend of trying to do more with less. In the wake of this matter, the TIBCO Spotfire ® for Inorganic Food Dashboard provides a tool to perform data analysis protocols with efficiency and accuracy. The features of this dashboard make it possible to save both time and money while producing a superior contaminant tracking analysis. Features 3D Scatterplot Formatted to make clear distinctions between clusters of data, the 3D scatterplot utilizes color, size and marker by options allowing data to be viewed by type as well as country of origin. Element choices can easily be changed through selection panel along the X, Y and Z axes. The Scatterplot is shown in the top left corner of Figure 1. Treemap The Treemap categorizes data hierarchically providing a comprehensive layout; ingredients fall under the classification of raw or final product, are then separated by type of ingredient, and further by country of origin. This visualization can be given a segmented or gradient color by rule to clearly indicate which ingredients have the minimum and maximum quantity of any contaminant from the uploaded data. This Treemap can be seen in the bottom left corner of Figure 1. TIBCO Spotfire® Software for Inorganic Food Dashboard Figure 1. 3D Scatterplot (top left), Data Table (top right), Treemap (bottom left), Traceability Chart (bottom right).
Transcript

Analytics

P R O D U C T N O T E

Key Benefits:

•Drilldownintoclustersofmultidimensionaldata

•Tracefoodcontaminantoriginfrominitialingredientstothefinalproduct

•Hierarchicallycategorizeingredient andadditivedata

•Interactwiththedataacrossallvisualizations

PerkinElmer is the exclusive global distributor of the TIBCO Spotfire® platform for certain scientific and clinical R&D applications.

Introduction

Itgoeswithoutsayingthatfoodplaysacriticalroleinthehealthofeveryonearoundtheglobe.Ensuringthesafetyandqualityofthesefoodproductsisparamountinthesuccessofanylaboratory.Meanwhile,laboratoriesmustalsobattlewiththeconflictingtrendoftryingtodomorewithless.Inthewakeofthismatter,theTIBCOSpotfire®forInorganicFoodDashboardprovidesatooltoperformdataanalysisprotocolswithefficiencyandaccuracy.Thefeaturesofthisdashboardmakeitpossibletosavebothtimeandmoneywhileproducingasuperiorcontaminanttrackinganalysis.

Features

3D ScatterplotFormattedtomakecleardistinctionsbetweenclustersofdata,the3Dscatterplotutilizescolor,sizeandmarkerbyoptionsallowingdatatobeviewedbytypeaswellascountryoforigin.ElementchoicescaneasilybechangedthroughselectionpanelalongtheX,YandZaxes.TheScatterplotisshowninthetopleftcornerofFigure1.

TreemapTheTreemapcategorizesdatahierarchicallyprovidingacomprehensivelayout;ingredientsfallundertheclassificationofraworfinalproduct,arethenseparatedbytypeofingredient,andfurtherbycountryoforigin.Thisvisualizationcanbegivenasegmentedorgradientcolorbyruletoclearlyindicatewhichingredientshavetheminimumandmaximumquantityofanycontaminantfromtheuploadeddata.ThisTreemapcanbeseeninthebottomleftcornerofFigure1.

TIBCO Spotfire® Software for Inorganic Food Dashboard

Figure 1. 3D Scatterplot (top left), Data Table (top right), Treemap (bottom left), Traceability Chart (bottom right).

For a complete listing of our global offices, visit www.perkinelmer.com/ContactUs

Copyright ©2014, PerkinElmer, Inc. All rights reserved. PerkinElmer® is a registered trademark of PerkinElmer, Inc. All other trademarks are the property of their respective owners. 011902_01

PerkinElmer, Inc. 940 Winter Street Waltham, MA 02451 USA P: (800) 762-4000 or (+1) 203-925-4602www.perkinelmer.com

Traceability ChartATraceabilityChart,alsoshowninFigure1,hasbeenincludedtopinpointanycontaminantissuesthatoccurduringtheproductionprocess.Therawingredientsareshowninseparateblocksontheleftandleadtothefinalproductontheright.Adatapointwithineachblockcanbecustomizedtoturnasanindicatorthattheingredientitrepresentshasavaluegreaterthantheregulatedlimit.Sizeandshapebyrulesmayalsobeestablishedtofurthercharacterizedesiredresults.

2D Scatterplots2DScatterplotsvisualizedataaboveandbelowcontaminantlimits.Forquickreference,ahorizontallinehasbeenplacedateachcontaminant’slimitvalue.Acolorbyrulehasbeenestablishedtoturnalldataabovethelimitredandalldatabelowthelimitgreen.Resultshavealsobeendifferentiatedbyshapefortheirrespectiveingredientandcountryoforigin.TheX-axiscanbesettodisplaydatapointsinavarietyofways.Here,theingredientresultshavebeenhierarchicallyorganizedbyType,Food,CountryofOriginandfinallySampleID.TheseplotsareshowninFigure2.

InteractivityEachvisualizationhasbeenconstructedfromthedatawithintheSpotfireInorganicFoodv1DataTable.Thisallowsmarkingsfromonevisualizationtobesimultaneouslyappliedtoallothers.Utilizingthisfunctionality,resultsthatareshownabovethecontaminantthresholdofaparticularelementcanbemarkedandanalyzedonotherpagesoftheanalysis.

Instructionsareincludedonthefinalpageofthedashboardtoguideyouthroughuploadingandcustomizingyourfoodqualitydata.

Figure 2. 2D Scatterplots designed to show data above and below each contaminant’s regulated limit.


Recommended