FULL YEAR OF 2017 RESULTS (AUDITED) TICKERS: IDX : TLKM NYSE : TLK SHAREHOLDER COMPOSITION: Government of Indonesia : 52.1% Public : 47.9% Excl. Treasury stock : 1,737,779,800 shares. Investor Relations PT Telkom Indonesia (Persero) Tbk Telkom Landmark Tower, 37th Floor Jl. Gatot Subroto Kav. 52, Jakarta 12710 Phone : 62 21 5215109 Fax : 62 21 5220500 Email : [email protected]Website : www.telkom.co.id DISCLAIMER This document contains financial conditions and result of operation, and may also contain certain projections, plans, strategies, and objectives of the Company, which would be treated as forward looking statements within the meaning of applicable law. Forward looking statements, by their nature, involve risk and uncertainty that could cause actual results and development to differ materially from those expressed or implied in these statements. Telkom Indonesia does not guarantee that any action, which may have been taken in reliance on this document, will bring specific results as expected. Highlights Telkom Indonesia maintained its strong performance in FY17, recording robust growth in Revenue, EBITDA, and Net Income of 10.2%, 8.6%, and 14.4% YoY, respectively. Data, Internet & IT Services segment remained the growth driver and largest revenue contributor, increased by 28.7% YoY and contributed 43.2% of total revenue. Amidst tightening competition in mobile, Telkomsel revenue grew healthily by 7.5% YoY with improved EBITDA margin to 57.5% from 57.4%. Telkomsel remained focus on growing digital business, installed 31,672 new BTSs during 2017, all were 3G and 4G BTS. Financial Highlights Operational Highlights FINANCIAL PERFORMANCE Revenue (in Rp. Bn) TLKM Share Performance 2017 Share Price (Mar 14, 2018): Rp4,060 (IDX) & USD29.35 (NYSE) Market Capitalization (Mar 14, 2018): Rp409.2 Tn (USD29.6 Bn) Average Daily Trading Volume 2017: 89.7 Mn Shares (IDX) & 302,772 DR (NYSE) Average Daily Trading Value 2017: Rp386 Bn (IDX) & USD9.6 Mn (NYSE) Source: Bloomberg Key Indicators (Rp. Bn) YoY FY17 FY16 Growth (%) Revenues 128,256 116,333 10.2 Expenses 84,323 77,138 9.3 Operating Profit 43,933 39,195 12.1 EBITDA 64,609 59,498 8.6 EBITDA Margin (%) 50.4 51.1 (0.7ppt) Net Income 22,145 19,352 14.4 Net Income Margin (%) 17.3 16.6 0.7ppt Subscribers (000) YoY FY17 FY16 Growth (%) Broadband Fixed Broadband 5,266 4,329 21.6 IndiHome 2,965 1,624 82.6 Mobile Data User 105,808 84,729 24.9 Cellular Postpaid 4,739 4,180 13.4 Prepaid 191,583 169,740 12.9 Total 196,322 173,920 12.9 Fixed Line POTS 10,957 10,663 2.8
Transcript
F U L L Y E A R O F 2 0 1 7 R E S U L T S ( A U D I T E D )
This document contains financial conditions and result of operation, and may also contain certain projections, plans, strategies,
and objectives of the Company, which would be treated as forward looking statements within the meaning of applicable law.
Forward looking statements, by their nature, involve risk and uncertainty that could cause actual results and development to differ
materially from those expressed or implied in these statements. Telkom Indonesia does not guarantee that any action, which may
have been taken in reliance on this document, will bring specific results as expected.
Highlights
Telkom Indonesia maintained its strong performance in FY17, recording robust growth in Revenue, EBITDA, and Net Income of 10.2%, 8.6%, and 14.4% YoY, respectively.
Data, Internet & IT Services segment remained the growth driver and largest revenue contributor, increased by 28.7% YoY and contributed 43.2% of total revenue.
Amidst tightening competition in mobile, Telkomsel revenue grew healthily by 7.5% YoY with improved EBITDA margin to 57.5% from 57.4%. Telkomsel remained focus on growing digital business, installed 31,672 new BTSs during 2017, all were 3G and 4G BTS.
Financial Highlights
Operational Highlights
FINANCIAL PERFORMANCE
Revenue
(in Rp. Bn)
TLKM Share Performance 2017
Share Price (Mar 14, 2018):
Rp4,060 (IDX) & USD29.35 (NYSE)
Market Capitalization (Mar 14, 2018):
Rp409.2 Tn (USD29.6 Bn)
Average Daily Trading Volume 2017:
89.7 Mn Shares (IDX) & 302,772 DR (NYSE)
Average Daily Trading Value 2017:
Rp386 Bn (IDX) & USD9.6 Mn (NYSE)
Source: Bloomberg
Key Indicators (Rp. Bn)
YoY
FY17 FY16 Growth (%)
Revenues 128,256 116,333 10.2
Expenses 84,323 77,138 9.3
Operating Profit 43,933 39,195 12.1
EBITDA 64,609 59,498 8.6
EBITDA Margin (%) 50.4 51.1 (0.7ppt)
Net Income 22,145 19,352 14.4
Net Income Margin (%) 17.3 16.6 0.7ppt
Subscribers (000) YoY
FY17 FY16 Growth (%)
Broadband
Fixed Broadband 5,266 4,329 21.6
IndiHome 2,965 1,624 82.6
Mobile Data User 105,808 84,729 24.9
Cellular
Postpaid 4,739 4,180 13.4
Prepaid 191,583 169,740 12.9
Total 196,322 173,920 12.9
Fixed Line
POTS 10,957 10,663 2.8
2
FULL YEAR OF 2017 (AUDITED)
PT TELKOM INDONESIA (PERSERO) Tbk FULL YEAR OF 2017 (AUDITED)
The following analysis and discussion is based on our Indonesian GAAP financial statements for the full year ended December 31, 2017 and 2016. The reports have been submitted to Indonesia Financial Services Authority (OJK).
Revenues
Key Indicators (Rp.Bn)
YoY
FY17 FY16 Growth (%)
Data, Internet & IT Service 55,343 42,991 28.7
Cellular Voice and SMS 50,438 54,477 (7.4)
Fixed Line Voice 6,665 7,542 (11.6)
Interconnection 5,175 4,151 24.7
Network and Other Telco Services 10,635 7,172 48.3
Total 128,256 116,333 10.2
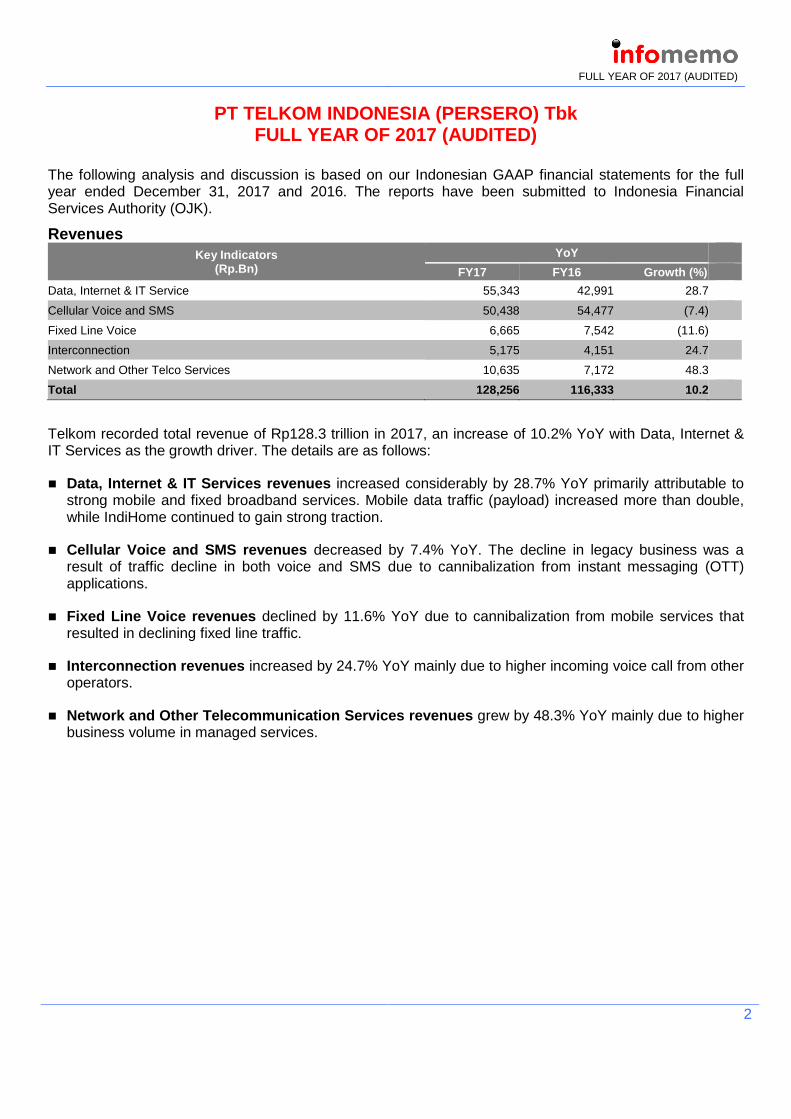
Telkom recorded total revenue of Rp128.3 trillion in 2017, an increase of 10.2% YoY with Data, Internet & IT Services as the growth driver. The details are as follows:
Data, Internet & IT Services revenues increased considerably by 28.7% YoY primarily attributable to strong mobile and fixed broadband services. Mobile data traffic (payload) increased more than double, while IndiHome continued to gain strong traction.
Cellular Voice and SMS revenues decreased by 7.4% YoY. The decline in legacy business was a result of traffic decline in both voice and SMS due to cannibalization from instant messaging (OTT) applications.
Fixed Line Voice revenues declined by 11.6% YoY due to cannibalization from mobile services that resulted in declining fixed line traffic.
Interconnection revenues increased by 24.7% YoY mainly due to higher incoming voice call from other operators.
Network and Other Telecommunication Services revenues grew by 48.3% YoY mainly due to higher business volume in managed services.
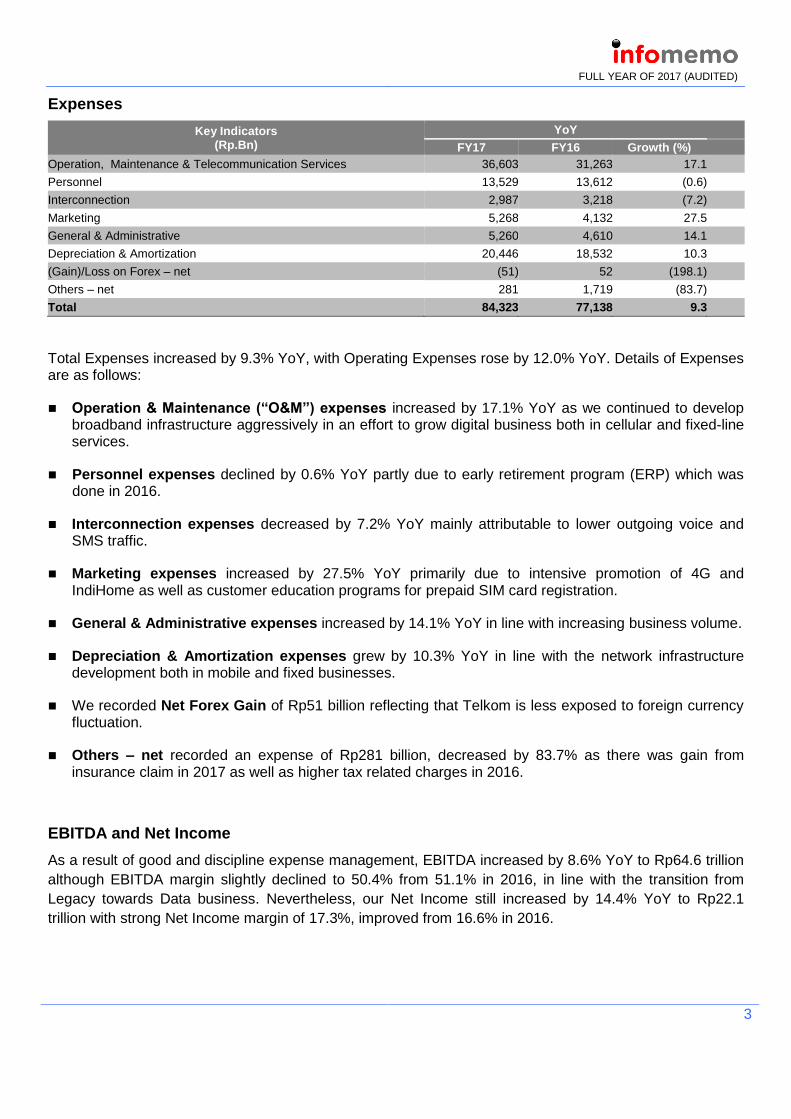
Total Expenses increased by 9.3% YoY, with Operating Expenses rose by 12.0% YoY. Details of Expenses are as follows:
Operation & Maintenance (“O&M”) expenses increased by 17.1% YoY as we continued to develop broadband infrastructure aggressively in an effort to grow digital business both in cellular and fixed-line services.
Personnel expenses declined by 0.6% YoY partly due to early retirement program (ERP) which was done in 2016.
Interconnection expenses decreased by 7.2% YoY mainly attributable to lower outgoing voice and SMS traffic.
Marketing expenses increased by 27.5% YoY primarily due to intensive promotion of 4G and IndiHome as well as customer education programs for prepaid SIM card registration.
General & Administrative expenses increased by 14.1% YoY in line with increasing business volume.
Depreciation & Amortization expenses grew by 10.3% YoY in line with the network infrastructure development both in mobile and fixed businesses.
We recorded Net Forex Gain of Rp51 billion reflecting that Telkom is less exposed to foreign currency fluctuation.
Others – net recorded an expense of Rp281 billion, decreased by 83.7% as there was gain from insurance claim in 2017 as well as higher tax related charges in 2016.
EBITDA and Net Income
As a result of good and discipline expense management, EBITDA increased by 8.6% YoY to Rp64.6 trillion
although EBITDA margin slightly declined to 50.4% from 51.1% in 2016, in line with the transition from
Legacy towards Data business. Nevertheless, our Net Income still increased by 14.4% YoY to Rp22.1
trillion with strong Net Income margin of 17.3%, improved from 16.6% in 2016.
4
FULL YEAR OF 2017 (AUDITED)
Financial Position
Key Indicators (Rp.Bn)
YoY
FY17 FY16 Growth (%)
Assets 198,484 179,611 10.5
Liabilities 86,354 74,067 16.6
Non-controlling Interests 19,417 21,160 (8.2)
Equity attributable to owners of the company 92,713 84,384 9.9
Total assets as of 31 December 2017 was Rp198.5 trillion, increased by 10.5% YoY mainly due to
increase in fixed assets, receivables, and advanced payments.
Total liabilities at end of December 2017, increased 16.6% YoY to Rp86.3 trillion mainly attributed to increase in payables, accrued expenses and borrowings.
Non-controlling interest decreased by 8.2% YoY as a result of subsidiary’s dividend payment.
Our equity increased by 9.9% YoY due to higher retained earnings as a result of strong performance during 2017.
Cash Flows
Key Indicators (Rp. Bn) YoY
FY17 FY16 Growth (%)
Cash Flow from Operating Activities 49,405 47,231 4.6
Cash Flow used in Investing Activities (33,007) (27,557) 19.8
Cash Flow used in Financing Activities (21,052) (17,905) 17.6
Net (Decrease)/Increase in Cash & Cash Equivalents (4,654) 1,769 (363.1)
Effect of Exchange Rate Changes on Cash & Cash Equivalents 32 (119) (126.9)
Cash & Cash Equivalents at Beginning of Year 29,767 28,117 5.9
Cash & Cash Equivalents at End of Period 25,145 29,767 (15.5)
Net cash provided by operating activities increased by 4.6% YoY as a result of strong cash inflow from operations.
Net cash used in investing activities increased by 19.8% YoY from cash payment for fixed assets acquisition during the period.
Net cash used in financing activities grew by 17.6% YoY mainly due to increase in payment of dividend to shareholders and non-controlling interest.
5
FULL YEAR OF 2017 (AUDITED)
Debts
Currencies (Rp.Bn)
YoY Portion (%)
FY17 FY16 Growth (%) FY17 FY16
IDR/Rupiah 29,817 26,091 14.3 94.2 93.9
USD/US Dollar 1,029 991 3.8 3.3 3.6
JPY/Japanese Yen 648 707 (8.3) 2.0 2.5
MYR/Malaysian Ringgit 174 - 100.0 0.5 -
Total 31,668 27,789 14.0 100.0 100.0
At the end of 2017, total debts amounting to Rp31.7 trillion, increased by 14.0% compared to the end of 2016. Around 94.2% of our debt was in Rupiah currency, 3.3% was in US Dollar currency and the remaining balance was in Japanese Yen and Malaysian Ringgit, consisting of short and long-term Bank Loans, Bonds and Two-Step Loans. Our debt to equity ratio (“DER”) was still relatively low at 34.2%.
Gearing Ratio
Key Indicators YoY
FY17 FY16 Growth (ppt)
Net Debt to Equity (%) 7.0 (2.3) 9.3
Debt to Equity (%) 34.2 32.9 1.3
Debt to EBITDA (%) 49.0 46.7 2.3
Debt Service Ratio (Times) 6.8 7.8 (1.0)
Financial Ratios
Ratios (%)
YoY
FY17 FY16 Growth (ppt)
EBIT Margin 34.3 33.7 0.6
EBITDA Margin 50.4 51.1 (0.7)
Net Income Margin 17.3 16.6 0.7
Current Ratio 104.8 120.0 (15.2)
Total Liabilities to Equity 93.1 87.8 5.3
Return on Assets 11.2 10.8 0.4
Return on Equity 23.9 22.9 1.0
Return on Invested Capital 17.8 17.3 0.5
Capital Expenditure
For the full year of 2017, Telkom Group spent Rp33.2 trillion in Capital Expenditure (Capex). In mobile services, Capex was mainly utilized for radio access network (BTS) development. While in fixed businesses, Capex was primarily utilized to develop access and backbone infrastructure, including satellite and submarine cable systems (IGG and SEA-US) to support fixed as well as mobile broadband businesses. Some portion of Capex were also utilized for other projects such as tower.
6
FULL YEAR OF 2017 (AUDITED)
Mobile Services
Telkomsel Financial Result
Despite the challenges in Legacy business (Voice & SMS), Telkomsel managed to deliver a strong set of
results for 2017 with Revenues, EBITDA and Net Income grew by 7.5%, 7.7% and 7.8% YoY, respectively
which contributed from transformation initiatives in Digital Business as engine of growth. Revenues grew to
Rp93,217 billion supported by Digital Business which posted 28.7% YoY growth, driven by Data which
increased by 28.2% YoY and Digital Services which increased by 33.6% YoY. Digital Business accounted
for 42.3% of total revenues, increased significantly from 35.4% a year ago. EBITDA and Net Income
margins were higher by 0.1ppt to 57.5% and 32.6%, respectively. Telkomsel strongly believes that Data
and Digital service businesses are the future of telecommunication industry. Therefore, Telkomsel is
focusing on building digital ecosystem by establishing digital services portfolio which consists of Digital
Lifestyle, Mobile Financial Services, Digital Banking and Digital Advertising services.
Telkomsel’s subscriber base grew by 12.9% YoY to 196.3 million attributable to effective sales and
marketing programs. In line with our philosophy to always lead in network supply including in outside Java
to maintain our network superiority and growing our Digital Business, we deployed 31,672 new BTS during
2017, all were 3G and 4G BTS. Our data traffic increased by 126.2% to 2,168,245 TB mainly fueled by high
growth in 3G/4G capable device that reached 108.2 million (+30.9% YoY), or 55.1% of our customer base.
In terms of infrastructure, by end of December 2017 our BTS on-air totaled 160,705 units (+24.5% YoY),
around 70% of which were 3G/4G BTS.
Statements of Profit and Loss
Financial Performance (Rp. Bn)
YoY QoQ
FY17 FY16 Growth (%)
4Q17 3Q17 Growth (%)
Revenues 93,217 86,725 7.5 23,691 23,531 0.7
Legacy 53,750 56,066 (4.1) 12,364 13,458 (8.1)
Digital Business 39,466 30,659 28.7 11,327 10,073 12.4
Net Income Margin (%) 32.6 32.5 0.1ppt 30.0 33.1 (3.2ppt)
Proportion of Digital Business (%) 42.3 35.4 7.0ppt 47.8 42.8 5.0ppt
Telkomsel recorded operating revenues of Rp93,217 billion for FY17, an increase of 7.5% YoY.
Prepaid revenue increased by 6.1% YoY to Rp79,484 billion, mainly driven by growth in Digital
Business ARPU supported by the growth in Data as well as growth in prepaid subscriber base which
grew by 12.9% YoY to 191.6 million subscribers.
Postpaid revenue increased by 11.1% YoY to Rp7,118 billion mainly driven by the increase in the
postpaid customer base which grew by 13.4% YoY to 4.7 million subscribers.
Interconnection and International Roaming revenues increased by 17.9% YoY to Rp5,398 billion, due to
7
FULL YEAR OF 2017 (AUDITED)
seasonal increase in traffic from other local operators.
In FY17, total expenses including depreciation and amortization increased by 7.4% YoY to Rp53,164 billion,
mainly driven by: (1) Operational & Maintenance expenses as the company accelerated network
deployment to maintain network quality, resulted in higher transmission and network space rental costs, (2)
Marketing expenses due to promotion & events related to 4G penetration program, youth engagement
events across the country and other marketing and sales activities in response to competition dynamics.
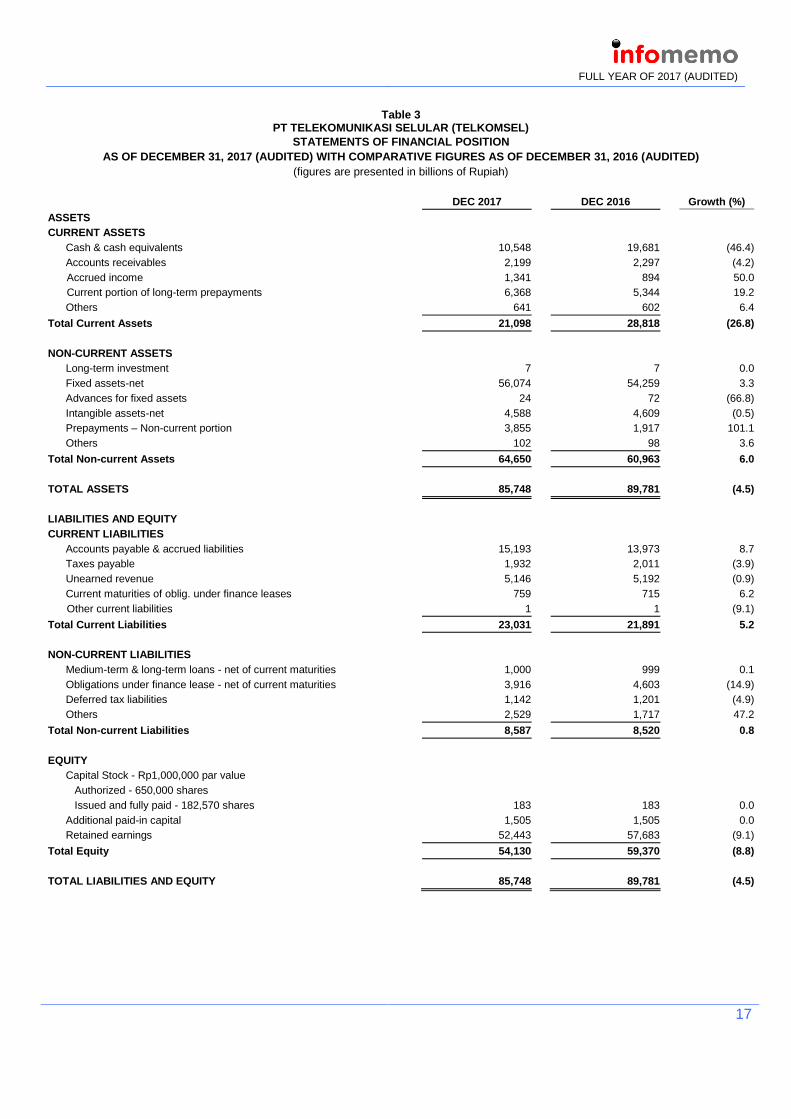
Statements of Financial Position
Statements of Financial Position (Rp Bn) Dec-17 Dec-16 Growth (%)
Current Assets 21,098 28,818 (26.8)
Non-Current Assets 64,650 60,963 6.0
Total Assets 85,748 89,781 (4.5)
Current Liabilities 23,031 21,891 5.2
Non-Current Liabilities 8,587 8,520 0.8
Equity 54,130 59,370 (8.8)
Total Liabilities & Stockholders’ Equity 85,748 89,781 (4.5)
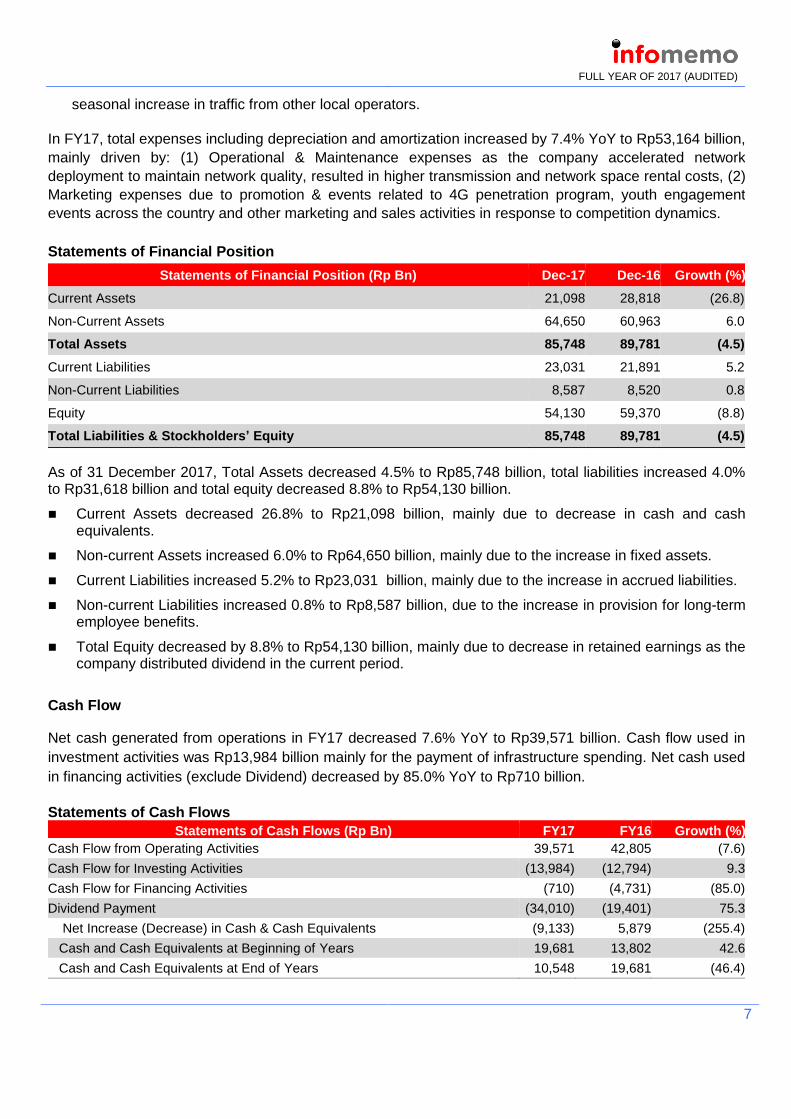
As of 31 December 2017, Total Assets decreased 4.5% to Rp85,748 billion, total liabilities increased 4.0% to Rp31,618 billion and total equity decreased 8.8% to Rp54,130 billion.
Current Assets decreased 26.8% to Rp21,098 billion, mainly due to decrease in cash and cash equivalents.
Non-current Assets increased 6.0% to Rp64,650 billion, mainly due to the increase in fixed assets.
Current Liabilities increased 5.2% to Rp23,031 billion, mainly due to the increase in accrued liabilities.
Non-current Liabilities increased 0.8% to Rp8,587 billion, due to the increase in provision for long-term employee benefits.
Total Equity decreased by 8.8% to Rp54,130 billion, mainly due to decrease in retained earnings as the company distributed dividend in the current period.
Cash Flow
Net cash generated from operations in FY17 decreased 7.6% YoY to Rp39,571 billion. Cash flow used in
investment activities was Rp13,984 billion mainly for the payment of infrastructure spending. Net cash used
in financing activities (exclude Dividend) decreased by 85.0% YoY to Rp710 billion.
Statements of Cash Flows
Statements of Cash Flows (Rp Bn) FY17 FY16 Growth (%)
Cash Flow from Operating Activities 39,571 42,805 (7.6)
Cash Flow for Investing Activities (13,984) (12,794) 9.3
Cash Flow for Financing Activities (710) (4,731) (85.0)
Dividend Payment (34,010) (19,401) 75.3
Net Increase (Decrease) in Cash & Cash Equivalents (9,133) 5,879 (255.4)
Cash and Cash Equivalents at Beginning of Years 19,681 13,802 42.6
Cash and Cash Equivalents at End of Years 10,548 19,681 (46.4)
8
FULL YEAR OF 2017 (AUDITED)
Debt Profile
As of 31 December 2017, Telkomsel’s outstanding loans amounted to Rp1,000 billion, and obligations under finance lease of Rp3,916 billion. Telkomsel’s Debt to Equity Ratio (DER) was 10.5%. Several financial covenants related to its loans/debts as follows:
Covenants to be Maintained Required Actual
EBITDA to Debt Service ≥1.25 28.80
Debt to Tangible Net Worth ≤2.00 0.02
RESULTS BY SERVICE
Cellular Services
Voice and SMS
Telkomsel had successfully maintain healthy revenue growth from Voice over the past few years mainly
attributed to its initiative in dynamic cluster based pricing and successfully migrating customer from Pay As
You Use (PAYU) to package. And along the transition phase from legacy towards digital, Legacy business
was slowing down with Voice revenue growth of 0.2% YoY to Rp40,113 billion and Voice traffic decline of
-8.6% YoY.
SMS revenue declined by -17.8% YoY to Rp10,841 billion as the impact of OTT services cannibalization
and traffic declined by -25.9% YoY.
Digital Business
Digital business remained the engine of growth, increased by 28.7% YoY to Rp39,466 billion and rose its
contribution to total revenue substantially to 42.3% from 35.4% last year.
Revenue from Data grew by 28.2% YoY to Rp35,524 billion, driven by healthy growth in 3G/4G capable
device adoption (+30.9% YoY to 108.2 million users), successful migration of PAYU to Flash packages, as
well as continued strong growth in data payload, which increased by 126.2% YoY to 2,168,245 TB. As of
31 December 2017, 49.6 million of our customers that have LTE devices have swapped to USIM to utilize
4G services.
Digital Services also grew strongly by 33.6% YoY to Rp3,942 billion and has become the main driver of
Telkomsel’s digital transformation. A number of investments and key initiatives have been established to
accelerate the growth of digital services, in line with Telkomsel’s mission to build a digital Indonesia with
key products and services including Digital Lifestyle, Mobile Financial Services, Digital Banking and Digital
Advertising:
▪ Digital Lifestyle continued to focus on providing excellent mobile entertainment experience for
customers. By targeting different segments through various services, Telkomsel aims to become the
leading mobile entertainment provider in the country through VAS, Music, Video, Games & Market
Place, etc.
9
FULL YEAR OF 2017 (AUDITED)
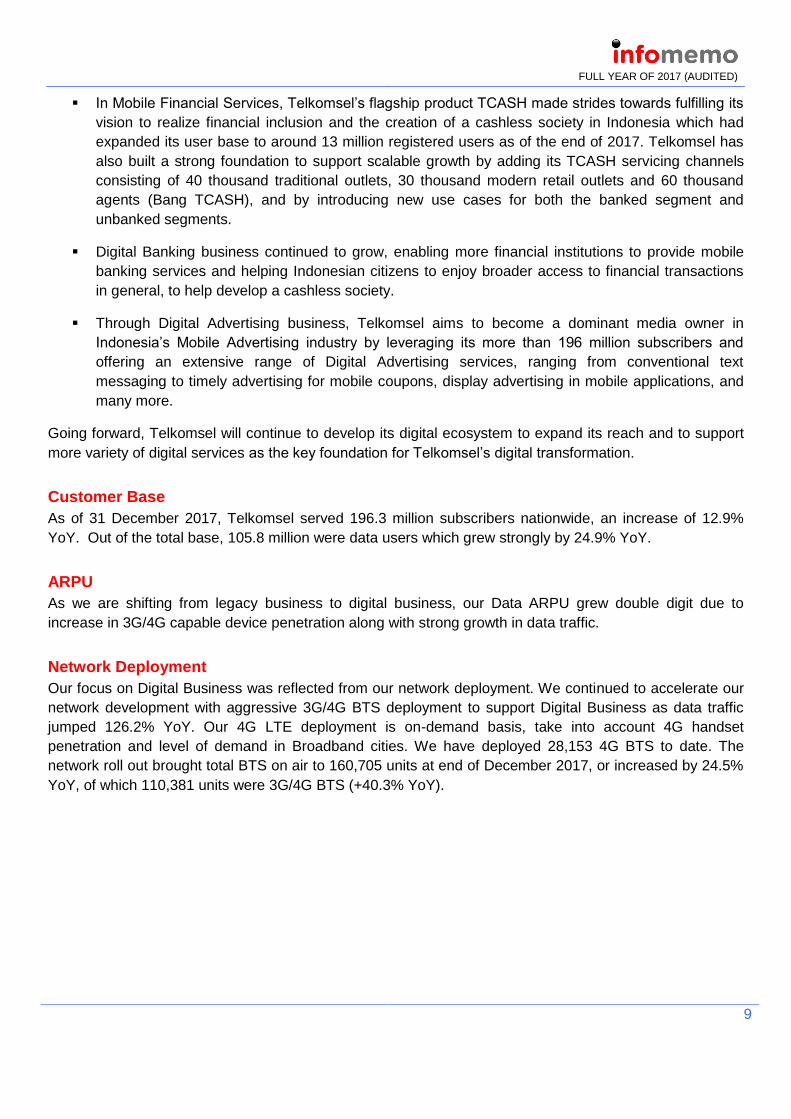
▪ In Mobile Financial Services, Telkomsel’s flagship product TCASH made strides towards fulfilling its
vision to realize financial inclusion and the creation of a cashless society in Indonesia which had
expanded its user base to around 13 million registered users as of the end of 2017. Telkomsel has
also built a strong foundation to support scalable growth by adding its TCASH servicing channels
consisting of 40 thousand traditional outlets, 30 thousand modern retail outlets and 60 thousand
agents (Bang TCASH), and by introducing new use cases for both the banked segment and
unbanked segments.
▪ Digital Banking business continued to grow, enabling more financial institutions to provide mobile
banking services and helping Indonesian citizens to enjoy broader access to financial transactions
in general, to help develop a cashless society.
▪ Through Digital Advertising business, Telkomsel aims to become a dominant media owner in
Indonesia’s Mobile Advertising industry by leveraging its more than 196 million subscribers and
offering an extensive range of Digital Advertising services, ranging from conventional text
messaging to timely advertising for mobile coupons, display advertising in mobile applications, and
many more.
Going forward, Telkomsel will continue to develop its digital ecosystem to expand its reach and to support
more variety of digital services as the key foundation for Telkomsel’s digital transformation.
Customer Base
As of 31 December 2017, Telkomsel served 196.3 million subscribers nationwide, an increase of 12.9%
YoY. Out of the total base, 105.8 million were data users which grew strongly by 24.9% YoY.
ARPU
As we are shifting from legacy business to digital business, our Data ARPU grew double digit due to
increase in 3G/4G capable device penetration along with strong growth in data traffic.
Network Deployment
Our focus on Digital Business was reflected from our network deployment. We continued to accelerate our
network development with aggressive 3G/4G BTS deployment to support Digital Business as data traffic
jumped 126.2% YoY. Our 4G LTE deployment is on-demand basis, take into account 4G handset
penetration and level of demand in Broadband cities. We have deployed 28,153 4G BTS to date. The
network roll out brought total BTS on air to 160,705 units at end of December 2017, or increased by 24.5%
YoY, of which 110,381 units were 3G/4G BTS (+40.3% YoY).
10
FULL YEAR OF 2017 (AUDITED)
The following table presents performance of our cellular business:
Fixed Line Services
Fixed Broadband IndiHome
IndiHome continued to show encouraging result, as in 2017 we successfully added 1.3 million new
subscribers. Total IndiHome subscribers reached 2.96 million, grew by 82.6% YoY, with IndiHome Triple
Play represented 66% of total customers. While IndiHome Dual Play that we launched at end of 2016, has
shown strong traction. Around 70% of the new customers in 2017 were Dual Play.
In 2017, revenue from IndiHome business reached Rp8.2 trillion, sharply increased by 48.1% YoY. ARPU
of IndiHome in 4Q17 was Rp285 thousand, declined from Rp308 thousand in the previous quarter as a
result of higher contribution from Dual Play customers and promotional package. We will keep accelerating
IndiHome customer growth, while at the same time improving IndiHome ARPU level. We encourage
customers to purchase various add-ons and mini pack, upgrade to Triple Play and higher speed services.
Enterprise Business
In Enterprise market, Telkom remains focused on provision of ICT solutions with various smart enabler
platforms. There is increasing trend for Indonesian corporations to focus on their core businesses and
outsource their ICT solution needs to reliable third-party providers. It is estimated that Indonesia enterprise
ICT market is growing at around 13% annually. This represents huge opportunity for Telkom to expand its
Enterprise business in the future. In 2017, Telkom Enterprise business recorded Rp19.1 trillion in revenue,
significantly grew by 21.0% YoY.
We serve three customers segments under our Enterprise business:
Corporate. We serve around 1,450 corporate clients from various industries such as consumer
goods, insurance, pharmaceutical, and banking, which contributed around 58% to Enterprise
segment revenue. Corporate customers now demand more integrated ICT solutions on top of
connectivity such as smart enablers, data center and cloud, platforms and applications, as well as
business process outsourcing. With low penetration of integrated ICT services among Indonesian
corporate, coupled with the rising trend of business process digitization, Telkom is in the leading
position to grow its Corporate segment.
Operational Indicators YoY QoQ
FY17 FY16 Growth (%)
4Q17 3Q17 Growth (%)
Customer Base (000) 196,322 173,920 12.9 196,322 190,362 3.1
Net Adds (000) 22,402 21,279 5.3 5,960 12,361 (51.8)
BTS on Air (units) 160,705 129,033 24.5 160,705 152,191 5.6
Total Employees 5,461 5,191 5.2 5,461 5,409 1.0
MoU (In billion minutes) 211.8 231.7 (8.6) 54.6 52.4 4.1
SMS (In billion units) 135.4 182.8 (25.9) 28.4 32.7 (13.1)
Data Payload (TB) 2,168,245 958,733 126.2 743,218 597,227 24.4
11
FULL YEAR OF 2017 (AUDITED)
Government. We provide connectivity and ICT solutions for around 940 Government institutions
including Central Government, Local Government, and Government Agencies. By our estimate,
Indonesia government IT-related spending is around Rp15 trillion annually, which provides a
sizeable business opportunity for Telkom. Government segment contributed around 23% to
Enterprise segment revenue.
Small and Medium-sized Enterprise (SME). We serve around 300,000 SME clients for which we
provide various services from connectivity to various solutions. With 3.7 million identified SMEs in
our database and very low ICT adoption rate among Indonesia SMEs, Telkom still has large
potential upside to grow in SME segment.
Wholesale and International Business
Our wholesale services portfolio includes domestic and international traffic carrier, wholesale connectivity,
towers, satellite, as well as telecommunication and infrastructure managed services. For the year 2017, our
Wholesale and International Business revenue was Rp7.4 trillion, grew by 26.8% YoY.
Our Wholesale and International Business arm aims to create sustainable value for Telkom Group and its
customers by becoming a global digital hub. To do so, we continue to expand our network infrastructure. In
addition to the completed SEA-ME-WE5 & SEA-US submarine cable system, Indonesia Global Gateway
project or IGG that will connect SEA-ME-WE-5 and SEA-US has reached 62% progress and is expected to
commence operation in 3Q18. We are also in the process of developing our new Telkom-4 (“Merah Putih”)
Satellite which has reached 75% progress and is expected to launch in mid-2018.
Network Modernization
In line with our transformation program, we continued our effort to modernize our switching centers from
copper-based to IP-based. In 2017, we shut down 282 copper-based switching centers, so that
cumulatively we have already shut down 472 out of around 1,250 switching centers across Indonesia. By
the time the modernization is completed, in 2020 we will have 14 IP-based switching centers.
Recent Activities
Acquisitions
To strengthen our digital capabilities, in 4Q17 and 1Q18 Telkom acquired several companies i.e. PT
Bosnet Distribution Indonesia, an e-logistics company; PT Nutech Integrasi, an e-transportation
services; and Cellum, a mobile payment and commerce solutions provider. We also acquired TS
Global Network Sdn Bhd, a satellite communication service company, to strengthen our backbone
network. These acquisitions were made in an effort to realize our vision to become a digital telco
company.
Prepaid SIM Card Registration
In supporting the Government’s prepaid SIM card registration program, based on data from Ministry of
Communication and Informatics, Telkomsel has around 140 million subscribers registered by
February 28, 2018 or more than 70% of Telkomsel’s total subscribers. The remaining unregistered
customers still have time to register their SIM card until end of April 2018. We believe the prepaid SIM
card registration will have positive impact to the industry as we expect churn rate will reduce and
competition should be better.
12
FULL YEAR OF 2017 (AUDITED)
Product and Marketing Activities
Fixed Line & Enterprise
IndiHome released IndiHome Natal & Tahun Baru (Christmas & New Year) Package discounted from
normal price with 300 minutes free call to fixed line, UseeTV Entry package, and contents from HOOQ and
iflix with price starting from Rp310 thousand for 10Mbps internet speed. This promotion applies until
January 31, 2018.
Mobile
Acceleration on 3G/4G Device Adoption
To encourage mass adoption of smartphone device in efficient and effective way, Telkomsel Android
United (TAU) and Halo Kick! Program were launched with variety of device bundling: (1) Vivo V7+,LG Q6 &
Xiaomi Mi A1 bundled with TAU program consist of Data quota up to 60GB starting from Rp45 thousand;
(2) Samsung Digital Experience Zone event to offer cash back or discount in bundling program by
redeeming Telkomsel Poin. Customer will get TAU or Halo Kick! package consisting of Data quota up to
60GB for 1 month; (3) Telkomsel Vaganza which offers various promo for smartphone, MiFi, and services.
There are some activities such as prepaid registration, smartphone bazaar & trade-in, Telkomsel Poin
redemption, etc.
ADDITIONAL INFORMATION
Awards & Recognition
During 4Q17, we have been awarded by several institutions for our achievements, among others: The Indonesian Best Brand Award for IndiHome from SWA, Mars, and Metro TV.
Forbes Global 2000 List 2017 for Telkom in World’s Best Employers and Top Regarded list from Forbes Magazine.
8th BUMN Awards for Telkom with Excellent title in the category of Telecommunication & Media from Infobank Magazine.
IPRA Golden World Awards for Excellence 2017 for Telkom Corporate Communications from International Public Relations Association.
International Business Award 2017 for Telkom winning Grand Stevie Award 2017 from Stevie International.
Indonesia PR of the Year for Telkom CEO Alex J. Sinaga as Spoke Person of the Year from Mix Magazine.
Top IT & Telco 2017 for IndiHome as Top Fixed Internet Provider from TI Telco.
Social Media Award for IndiHome with 1st rank in ISP Fixed category from Media Wave and Marketing Magazine.
Indonesia Best Employed Brand Awards 2017 for Telkom’s Director of Wholesale & International Service Abdus Somad Arief as Leadership Excellence in Technology Innovation from World HRD Congress, Employer Branding Institute – India.
13
FULL YEAR OF 2017 (AUDITED)
BUMN Performance Excellence Award (KPKU) for Telkom as Industry Leader with score of 730.50 from Forum Ekselen BUMN.
ICSB Indonesia Presidential Award for Telkom’s Community Development Center in Business Practitioner category from International Council for Small Business and ACSB.
Top Capital Market 2017 for Telkom as Top Stock 2017, Top Corporate Reputation 2017 in Telecommunication Sector, and Top Issuer 2017 in Telecommunication Sector from Business News Indonesia with InfoVesta, IPEI Institute, Investment and Financial Learning Center, and Asia Business Research Center.
Economic Challenges Award 2017 for Telkom as Winner in Telecommunication category from Metro TV.
Rapat Koordinasi BUMN for Telkom’s Digital Globalizaton & Synergy from the Ministry of SOEs.
The 9th IICD Corporate Governance Awards for Telkom as Top 50 in Big Cap Public Listed Companies and the Best in Non-financial Sector from IICD and Kontan.
Indonesia Excellence Award for Telkom as Indonesia Telecom Service Provider of the Year and Indonesia Fixed Broadband Service Provider of the Year from Frost and Sullivan.
Apresiasi Indonesia untuk BUMN for Telkom as the Most Popular SOE in Telecommunication Sector and Top 5 in Corporate Social Responsibility, and for Telkom CEO Alex J. Sinaga as Top 5 Best CEO in 2017 from Warta Ekonomi.
Corporate Secretary Award for Telkom as Top 5 in GCG issues in Telco Sector from Warta Ekonomi.
Indonesia Most Admired CEO Award 2017 for Telkom CEO Alex J. Sinaga as Top 5 Most Admired CEO in Telco Sector from Warta Ekonomi.
Indonesia Corporate Reputation Award 2017 for Telkom as Top 5 Corporate Reputation in Telco Sector.
Tokoh Finansial Indonesia Award for Telkom as Best SOE 2017 in Non-financial, Telecommunication and Broadcasting Category from Investor Magazine.
Mastel Award 2017 for Telkom Infrastructure Development Contribution from Mastel.
Corporate Governance Perception Index (CGPI) for Telkom as Most Trusted Company based on CGPI from Indonesia Institute for Corporate Governance and SWA Magazine.
Indonesia Employers of Choice Award 2017 for Telkom from SWA Magazine.
Marketeer of The Year Award 2017 for Ririek Adriansyah as The Best Industry Marketing Champion 2017 in Telecom & Marketeer of the Year Indonesia 2017 from MarkPlus, Inc.
Indonesia Most Admired CEO 2017 for Ririek Adriansyah as Top 5 Most Admired CEO in Telecommunication Sector from Warta Ekonomi Magazine.
2017 Frost & Sullivan Indonesia Excellence Awards for Telkomsel as Indonesia Digital Services Provider of the Year & TCASH as Indonesia M-Money Service Provider of the Year from Frost & Sullivan.
14
FULL YEAR OF 2017 (AUDITED)
World Branding Awards 2017 for Telkomsel as Brand of the Year in Telecommunication Mobile Category from World Branding Forum.
Indonesia 2017 MMA Smarties Award for Telkomsel in category of Brand Awareness, Innovation, Mobile Video, Digital Banking & Best in Industry from Mobile Marketing Association.
Indonesia Best Employer Brand Awards 2017 for Telkomsel as Indonesia Best Employer Branding from HRD Congress - STARS Group.
Asia’s Best Brand Brand Awards 2017 for Telkomsel as Top Brand Telecommunication from Brand Alliance.
World Communications Awards 2017 for Telkomsel as Top 5 Best Operator in Emerging Market from Total Telecom.
Indonesia Best Brand Award 2017 for simPATI as Best Brand Platinum 2017 for 7 consecutive years in GSM SIM Card category from SWA Magazine & Mars Research.
Indonesia PR of the Year 2017 for Telkomsel Popcorn as Outstanding Owned Media 2017 from MIX-Marketing Communication & SWA Magazine.
TOP IT & TELCO Award 2017 for kartuHalo as Top Postpaid GSM Card 2017 & simPATI as Top Prepaid GSM Card 2017 from itech Magazine.
Indonesian Customer Satisfaction Award (ICSA) 2017 for kartuHalo as The Best in Achieving Total Customer Satisfaction for Postpaid Cellular SIM Card Category & simPATI as The Best in Achieving Total Customer Satisfaction for Prepaid Cellular SIM Card Category from Frontier Consulting Group & SWA Magazine.
Indonesia Most Experiential Brand Activation Award 2017 for Telkomsel Ekspedisi Langit Nusantara Program as Best of the Best Brand Image & Engagement Activation 2017 from MIX-Marketing Communication & SWA Magazine.
Indonesia Best Corporate Reputation Award 2017 for Telkomsel as Top 5 Corporate Reputation in Telecommunication Sector from Warta Ekonomi Magazine.
Indonesia Good Corporate Governance Award 2017 for Telkomsel as Trusted Company Based on CGPI from SWA Magazine.
15
FULL YEAR OF 2017 (AUDITED)
Table 1 PERUSAHAAN PERSEROAN (PERSERO)
PT TELEKOMUNIKASI INDONESIA Tbk AND SUBSIDIARIES CONSOLIDATED STATEMENT OF FINANCIAL POSITION
As of December 31, 2017 (Figures in tables are expressed in billions of Rupiah, unless otherwise stated)
2017 2016 Growth (%) ASSETS
CURRENT ASSETS Cash and cash equivalents 25,145 29,767 (15.5) Other current financial assets 2,173 1,471 47.7 Trade receivables – net of provision for impairment of receivables
Related parties 1,545 894 72.8 Third parties 7,677 6,469 18.7
Other receivables – net of provision for impairment of receivables 342 537 (36.3) Inventories – net of provision for obsolescence 631 584 8.0 Assets held for sale 10 3 233.3 Prepaid taxes 1,947 2,138 (8.9) Claim for tax refund 908 592 53.4 Other current assets 7,183 5,246 36.9 Total current assets 47,561 47,701 (0.3) NON-CURRENT ASSETS Long-term investments 2,148 1,847 16.3 Property and equipment – net of accumulated depreciation 130,171 114,498 13.7 Prepaid pension benefit cost - 199 (100.0) Intangible assets – net of accumulated amortization 3,530 3,089 14.3 Deferred tax assets – net 2,804 769 264.6 Other non-current assets 12,270 11,508 6.6 Total non-current assets 150,923 131,910 14.4 TOTAL ASSETS 198,484 179,611 10.5
LIABILITIES AND EQUITY CURRENT LIABILITIES Trade payables
Related parties 896 1,547 (42.1) Third parties 14,678 11,971 22.6
Other payables 217 172 26.2 Taxes payable 2,790 2,954 (5.6) Accrued expenses 12,630 11,283 11.9 Unearned income 5,427 5,563 (2.4) Advances from customers and suppliers 1,240 840 47.6 Short-term bank loans 2,289 911 151.3 Current maturities of long-term borrowings 5,209 4,521 15.2 Total current liabilities 45,376 39,762 14.1 NON-CURRENT LIABILITIES Deferred tax liabilities – net 933 745 25.2 Unearned income 524 425 23.3 Long service award provisions 758 613 23.7 Pension benefits and other post-employment benefits obligations 10,195 6,126 66.4 Long-term borrowings – net of current maturities 27,974 26,367 6.1 Other liabilities 594 29 1948.3