SPECIAL ARTICLES Employment and Wages in Manufacturing Industries Tiends, Hypothesis and Evidence R Nagaraj Thte decline in registered manufacturing employment thattook place in the 80s is widelybelieved to reflect substitution of capitalfor labour,as the wage rate reportedly increasedrapidly becauseof growingrigiditiesin the labourmarket. How valid isthisproposition?Withoutgetting intotheanalytical differenceson therelationship between labourmarketbehaviour and econonmic performance, this study examines thte trendsin wages, and (as a measureof labour market distortions)the power of organised labour.Reassessing the postulatedrelationship between earnings, capital intensityand employment, the study suggests an alternative explanation for the changes in employment. THE decline in the growth of employment in themanufacturing sector in the 80s and in particular the fall in the number of workers in registered manufacturing are by now accepted facts. While the growth rates in real net value added and real earnings per worker (earnings, hereafter) in registered manufacturing improved, the absolute num- ber of workers employed declined (Fig- ure 1). These tendencies arediscerniblein a number of major industry groups(Table 1). ' Perceiving them to be partof an economy- wide phenomenon, the Planning Commis- sion (1990) favouredserious changes in the development strategy.2 Isher Ahluwalia, however, identified policy-induced rigidities in the labour mar- ket as the principalreason for the decline in employment, though she mentions other possible reasons like the growthof contract labour andspill over of employmentintothe unregistered sector. Identifying consumer non-durable goods industries in registered manufacturing as accountingfor the bulkof thedecline, she argued: "The sharp increase in the capital-labour ratio in the first half of the 80s was associated with a sharp increase in the real wage rate during this period.... While the cause and effect can be debatedat length, the data seem to suggest that the consumernon-durable goods sector experi- enced the maximum increase in capital in- tensity as well as the maximum increase in the real wage rate during this period" [Ahluwalia 1992: 82-84]. Associating the increase in the real wage rate with the re- portedlygrowing labourmarketrigidities- citing evidence on the increase in disciplin- ary action against workers between 1960 and 1975 and the Indian worker's prefer- ence for job security than for higher earn- ings-she further said: "Tlhis makes for inflexibility in hiringandfiringpossibilities and rigidities in the labour market" [Ahluwalia 1992: 841. The World Bank also offers a similar explanation. Claiming that the real wage rate increasedat 7.2 per cent per annumin the first half of the 80s, the Bank argued: "...employersresponded tto the increase in wage rate]by virtuallystoppingnew hiring and retrenching existing workers to the extent possible". The study added: "The estimates... point to a significant tradeoff between the higher real cost of labour and employment. This suggests that the faster growth of real wages in -1980s indeed did play an important role in slowing em- ploymentcreation" [TheWorld Bank 1989: 109-10]. These views areconsistentwith the trade theoretic perspectiveon the principal prob- lem withIndia's industrial policy. Analysing Indianexperience between 1960 and 1980, Robert E B Lucas attributeslow employ- ment growth to import substituting industrialisation in general and the policy- induced rigiditiesin non-agricultural labour markets in particular: "...[a] rising indus- trial wage has been a significant factor in the observed move toward more capital intensive techniques... Since the scope and coverage of these job security laws has increased through time, it again seems likely that they have contributed to the trend towards reliance on more capital intensive techniques within many manufacturing industries" [Lucas 1988: 189-90]. These propositions-based on (simplisti- cally) neoclassical percepts-form a seri- ous viewpoint, especially in the present context of policy reforms.3 Theiranalytical and empirical validity can, however, be contested on a number of substantive issues. Firstly, these studies seem to have ignored the possible role of human capital vari- ables-namely, skill, educationand experi- ence-in increasing thewages as thesecould be considerable in a period of structural changes in the composition of industrial sector.4 Second, the orthodoxview seems to ignore the effect of a reduction of wages, mediated by aggregate demand, on output growth [Taylor 1988]. Ibird, evidence on the relationship between the labourmarket institutions and economic performance is ambiguous, as discernible from the recent European experience in general and the Scandinavian experience in particular, where corporatism seems to have positively influ- enced industrial relations and hence macroeconomic performance [Freeman 1988]. Given such ambiguity, both in theory as well in experience, a close look at the ortho- dox view could, therefore, be of value in understanding the relationship between labourmarketbehaviourand outputperfor- mance in India's manufacturingsector. In doing so, we propose to examine (a) the concept of wage rate/wages as used in the studies mentioned above (Section I), (b) evidence on the reportedlygrowing ri- gidities in the non-agricultural labour mar- ket (Section II), and (c) the validity of the postulated relationship betweenwages, capi- tal-labour ratio and employment at a disag- gregated level (Section III). Before con- cluding, a provisional alternative explana- tion for the observed decline in registered manufacturing employment in the 80s is suggested (Section IV). I Distinction between Wage Rate and Earnings Ahluwalia and the World Bank use An- nual Survey of Industries (ASI) data on 'wages to workers'to compute the wage rate. (or wages).5As the ASI definition includes all payments made to workers-excepting lay off paymentsnot made by the employer and the imputed value of benefits in kind- Economic and Political Weekly January 22, 1994 177 Economic and Political Weekly, Vol. 29, No. 4 (Jan. 22, 1994), pp. 177-186
Transcript
SPECIAL ARTICLES
Employment and Wages in Manufacturing Industries
Tiends, Hypothesis and Evidence
R Nagaraj
Thte decline in registered manufacturing employment that took place in the 80s is widely believed to reflect substitution of capitalfor labour, as the wage rate reportedly increased rapidly because of growing rigidities in the labourmarket. How valid isthisproposition? Withoutgetting intothe analytical differenceson the relationship between labourmarketbehaviour and econonmic performance, this study examines thte trends in wages, and (as a measure of labour market distortions) the power of organised labour. Reassessing the postulated relationship between earnings, capital intensity and employment, the study suggests an alternative explanation for the changes in employment.
THE decline in the growth of employment in the manufacturing sector in the 80s and in particular the fall in the number of workers in registered manufacturing are by now accepted facts. While the growth rates in real net value added and real earnings per worker (earnings, hereafter) in registered manufacturing improved, the absolute num- ber of workers employed declined (Fig- ure 1). These tendencies are discernible in a number of major industry groups (Table 1). ' Perceiving them to be part of an economy- wide phenomenon, the Planning Commis- sion (1990) favoured serious changes in the development strategy.2
Isher Ahluwalia, however, identified policy-induced rigidities in the labour mar- ket as the principal reason for the decline in employment, though she mentions other possible reasons like the growth of contract labour and spill over of employment into the unregistered sector. Identifying consumer non-durable goods industries in registered manufacturing as accounting for the bulk of the decline, she argued: "The sharp increase in the capital-labour ratio in the first half of the 80s was associated with a sharp increase in the real wage rate during this period.... While the cause and effect can be debated at length, the data seem to suggest that the consumer non-durable goods sector experi- enced the maximum increase in capital in- tensity as well as the maximum increase in the real wage rate during this period" [Ahluwalia 1992: 82-84]. Associating the increase in the real wage rate with the re- portedly growing labour market rigidities- citing evidence on the increase in disciplin- ary action against workers between 1960 and 1975 and the Indian worker's prefer- ence for job security than for higher earn- ings-she further said: "Tlhis makes for inflexibility in hiring and firing possibilities and rigidities in the labour market" [Ahluwalia 1992: 841.
The World Bank also offers a similar explanation. Claiming that the real wage rate increased at 7.2 per cent per annum in the first half of the 80s, the Bank argued: "...employers responded tto the increase in wage rate] by virtually stopping new hiring and retrenching existing workers to the extent possible". The study added: "The estimates... point to a significant trade off between the higher real cost of labour and employment. This suggests that the faster growth of real wages in -1980s indeed did play an important role in slowing em- ploymentcreation" [The World Bank 1989: 109-10].
These views are consistent with the trade theoretic perspective on the principal prob- lem with India's industrial policy. Analysing Indian experience between 1960 and 1980, Robert E B Lucas attributes low employ- ment growth to import substituting industrialisation in general and the policy- induced rigidities in non-agricultural labour markets in particular: "...[a] rising indus- trial wage has been a significant factor in the observed move toward more capital intensive techniques... Since the scope and coverage of these job security laws has increased through time, it again seems likely that they have contributed to the trend towards reliance on more capital intensive techniques within many manufacturing industries" [Lucas 1988: 189-90].
These propositions-based on (simplisti- cally) neoclassical percepts-form a seri- ous viewpoint, especially in the present context of policy reforms.3 Their analytical and empirical validity can, however, be contested on a number of substantive issues. Firstly, these studies seem to have ignored the possible role of human capital vari- ables-namely, skill, education and experi- ence-in increasing the wages as these could be considerable in a period of structural
changes in the composition of industrial sector.4 Second, the orthodox view seems to ignore the effect of a reduction of wages, mediated by aggregate demand, on output growth [Taylor 1988]. Ibird, evidence on the relationship between the labour market institutions and economic performance is ambiguous, as discernible from the recent European experience in general and the Scandinavian experience in particular, where corporatism seems to have positively influ- enced industrial relations and hence macroeconomic performance [Freeman 1988].
Given such ambiguity, both in theory as well in experience, a close look at the ortho- dox view could, therefore, be of value in understanding the relationship between labour market behaviour and output perfor- mance in India's manufacturing sector. In doing so, we propose to examine (a) the concept of wage rate/wages as used in the studies mentioned above (Section I), (b) evidence on the reportedly growing ri- gidities in the non-agricultural labour mar- ket (Section II), and (c) the validity of the postulated relationship between wages, capi- tal-labour ratio and employment at a disag- gregated level (Section III). Before con- cluding, a provisional alternative explana- tion for the observed decline in registered manufacturing employment in the 80s is suggested (Section IV).
I Distinction between Wage Rate
and Earnings
Ahluwalia and the World Bank use An- nual Survey of Industries (ASI) data on 'wages to workers' to compute the wage rate. (or wages).5 As the ASI definition includes all payments made to workers-excepting lay off payments not made by the employer and the imputed value of benefits in kind-
Economic and Political Weekly January 22, 1994 177
Economic and Political Weekly, Vol. 29, No. 4 (Jan. 22, 1994), pp. 177-186
it evidently refers to workers' total earn- ings, which covers not only the wage rate- that is, the basic wage plus dearness allow- ance, wherever applicable-but also all ad- ditional remuneration for workers' addi- tional effort.6 Conceptually, earnings per worker is a function of the wage rate for the standard working day, remuneration for additional hours of work (and more shifts) and incentive income for more intensive work that is linked to output. In the decade beginning 1979-80, while the employment growth turned negative, total person days (or mandays) worked in registered manu- facturing-and hence mandays per worker- recorded a positive trend growth rate; sug- gesting that the observed increase in earn- ings per worker could, at least partly, repre- sent his (or her) compensation for greater effort and may not necessarily imply an increase in the wage rate, as has been argued (Figure 2).7
Admittedly, since the definition of work- ers in ASI includes contract (or casual) workers, it is arguable that all or most of the additional mandays worked may well have been done by contract workers at the market clearing wage rate, with little additional effort by the supposedly unionised perma- nent workers. This proposition is examined using the labour statistics data for the census sector of ASI.8 The share of casual workers in the total employment more than doubled from 4.6 per cent in 1980-81 to 10 per cent in 1986-87. However, as their proportion in the total mandays worked in 1986-87 is only 8.9 per cent, contract workers' contribution to mandays worked does not seem to be disproportionate to their share in employ- ment. An estimate-assuming that the pro- portion of contract workers in total employ- ment in the census sector is the same for ASI as a whole and that the share of mandays worked by casual workers in 1980- 81 is same as in 1986-87-suggests that between 1980-81 and 1986-87 while the mandays per worker for all workers in- creased by 16 per cent, the same for casual and permanent workers increased by 15.8 per cent and 16.7 per cent respectively. There is, thus, little basis to argue that casual workers account for all (or most) of the observed increase in mandays worked in the 80s, though their share in total employment has gone up.
We examine the trends in earnings per worker and earnings per manday, although the latter as a proxy for the wage rate ignores additional remuneration due to plausible intensification of the working day. While earnings per worker in registered manufac- turing increased at 3.2 per cent in the decade beginning 1979-80, earnings per manday increased at only 1.6 per cent per annum, whiclh is less than the corresponding real per capita GDP (hereafter per capita income) growth rate during the same period (2.7 per
cent) (Table 2). At a disaggregated level, growth in earnings per manday ranges from (-)1.3 per cent in leather (NIC 29) to 3.7 per cent per annum in repair services (NIC 97), with no statistically valid trend for (i) beverages, (ii) cotton textiles, and (iii) wool and synthetic fibre textiles (NIC 22, 23 and 24).
A comparison of the trends by use-based industrial classification for the same period suggests that in consumer non-durable goods industries, accounting for nearly half the registered manufacturing employment, while earnings per worker increased at 3 pet cent, earnings per manday rose by a mere 0.5 per cent per annum, which is less than one-third the average for registered manu- facturing (1.6 percent). The observed diver- gence between the two measures of wages in
these industries seems to be consistent with the decline in employment at the rate of 1.6 per cent and the growth in mandays per worker 2.3 per cent per annum; correspond- ing figures for registered manufacturing are (-)0.5 per cent and 1.5 per cent per annum respectively.
Ahluwalia, as noted earlier, observed that inverse movement between employment and wage rate in these industries was associated with an above average increase in capital- labour ratio. The foregoing evidence, how- ever, suggests that while arnings perworker undoubtedly went up in the 80s, it was mainly on account of an above average increase in the number of days worked per worker. The rise in earnings per manday in consumer non-durable goods industries, as shown above, is considerably lower (0.5 per
TABLE 1: TRENDS IN EMPLoYMIENT AND EARNINGS IN REGISTERED MANUFACrURING, 1973-74 TO 1988-89
Industry Group Employment Growth in Earnings Per Worker Share of Employment
1973-74 to 1980-81 to 1973-74 to 1980-81 to 1979-80 1988-89 1979-80 1988-89
Notes: (1) * Indicates statistical significance of the estimated coefficient at 90 per cent confidence level and above.
(2) Employment growth rate for registered manufacturing is for the nino-year period since 1980-81 as the same forthe period since 1979-80 is statistically significant at 80 percent confidence level.
Source: ASI Suaninaty Results of Factory Sector, various issuies.
178 Economic and Political Weekly January 22, 1994
cent per annum) than the average for regis- tered manufacturing (1.6percentperannum). If these findings are valid, then they notonly question Ahliuwalia's evidence of increase in the wage rate but also perhaps the postu- lated associations between the wage rate, capital-labour ratio and the decline in em- ployment.
Though these findings seem interesting, they remain partial since earnings per manday is not the same as wage rate due to a possible intensification of the working day. We examine Occupational Wage Sur- veys9 (OWS) which take into account the distinction between the wage rate per worker per day (hereafter wage rate)'0 and earnings per worker per day (hereafter earnings)." As these surveys have been conducted four times since 1958-59, using consistent defi- nitions and methodology covering almost the entire registered manufacturing sector, they could be useful to discern the long-term movements in wages, disaggregated by in- duistries. Our preliminary attempt, however, ignores the variation in wage rate and earnings on account of education, skill and experience, though considerable scope seems to exist to do a more detailed exer- cise. Moreover, the figures reported here are simple averages of the minimum and maximum wage rate/earnings reported in OWS.
Fourteen industries for which data are available for all the rounds since 1958-59 accouA.t for about 40 per cent of registered manufacturing employment. In seven in- dustries-accounting for about a quarter of registered manufacturing employment in 1980-81-the compound growth of wage rate between 1958-59 and 1986-87 is lower than the corresponding per capita income growth of 1 .3percentper annum (Table 3)12 In one industry, namely, bicycle manufac- turing, the wagerate has, in fact, declined by 7 per cent in 1986-87 compared to 1958-59. In the remaining industries, wage rates have grown in the range of 1.3 per cent (ship building) to 2.9 per cent per annum (electri- cal machinery). The tentative inference from these long-term trends is that while the wage rates across industries under consideration have not remained constant, increases in them do not appear to be disproportionately large compared to per capita income growth in the same periodl. This result, consistent with the foregoing evidence on the trends in earnings per manday in the 80s for regis- tered manufacturing based on ASI data, seems to provide a basis to question Ahluwalia's and the World Bank's finding of a disproportionate increase in the wage rate.
It is, however, interesting to discover from the same table that between the Tlird and the Fourth Round of the OWS (between 1975-76 and 1986-87) in almost all the 17 industries for which data are available, earnl-
ings increased much faster than the wage rate.13 While the increase in the wage rate is in the range of (-)O. 1 per cent (iron and steel) to 5 per cent (prime movers) per annum, earnings has went up between 1.3 per cent (garments) and nearly 7.9 per cent (electrical machinery) per annum.14 If it is conceded that the definition of the wage rate (by Ahluwalia) and wages (by the World Bank) represent earnings per worker, then these diverging trends seem to suggest that much of the reported in- crease in the wage rate or wages noted by them, represents additional remuneration for workers' extra effort-which is likely to get reflected in higher labour productivity (Figure 10)-and perhaps not a substantial increase in the wage rate for the standard working day.
To recapitulate: wage rate according to the OWS and earnings per manday as per ASI data have not gone up disproportion- ately as has been suggested by the studies quoted earlier. The wage rate over a long period in half the number of industries for which data are available (OWS) and earn- ings per manday for registered manufactur- ing in general and consumer non-durable goods industries in particular in the 80s (ASI) has not kept pace with growth of per capita income. However, earnings per-worker increased faster than per capita income in registered manufacturing as well as in con- sumer non-durable goods industries since workers have evidently worked a larger numberof days. Although, analytically, more intensive work could also account for a part of the discernible growth in earnings per worker, we have no basis to test the propo- sitioln.'
II Strength of Organised
Working Class
The increase in the wage rate that is presumed to have taken place is seen as an evidence of the growing rigidities in the labour market-namely, minimum wage
TABLE 4: CORRELATION COEFICIENTS BEWEEN
GROWTH RATES oF EMPLOYMENT, EARNINGS PER
WORKER AND 'CAPITAL-LABOUR RATO
Simple Correlation Coefficient between
Growth Rates of Earnings/ Capital-
Worker and Labour Capital- Ratio and Labour Employ- Ratio ment
1 Trend growth rate during 1973-74 and 1986-87 0.142 (-) 0.362 *
2 (i) Percentage change in sub-period I 0.479 * (-) 0.215
(ii) Percentage change in sub-period II 0.014 0.001
3 (i) Average of annual growth rates in sub-period I 0.193 (-) 0.108
(ii) Average of annual growth rates in sub-period II 0.436 * 0.348 *
Notes: (i) Sub-period I: 1973-74 and 1979-80; and sub-period II: 1980-81 and 1986-87. (ii) Correlation coefficients are computed for growth rates across 42 ,hree-digit industry groups. (iii) * Refers to statistically significant at 90 per cent level and above.
Source: ASI Summary Results of Factory Sector, various issues.
TABLE 3: TRENDS IN WAGE RATE AND EARNINGS IN SELECrED MANUFACrURING INDUSTRIES
Industry Compound Growth Rate Wage Rate between I Between III and IV OWS and IV Round OWS Wage Rate Earnings
Notes: (i) I Round: 1958-59, ll Round: 1%3-66, III Round 1974-75, IV Round 1986-88. (ii) Consumer price indices for industrial workers for all India are used. In order to reduce
yearly fluctuations,wehaveused three-year a*verages around the yearof surveyto deflate the money wage rate and earnings.
Source: Occutpatiotial Wage Survey, various reports.
Economic and Political Weekly January 22, 1994 179
FIGURE 1: TRENDS IN EMPtoYMrNT, EARNINGS AND VALUE ADDED IN
REGISTERED MANUFACrURING,1973-74 TO 1988-89
1 Index of log values 115
105
100
95 74 77 80 83 86 89
Fiscal year ending
- Number of workers - Earnings/worker
... Net value added
Source: ASI Summary Results
FIGURE 2: NUMBER OF WORKERS EMPLOYED AND MANDAYS WORKED IN REGISTERED MANU,FACTURING, 1979-80 TO 1988-89
Index of log values
100.9
100.7
100.5 /
100.3 -
100.1
99.9
99.7
99.5 X I e ' I I I
80 82 84 86 88
Fiscal year ending
- Number of workers -Number of mandays
Souirce: ASI Summary Results
legislation (growing) strength of trade unions and increasingly stringent job security laws-as reflected in the power of organised labour to appropriate a share of output dis- proportionate to their contribution, at the expense of additional employment genera- tion and with a socially undesirable rise in capital intensity. Robert E B Lucas, for instance, showing an increase in the abso- lute number of mandays lost in industrial disputes in the organised sector as a wlole, argued: "... it is clear that the comparative power of unions in pressing for wage settle- ments has grown substantially and the inci- dence of strikes has consequently risen as reflected in the number of mandays lost in strikes and lock-outs ..." [Lucas 1988: 189]; he reiterates this view in amore recent study as well [Fallon and Lucas 1,993].
Lucas' measure seems incorrect for three reasons. One, the absolute number of mandays lost in industrial disputes has little meaning when the number of mandays worked has also grown. Two, as industrial disputes could be due to either strikes or lock-outs-which he evidently recognises- an increase in the total number of mandays lost does not necessarily imply an increase in the proportion of strikes. Three, his data refer to the organised sector of the economy and not to the registered manufacturing industries which he has examined; the latter is a subset of the former.
Following Lucas in examining the trends in union power as a proxy for thd alleged rigidities, our evidence questions hlis con- tention.'6 In his measure of mandays lost in
disputes in registered manufacturing, when normalised for mandays worked, no statis- tically valid trend is discernible during the two decades beginning 1970-71. There are only fluctuations in the range of 0a7 per cent to about 2.3 per cent of the number of mandays worked (Figure 3). Union den- sity-the proportion of workers unionised in registered manufacturing-fell from around 45 per cent in the late 70s to around 30 per cent towards the end of the 80s (Figure 4).17 The proportion of strikes in,the total number of mandays lost in the dis- putes, ignoring the sharp dip during the 'emergency', has also steadily declined to less than half in the latter half of the 80s. ThIis implies that in the recent years a greater share of industrial disputes has been on account of lock-outs by employers and not because of strikes (Figure 5).18 Finally, de- clining share of mandays lost due to strikes in the total is discernible in a period when the total number of workers involved in industrial disputes has dropped from 38 per cent in 1973-74 to less than 10 per cent in 1988-89 (Figure 6).19
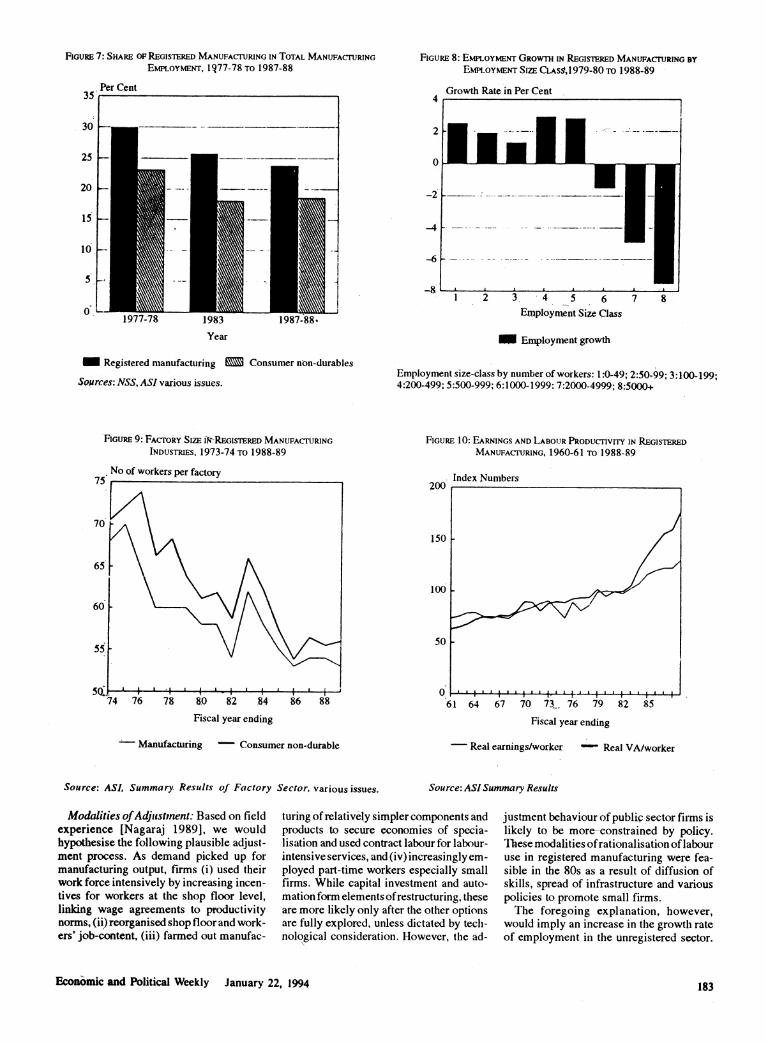
The decline in the strength of unionised labour is accompanied by changes in the structure of employment as well.20 The share of registered sector in total manufacturing employment fell from around 30 per cent in 1977-78 to about 23 per cent a decade later (Figure 7). Moreover, within the factory sector, employment growth is positive in factories employing less than 1,000 work- ers; and a statistically significant negative correlation exists-withl Rt2 of 0.66-be-
tween the size class of factories and employ- ment growth between 1979-80 and 1988-89 (Figure 8).21 Since the average wage rate is lower in smaller sized factories and the likelihood of power of unions is also lower, a priori one could argue that these structural changes would have further contributed to- wards reducing policy-induced rigidities in the labour markets and exerting downward pressure on wage rate and earnings within the registered manufacturing sector.
Arguably, these changes reflect the re- sponse of firms to the labour market rigidi- ties. While there could be some validity in such a view, it would perhaps be incorrect to attribute the structural changes mainly or entirely to the behaviour of the labour mar- ket, as there could be a number of other reasons. These changes seem to form part of the long-term tendencies in the size struc- ture of manufacturing to correct for the historical bias in favourof large sized plants in India [Nagaraj 1985]. This could also reflect the outcome of various policies to promote small-scale manufacturing and in- stitutional changes in financing industrial development. Moreover, diffusion of skills, entrepreneurship and technologies could also have favoured modern small- and medium- scale firms.
The foregoing evidence unambiguously shows a decline in' the strength of the organised labour. Hence, it seems reason- able to suggest that, in a period of declining bargaining power of organised workers and structural changes in employment within registered sector towards smaller sized es-
180 Economic and Political Weekly January 22, 1994
FIGURE 3: NUMBER OF MANDAYS LosT IN INDUSTRY DISPUmES AS PER CENT OF NUMBER OF MANDAYS WORKED, 1973-74 TO 1988-89
Per Cent
2
1.5 / \ I
0.5
74 07 80 83 86 89
Fiscal year ending
- Number of mandays lost
Source: Indian Labour Yearbook, various issues
FIGURE 4: UNION DENSrry: PERCENTAGE OF WORKERS UNIONISED IN REGISTERED MANTFACRTRING, 1973-74 TO 1987-88
Per Cent
45 F
40
35
3Q-
25, 1 74 77 80 83 86
Fiscal year ending
- Per cent of workers
Source: Indian Labour Yearbook, various issues
tablishments, unionised labour is unlikely to have secured Xt disproportionate increase in the wage rate, especially at a time when the share of registered manufacturing em- ployment in the total is itself declining.
Whileregistered manufacturing accounted for about 30 per cent of total manufacturing employment in 1977-78, for consumer non- durable goods industries it was only about 24 per cent (Figure 7). Moreover, the aver- age size of a factory in these industries declined from around 70 workers in 1973- 74 to less than 55 workers per factory in 1988-89, as in registered manufacturing (Figure 9). Since employment in consumer non-durable goods industries is predomi- nantly in the unregistered sector and since within the registered sector their average factory size has declined considerably, it is quite unlikely, contrary to what Ahluwalia has suggested, that organised workers in these industries could have succeeded in secuing notable increases in the wage rate.
This is not to deny that organised workers do not command any bargaining power in the labour market. They perhaps do in large firms, in the public sector and in some locations. But at an aggregated level, the foregoing evidence seems to question the proposition of growing rigidities in non- agricultural labour markets.
HI Testing the Hypothesis
The 'idence adduced by Ahluwalia, the Wor and Lucas on the postula- ted re1 tionshipbetween the wage rate, capi-
tal-labour ratio and employment seems to have an analytical shortcoming. They have shown trends in the wages/wage rate and the rigidities in the labour market without considering the changes in the cost of capital. Analytically, what matters in the choice of technique is not the wage rate per se but the wage-rental ratio. Perhaps these studies implicitly as- sume the cost of capital to have remained constant. Admittedly, its measurement is fraught with numerous conceptual and empirical problems. The simple and widely used measure is real interest rates, which increased steeply in the 80s, even igno- ring the spikes in the series (Figure 11).22 Therefore there is a need to qualify the findings of Ahluwalia and others in this respect.
This section re-examines the postulated associations between increase in earnings per worker, increase in capital intensity (capital-labour ratio), and a decline in em- ployment'growth in registered manufactur- ing. The cost of capital is not included to minimise computational difficulties. Simple correlations across 42 three-digit industries for the period 1973-74 and 1986-87 are calculated between the growth rates of: (i) earnings per worker and capital inten- sity; and (ii) capital intensity and employ- ment.23 Three variants of associations are explored: (i) growth over the entire period of 14 years; (ii) increase in sub-period I (1973-74 and 1979-80) and in sub-period II (1980-81 and 1986-87); and (iii) average of the annual growth rates in sub-period I and average of annual growtlh rates in sub-
period II, thus obtaining five sets of cor- relatiorls.24
Evidence suggests that although the re- sults are partially consistent with the hy- pothesis, in none of the variants does one find consistent and statistically significant results with the expected sign for the coeffi- cients (Table 4). For instance, in variant I- that is over the entire period-while the correlation between the growth tates of capi- tal-labour ratio and employment is statisti- cally significant with the expected negative sign, the correlation between the growth rates of earnings per worker and the capital labour ratio is not statistically different from zero. Similarly, in variant Ill-that is, aver- age of annual growth rates in sub-period II- while the correlation coefficient between the growth rates of earnings per worker and the capital-labour ratio is statistically sig- nificant with the expected negative sign, the correlation between the growth rates of capi- tal-labour ratio and employment is positive and statistically significant, which is ir<con- sistent with the hypothesis.
We have also computed the above-men- tioned correlations separately for the time series data of 42 industries. To minimise autocorrelation problems the first differ- ences in each series are correlated. The findings shows that in only nine out of 42 industries the postulated relationship is sta- tistically valid with the expected sign for the estimated coefficients. These results, there- fore, seem to suggest that the relationship between earnings per worker, capital inten- sity and employment is more complex'than postulated by the hypothesis. Moreover, if
Economic and Political Weekly January 22, 1994 181
FIGURE 5: SHARE OF STRIIES IN TOTAL NUMBER MANDAYS LOST IN INDUSTRES DIsPUTEs, 1970-71 TO 1988-89
Per Cent
80
40! - t
20.-
71 74 77 80 83 86 89
Fiscal year ending
- Share of strikes
- Source: Indian Labour Yearbook, various issues
FIGURE 6: PERCENTAGE OF WORKERS INVOLVED IN INDUSTRIES DIOSnu, 1973-74To 1988-89
Per Cent 40
35
30~
251 /
5.
'74 77 80 83 86 89
Fiscal year ending
- Per cent of workers
Sources: Irndian Labour Yearbook, ASI Summary Results, various issues.
we accept that real interest rate has gone up during the period it would furtlher dilute the strength of the observed associations be- tween the three variables.
IV Towards an Alternative
Explanation
The causal connection between the wage rate, capital intensity and employment is, admittedly, an equilibrium condition. In a labour surplus dual economy, evolved un- der certain institutional conditions and wit- nessing an upturn in growth after a pro- longed period of 'relative stagnation', the observed decline in employment could have multiple causes, not necessarily originating in the reported increase in wage rate."5 In an attempt at exploring an alternative explana- tion, without offering an analytical model, we propose to identify a set of factors which could have influenced employment.
Changing Composition of Output: Part of the explanation for the decline in the 80s seems to lie in the changing composition of output in favour of\less labour intensive industries. Fo, instatce, industry groups food products (20-21), rubber, plastic, pe- troleum and coal products (30), chemical and chemical products (31), non-metallic mineral products (32), and electrical ma- chinery (36) witnessed above average growth in value added but have a below average share of wages in value added. The correla- tion between (i) growth rate in real gross value added and share of wages in gross
value added across 19 two-digit industry groups, for the period 1980-81 to 1988-89, is (-)0.51 and statistically significant. The relatively faster growth rate of these indus- tries, especially chemical and petroleum- based industries perhaps reflects conscious efforts to import substitute these products in response to the oil price hikes in the 70s and the exploitation of newly discovered min- eral oil deposits to reduce adverle effects of external economic shocks; and perhaps less driven by the evolution of relative prices.
Overhang of Einployment: The upturn in output growth (and the corresponding nega- tive growth rate in employment) in manu- facturing in the 80s, as is well known, was witnessed after a prolonged period of rela- tive stagnation since the mid-60s when employment growth was sustained at over 3 per cent per annum despite adeceleration in output growth, resulting in a narrowing of the gap between the growth of earnings per worker and labour productivity. More spe- cifically, during the seven-year period since 1968-69 while net value added grew at 2.6 percent per annum, employmentkept grow- ing at 3.9 per cent per annum; hence, labour productivity was increasing at a lower rate than earnings per worker, resulting in an unsustainable situation in the long run (Figure 10).
Intuitively, one could argue that when demand picked up in the 80s firms would have first used theirlexisting stock of labour (as well as capital) intensively before decid- ing to employ additional workers. This could perhaps partly account for the lack of em-
ployment growth in registered manufactur- ing, despite an upturn in output growth.
Changing Market Conditions: Analyti- cally, changes in the product and financial markets are likely to affect the demand for labour. Studying the interdependence be- tween market structure and technology, Desai (1985) suggested an increase in com- petition during the period 1963-64 to 1978- 79.26 Considering that liberalisation was initiated in the 80s one could hypothesise that industrial markets have become more competitive exerting firms to reduce costs. We, however, do not have any evidence to support the proposition.
In response to the public sector's growing borrowing requirement on the one hand and the policy directive of priority sector lend- ing on the other, the cost of credit for the private (non-agricultural) sector seems to have increased significantly in the 80s. F,i,gure 11 shows a steady increase in interest cost as a proportion of total income in medium and large public limited companies and the trend seems to be positively associ- ated with an increase in the real interest rate in the 80s.27
A priori, one would expect an increase in the cost of capital in a period of increasing competition to result in substitution of labour forcapital and hence an increase in employ- ment. However, given thedifferential wage- rental ratios in theregistered and unregistered sectors, firms would perhaps have found it profitable to shift the production to unregistered sector adversely affecting em- ployment in the former.
182 Economic and Political Weekly January 22, 1994
FIGURE 7: SHARE OF REGISTERED MANUFACTURING IN TOTAL MANUFACTURING EMPLOYMENT, 1J77-78 TO 1987-88
Per Cent 35
30 _ _ _
25 - - _ _
20
15 -
10
1977-78 1983 1987-88.
Year
Registered manufacturing M Consumer non-durables
Sources: NSS, ASI various issues.
FIGURE 9: FACTORY SIZE I*REGISTERED MANUFACTURING
INDUSTRIES, 1973-74 TO 1988-89
No of workers per factory
75 /
70
65
60
5SJ. ' i - 74 76 78 8.0 82 84 86 88
Fiscal year ending
Manufacturing - Consumer non-durable
Source: ASI, Summary. Results of Factory Sector, various issues.
FIGURE 8: ENpLOYImENT GROWTH IN REGISTERED MANUFACTURING BY EMPLoYMENT SIzE CLAS9,1979-80 TO 1988-89
Growth Rate in Per Cent 4
-2__ _ - -
-4
1 2 5 6 7 8 Employment Size Class
- Employment growth
Employment size-class by number of workers: 1:0-49; 2:50-99; 3:100-199; 4:200-499; 5:500-999; 6:1000-1999: 7:2000-4999; 8:5000+
FIGURE 10: EARNINGS AND LABOUJR PRODUCTIVITY IN REGISTERED MANUFACTURING, 1960-61 TO 1988-89
Index Numbers 200
150
100
50
0 _
61 64 67 70 73_, 76 79 82 85
Fiscal year ending
Real earnings/worker Real VA/worker
Source: ASI Summary Results
Modalities of Adjtstinent: Based on field experience [Nagaraj 1989], we would hypothesise the following plausible adjust- ment process. As demand picked up for manufacturing output, firms (i) used their work force intensively by increasing incen- tives for workers at the shop floor level, linking wage agreements to productivity norms, (ii) reorganised shop floor and work- ers' job-content, (iii) farmed out manufac-
turing of relatively simpler components and products to secure economies of specia- lisation and used contract labour for labour- intensive services, and (iv) increasingly em- ployed part-time workers especially small firms. While capital investment and auto- mation form elements of restructuring, these are more likely only after the other options are fully explored, unless dictated by tech- nological considerationi. However, the ad-
justment behaviour of publip sector firms is likely to be more-constrained by policy. These modalities of rationalisation of labour use in registered manufacturing were fea- sible in the 80s as a result of diffusion of skills, spread of infrastructure and various policies to promote small firms.
The foregoing explanation, however, would imply an increase in the growth rate of employment in the unregistered sector.
Economic and Political Weekly January 22, 1994 183
FIGURE 1 1: SHARE OF INTEREST COST IN COST OF PRODUCTION AND REAL INTEREST RATE,
1960-61 TO 1988-89
Per Cent Per Cent
55, -- / -.
4.5-1 01 120
3.5.K t4
110 1 J I
61 64 67' 70 13 7q 71 82, 85 88
Fiscal year ending
- Interest cost +- Realinterestrates
Sources: RBI Bulletin, National Accounts Statistics, various issues.
Since employment growth in unregistered manufacturing has also declined [Planning Commission 1990], one is inclined to fur- ther hypothesise that in the non-factory sec- tor there is a muclh more intensive use of labour for longer hours and in a flexible manner. Moreover, there appears to be an increasing trend Qf workers taking up more than onejob, especially among skilled work- ers, which could further restrict employ- ment generation.
CONCLUSION
A reportedly sharp rise in the wage rate in the 80s in registered manufacturing-due to increasing policy-induced distortions in the labour market-is widely hypotbesised to have led firms to s ubstitute capi ta 1 for labour, resulting in tbeobserved decline in employ- ment. Consciously avoiding getting into the theoretical debate on the causal relationship between the labour market and economic growth, this study provided evidence to suggest that the wage rate (using OWS) and earnings per manday (using ASI) did not increase disproportionately as has been ar- gued. However, earnings per worker in- creased at a faster rate than per capita in- come growth mainly due to an increase in the number of mandays per worker. Our findings also suggest a distinct decli ne in the power of organised labour, used as a proxy for the reported rigidities in the labour mar- ket. Moreover, structural changes are dis- cernible in enmployment in manufacturing industries in favour of the unregistered sec-
tor and within registered manufacturing to- wards smaller sized factories. These long- term tendencies would have further under- mined the power of the organised working class to induce flexible use of labour. Fi- nally, not much of a systematic relationship could be discerned in the postulated rela- tionship between earnings per worker, the capital-labour ratio and employment at a disaggregated level.
Exploring an alternative explanation, it was argued that (i) mainly in response to the macro-economic compulsions of the 70s and the discovery of appropriate natural resources, the composition ofoutputchanged in favour of less labour intensive industries, (ii) there was a overhang of employment that had built up during the prolonged period of relative stagnation in the 70s, and, (iii) increasing competition in the product market due to domestic liberali- sation and increase in the cost of borrow- ed funds could account for the decline in employment in registered manufacturing in the 80s. It was further hypothesised that there was (a) a restriction on fresh employment in large factories so as to use the existing work force more intensively, (b) shop-floor reorganisation and changes in workers' job-content, (c) contracting out of (mostly unskilled) labour-intensive ser- vices and farming out of production, and (iv) an increasing use of part-time workers in small firms permitting flexible use of labour.
Finally, if evidence and arguments out- lined above have any validity, they seem to
suggest the limitation of the orthodox view in explaining the labour market behaviour and hence question the policy implications that follow from such a view.28
Notes
[Following the usual disclaimers, I gratefully acknowledge the valuable comments received from Subir Gokam, Ashima Goyal, Shikha Jha, Sunil Mani, Manoj Panda, Kirit Parikh, V K Ramachandran, K V Ramaswamy, C Ram ManoharReddy,M HSuryanarayana, Bagaram Tulpule, and the two referees within the insti- tute fortheir comments on an earlier draft of the paper. Suresh D Tendulkar's 'unsolicited' res- ponse to my draft paper was particularly help- ful, for which I am deeply indebted to him.]
1 Unless otherwise stated, growth rates re- ported in this study are computed using log- linear trend equation.
2 Visaria and Minhas (1990) question the Planning Commission's findings since in three out of the fouryears in which the NSS data were collected happen to be 'bad' rainfall years and hence the employment in these years could have been affected ad- versely. However, such a problem is likely to be unimportant for manufacturing sector since: (i) output witnessed sustained growth with very little yearly fluctuation, and (ii) bad agricultural harvest is found to affect manufacturing output with one year lag.
3 Recently published official'DiscussionPa- per' on economic reforms echoes the fore- going views: "... we must reviewand reform the current legislations foremployment and industrial disputes to ensure that excessive rigidities are removed andlong-term growth facilitated. The operation of the current Industrial Disputes Act (in particular, the requirement for prior approval by govern- ment for closure of sick units and retrench- ment of labour) needs to be reviewed as it affects incentive forinvestment andas well as increased employment....Rigid nrles lim- iting the flexibility with which labour can be hired and retrenched have the effect of pushing entrepreneurs iito more capital- intensive technology and reduce the num- ber of workers thay have to deal with" [Government of India 1993: 34].
4 It is perhaps pertinent to cite South Korean example in this context. Despite strict laws prohibiting trade union activity, real wage rate in that country increased at a trend growth rate of S per cent per annum over a long period. Amsden (1990) attributes it to intensive learning, education and skill of the Korean workers.
5 "Wages are defined to include all remu- neration capable ofbeing expressedin mon- etary terms and also payable more or less regularly in each pay period to workers as compensation for work done during the accounting year. It includes (a)direct wages and salary (i e, basic wages, salaries, pay- ment of overtime, dearness compensatory, house rent and otherallowances), (b) remu-
184 Economic and Political Weekly January 22, 1994
neration for period not worked, (c) bonus and ex-gratia payment paid both at regular and less frequent intervals..." (ASI, 1988- 89: Suimnary Results of Factory Sector, p78).
6 For conceptual clarity, Maurice Dobb's distinction seems instructive in this con- text: "When we speak of a wage rate, we usually refer to the amount paid to the worker per hour per normal working day or for performing acertainjob. In otherwords, we are speaking about what the worker receives in return fora given output of work on his part. ...When we talk about the stan- dard of life of the worker and his family, we are concerned with the total earnings of the family-unit.... We cannot juidge what is happening to theformer [wage rate] solely from the figures about the latter [earn- ings]; and fora number of reasons these two quantities may change quite defferently" [Dobb 1959: 27; emphasis added].
7 Due to possible changes in the definition and methodology, data on mandays priorto 1979-80are not comparable with the subse- quent years.
8 Census sector of ASI includes all factories employing 50 or more workers with power and 100 or more workers without power.
9 Labour Bureau, Government of India in order to obtain "accurate and up-to-date wage statistics" [Indian Labour Year Book 1992:45] has pcriodically conducted Oc- cuspational Wage Surveys. The four rounds have been conducted so far in 1958-59, 1963-65,1974-79 and 1985-88. The cover- age has steadily increased over the successive rounds; from 44 plantation, mining and manufacturing industries in the first round to 53 in the fourtb. These surveys include firms in the organisedsectoroftheseindus- tries covered under the relevant acts. Com- plete results of the fourth roundare awaited.
10 To quote OWS: "Wage rate shouldinclude basic wage rate, cost of living allowance and other guaranteed and regularly paid allowances, but exclusive of overtime pay- ment, bonuses, gratuities, family allowance andothersocial security payments made by employers."
'.!FDorthe purpose of this survey, wage rate has been defined as the sum of basic wage and dearness allowance in respect of work- ers who receive both these components while for other workers the actual consoli- dated amount earnings represent their wage rate" [Occupational Wage Survey (Fourth Round), ReporlonTextile Industries (1986- 87), Labour Bureau 1989: 46].
11 "For the purpose of this survey, pay roll earnings have been defined as all those components of remuneration received by workers more or less on regular basis. Thus basic wage, DA, production and incentive bonus, attendance bonus, overtime allow- ance, shift allowance, cycle/transport al- lowance, washing allowance, etc, are in- cluded in the data on pay roll earnings. ney also include money value of benefits/con- cessions accruing to workiers on more or less regular basis". [Occupationlal Wag,e
Suirvey (Fourth Round), Report on Textile lrtdu.stries (1986-87), Labour Bureau 1989: 106].
12 These are cotton textiles, woollen textiles, silk textiles, garments, bicycle, agricultural machinery and textile machinery.
13 As the coverage has expanded in succes- sive rounds of OWS, a comparison of more recent rounds enablesone toinclude greater number of industriqs.
14 The observed increases in wage rate and earnings perhaps get overstated due to a conceivable reduction in them during the emergency. A close perusal of the data confinns the suspicion.
15 Robin Marris observed a similar variation between wage rate and earnings for the UK manufacturing industries in the 80s, by comparing the official earnings enquiry with employers' associations' statistical series on 'settlements' which relates to "agreedincreases inbasic ratesforstandard work under standard conditions" [Marris 1987: 48].
16 Though these are official figures and are the only source to discern the long-term trends, their quality, according to some union analysts, leaves much to be desired. It is believed that trade unions often do, not file returns on time, especially the smaller ones and firm-based independent unions.
17 However, at a disaggregated level, trend decline in union density is statistically sig- nificantin only eight out of l8 majorindus- try groups and in only one industry, namely, cotton textiles (NIC 23) the trend is positive and statistically significant. In the remain- ing cases, due to considerable yearly fluc- tuation in union membership, the trends are not statistically significant, though have the expected negative sign.
18 Although thisis awidelyused,and is a valid simplification at an aggregate level, we are conscious that, at a micro-economic level lock out by management may well repre- sent a pre-emptive measure to prevent a strike by workers or vice versa.
19 Even this figure is perhaps an overestimate since it is not uncommon for workers to be members of more than one union.
20 That registered manufacturing constitutes a small and declining proportion of the total manufacturing employment is not ad- equately appreciatedby many.Forinstance, the World Bank (1989), unable to reconcile the employment figures from the ASI and the population census seems to inferthat the latter are an overestimate.
21 Information on employment by size class of factories is available only for factory sector. Since manufacturing accounts for over four-fifths of the factory employmnent, our finding is unlikely not incorrect.
22 Though widely used, real interest rate as a measure of the cost of capital has many limitations, since it ignores tax rate and depreciation rules. We estimated trends in the cost of capital for the RBI' s medium and large non-financial public limited compa- nies using the equation: (DID + E) (1 - t) r + (did + E) (return on equity), where D is
debt, Eequity capital, t tax rate and rinterest rate. A few variants were tried using dif- ferent measures of return on equity. In all the cases the cost of capital is found to have increased on a trend basis since 1970- 71. I am grateful to Subir Gokam for en-- lightening me a great deal on the analytical and empirical issues in computing cost of capital.
23 In this exercise, the critical data are esti- mates of capital sto4k series, which we have taken from Aggarwal (1991). Since the 42 three-digit industries account for 72 to 75 per cent of net value added at current prices in the entire period, our exercise can be considered reasonably comprehensive.
24 We computed averages for the years 1973- 74/1974-75, 1978-79/1979-80 and 1985- 86/1986-87 and the increments for each industry. These series were used for com- puting correlations, as mentioned in the text.
25 Mazumdar (1989), for instante, is con- scious of the complexity of the labour mar- ket behaviourin developing economies and seems to argue for a closer study of indi- vidual economies before arriving at sim- plistic generalisations.
26 To quote Desai: "Many industrial markets in India are competitive and accommodate a large number of firms... Rather than a tendency for monopoly, the market struc- tures display a tendency towards intense competition..." [Desai 1985:168].
27 Real interest rate is equal to [(1+interest rate)/(1+inflation rate)]. We have used scheduled commercial banks' deposit rate for one year and above maturity and infla- tion rate is derived from implicit GDP defla- tor.
28 Freeman's (1993a and 1993b) assessment of the evidence on the validity of the 'distortionists' and 'interventionists' views on the labour market, against the back- ground of structural adjustment in a large number of developing countries, seems in- structive:
In the 80s many economists came to view institutional interventions in the labour market as major impediments to growth and employment... Concerns were ex- pressed that these and related interven- tions would prevent labour market ad- justments necessary for stabilisation and structural adjustment. For the subset of countries that have been studied intensely, the evidence dispels fears that government or union interven- tions invariably impede labour-market adjustments... In short when you arrive in developia and find the economy a mess, don't look to government or union labour-market in-. tervention as the prime cause of the trouble [Freeman 1993b: 404-051.
References Aggarwal, Ashok K (1991): Estimnates of Fixed
Capital Stock in Registered Manufacturing Sector in India, W P No 937, Indian Insti- tute of Management Ahmedabad.
Economic and PHitical Weekly January 22, 1994 18S
Ahluwalia, Isher Judge (1992): Productivity anid Growth in Inidian Manufactu'ring, Ox- ford University Press, Delhli.
Amsden, Alice (1990): 'South Korea's Record Wage Rates: Labour in Late Industrialisation', Industrial Relations, Vol 29, Nol, Winter.
Desai, Ashok (1985): 'Market Structure and Technology: TheirInterdependence in In- dian Industry', Research Policy, Vol 14.
Dobb, Maurice (1959): Wages, Cambridge Economic\Handbooks, Cambridge Uni- versity Press.
Fallon, PeterRand Lucas, Robert E B (1993): 'Job Security Regulations and the Dy- namic Demand for Industrial Labour in India and Zimbabwe', Journal of Devel- optne~t Ecotnomnics, Vol 40.
Freeman, Richard B (1988): 'Labour Market Institutions and Economic Performance', Ecotnomic Policy, Vol 3, No 1, April.
-(1993a): 'Labour Market Institutions and Policies: Help or Hindrance to Economic Development?', Annual Conference on Development Economics, 1992, Supple- ment to the World Banik Research Ob- server, March.
-(1993b): 'Labour Markets and Institutions in Economic Development', American Economic Review, Volume 83, No 2, May.
Government of India (1993): Econtomic Re- forms: Two YearsAfterand the TaskAhead, Department of Economic Affairs, Minis- try of Finance.
Lucas, Robert E B (1988): 'India's Industrial Policy' in Robert E B Lucas and Gustav F Papanek (eds), The Indiani Economty: Re- cent Developmetnt atnd Futitfre Prospects, Oxford University Press, Delhi
Marris, Robin (1987): 'Does Britain Really Have a Wage Problem?', LlYods Banik Review, April.
Mazumdar, Dipak (1989): Micro-economic Issues of Labouir Markets in Developing Countries: Analysis antd Policy hnmplica- tions, EDI Seminar Paper No 40, World Bank, Washington DC.
Nagaraj, R (1985): 'Trends in Factory Size in Indian Industry, 1950 to 1980', Eco- nomic and Political Weekly, Review of Management, February.
-(1989): Sub-Conttracting in Indian Manu- factuiring Industries: The Banigalore Ex- perience, PhD Thesis (Centre for Devel- opment Studies, Trivandrum), Jawaharlal Nehru University, New Delhi.
Planning Commission (1990): Emiployment: Past Tretds and Prospects for 1990s, Working Paper, New Delhi.
Taylor, Lance (1988): Varieties of Stabilisation Experienice: Towards Sen- sible Macro-economics in the T7h ird World. Clarendon Press, Oxfordl.
Visaria, Pravin and Minhas B S (1991): 'Evolv- ing an Emlployment Policy for the 1 990s: What Do the Data Tell Us?', Ecottomic and Political Weekly, April 13.
World Bank (1989): Imidia: Poverty, Employ- ment amid Social Services, Washington DC.
RELEASES FROM-SEGMENT OOS
RURAL CREDI Role of Infrmna Soctr
by Dr. Dinesh Chandr
foreword by: Prf. A.M Khusro
ISBN: 81-85330.204 Price: Rs. 40.00
STRUC URAL ADJUSTMIENT PROGRAMME: Putting tle Faust Thing, fvry
-and Envionmat Last
An Analysis
by Prof. AMoTAVA MUKHERJEE
Profeor. of Plaoning & o s LB.S. Nadonal Acadn of Adminmstadon.
ISBN: 81-85330-21.-2 Price: Rs. 450.00
DEVELOPMENT CHALLENGES need for a new value system
by Padmanabhan
foreword by Prof. Hans. W Singer
ISBN: 81-85330-18-2 Price: Rs. 330.00
Please sand your orders to:
Segment Book Distributors B/23 & 25, Kailash Colony, New Delhi-1 10048
Phone: 644-3013 Fax No: 011-6470472
186 Economic and Political Weekly January 22, 1994