Senter for teknologi, innovasjon og kultur Universitetet i Oslo UNIVERSITY OF OSLO Centre for technology, innovation and culture P.O. BOX 1108 Blindern N-0317 OSLO Norway Eilert Sundts House, 7 th floor Moltke Moesvei 31 Phone: +47 22 84 16 00 Fax: +47 22 84 16 01 http://www.tik.uio.no [email protected]TIK TIK WORKING PAPERS on Innovation Studies No. 20100617 http://ideas.repec.org/s/tik/inowpp.html
Transcript
Senter for teknologi, innovasjon og kultur Universitetet i Oslo
INNOVATION STRATEGIES AS A SOURCE OF PERSISTENT INNOVATION
Tommy H. Clausen*,***, Mikko Pohjola**, Koson Sapprasert* and Bart Verspagen*,****
*Centre for Technology, Innovation and Culture (TIK), Norway
**Turku School of Economics, Finland (corresponding author, email: [email protected])
*** Nordland Research Institute, Norway
****Maastricht University, UNU-MERIT, the Netherlands
Abstract
An important topic in the recent literature on firms’ innovation is the question of whether,
and to what extent, firms which innovate once have a higher probability of innovating again
in subsequent periods. This phenomenon is called the ‘persistence of innovation’. Although
the literature has established that innovation persistence is indeed important from an
empirical point of view, relatively little attention has been paid to identifying the reasons why
this is the case. This study proposes that the differences in innovation strategies across firms
are an important driving force behind innovation persistence, and analyses this issue using a
panel database constructed from R&D and Community Innovation Surveys in Norway.
Empirical measures of various innovation strategies are identified by means of a factor
analysis. A cluster analysis is used in addition to a dynamic random effects probit model to
extend the methodology adopted by prior studies, for the purpose to not only examine
innovation persistence, but also determine how this persistence is influenced by innovation
strategies. The results support the idea that the differences in innovation strategies across
firms are an important determinant of the firms’ probability to repeatedly innovate. The study
also distinguishes the effects of strategy differences on the persistence of product and process
innovation in all firms, and within high-tech versus low-tech firms.
Keywords: Persistence of innovation, Firm heterogeneity, Innovation strategy, Panel data
1
1. Introduction
An important issue in the recent literature on firm-level innovation is whether, and to what
extent, firms which innovate once have a higher probability of innovating again in
subsequent periods. This phenomenon, which may be referred to as ‘innovation persistence’,
has been addressed by a number of empirical studies using Community Innovation Survey
(CIS) data (for example, Duguet and Monjon, 2004; Peters, 2009; Raymond et al., 2006), as
well as other types of data (mainly patents, for example, Geroski et al. 1997; Malerba and
Orsenigo 1999; Cefis 2003). Innovation persistence is usually specified in the econometric
sense by a model in which the probability of a firm innovating is explained by a variable
which measures whether or not the firm had innovated in a previous period (i.e. the lagged
dependent variable), as well as a number of control variables. If the lagged innovation
variable has a positive and significant sign, this is interpreted as persistence within the
context of innovation. This finding is supplied by many studies of innovation persistence.
The present study somewhat deviates from the existing literature on innovation persistence in
the sense that it is not primarily interested in the traditional question of whether or not, and to
what extent, innovation is persistent. Instead, this study strives to answer why some firms (do
not) persistently innovate. The variables which influence this, such as whether or not a firm
has an R&D department, or whether or not it maintains cooperative relationships for
innovation, are affected by the long-run strategic choices made by the firm (see, for example,
Nelson and Winter 1982; Teece et al. 1997). In this study, these factors are referred to as the
‘innovation strategy’ of the firm, and this notion will be operationalised below. To the
authors’ knowledge, none of the prior studies in the “innovation persistence” tradition has
explicitly analysed the strategic factors behind innovation persistence at the firm level.
Therefore, the question pursued by the present study is to what extent do differences in
innovation strategies across firms explain why some firms persistently innovate? This
research question is in line with a recent review of the capability literature, which argues that
prior studies have not, in general, analysed the relationship between the capabilities and
resources of firms, nor have they evaluated how these influence “the persistence of above
average performance” (Hoopes and Madsen, 2008:394).
Following evolutionary theory and strategic management research, it is a central tenet of the
approach of this study that there are important differences between firms in terms of how
they innovate, and that this leads to different innovation probabilities at the firm level. As
2
discussed below, the differences between firms, i.e. innovation strategies, are measured by
using the European-wide harmonised Community Innovation Survey (CIS) questions on
innovation activities (for example, R&D, marketing or design), information sources (for
example, internal or external to the firm) and the major goals a firm seeks to achieve by
innovating (for example, gaining market share or saving labour costs). This study proposes
that these variables capture the major elements of a firm’s tendency to persistently innovate.
Following on logically from the desire to measure firm characteristics in a rather precise way,
two major types of innovation are distinguished in the study, i.e. product and process
innovation. Although some prior studies have examined the persistence of product and
process innovation, none of them has examined the driving forces behind innovation
persistence within these two categories. This is the main contribution of the study to the
literature.
The study’s focus on the strategic driving forces behind persistent innovation is in line with
the recent literature on innovation studies, which have begun to conduct a longitudinal
analysis of firms in order to identify persistent heterogeneity and its causes (Dosi et al.,
2008). Where others in the field have focused on profit and productivity persistence (see
Bottazzi et al., 2008, for an example), the focus of this study is persistent innovation (and its
driving forces), which is considered to be a key factor of profit and productivity persistence.
As such, the study fits comfortably within the recent “persistent heterogeneity” topic in
innovation studies. The study uses a panel dataset, constructed on the basis of R&D and CIS
surveys from Norway,1 and adopts a dynamic random effects probit model (Wooldridge,
2005). This model is similar to that used in most recent studies which address innovation
persistence based on CIS data (for example, Peters, 2009; Raymond et al., 2006). However,
the present study contributes to the literature by extending the Wooldridge model in a simple
way, which enables an examination of whether, and to what extent, different types of
innovation strategies relate to innovation persistence. The econometric specification used,
which includes innovation strategies, nests the approach used in previous studies as a special
case. In other words, this method provides a natural way to incorporate the idea in
evolutionary theory that firms are different and innovative in diverse ways, and that the ways
in which firms innovate may influence their ability to persistently innovate.
1 Innovation and R&D survey data is widely used in innovation studies. See Laursen and Salter (2006), Reichstein and Salter (2006), Vega-Juardo et al. (2009), for recent examples.
3
Following this introduction, Section 2 firstly provides a short overview of the previous
empirical literature on innovation persistence, and subsequently looks at the particular
mechanisms for the persistence of innovation at the firm level suggested by the literature. The
section also discusses how this leads to the theoretical perspective of this study, which will
guide its empirical model. Section 3 presents the data and analytical method, and the
empirical approach to measure a firm’s innovation strategies is explained in Section 4, while
Section 5 presents the econometric results. The last section provides a summary, and ends by
proposing some recommendations for further research.
2. Theoretical Background and Prior Literature
2.1. Prior empirical research on innovation persistence
After the first studies appeared in the 1990s, the issue of whether or not innovation is
persistent at the firm level has been addressed by many quantitative papers, especially
recently. Although the basic empirical setting and econometric models used differ across
studies, innovation persistence has always been examined by including lagged innovation as
a predictor of current and/or future innovation. The literature on innovation persistence uses
two different types of indicators of innovation. On the one hand, some prior studies apply
patent data and R&D data, and on the other hand, more recent studies focus on questionnaire-
based measures of innovation (for example, the CIS and the like). Somewhat simplified,
survey questions about product and process innovation are considered to be output-based
measures of innovation, while R&D is an input, and patents are a measure of invention.
Early studies on innovation persistence mainly used patent data, and these studies found low,
or no clear-cut, persistence of innovation (Geroski et al., 1997; Malerba and Orsenigo, 1999;
Cefis and Orsenigo, 2001; Cefis, 2003). More recently, panel datasets based on the CIS have
been made available to researchers, and recent studies tend to be more positive about whether
or not innovation is persistent when using this data.
Using a dynamic count panel data model to link past and current innovations (in terms of the
number of patents and/or R&D expenditure), Crepon and Duguet (1997) reported a high
persistence of innovation among R&D intensive firms in France. Duguet and Monjon (2004)
and Rogers (2004) both estimated a cross-sectional probit model and found strong innovation
persistence in French and Australian firms, respectively. Focusing on R&D activities,
Castillejo et al. (2004) examined the persistence of innovation in Spanish manufacturing
4
firms by using a dynamic probit model and panel data. They found that the influence of past
R&D experience on the current decision to undertake R&D was positive and significant. In a
recent study of firms in the German service and manufacturing industries, Peters (2009) used
a dynamic random effects binary choice model and panel data to examine the persistence
hypothesis. Her findings showed a high persistence of innovation activities in both
manufacturing and services. In the service sector, however, the effect of innovation in the
previous period on innovation in the current period was smaller than it was in manufacturing.
In another recent analysis of Dutch manufacturing firms, Raymond et al. (2006) examined
innovation persistence separately for high-tech and low-tech sectors. They found that firms in
the high-tech sector innovated persistently, while this was not the case for low-tech firms.
When patents, R&D expenditure or innovation expenditure are used as the main data source,
it is hard (or impossible) to differentiate between process and product innovation. However,
to do so seems important, because these two types of innovation are of quite a distinct nature.
Process innovation often requires less technological advancement and strategic decision-
making (Rosenberg, 1982; Tushman and Rosenkopf, 1992). It is also often related to
learning-by-doing, and linked to innovation strategies which are believed to be less
developed compared to strategies for product innovation (Cabral and Leiblein, 2001; Pisano,
1997). This is why process innovation and product innovation may be expected to show
different levels of persistence. In literature which addresses the evolution of industries,
process innovation is usually regarded as being persistent in relatively mature industries
where the focus is more on creating new, more efficient production processes than on
introducing new products (Klepper, 1997; Utterback, 1994). In other words, persistence is
likely to vary between the two types of innovation according to different industries.
To the authors’ knowledge, only one previous study by Flaig and Stadler (1994) has
examined whether, and to what extent, process and product innovation are persistent at the
firm level. They used a dynamic random effects probit model and found that firms were
persistent in both product and process innovation, but that there was no dynamic cross effects
between these types of innovation. In other words, innovation of one type in the previous
period did not explain the current innovation of the other type.
Some studies have found low persistence in the innovation activity of firms. Examples
include Geroski et al. (1997) who used data on patents as well as “major” innovations for the
5
UK (and a duration dependence model), and Malerba and Orsenigo (1999), Cefis and
Orsenigo (2001) and Cefis (2003) who analysed EPO (European Patent Office) patent
application data for manufacturing firms in France, Germany, Italy, Japan, the UK and the
US. However, patents are not the same as innovations (Smith, 2004).2 The discussion of the
literature in the present study suggests that persistency studies which have used patents as a
proxy for innovation tend to identify a low degree of innovation persistence, while studies
using either R&D or “output”-based measures of innovation tend to find a higher degree of
innovation persistence within firms. Altogether, it is clear that innovation persistence is not a
clear-cut phenomenon, and that it requires a more in-depth research setting which can
facilitate an analysis of the driving forces of persistent innovation.
2.2. Why is innovation persistent at the firm level?
Previous research has identified three broad theories to explain why some firms are persistent
innovators (and why others do not persistently innovate). The first line of reasoning is based
on the idea that “success breeds success” (Nelson and Winter, 1982; Flaig and Stadler, 1994).
This idea stresses that prior commercial success in the form of a successful innovation creates
profits which can be invested in current and future innovation activities. Because of financial
constraints related to the risky nature of R&D and innovation (see Hall, 2002a, b for a survey
of the literature which addresses this issue), retained profits and past commercial success in
previous innovative activities are considered to be particularly important for the financing of
(new) innovation projects.
A second line of reasoning argues that some firms become persistent innovators due to
dynamic economies of scale and “learning-by-doing” (Arrow, 1962; Nelson and Winter,
1982; Dosi 1988). This may be the result of the very nature of knowledge itself, which is
cumulative and used as an input to generate new knowledge. It is often argued (see, for 2 To use patent data to analyse innovation persistence may be problematic, since patents are heavily criticised as being a wrong measure for innovation. With only some exceptions, such as in the biotechnology industry in which many firms try to obtain a patent as the way to commercialise what they have invented (i.e. to innovate), it would be more appropriate to treat a patent as an invention since to patent does not necessarily mean to innovate. This is because, for the sake of accuracy, according to Schumpeter (1911, 1942; see also Fagerberg, 2004), innovation should refer to the action or process of putting a new idea or model into practice, i.e. the introduction of an invention in the form of a new product or process into the economic or social system. Moreover, for a firm to be registered to have patented in a patent database, it needs to win a patent/invention race and be the first to apply for a patent. The persistence (not) found in patent data may, therefore, refer only to the success (or failure) in winning the patent race on a persistent basis. This suggests that the analysis using patent data may end up representing a story about persistence of invention or inventive leadership, not that of innovation.
6
example, Malerba and Orsenigo, 1996) that this is particularly important in some sectors
where the knowledge base is very cumulative, implying that experience in R&D makes firms
more efficient in innovating. In addition, learning-by-doing may take the form of ‘procedural
knowledge’, because a firm may simply learn from dealing with the various tasks or
problems it faces. This method of learning also refers to the management of relationships
with external partners, such as universities, which is closely related to the notion of learning
by interacting (Lundvall, 1988; Jensen et al., 2007). Assuming that the depreciation rate of
innovative abilities is small, Raymond et al (2006) explain that knowledge which has been
used to produce past innovations can be used again in the making of current, or even future,
innovations. This line of reasoning emphasises a firm’s persistent innovation behaviour.
Based more or less implicitly on a linear view of innovation, the third and final line of
reasoning argues that innovation persistence at the firm level can be explained by the largely
sunk nature of R&D costs (Sutton, 1991; Cohen and Klepper, 1996). From this perspective,
R&D is not an activity which can be easily discontinued one year, and started again in the
next year, mainly because knowledge is embodied in the human capital of researchers. Thus,
whether or not to invest in an R&D laboratory is a long-term decision, and once that decision
has been taken, the firm is expected to have a constant flow of innovation, rather than a one-
off. Thus, innovation becomes persistent.
Nevertheless, R&D is not the only innovation input/source (Arundel et al., 2008; Leiponen
and Helfat, 2010). Other inputs include external knowledge (for example, in the form of
cooperation, alliances, or licensing; see Bodas Freitas et al., 2008; Laursen and Salter, 2006),
and internal activities like design, marketing, training, etc. Intuitively, not all of these
innovation sources are associated with the same strong level of persistence as R&D. For
example, buying a license could be a one-off activity, leading to a single innovation, and the
training of employees could relate to a single innovation project. When innovation or
knowledge can be bought in the marketplace (Arora et al, 2001), persistence may also be low.
On the other hand, strategic alliances in which knowledge is jointly developed between firms
(Duysters and Hagedoorn, 1996; Vonortas, 1997), user-producer interactions (Von Hippel,
1988; Jensen et al., 2007), or cooperation with universities and public research institutes
(Mowery and Sampat, 2004; Nelson, 1993) may have important sunk costs and may,
therefore, be more durable.
7
From this perspective, the degree of innovation persistence observed in a particular firm
depends on the specific mix of innovation inputs or sources the firm uses. This suggests that
it is important to include variables which measure these inputs in a regression framework
aimed at identifying or explaining innovation persistence. This proposition is the key element
of the contribution of the present study. However, whether or not such an approach is feasible
depends, to a large extent, on the degree to which these innovation inputs themselves can be
considered as being exogenous at the level of the regressions. In other words, whether or not
there is merit in attempting to explain innovation persistence depends on what is known
about the background of the differences between firms which may relate to a varying degree
of innovation persistence.
This study contends that, given that the data used has, at most, three observations (on
innovation) per firm spanning a decade in total (see below), the differences between firms in
terms of the choice of innovation inputs can indeed be considered as being largely
exogenous. These differences will be measured at the outset of the 10-year period observed,
and then it will be assumed that these observed differences explain innovation and
persistence over the next observations. The (assumed) long-run nature of these differences
between firms is the main reason for referring to them as ‘strategic’ differences, i.e.
innovation strategies are spoken of as factors which may account for differences in
innovation and innovation persistence across firms. The justification of this assumption,
which may seem heroic to some, comes from two related fields of literature which have
influenced the recent discourse on innovation, namely, evolutionary economics and strategic
management. Evolutionary economics deals with the processes of variation, selection and
retention (Aldrich, 1999; Nelson and Winter, 1982). It argues that firms possess a set of semi-
stable routines in which they store factors which affect innovation, as well as other strategic
factors of the firm’s behaviour. Although these routines are subject to change, this does not
often occur, and generally, any such changes are not radical (Nelson and Winter, 1982; Cyert
and March, 1963; Levitt and March, 1988). Because the routines are not based on a decision-
making model with rational expectations or full information, and because firms differ in
respect of their pre-determined knowledge and resources, they imply a relatively large degree
of firm heterogeneity which evolves only slowly under the pressure of market selection. In
the words of Nelson and Winter (1982:14), “... routines play the role that genes play in
biological evolutionary theory. They are a persistent feature of the organism and determine
its possible behaviour”.
8
Strategic management literature identifies the notion of competencies or capabilities as
explaining innovation and innovation persistence at the firm level (for example, see Penrose,
1959; Grant, 1996; Winter, 2003). Existing literature on competencies addresses the
resources or capabilities firms need in order to successfully create and sustain a competitive
advantage. Competencies related to innovation and change within a firm are sometimes
referred to as dynamic capabilities (Teece et al., 1997). The theory states that firms need to
create or acquire these dynamic capabilities in order to be able to successfully innovate in a
changing competitive environment. Dynamic capabilities are “higher level” competencies
which enable the firm to continually renew its resource and knowledge base in order to keep
up with the demands of the market, and persistently innovate (Winter, 2003). What this
discussion simply suggests is that firms have dynamic capabilities, and dynamic capabilities
lead them to pursue different innovation strategies.
The stable nature of strategic firm behaviour is also stressed in strategic management
literature (see Hoopes and Madsen, 2008, for a review). In this respect, the notion of inertia
plays an important role. Similar to the idea of semi-stable routines, the concept of inertia is
that a firm’s strategy is stable, hard-to-change and persistent at the firm level (for example,
see Helfat, 1994; Stuart and Podolny, 1996). Winter (2003) argues that firms may innovate
even without a strategic focus, or develop innovations in a non-routine way by ad hoc
problem solving. However, theory predicts that persistent innovation is not likely without a
clear strategy backed up by the relevant capabilities, and this is reinforced, for example, by
the interaction between the firm’s knowledge base and its absorptive capacity. Firms with
more (relevant) knowledge and a better developed absorptive capacity are in a better position
to innovate (Cohen and Levinthal, 1989, 1990), but innovation itself reinforces absorptive
capacity. This latter aspect is sometimes referred to in the literature as double loop learning
(Argyris and Schon, 1978). This mechanism can be extended to the Open Innovation model
(Chesbrough et al., 2006), which has recently been influential in strategic management
literature. Firms which are more “open” in the innovation process reap higher sales and
profits from new innovations (Laursen and Salter, 2006)3 which, in turn, may enable future
innovation (i.e. the proposition of success breeds success, as discussed above).
3 Laursen and Salter (2006) suggest that searching more widely and deeply for ideas or knowledge from external sources increases the benefits of open innovation. However, over-search (in terms of breadth and depth) may result in decreasing returns.
9
In conclusion, it is argued that prior studies of innovation persistence have made a valuable
contribution to innovation literature by demonstrating that firms which innovate once tend to
innovate again in the future. However, prior empirical research can be perceived as only
having had a loose coupling to theory, and no prior study in this literature has taken relevant
theories into account when analysing why innovation is persistent at the firm level. In
comparison, prior studies have focused on the explanatory power of the lagged innovation
variable for current innovation, but this, in itself, cannot explain whether or not the persistent
condition observed is caused by sunk costs, “success breeds success”, learning by doing, or a
combination of these. Therefore, this begs the question, “Why do some firms persistently
innovate?”
The approach taken by the present study is to attempt to answer this question by relying on
measuring a set of stable firm innovation characteristics, referred to as innovation strategies,
and to use these to explain innovation in an econometric model. Because these innovation
strategies are measured at the outset of the observed period (see below), a significant and
positive impact on subsequent innovation occurrence would point to an element of innovation
persistence which can be interpreted in the light of the theoretical perspectives discussed
here. In other words, this study puts forth the argument that strategic differences across firms
are persistent, and this helps to explain why some firms innovate persistently, while others do
not.
3. Data and Methodology
The research in this study builds on a panel database created by Statistics Norway. The main
objective of creating this database has been to track firms over time on key variables such as
innovation, R&D, employment and sales. The database contains information about all
enterprises which have participated in at least one of the R&D surveys conducted by
Statistics Norway since 1993. These surveys are a census for firms with 50 or more
employees, but a sample for smaller firms. As a consequence, large firms have a much higher
probability of being included in several surveys rather than small firms. The R&D survey is
conducted every second year, and thus, the panel consists of waves of two years.
This study utilises part of the R&D panel. The first year of the dataset used is 1997, in which
this R&D data was combined with data from the Community Innovation Survey for year
1997 (so called CIS2). The CIS2 questions on innovation applied in this study refer to the
10
past three years, for example, the CIS2 survey asks whether or not the firm innovated in the
period between 1995 and 1997. Because the surveys are conducted every two years, the
innovation questions have an overlap of one year, and this may introduce an element of
spurious persistence which is a potential significant problem (potentially much larger than the
10% which Raymond et al. 2006 suggest). Therefore, the present study finds it necessary to
create a sample without any overlap in the measurement period. In this study, the innovation
variables used refer to the periods 1995-1997, 1999-2001, and 2002-2004. A survey covering
the period between1998 and 2000 does not exist, which is why the study is forced to leave a
one-year gap between the first and second wave in the dataset. Because a lagged dependent
variable is adopted as one of the regressors, the regressions use two observations per firm at
most (this is the case for firms which are present in all 3 waves). Moreover, since the initial
observation (data from the CIS 2) is used to measure the innovation strategies, the sample
used in the regressions is limited to those firms which were present in the initial wave (the
CIS 2). And because the questions about innovation in services are incompatible between the
waves, the service sector is excluded from the dataset, i.e. the sample is limited to industry
(mining, manufacturing, public utilities and construction).
Two dependent variables, namely, product innovation and process innovation, are employed
one at a time. These variables are directly observed in the survey, and are binary. The value
1 for the product or process innovation variable indicates that the firm had one or more
respective innovations (either product or process) during the 3-year period. Product and
process innovations have been defined according to the so-called Oslo manual (see
OECD/Eurostat, 2005), and refer to technological innovations which are new to the firm, but
need not necessarily be new to the industry, or the world.
One of the control variables used in this study is firm size (from which larger firms are
expected to have a higher probability to innovate, i.e. Schumpeter Mark II, 1942), and this is
measured by the number of employees a firm has (as reported in the survey). The other
control variables are industry dummy variables, time dummy variables, and innovation
strategy dummy variables. Table 1 documents the summary statistics of the main variables
used in the regressions, broken down by waves of the survey (wave 2 refers to the first
observation used in the regressions, since wave 1, which is the CIS 2, is used only for lagged
innovation variables). Both employment and ln(employment) are documented, but only the
latter is used in the regressions. With an average number of 183 employees, the firms in this
11
sample seem fairly large by Norwegian standards. This is a result of the fact that larger firms
have a higher probability of being included in the sample, because of the aforementioned
sampling method used by Statistics Norway. Also because of this sampling method, the
average firm size in wave 3 is larger than in wave 2, i.e. those (larger) firms which are
present in wave 3 are also present in the two previous waves (as opposed to the firms present
in wave 2, which need not be present in wave 3). In addition, the statistics in Table 1
demonstrate that the employment variable has a high standard error, which is the result of the
skewed nature of this variable. In fact, there are a few very large firms in the sample, the
largest of which has more than 11,000 employees.
Table 1 also reports that product innovation is more frequent (about 41% of all observations)
than process innovation (about 34%). Moreover, both forms of innovation are more frequent
in wave 2 than in wave 3, although this difference is much larger for process innovation (a
drop from 38% to 26%) than for product innovation (42% to 39%).
Table 2 illustrates the transition probabilities for the innovation status of firms for both types
of innovation. The sums of the values on the diagonal are an indication of persistence, as they
indicate the fraction of firms which stay in the same class, being persistent innovators or
persistent non-innovators (Cefis, 2003). These values are all high (above 0.5, with one
exception), which suggests that persistence is indeed prevalent in the sample (but of course,
this needs to be further tested in a regression model which includes control variables).
However, process innovators seem to be less persistent. In both periods, firms which were
initially process innovators have a relatively low probability of staying that way (compared to
product innovators). In the second period (wave 2 – 3), process innovators have an even
12
larger probability of being non-process innovators in the next wave than remaining as process
innovators (0.6 versus 0.4).
The difference between the two cells in the second column of each matrix indicates the
‘bonus’ enjoyed by an initial innovator over an initial non-innovator in terms of innovation
probability. Although these observed differences do not control for variables such as firm
size and other (observed or non-observed) heterogeneity, they can serve as a rough
benchmark of what to expect in the regressions. The observed differences range from 22%
(process innovation in the first period) to 42% (product innovation in the second period).
Table 2. Transition probabilities
Period 1 (wave 1 – 2) Period 2 (wave 2 – 3)
Product innovation wave =2 wave =3
No Yes No Yes
wave =1 No 0.73 0.27 wave =2 No 0.80 0.20
Yes 0.34 0.66 Yes 0.38 0.62
Process innovation wave =2 wave =3
No Yes No Yes
wave =1 No 0.71 0.29 wave =2 No 0.83 0.17
Yes 0.49 0.51 Yes 0.60 0.40 Note: The transition probabilities in each matrix are calculated for the firms that are present in the two successive waves considered (wave 1 – 2, wave 2 – 3).
Since the dependent variables employed are binary, a probit regression model is selected.
This study follows the standard modelling procedure for analysing (innovation) persistence,
i.e. the lagged dependent variable is included as an explanatory variable in the model in order
to test the persistence hypothesis. The specific estimation model used is a dynamic random
effects probit model. Obviously, in such a model, the probability of innovation is dependent
on the past innovative history of the firm, and this can be traced back to the initial
observation in the sample (wave 1). This initial observation proxies for otherwise unobserved
firm’s characteristics, and hence, as suggested by Wooldridge (2005), this initial observation
is included, in addition to the lagged dependent variable. It is important to account for
heterogeneity in this way, since otherwise the coefficient obtained for the lagged dependent
variable may be biased (overestimated) (Raymond et al., 2006; Peters, 2009). Taking into
13
account unobserved firm heterogeneity (by means of random effects), as well as the initial
value of the dependent variable, provides a dynamic framework, in which a significant lagged
dependent variable indicates true, not spurious, state dependence (Heckman, 1982).
In this study, a simple extension to the Wooldridge method (Wooldridge, 2005) is also
devised to enable an analysis of the influence of innovation strategies on persistent
innovation. Principally, the Wooldridge method incorporates an initial condition dummy
variable which is coded 0 if firms did not innovate at t1 and 1 if firms innovated at t1, and
this initial condition variable is fixed throughout the panel data analysis. The extension to this
method is simply that subgroups of firms which innovated at t1 will be distinguished by using
factor and cluster analyses. The CIS2 data used, which represents the time period t1 in the
panel, contains various details about innovation in firms, and latent firms’ strategies will be
identified based on this information, by utilising a factor analysis. A cluster analysis will then
categorise innovative firms at t1, based on how they score on the latent factors obtained from
the factor analysis. This is important, because the results of the cluster analysis will help to
identify subgroups of innovative firms which differ in their approach to innovation at t1. The
identified clusters will be represented in the analysis by cluster dummies, where value 1
signals that an innovative firm at t1 belongs to the respective cluster (and not to the others).
As the cluster analysis is undertaken using data of only innovative firms at t1, the cluster
dummy variables can simply be combined and transformed back into the original dummy
variable measuring the “initial innovation condition”. Thus, factor and cluster analyses are
two essential steps to be taken in order to examine whether, and to what extent, innovation
strategies influence persistent innovation at the firm level over time.
4. Measuring innovation strategies by factor and cluster analyses
This section conceptualises innovation strategies, and categorises firms based on their
strategies. The review in Section 2 suggests that firms use various knowledge sources and
engage in a range of learning activities (for example, through different routines) in the
innovation process. Thus, a first step is to identify latent variables or principle components
which capture a variety of sources, objectives and activities related to innovation in firms.
For this purpose, a factor analysis is undertaken on the relevant groups of variables extracted
from the CIS2 questionnaire. The structure of the questionnaire is such that firms which do
not report any product or process innovation are not allowed to answer the questions
concerned, and these firms are excluded from the factor analysis. Therefore, the results
14
reported in this section are based only on firms which have carried out some innovation
activities.
4.1. Results of factor analysis
Table 3 reports the results of the factor analysis on the set of CIS2 questions which indicate
the extent to which the sampled firms were active in different types of innovation activities.
The particular factor pattern identified in the table suggests two broad innovation approaches,
similar to the “make versus buy” option in technology sourcing. The “make” strategy
includes a combination of internal and external R&D, and the market introduction of
innovation. The “buy” strategy incorporates reliance on machinery and equipment
procurement, external technology, and training related to innovation. This result is in line
with that of Veugelers and Cassiman (1999), which demonstrates that firms differ in how
they use “make” and “buy” strategies.
Table 3. Innovation activities
Make Buy
-Research and experimental development within the
enterprise (intramural R&D) 0.88 -0.05
-Acquisition of R&D services (extramural R&D) 0.82 0.00
-Acquisition of machinery and equipment linked to
product and process innovations -0.18 0.72
-Acquisition of other external technology linked to
product and process innovations 0.09 0.65
-Market introduction of technological innovations 0.52 0.32
-Training directly linked to technological innovations 0.12 0.71
Note: 57 % of total variance explained by the two factors; principal components factoring with oblique oblimin rotation, chi2 (15) = 828.71, Prob. >chi2 = 0.00, Numbers in bold indicate moderate to high factor loadings.
Table 4 illustrates the results of a second factor analysis, which aimed to identify latent
factors in relation to the objectives of firms for innovation. It is assumed that firms differ in
terms of innovation goal setting, and that this difference will enable the estimate to detect the
factors which account for firm heterogeneity in the innovation process. According to the
15
results, the common goals can be broadly categorised into a “production” dimension
(reducing inputs and costs, while improving quality and satisfying standard requirements),
and a “market” dimension (competing with better and more products).
Table 4. Innovation Objectives
Production Market
-Replace products being phased out 0.20 0.53
-Improve product quality 0.46 0.32
-Extend product range -0.06 0.82
-Open up new markets or increase market share -0.01 0.81
-Fulfil regulations, standards 0.59 0.05
-Reduce labour costs 0.72 -0.11
-Reduce materials consumption 0.75 0.13
-Reduce energy consumption 0.83 0.01
-Reduce environmental damage 0.77 -0.11 Note: 53 % of total variance explained by the two factors; principal components factoring with oblique oblimin rotation, chi2 (15) = 828.71, Prob. >chi2 = 0.00, Numbers in bold indicate moderate to high factor loadings.
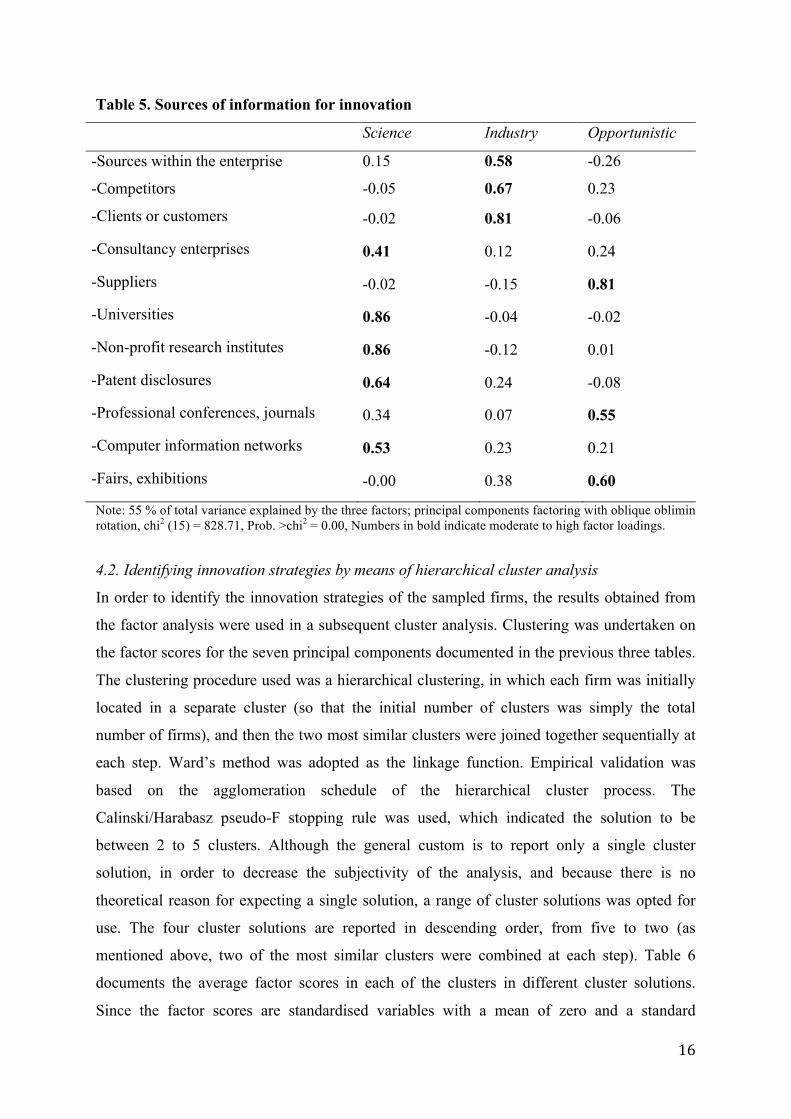
Following the discussion in Section 2, different types of knowledge sources used in a firm’s
innovation process are also of interest. Therefore, a factor analysis was undertaken on the set
of CIS2 variables which provide such information. The results indicated in Table 5 suggest
the presence of three main characteristics or functions of sources of information used by the
firms for innovation. The first is labelled “Science”, and captures information from
universities, research institutes, patents and, to a lesser extent, from computer networks and
consultants. The second is labelled “Industry”, and includes many sources within industry
(including the firm’s internal sources, customers, and competitors). The third is labelled
“Opportunistic”, and refers to the fact that this factor includes a number of sources which
require relatively little effort on behalf of the firm which adopts them (suppliers of
equipments, journals, professional conferences, fairs and exhibitions).
Note: 55 % of total variance explained by the three factors; principal components factoring with oblique oblimin rotation, chi2 (15) = 828.71, Prob. >chi2 = 0.00, Numbers in bold indicate moderate to high factor loadings.
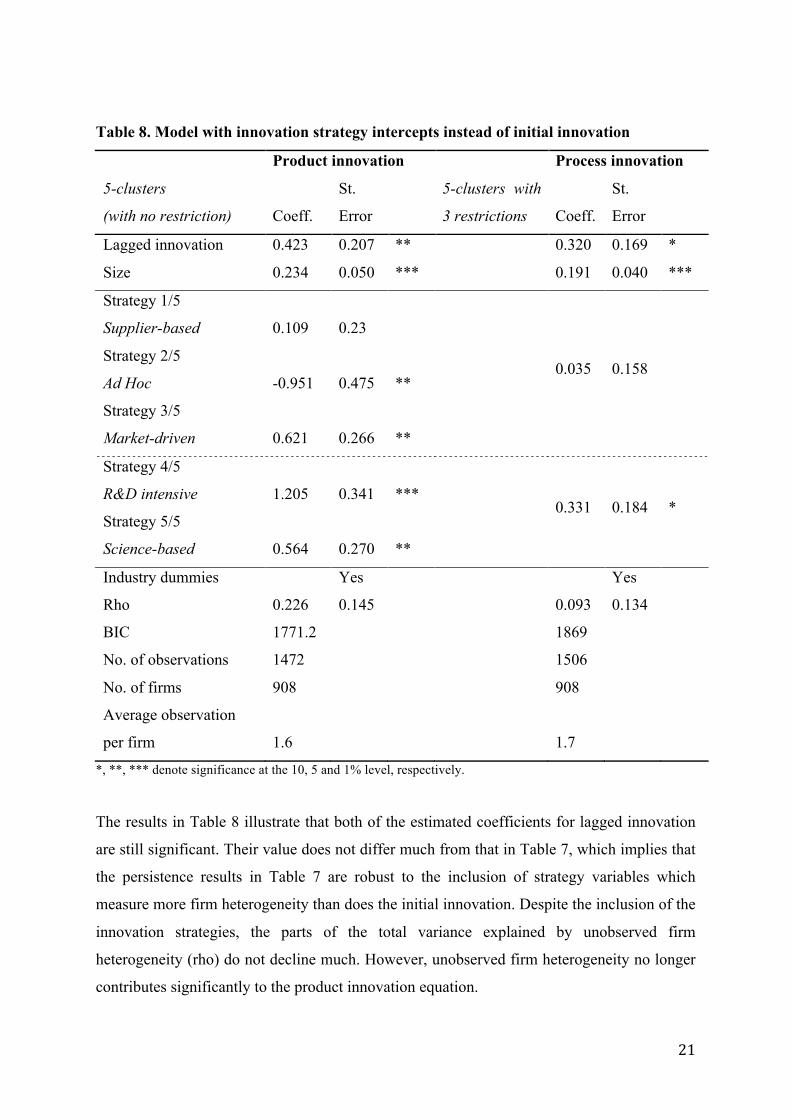
4.2. Identifying innovation strategies by means of hierarchical cluster analysis
In order to identify the innovation strategies of the sampled firms, the results obtained from
the factor analysis were used in a subsequent cluster analysis. Clustering was undertaken on
the factor scores for the seven principal components documented in the previous three tables.
The clustering procedure used was a hierarchical clustering, in which each firm was initially
located in a separate cluster (so that the initial number of clusters was simply the total
number of firms), and then the two most similar clusters were joined together sequentially at
each step. Ward’s method was adopted as the linkage function. Empirical validation was
based on the agglomeration schedule of the hierarchical cluster process. The
Calinski/Harabasz pseudo-F stopping rule was used, which indicated the solution to be
between 2 to 5 clusters. Although the general custom is to report only a single cluster
solution, in order to decrease the subjectivity of the analysis, and because there is no
theoretical reason for expecting a single solution, a range of cluster solutions was opted for
use. The four cluster solutions are reported in descending order, from five to two (as
mentioned above, two of the most similar clusters were combined at each step). Table 6
documents the average factor scores in each of the clusters in different cluster solutions.
Since the factor scores are standardised variables with a mean of zero and a standard
17
deviation of one, a positive (negative) number in the table indicates an above (below) average
Industry dummies Yes Yes Rho 0.028 0.162 0.014 0.158 BIC 1416.4 1414.2 No. of observations 1175 1174 No. firms 720 719 Average observation per firm 1.6 1.6
*, **, *** denote significance at the 10, 5 and 1% level, respectively.
24
Raymond et al. (2006) found different results for persistence in high-tech and low-tech
sectors,4 and this was also tested in the present study. Table 9 reports some estimations in
which the model is estimated separately for high-tech and low-tech sectors. The full set of
models is not documented (both types of innovation in both sectors), but instead, emphasis is
placed on the cases which demonstrate a stronger persistence than those in Tables 7 and 8.
These are product innovation in high-tech, and process innovation in low-tech.
Product innovation in the high-tech sector appears to be very persistent if the innovation
strategy variables are excluded (i.e. in the ‘basic model’). In this case, a coefficient of about
0.66 was found for lagged innovation, which is higher than any coefficient in the previous
tables. However, this appeared to be largely spurious, since the coefficient became non-
significant and dropped to 0.4 when innovation strategies were included. In terms of process
innovation, which is most persistent in the low-tech sector, no such spurious persistence was
found. In fact, the innovation strategy variables all appeared to be non-significant in this case.
The coefficient for lagged process innovation is about 0.1 higher than in Table 8.
What do these results imply for the relevance of innovation strategies in explaining observed
differences in the propensity to innovate between firms? In order to respond to this question,
the implied marginal effects of the variables included in the estimates reported above need to
be examined. The marginal effects, which were calculated using the predicted probit
probabilities, are documented in Tables 10 and 11.
The overall impression is that the (observed) heterogeneity between firms (innovation
strategies) plays an important role in explaining innovation probability, especially in
explaining product innovation (see Tables 10 & 11). In the case of product innovation in all
sectors (Table 10), firms which were initially in innovation strategy 4/5 (R&D intensive)
have a 45% higher probability of innovation than those which did not innovate initially,
across the entire time span of the regression. The effect of lagged innovation, i.e. the level of
innovation persistence which is unexplained by differences in innovation strategies, is 16%
(in the innovation strategies model), which is much lower than the innovation strategy 4/5
effect. The 16% effect related to lagged innovation is comparable to the difference between 4 High-tech and low-tech are defined along the lines of OECD (1999) classification. High-tech consists of chemicals, electrical products, machinery and equipment, plastics and vehicles industries. On the other hand, Low-tech consists of food, metals, non-metallic products, textiles, products not classified elsewhere, and wood.
25
the marginal effects of innovation strategy 4/5 and either innovation strategies 3/5 (Market-
driven) or 5/5 (Science-based). However, it is smaller than the effect of either innovation
strategies 3/5, 4/5 or 5/5 individually, and also smaller than the absolute value of the
innovation strategy 2/5 effect (Ad hoc, which is -28%). Only in the case of process
innovation is the effect of lagged innovation comparable in size to that of the innovation
strategies (mode 4/5 and mode 5/5 in Table 10). In the low-tech sector (Table 11), the effect
of lagged process innovation (about 15%) is even larger than the effect of innovation
strategies. As discussed earlier, this difference between the persistence of product and
process innovation may be explained by the fact that process innovation is often undertaken
based on learning-by-doing, which may involve less strategic decision-making and
technological advancement.
Table 10. Marginal effects of the main variables in the model (initial innovation, innovation strategies)