37
TIL LOGISTICS GROUP LIMITED FY20 Results Presentation for the year ended 30 June 2020 TIL Logistics Group FY20 Results Presentation
TIL LOGISTICS GROUP LIMITEDFY20 Results Presentation for the year ended 30 June 2020
TIL Logistics Group FY20 Results Presentation

TIL LOGISTICS GROUP
• One of New Zealand’s largest domestic freight and logistics platforms.
• Nationwide network of branches, depots and warehouses and dedicated team of employees and contractors.
• Delivering product to over 3,500 customers with a low level of churn and concentration.
• Over 220,000 square metres of warehousing capacity.
• Comprehensive service offer across the supply chain: Transport (Freighting & Bulk Liquids), Warehousing & Logistics, Specialist Lifting & Transport (SLTG), and International Freight Forwarding.
TIL Logistics Group FY20 Results Presentation 2

OUR VISION AND VALUES
3TIL Logistics Group FY20 Results Presentation
SAFETY. We focus on team safety ensuring every employee arrives home safe and sound whatever their role. This includes training ourstaff in the latest safety procedures and using quality equipmentas part of our processes.
PROFESSIONALISM. We do what we say we will do. We act openly and honestly both
within the organisation and with our customers. We value ethics,
integrity and we do what is right.
CUSTOMER. We are focused on the needs ofour customers We recognisewithout customers we have no business and do what it takes to be our customers’ logistics partner of choice. We are easy to do business with, collaborate and learn from outcomes with ourcustomers.
INNOVATION. We strive to be leaders in logistics innovation and welcome
new technology with enthusiasm and interest. We always look
for ways to improve our effectiveness and efficiency.
SUSTAINABILITY. We want to be a leader in sustainable logistics services. Creation
of a sustainable strategy that focuses on our people, customers,
investors and communities, is important. Our strategy extends to
emission reduction targets and transparent reporting, with the aim
being a better environment for us all.
RESULTS DRIVEN. We are committed to providing the best services, exceeding
expectations of our customers and creating sustainable
value for our shareholders and stakeholders.
TEAM. We work together as a cohesive group, to empower our
individual strengths. All employees are given the opportunity for
growth and development. We show pride in the appearance of
ourselves and our equipment. We all share a “can do”attitude.
Our Vision is to be Oceania’s premier transport and logistics company

FY20 OPERATING ENVIRONMENT
4TIL Logistics Group FY20 Results Presentation
First half:
• Adverse market conditions including softening business confidence as well as slower than expected pre-Christmas period.
• Particularly wet winter impacting construction & building activity; forestry products hit hard by China/USA trade war; Taranaki Oil & Fuel industry impacted by Government Policy. Building Products reflected negative sentiment after a decade of growth.
Second half:
• Impact of COVID-19 in Q4 FY20 with a significant decrease in economic activity.
• Material impact on many of TIL’s customers.
Impact on TIL:
• Adverse market conditions contributed to significant underperformance of Freight division in 1H20.
• Despite essential service status, COVID-related restrictions had a material impact on many of the Group’s customers, with flow on effects for TIL’s operations and earnings.
• Since the lifting of the COVID-19 restrictions, the businesses have begun to recover.

OUR RESPONSE TO COVID-19• A number of TIL’s businesses continued to operate and support essential services during the
lockdown, albeit at reduced levels.
• Actions taken to respond to COVID-19 include: - Government wage subsidy of $10.7m, partially offsetting ¬$17m revenue drop and allowing
TIL Logistics to retain and pay over 1,500 employees at least 80% of their wages, or 100% if working.
- Increased focus on efficient use of the fleet.- Reduced Director and Executive Team remuneration.- Received some rent relief and support from asset leasing partner.- Offered support to customers where possible.- Cashflow and cost control remains a priority and all non-essential operating expenditure and
capital expenditure continues to be carefully reviewed.
• Material impact on volumes for a number of customers, with a flow on effect for TIL.
• Good recovery being seen following lockdown, however, further disruption now being seen from recent restrictions in Auckland and across the country. Cautious outlook being taken.
5TIL Logistics Group FY20 Results Presentation
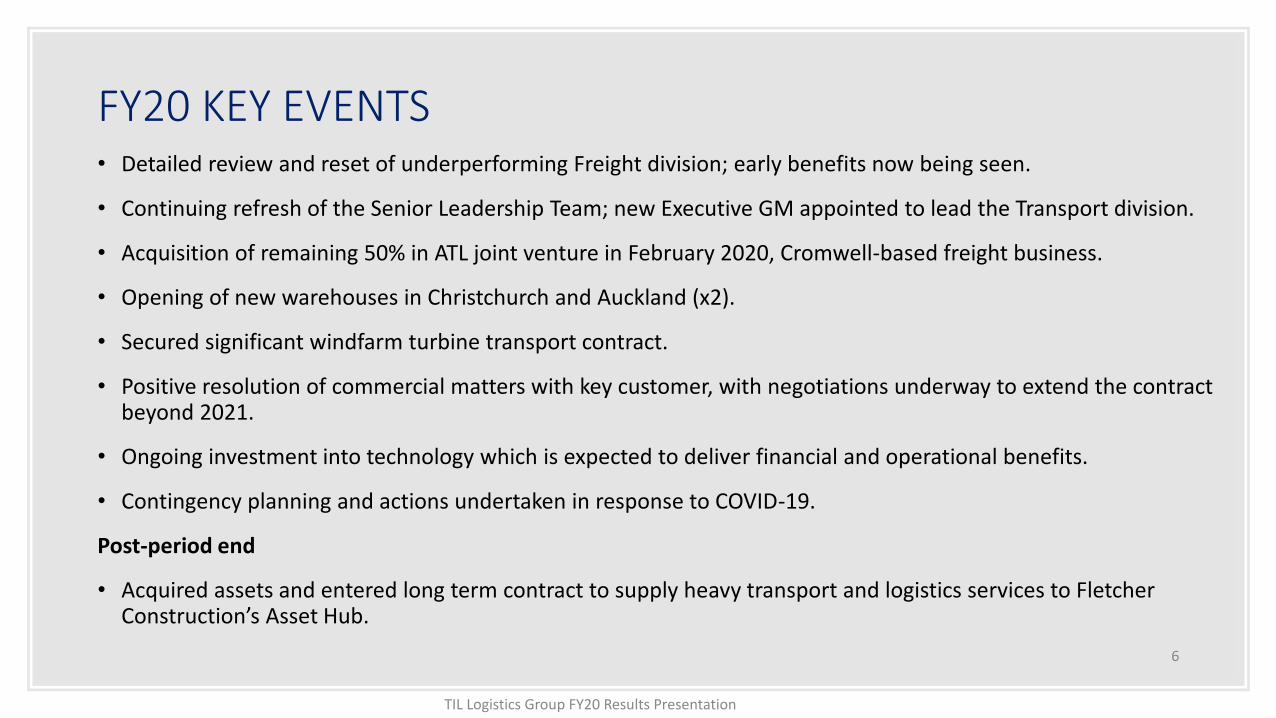
FY20 KEY EVENTS• Detailed review and reset of underperforming Freight division; early benefits now being seen.
• Continuing refresh of the Senior Leadership Team; new Executive GM appointed to lead the Transport division.
• Acquisition of remaining 50% in ATL joint venture in February 2020, Cromwell-based freight business.
• Opening of new warehouses in Christchurch and Auckland (x2).
• Secured significant windfarm turbine transport contract.
• Positive resolution of commercial matters with key customer, with negotiations underway to extend the contract beyond 2021.
• Ongoing investment into technology which is expected to deliver financial and operational benefits.
• Contingency planning and actions undertaken in response to COVID-19.
Post-period end
• Acquired assets and entered long term contract to supply heavy transport and logistics services to Fletcher Construction’s Asset Hub.
6
TIL Logistics Group FY20 Results Presentation
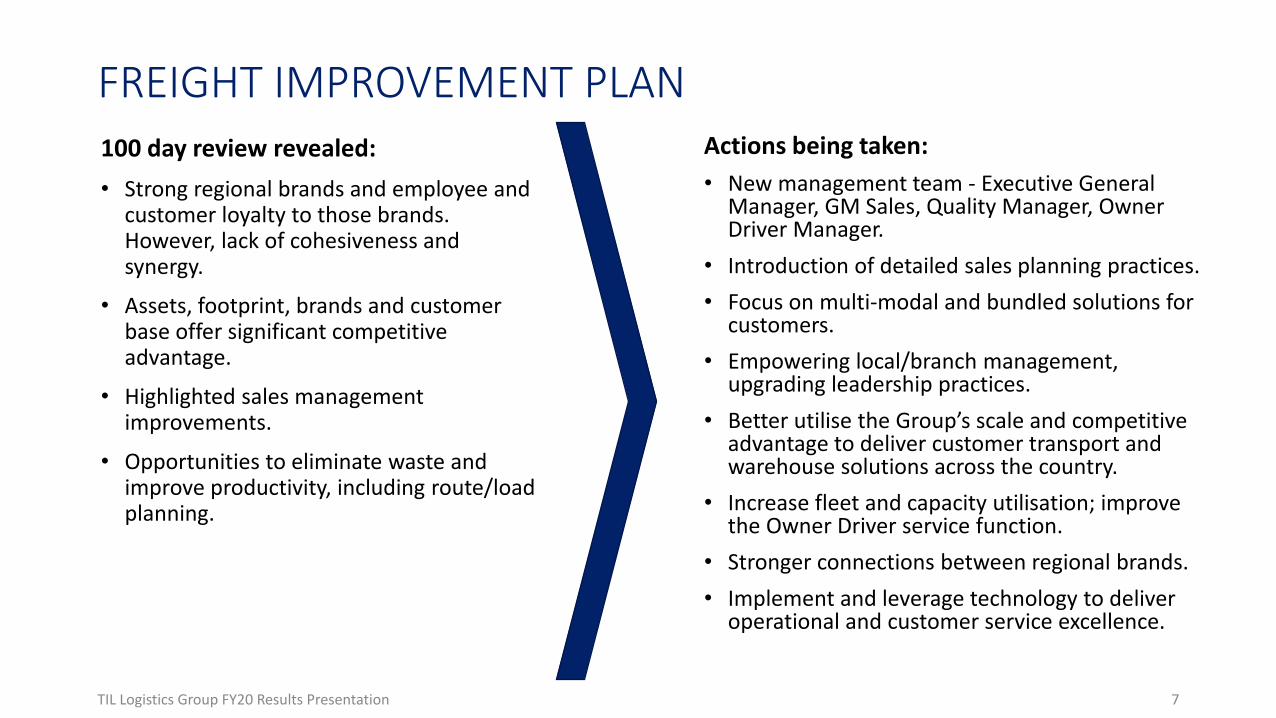
FREIGHT IMPROVEMENT PLANActions being taken:
• New management team - Executive General Manager, GM Sales, Quality Manager, Owner Driver Manager.
• Introduction of detailed sales planning practices.
• Focus on multi-modal and bundled solutions for customers.
• Empowering local/branch management, upgrading leadership practices.
• Better utilise the Group’s scale and competitive advantage to deliver customer transport and warehouse solutions across the country.
• Increase fleet and capacity utilisation; improve the Owner Driver service function.
• Stronger connections between regional brands.
• Implement and leverage technology to deliver operational and customer service excellence.
7TIL Logistics Group FY20 Results Presentation
100 day review revealed:
• Strong regional brands and employee and customer loyalty to those brands.However, lack of cohesiveness and synergy.
• Assets, footprint, brands and customer base offer significant competitive advantage.
• Highlighted sales management improvements.
• Opportunities to eliminate waste and improve productivity, including route/load planning.
FY20 RESULTS SNAPSHOT
8TIL Logistics Group FY20 Results Presentation
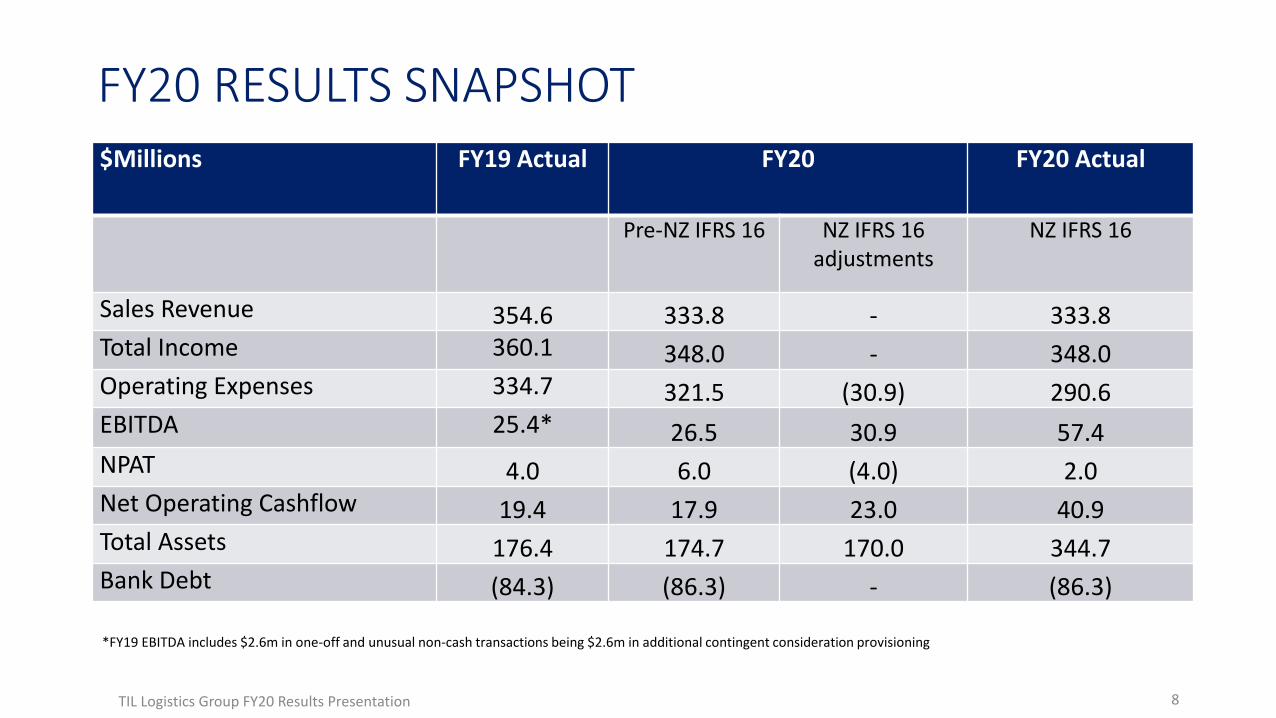
$Millions FY19 Actual FY20 FY20 Actual
Pre-NZ IFRS 16 NZ IFRS 16 adjustments
NZ IFRS 16
Sales Revenue 354.6 333.8 - 333.8Total Income 360.1 348.0 - 348.0Operating Expenses 334.7 321.5 (30.9) 290.6EBITDA 25.4* 26.5 30.9 57.4NPAT 4.0 6.0 (4.0) 2.0Net Operating Cashflow 19.4 17.9 23.0 40.9Total Assets 176.4 174.7 170.0 344.7Bank Debt (84.3) (86.3) - (86.3)
*FY19 EBITDA includes $2.6m in one-off and unusual non-cash transactions being $2.6m in additional contingent consideration provisioning

FY20 RESULTS OVERVIEW
9TIL Logistics Group FY20 Results Presentation
NZ IFRS 16 for Leases was adopted from 1 July 2019. To provide a like for like comparative to the prior year, all comparatives below
are on a pre-IFRS16 basis:
• Results within updated guidance range provided in June 2020, with EBITDA (pre-NZ IFRS16) of $26.5m (guidance $25m to $27m)
• Adjusted EBITDA (excluding unusual costs in FY19) slightly below prior year and in line with guidance.
• Net Profit After Tax (NPAT) of $6.0m, up 50% on pcp.
• Margins in line with or above prior year for all divisions, excluding Freight which has undergone review and reset in FY20
• Material impact from COVID-19 on sales and volumes in 2H20.
• Year on year earnings growth for three divisions - Warehousing & Logistics, International and Specialist. Full year contribution from Specialist following its acquisition in November 2018.
• Improving performance from Freight in 2H, after a disappointing 1H. Bulk Liquids materially impacted by reduced fuel demand during lockdown; pcp included a number of one-off revenue benefits.
• Focus on cost reductions and right sizing the business for pending economic slowdown.
• No final dividend has been declared. Resumption of dividends in FY21 will be considered subject to trading conditions and financial performance continuing to improve.

FY20 GROUP SALES BY INDUSTRY SEGMENT
10TIL Logistics Group FY20 Results Presentation
Food & Beverage
Energy, Oil & Gas
Building Products
Sub-contract Transport Services
Other
% of Sales
Other comprises:
Household & Personal Products
Forestry
Commercial & Professional Services
Container Transport
Automobiles & Components
Consumer Durables & Apparel
Construction
Storage
Agriculture
Retail
TIL has a diverse customer base and industry exposure, with low churn.

SALES REVENUESales revenue of $333.8m, with 2H20 impacted by COVID-19 and reduced customer volumes.
• Q4 FY20 sales down approx. $17m compared to pcp, due to COVID restrictions.
• Freight – disappointing performance in 1H20, and material impact on 2H20 as customers’ volumes reduced due to COVID-19.
• Warehousing – 1H20 in line with previous year, impacted by COVID-19 in 2H20.
• Bulk Liquids sales materially impacted by reduced fuel volumes due to COVID19 over March and April.
• International - continuing trend of half yearly growth from 2H19 onwards.
• Specialist grew significantly with full year contribution from major 2018 acquisition, and commencement of a major windfarm project in 2H20.
11TIL Logistics Group FY20 Results Presentation
235.3
325.6
354.6
333.8
100
150
200
250
300
350
FY17 FY18 FY19 FY20
$ M
illio
ns

OPERATING EXPENSES
Adjusted operating expenses reduced by $10.6m.
• Primarily due to the decrease in operating costs during the COVID-restricted trading periods, and a decrease in the price of fuel.
• Partially offset by increased operating costs relating to the new warehouses.
12TIL Logistics Group FY20 Results Presentation
221.6
305.5332.1 321.5
0
50
100
150
200
250
300
350
FY17 FY18 FY19 FY20
$ M
illio
ns
Adjusted Operating Expenses(excluding D&A and NZ IFRS16)
Adjusted operating expenses excludes contingent acquisition consideration and non-trading costs associated with the reverse listing in FY18.

STRONG RECOVERY IN EBITDA IN SECOND HALF
13TIL Logistics Group FY20 Results Presentation
• Improvements in EBITDA in the second half (particularly in Freight and Bulk Liquids), after a disappointing first half performance.
• Results for all divisions well ahead of the second half in the prior year.
• Performance improvement in part reflects management efforts to drive improvement in the business. 2H19
$m2H20$m
% change
Freight 4.4 5.8 32%
Warehousing 3.0 4.3 43%
Bulk Liquids 4.3 5.4 26%
International 0.8 1.4 75%
Specialist 2.1 2.5 19%
1H20$m
2H20$m
% change
Freight 0.8 5.8 625%
Warehousing 3.6 4.3 19%
Bulk Liquids 2.6 5.4 108%
International 1.0 1.4 40%
Specialist 2.1 2.5 19%

FY19: FY20 EBITDA BRIDGE
• Disappointing performance from Freight division in 1H20. Management review undertaken and improvement initiatives underway with stronger 2H20.
• Growing utilisation partially offsetting the increased costs associated with the expanded warehouse facilities.
• Bulk Liquids in line with prior year, despite material impact of COVID-19 on fuel haulage.
• Positive growth from International and Specialist divisions.
14TIL Logistics Group FY20 Results Presentation

FY19: FY20 NPAT BRIDGE
15TIL Logistics Group FY20 Results Presentation
NPAT of $2.0m for full year.
Pre-IFRS NPAT of $6.0m.
Compared to FY19, the FY20 result reflects:
- Full year of depreciation following the acquisition of the Specialist business
- FY19 included $2.6m of contingent consideration relating to an acquisition made in FY17
- FY20 includes a bargain on acquisition for the remaining 50% of ATL Limited.

CAPITAL MANAGEMENT
Capital Expenditure:
• Prudent management and minimisation of capex in COVID environment.
• Investment into new trucks and equipment to resource customer projects.
• Increased Plant & Equipment spend for fit out of new warehouses.
• Increased investment into digital platforms and Transport Management System (TMS).
• FY21 will see a more cautious approach to capital expenditure in response to the expected recessionary conditions.
16TIL Logistics Group FY20 Results Presentation
$ Millions FY20Pre-IFRS16
FY19
Operating cashflow 17.9 19.4
Net Debt 74.4 77.9
Net Capex 10.5 11.4
0
1
2
3
4
5
6
Land &Buildings
MotorVehicles
IT & OfficeEquip
Plant &Equip
Software
$ M
illio
ns
Net Capital Expenditure
FY19 FY20
Capital expenditure excludes assets acquired via business acquisitions
BALANCE SHEET
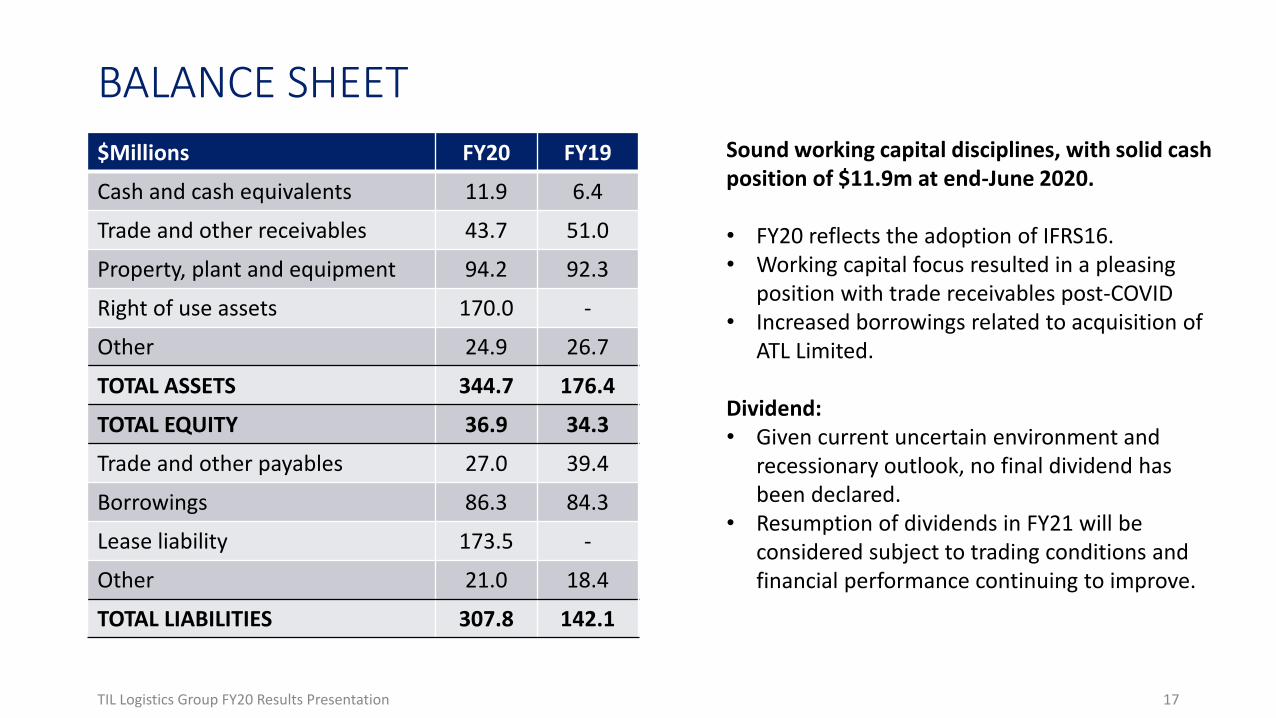
$Millions FY20 FY19
Cash and cash equivalents 11.9 6.4
Trade and other receivables 43.7 51.0
Property, plant and equipment 94.2 92.3
Right of use assets 170.0 -
Other 24.9 26.7
TOTAL ASSETS 344.7 176.4
TOTAL EQUITY 36.9 34.3
Trade and other payables 27.0 39.4
Borrowings 86.3 84.3
Lease liability 173.5 -
Other 21.0 18.4
TOTAL LIABILITIES 307.8 142.1
17TIL Logistics Group FY20 Results Presentation
Sound working capital disciplines, with solid cash position of $11.9m at end-June 2020.
• FY20 reflects the adoption of IFRS16.• Working capital focus resulted in a pleasing
position with trade receivables post-COVID• Increased borrowings related to acquisition of
ATL Limited.
Dividend: • Given current uncertain environment and
recessionary outlook, no final dividend has been declared.
• Resumption of dividends in FY21 will be considered subject to trading conditions and financial performance continuing to improve.

IFRS 16: ADOPTION IMPACT IN FY20
• TIL has a large number of vehicle leases, as well as long term property leases.
• Upon adoption from 1 July 2019, NZ IFRS 16 had a material impact on a number of elements of the Group’s balance sheet and income statement, but no material impact on the Group’s cash flows.
FY20 impact:
• Balance sheet as at 30 June 2020: Increase in assets of $170.0m and increase in liabilities of $173.5m
• EBITDA: Increase of $30.9m
• Net Profit Before Tax: Reduction in NPBT of $5.5m
• Cash flows: No change
TIL Logistics Group FY20 Results Presentation 18

DIVISION REVIEW
TIL Logistics Group FY20 Results Presentation 19
Freight
Warehousing & Logistics
Bulk Liquids
International
Specialist

20TIL Logistics Group FY20 Results Presentation
TIL LOGISTICS GROUP
FREIGHTWAREHOUSING &
LOGISTICSBULK LIQUIDS INTERNATIONAL SPECIALIST
OUR BUSINESS

TIL OPERATES ACROSS FIVE DIVISIONS
FREIGHT
One of NZ’s largest general freight and line haul transport service providers with a nationwide network and regional breadth.
BULK LIQUIDS
Specialists in transporting fuel, LPG and industrial chemicals, transporting c. 40% of New Zealand’s petroleum.
WAREHOUSING & LOGISTICS
New Zealand’s largest 3PL operation, providing a national warehousing solution, including warehousing, info management, cross docking, container cartage and loading and metropolitan delivery.
INTERNATIONAL
International freight forwarding and logistics services. TIL’s offering also includes custom clearance support and port services.
SPECIALIST
Group of businesses specialising in heavy and large haulage and machinery lifting as well as advisory services.
21TIL Logistics Group FY20 Results Presentation

DIVISION REVENUE AND EBITDA Excluding NZ IFRS 16
DIVISION REVENUE FY19 1H20 FY20
Freighting* 179.7 84.1 161.2
Warehousing & Logistics* 76.2 37.9 71.3
Bulk Liquids 78.1 39.1 73.9
International 7.4 4.2 9.0
Specialist 13.1 8.7 18.4
22TIL Logistics Group FY20 Results Presentation
DIVISION EBITDA pre-IFRS 16**
FY19 1H20 FY20
Freighting* 9.9 0.8 6.6
Warehousing & Logistics* 7.4 3.6 7.9
Bulk Liquids 8.3 2.6 8.0
International 1.5 1.0 2.4
Specialist 2.6 2.1 4.6
*Prior period revenue and EBITDA for Freighting and Warehousing & Logistics have been restated to a pro forma basis as if the restructure of NZL had occurred. ** Division EBITDA excludes corporate costs
FY20 REVENUE
FY20 ADJ EBITDA

FREIGHTRevenue $161.2m, -10%EBITDA $6.6m, -33%
FY20
• Environment of increasing competitive pricing pressure, lower sales across a range of customers and a softer Christmas trading period than anticipated, as well as the loss of a large customer for NZL. Further impacted by COVID-19.
• Disappointing 1H20 performance - detailed review and reset of the division underway, with improving performance in 2H20 as turnaround initiatives have taken effect.
• Completed pilot of new Transport Management System, with further refinement now underway.
• Continued to adopt other transport modes such as rail and coastal as part of customer solutions.
Outlook:
• Expected uplift as country restocks post-COVID, Government stimulus initiatives and increased focus on sales activity.
• Key export industries forecasting robust volume growth, with demand for NZ goods and historically low NZD.
• Longer term, technology initiatives expected to deliver cost and margin benefits.
TIL Logistics Group FY20 Results Presentation 23
0.0
2.0
4.0
6.0
8.0
10.0
12.0
FY18 FY19 FY20
Freighting Adj EBITDAPRe-NZ IFRS16
1H 2H
0.0
50.0
100.0
150.0
200.0
250.0
FY18 FY19 FY20
Freighting Revenue

WAREHOUSING & LOGISTICSRevenue $71.3m, -6%EBITDA $7.9m, +6%
FY20:
• Continued investment into new warehouses, resulting in additional capacity which is expected to cater for future sales.
• Additional overheads and operating expenses in FY20, related to the new warehouses.
• Impacted by COVID-19, with customer volumes reducing.
Outlook
• Flow on effects of impact of COVID on customer volumes expected to continue.
TIL Logistics Group FY20 Results Presentation 24
0.0
2.0
4.0
6.0
8.0
10.0
12.0
FY18 FY19 FY20
Warehousing Adj EBITDAPre-NZ IFRS 16
1H 2H
0
20
40
60
80
100
120
FY18 FY19 FY20
Warehousing Revenue
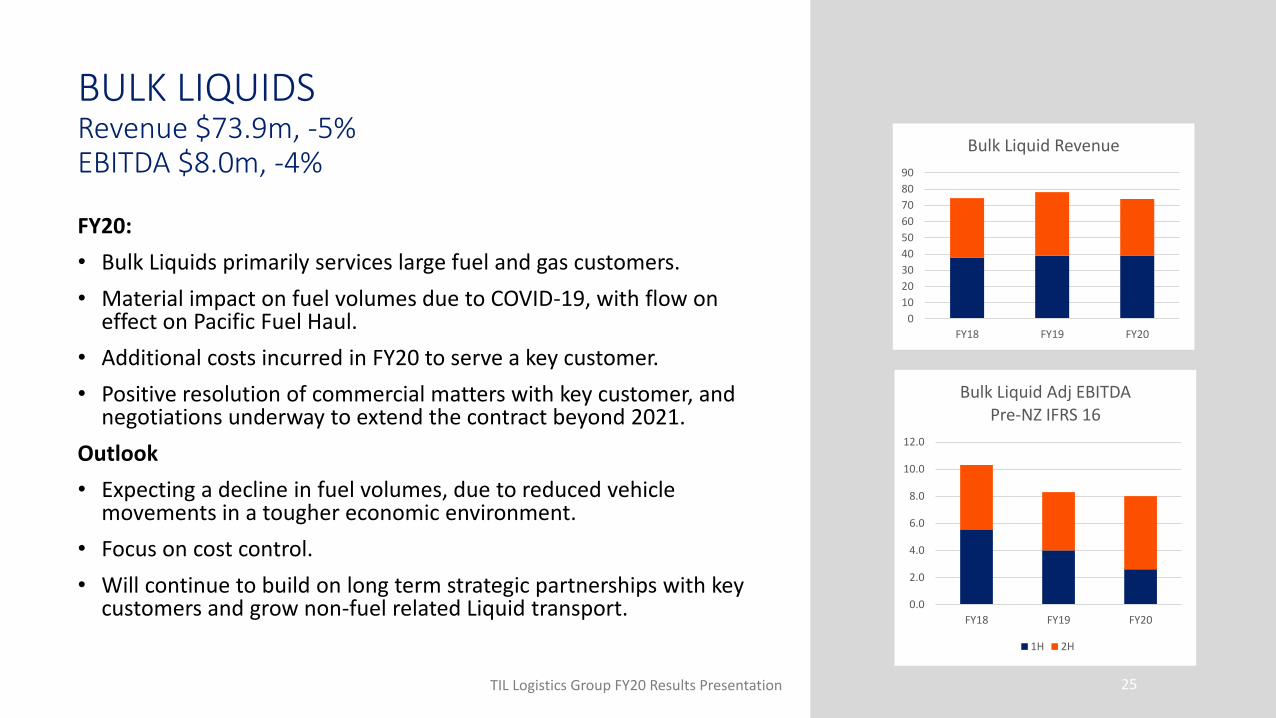
BULK LIQUIDSRevenue $73.9m, -5%EBITDA $8.0m, -4%
FY20:
• Bulk Liquids primarily services large fuel and gas customers.
• Material impact on fuel volumes due to COVID-19, with flow on effect on Pacific Fuel Haul.
• Additional costs incurred in FY20 to serve a key customer.
• Positive resolution of commercial matters with key customer, and negotiations underway to extend the contract beyond 2021.
Outlook
• Expecting a decline in fuel volumes, due to reduced vehicle movements in a tougher economic environment.
• Focus on cost control.
• Will continue to build on long term strategic partnerships with key customers and grow non-fuel related Liquid transport.
25TIL Logistics Group FY20 Results Presentation
0
10
20
30
40
50
60
70
80
90
FY18 FY19 FY20
Bulk Liquid Revenue
0.0
2.0
4.0
6.0
8.0
10.0
12.0
FY18 FY19 FY20
Bulk Liquid Adj EBITDAPre-NZ IFRS 16
1H 2H
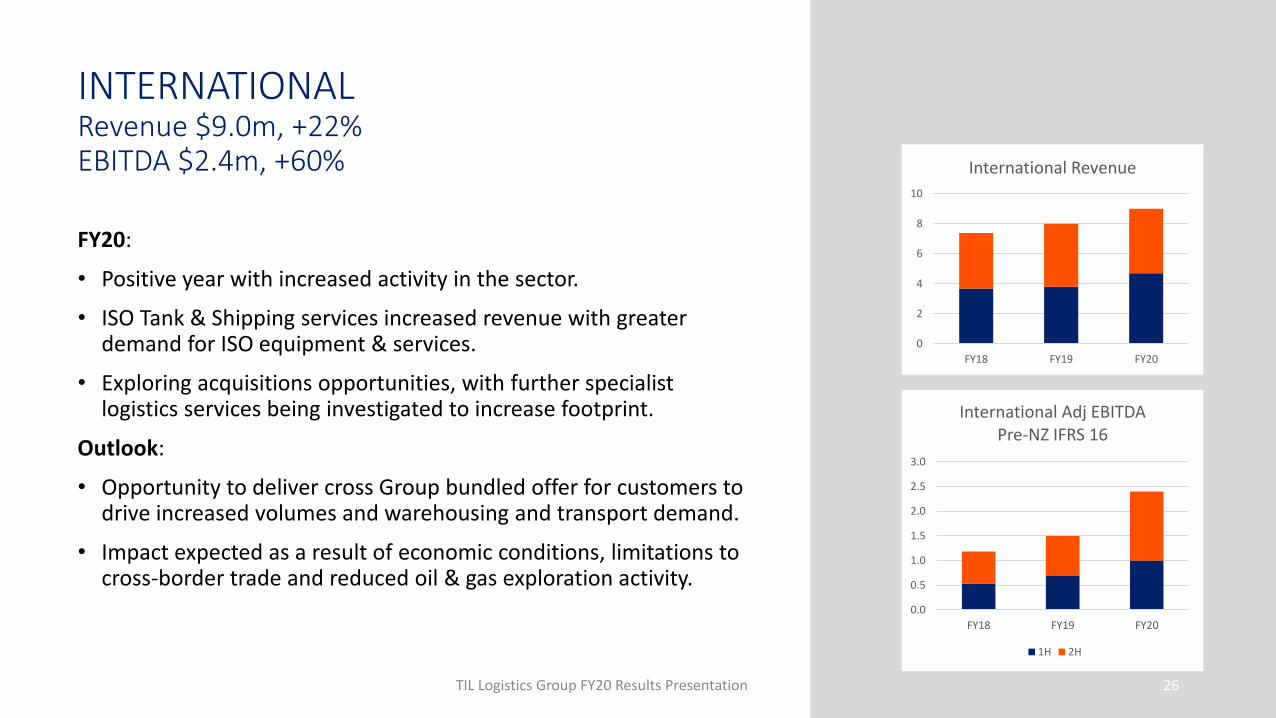
INTERNATIONALRevenue $9.0m, +22%EBITDA $2.4m, +60%
FY20:
• Positive year with increased activity in the sector.
• ISO Tank & Shipping services increased revenue with greater demand for ISO equipment & services.
• Exploring acquisitions opportunities, with further specialist logistics services being investigated to increase footprint.
Outlook:
• Opportunity to deliver cross Group bundled offer for customers to drive increased volumes and warehousing and transport demand.
• Impact expected as a result of economic conditions, limitations to cross-border trade and reduced oil & gas exploration activity.
TIL Logistics Group FY20 Results Presentation 26
0.0
0.5
1.0
1.5
2.0
2.5
3.0
FY18 FY19 FY20
International Adj EBITDAPre-NZ IFRS 16
1H 2H
0
2
4
6
8
10
FY18 FY19 FY20
International Revenue

SPECIALISTRevenue $18.4m, +40%EBITDA $4.6m, +77%
FY20:
• Specialised Lifting and Transport continues to be a solid acquisition.
• Major windfarm transport contract secured in February, with some work undertaken in 2H20 but majority deferred to FY21.
• Acquired assets and entered long term contract to supply heavy transport and logistics services to Fletcher Construction’s Asset Hub.
Outlook:
• Projects delayed by COVID expected to come on stream in 1H21.
• Strong pipeline of activity through increased infrastructure spending and Government stimulus.
TIL Logistics Group FY20 Results Presentation 27
0
4
8
12
16
20
FY18 FY19 FY20
Specialist Revenue
-1.0
0.0
1.0
2.0
3.0
4.0
5.0
FY18 FY19 FY20
Specialist Adj EBITDAPre-NZ IFRS 16
1H 2H

HEALTH & SAFETY
• We take the safety and wellbeing of our employees, contractors, owner drivers and communities very seriously. It is an essential component to everything we do.
• Unfortunately a serious incident occurred in May, with the serious injury of one of TIL’s drivers. TIL is supporting the driver and family and investigations are underway.
• Independent external review undertaken of Company’s safety management plan.
• Established a centralised safety team.
• Technology continues to form a key part of our critical risk controls, including in cab solutions to monitor driver fatigue and provide alerts.
• Priority focus in Q4 FY20 on COVID-19 response and protecting the health & safety of staff, contractors and customers.
28TIL Logistics Group FY20 Results Presentation
Winner of the Chartered Institute of Logistics & Transport Award for Implementation and Practice.

ENVIRONMENT• TIL is committed to the reduction of carbon emissions through our
membership of the Climate Leaders Coalition.
• CEMARS review completed in July 2019 (recertified in August 2020). Developed Emissions Management and Reduction Plan with annual targets for consumption.
• Carbon footprint is dominated by diesel fuel.
• Have established an improvement programme with hard targets to reduce carbon emissions.
• Forklift partnership with two major suppliers will see the gradual upgrade of our 500+ fleet over time to safer, more efficient and lower carbon emission equipment.
• Shift from fossil to alternative fuels is still evolving and is in the early stages.
• Partnership with Hiringa to investigate development of hydrogen cell fuel technology.
TIL Logistics Group FY20 Results Presentation 29
FY20 Greenhouse gas emissions
63,405tCO2e
Down 7% on FY19

PEOPLE• Experienced Board; appointment of Peter Dryden in FY20.
• Further changes to strengthen the Executive team. Establishment of a centralised HR team.
• Demanding year dealing with the impact of Covid 19, and the various impacts from Government policy, managing entitlements and leave issues.
• Industrial relations continue to be characterised by robust negotiations and interactions
• Number of recruitment programmes in place including being an accredited employer able to offer a pathway to NZ residency in order to address skill shortages such as drivers (two divisions currently accredited).
• Employee Engagement surveys planned to support diversity, culture and HR initiatives
• Free confidential counselling available to all employees for work and non-work concerns.
• Regular group-wide staff communications.
• Future planning for additional training to build skills and support internal promotion.
30TIL Logistics Group FY20 Results Presentation

OUTLOOK• Expect continuing challenges from COVID-19 with recessionary economic
conditions expected in FY21.
• Flow on effects will be felt for some time, and TIL retains a cautious outlook.
• COVID-19-related Government fiscal stimulus likely to support increasing freight volumes
• Global trend of businesses using 3rd party warehousing & logistics providers (3PL) such as TIL Logistics Group.
• Expect continuing high demand from food & beverage, aquaculture, viticulture and other primary industries.
• Speed of the recovery in the construction, retail and energy sectors remains uncertain.
• The current environment has demonstrated the benefits of being a group of scale, with the ability to invest into health & safety, training, systems and infrastructure. TIL Logistics is well positioned to take advantage of opportunities within the sector.
• The company confirms its view that EBITDA for FY21 is expected to be at least that of the FY20 result of $26.5m.
TIL Logistics Group FY20 Results Presentation 31

STRATEGIC PRIORITIES
32TIL Logistics Group FY20 Results Presentation
FREIGHT TURNAROUND• Continue turnaround programme• Priority focus on lifting margins
ORGANIC GROWTH• Expansion of Bulk Liquids into non-fuel sectors• Expansion Specialist services into a broader weight range• Optimise utilisation of MOVE’s new warehousing capacity
ACQUISITION OPPORTUNITIES
• Expand International offer and services
GROUP INITIATIVES
• Bundled customer solution• Build stronger connections between brands and businesses• Continued focus on ESG initiatives

CONTACT
Alan Pearson
TIL Logistics Group Limited
Chief Executive Officer
Tel: 021 806 678
Email: [email protected]
TIL Logistics Group FY20 Results Presentation 33
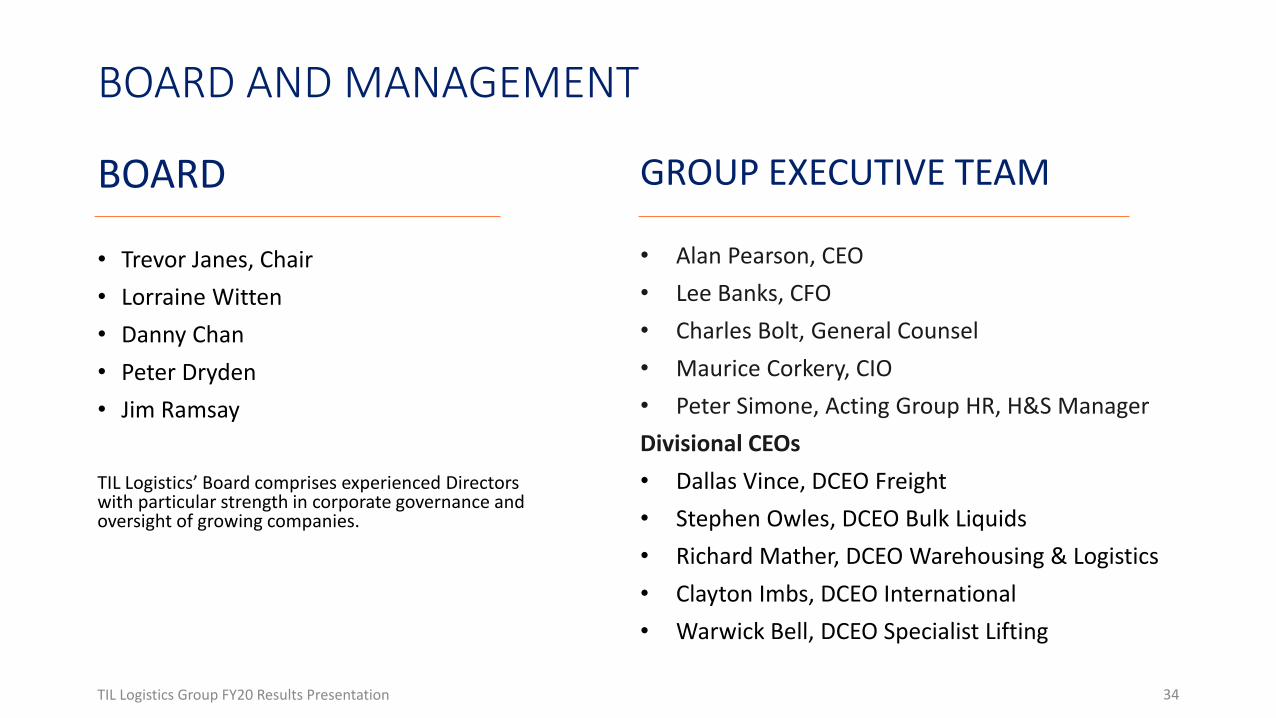
BOARD AND MANAGEMENT
BOARD
• Trevor Janes, Chair
• Lorraine Witten
• Danny Chan
• Peter Dryden
• Jim Ramsay
TIL Logistics’ Board comprises experienced Directors with particular strength in corporate governance and oversight of growing companies.
GROUP EXECUTIVE TEAM
• Alan Pearson, CEO
• Lee Banks, CFO
• Charles Bolt, General Counsel
• Maurice Corkery, CIO
• Peter Simone, Acting Group HR, H&S Manager
Divisional CEOs
• Dallas Vince, DCEO Freight
• Stephen Owles, DCEO Bulk Liquids
• Richard Mather, DCEO Warehousing & Logistics
• Clayton Imbs, DCEO International
• Warwick Bell, DCEO Specialist Lifting
34TIL Logistics Group FY20 Results Presentation

GLOSSARY• Non-GAAP financial information: TIL Logistics Group uses several non-GAAP measures when discussing
financial performance. These include Earnings Before Interest, Tax, Depreciation and Amortisation, Share of (Loss)/Profit of Associates and Impairment of Goodwill (EBITDA), adjusted EBITDA excluding non-trading costs and adjusted Net Profit/Loss After Tax (NPAT/NLAT) excluding non-trading costs. Management believes that these measures provide useful information on the underlying performance of TIL Logistics’ business. Reconciliations of the non-GAAP measures to GAAP measures, can be found in TIL Logistics Group’s Financial Statements that are available on the company’s website.
• EBITDA refers to Earnings Before Interest, Tax, Depreciation and Amortisation excluding income from associates. EBITDA is a non-GAAP profit measure.
• NPAT/NLAT refers to net profit/loss after tax.
• Adjusted EBITDA/Adjusted NPAT: Excludes non-trading costs associated with the reverse listing process which occurred in FY18, share based payments and the revaluation of deferred consideration for acquisitions. The Board believes this provides a better reflection of the company’s underlying performance.
35TIL Logistics Group FY20 Results Presentation

NON-GAAP RECONCILIATION$Millions FY20 FY19
Net profit before income tax (GAAP measure) 3.5 7.4
Add back:
Share of loss of associates - 0.4
Finance costs/(interest income) 11.8 4.1
Impairment of investment in associates 0.4 -
Bargain on acquisition (1.1) -
Depreciation & Amortisation 42.9 13.6
Deferred consideration and advisory costs expensed (0.2) 2.6
EBITDA (non-GAAP measure) 57.4 28.0
NZ IFRS 16 adjustments (30.9) -
Pre-NZ IFRS 16 adjusted EBITDA (non-GAAP measure) 26.5 28.0
36TIL Logistics Group FY20 Results Presentation

37
DISCLAIMER
This presentation has been prepared by TIL Logistics Group Limited (“TLL”). The information in this presentation is of a general nature only. It is not a complete description of TLL.
This presentation is not a recommendation or offer of financial products for subscription, purchase or sale, or an invitation or solicitation for such offers.
This presentation is not intended as investment, financial or other advice and must not be relied on by any prospective investor. It does not take into account any particular prospective investor’s objectives, financial situation, circumstances or needs, and does not purport to contain all the information that a prospective investor may require. Any person who is considering an investment in TLL securities should obtain independent professional advice prior to making an investment decision, and should make any investment decision having regard to that person’s own objectives, financial situation, circumstances and needs.
Past performance information contained in this presentation should not be relied upon as (and is not) an indication of future performance. This presentation may also contain forward looking statements with respect to the financial condition, results of operations and business, and business strategy of TLL. Information about the future, by its nature, involves inherent risks and uncertainties. Accordingly, nothing in this presentation is a promise or representation as to the future or a promise or representation that an transaction or outcome referred to in this presentation will proceed or occur on the basis described in this presentation. Statements or assumptions in this presentation as to future matters may prove to be incorrect.
A number of financial measures are used in this presentation and should not be considered in isolation from, or as a substitute for, the information provided in the TLL Listing Profile.
TLL and its related companies and their respective directors, employees and representatives make no representation or warranty of any nature (including as to accuracy or completeness) in respect of this presentation and will have no liability (including for negligence) for any errors in or omissions from, or for any loss (whether foreseeable or not) arising in connection with the use of or reliance on, information in this presentation.
TIL Logistics Group FY20 Results Presentation


