23
Investor Relations Rio de Janeiro 21 Feb 2011 4Q10 & FY2010 Rio de Janeiro, 21 Feb. 2011 Results Presentation

Investor RelationsRio de Janeiro 21 Feb 2011
4Q10 & FY2010Rio de Janeiro, 21 Feb. 2011Results Presentation

Agenda
Results in Summary – Luca Luciani
Turnaround Accomplished – Lorenzo Lindner
Financial Results 4Q10 – Claudio Zezza
Strategy – Rogério Takayanagi
Perspectives – Luca Luciani
1

2010 Summary
Customer Base
Q4 10Δ YoY
51 0 Mln
FY 2010Δ YoY
+24%
IFRS Brazil, R$ Mln GuidanceCompliance
Customer Base
Growth
• Market Share
• Incremental Market Share
+150 bps
51.0 Mln
25.1%
34.2%
+24%
EBITDA Margin
• Service Revenues
Net Revenues 3,926
30 6%
3,627
+9.9%
+20 bps
+6.0%
14,457
29 0%
13,572
+5.2%
+320 bps
+6.1%
EBITDA Margin
• EBITDA
• EBIT
• Net Income
30.6%
1,201
515
+20 bps
+10.7%
+46.4%
29.0%
4,194
1,200
2 212
+320 bps
+18,4%
+136%
+176%
Profitability
• Net Income
Operating FCF
• Cashflow (EBITDA – CAPEX)
• CAPEX
2,212
1,358
2 836
+176%
+62%
+4 9%
1,372 +110%
• CAPEX
• CAPEX as % of Sales
• Net Financial Position
• Net Debt to EBITDA
2,836
19.6%
984
0,23x
+4.9%
-10 bps
-700
2

Agenda
Results in Summary – Luca Luciani
Turnaround Accomplished – Lorenzo Lindner
Financial Results 4Q10 – Claudio Zezza
Strategy – Rogério Takayanagi
Perspectives – Luca Luciani
3

TIM Brasil – 2 years later
Fundamentals Strategy Achievements
• Top of Mind
• High Preference Low Rejection
Brand “Quality, Innovation, Convenience”
• High Preference, Low Rejection
• Inverted erosion trend both in Pre-paid
and Post-paid
L di g i t l k t h
Customer Base Leverage TIM Community
• Leading incremental market share
• ~2 x MOU vs Q1 09 (129 minutes)
• Leading Long Distance segment (volume)
• Infinity web: 4x daily unique users in 4
Drivers of Growth TIM’s value proposition distinctiveness:
• Voice: Long unlimited call concepts: “One Nation
One Tariff” (Long Distance) • Infinity web: 4x daily unique users in 4
months (prepaid)
One Tariff (Long Distance)
• Data: Unlimited concepts: foster smartphone
penetration in a “no subsidy frame”
• +18% Ebitda growth while Customer Financials Combine Growth with Profitability: • +18% Ebitda growth while Customer
Base +24%
• Boosting business generated (out-calls,
data) while reducing business received
(incoming)
Financials Combine Growth with Profitability:
• Revenues rebounded and re-mixed (out vs. in)
• Focus on cash generation
(incoming)
• EBITDA – CAPEX at R$ 1.4 Bln (+62% YoY)
Network • Integrate Intelig Network, and start a new
Turnaround• TIM’s leased lines cost flattish vs. MOU
and data jump
4
Turnaround
• Focus resources on core business
(Network vs. Commercial)
and data jump
• Intelig Revenues +37% YoY
• +50% GSM capacity vs. YE 2008
• 10x 3G cities covered

Brand Repositioning – Preference and Top of Mind
Brand Preference
ΔYoY
Top of Mind
%
2523
2122
25
28Preference#1
#328
25
3130
29
27
+6pp
-2pp
ΔYoY
Player 1
15 16
15 15 #4
25
2223
2122
20
2pp
-2pp
2
18106
Player 2
Player 3
11 10
1H08 2H08 1H09 2H09 1H10 2H10
Rejection #1 20 20 -2pp
2009 20102008
y
H1 08 H2 08 H1 09 H2 09 H1 10 H2 10
233939Network
#1
YE’10Innovation and OfferingPreference
YE’10Rejection:YE’10 TIM
P1P2
2828 151617
23Quality
Innovation
#1
#1
P2P3
232425
40TIM
P1P2
P3
43
2020
5
10
15
20
25
30
1014
156
2
4
6
8
10
12
14
16
18
5
Convenience #1212223
43TIM
P1P2
P3
Source: Image Survey 13° wave, November/10
0 0
Player 1Player 2 Player 2Player 3 Player 1 Player 3

Customer Base Market Share Recovery
51 0 L d i I l
Mln lines EoP, % % lines EoP
Customer Base– Inverted erosion trend Market Share (Total and Incremental)
33 8 35.2 36.4 36.137.8
39.641.1 42.4
44.446.9
51.0 30.9%
25.9%
25 0%25.4%25.1%
29.7%
Leader in IncrementalShare 2010 (%)
11%25%30%34%
0
0
0
0
0
0
0
Incremental Market Share
Vivo
Claro32.5 33.8 35.2 25.0%
17.9%19.4%
2007 2008 2009 2010
0
0
TIM Vivo Claro Oi27%17% 18%
12%-10%
29% 27%19%
24%
34% 40% 36%
Inversion of Market Share erosion trend
Claro
Oi
23.6%24.2%
Q1 08 Q2 08 Q3 08 Q4 08 Q1 09 Q2 09 Q3 09 Q4 09 Q1 10 Q2 10 Q3 10 Q4 10
Customer Base Quality (Postpaid Base and Bad Debt)Commercial EfficiencyR$
2007 2008 2009 2010
Mln lines, % of Gross Total revenues, mobile
54
85
6.8 6.8 6.86.6
6.2 6.2 6.36.5
6.66.9
7.27.5
6%3.2
SAC*
SAC*/
Inversion of High Value Base erosion
trend
~ +20%~ -10%
-36%
Q1 08 Q2 08 Q3 08 Q4 08 Q1 09 Q2 09 Q3 09 Q4 09 Q1 10 Q2 10 Q3 10 Q4 10
5%3% 3% 3%
2% 2% 2% 2% 2% 1% 1%
2.3
3.2 SAC*/ARPU
trend
Bad debt% Gross Rev.
-29%
6
2009 2010
*SAC = Subsidy + Commision + AdvertisingNote: Bad Debt/ Revenues – BRGAAP for 2008 and IFRS Brazil for 2009 and 2010
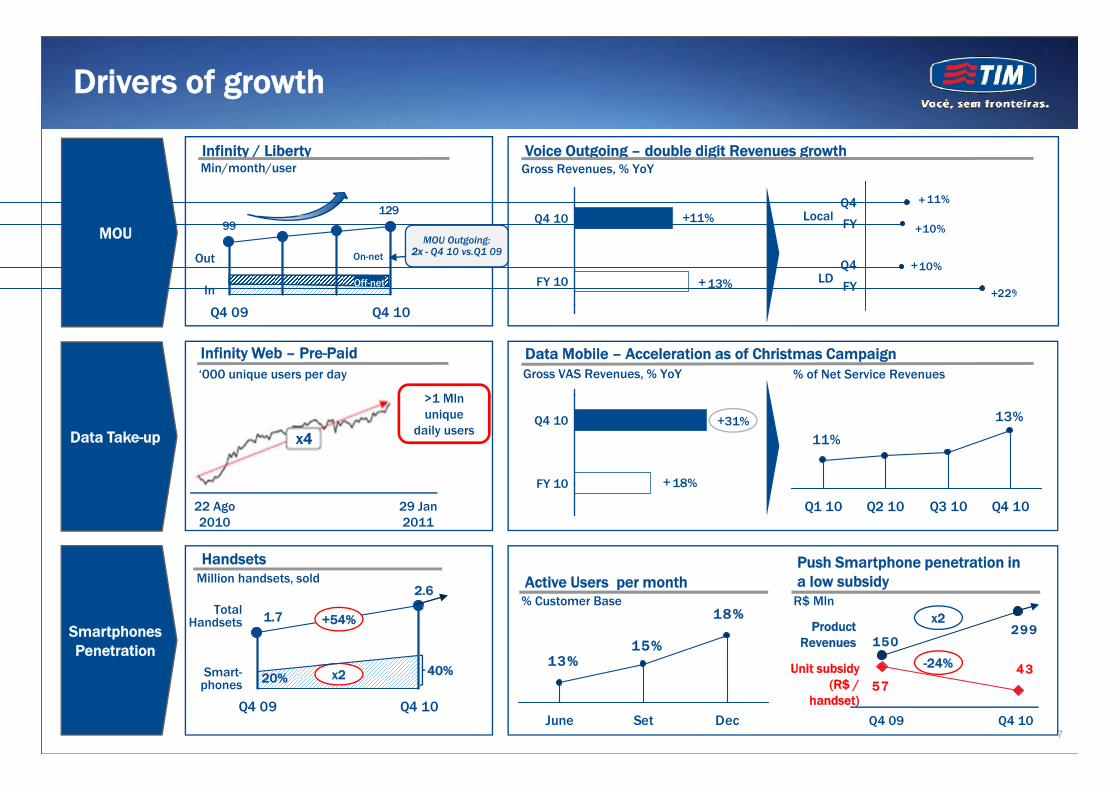
Drivers of growth
Infinity / LibertyMin/month/user
129
Voice Outgoing – double digit Revenues growth
11%Q4 10
Gross Revenues, % YoY
11%
LocalQ4
++
99
0
20
40
60
80
100
120
140
In
Out
13%
11%Q4 10
FY 10
MOU MOU Outgoing:2x - Q4 10 vs.Q1 09
22%
10%
10%Local
LD
FY
Q4
FY
+
+
+
+
+
On-net
Off-net
Infinity Web – Pre-Paid‘000 unique users per day
>1 Ml
Q4 09 Q4 10
Data Mobile – Acceleration as of Christmas CampaignGross VAS Revenues, % YoY % of Net Service Revenues
x4
>1 Mln unique
daily users
18%
31%Q4 10
FY 10
Data Take-up13%
11%
0
0
0
0
0
0
+
+
HandsetsMilli h d t ld
22 Ago 2010
29 Jan 2011
18%FY 100
Q1 10 Q2 10 Q3 10 Q4 10
+
Push Smartphone penetration in
150299
431
2
2
3
3
Total Handsets 1.7
2.6Million handsets, sold
SmartphonesPenetration
Active Users per month% Customer Base
+54%
U it b id
Product Revenues
x2
-24%
a low subsidyR$ Mln
18%
15%13% 0
0
0
0
0
0
7
43570
1
Q4 09 Q4 10
Smart-phones
40%20% x2 Unit subsidy(R$ /
handset)
24%
Q4 09 Q4 10
13%
0
0
0
0
0
June Set Dec

Revenues and Profitability
Net Revenues, R$ Bln EBITDA, R$ Bln
Revenues EBITDA and Margin %
IFRS Brazil
Total Revenues
EBITDA Margin %
4.2 12 7
13.614
15
15
13.714.4 +320bps+5.2%
29,0%
25,8%
+6.1%
EBITDA3.5
2009 2010
12.7
11
12
12
13
13
14
2009 2010
ServiceRevenues
+18%
R$ BlnR$ Bln
Cashflow (EBITDA - CAPEX) Net Financial Position
2009 20102009 2010
6%9%
1.361
2
R$ BlnR$ Bln
% of Net Revenues
0.47x
0.23x Net Debt /
EBITDA1.68
62%0.84
1
1
1
1
1
1
1
1
1
1
2009 2010
EBITDA -CAPEX
Net Debt0.98
0
1
1
1
1
1
2
-0.7+62%
8
2009 2010 2009 2010Operating
FCF 654 1,372+110%

Strenghtening Network Infrastructure
2G - Capacity# ‘000 TRX
CAPEX MixR$ Bln
2.7 2.8
IFRS Brazil3G – Coverage
Capital
Infrastructure
Commercial
120
67% 81%
19%33%
+50% 210
54%32%19%% urban
populationg
Capital allocation
CAPEX/ 60
70
80
90
100
110
2009 2010
19 7% 19 6%
# cities
5723
coverage
Intelig Revenues RevampingIntelig successfully integrated
CAPEX/ Sales
Network Opex Efficiency
2008 2009 201019.7% 19.6%
2008 2009 2010
YoY growth; 2010 vs 2009 Network and ITX Cost (R$ Bi, % YoY)
37%
29%26%
g ; ( , )
+ +
+
+0.3%Annual(4,227)
> 16.000 km backboneMAN at 15 cities
15%+
+0.1%4Q10 (1,084)
9
Q1 Q2 Q3 Q4

Agenda
Results in Summary – Luca Luciani
Turnaround Accomplished – Lorenzo Lindner
Financial Results 4Q10 – Claudio Zezza
Strategy – Rogério Takayanagi
Perspectives – Luca Luciani
10

Switching towards IFRS
Q1 Q2 Q3 Q4 FULL YEAR
Mln R$2010 2009
abs. YoY
% YoY 2010 2009abs. YoY
% YoY 2010 2009abs. YoY
% YoY 2010 2009abs. YoY
% YoY 2010 2009abs. YoY
% YoY VS. Guidance
Net Revenues 3.296 3.198 98 3,1% 3.559 3.512 47 1,3% 3.677 3.466 211 6,1% 3.926 3.571 354 9,9% 14.457 13.747 710 5,2%
of which Services 3.176 3.009 167 5,6% 3.350 3.144 206 6,6% 3.418 3.213 205 6,4% 3.627 3.422 205 6,0% 13.572 12.788 784 6,1%
of which Handsets 120 189 (69) -36,7% 209 368 (159) -43,2% 259 253 6 2,3% 299 150 149 99,6% 886 959 (73) -7,6%
EBITDA 947 715 232 32 5% 1 010 864 146 16 9% 1 035 877 158 18 1% 1 201 1 086 116 10 7% 4 193 3 541 652 18 4%
IFRS *
>5%
EBITDA 947 715 232 32,5% 1.010 864 146 16,9% 1.035 877 158 18,1% 1.201 1.086 116 10,7% 4.193 3.541 652 18,4%
Ebitda Margin % 28,7% 22,4% 28,4% 24,6% 28,2% 25,3% 30,6% 30,4% 29,0% 25,8%
Capex 689 322 368 114,4% 520 535 (15) -2,7% 526 692 (166) -24,0% 1.100 1.154 (54) -4,7% 2.836 2.702 134 4,9%
EBITDA - Capex 258 393 (136) -34,5% 490 329 161 49,0% 509 185 324 175,5% 101 (68) 169 -247,8% 1.358 839 519 61,9%
>4 Bln
~3 Bln
Consistency in Growth/ Profitability Improvement during the Quarters
Q1 Q2 Q3 Q4 FULL YEAR
Mln R$2010 2009
abs. YoY
% YoY 2010 2009abs. YoY
% YoY 2010 2009abs. YoY
% YoY 2010 2009abs. YoY
% YoY 2010 2009abs. YoY
% YoY
Net Revenues 3.269 3.174 96 3,0% 3.531 3.486 45 1,3% 3.648 3.440 208 6,1% 3.894 3.542 352 9,9% 14.342 13.641 701 5,1%
of which Services 3.146 2.985 161 5,4% 3.317 3.118 199 6,4% 3.387 3.186 201 6,3% 3.592 3.386 205 6,1% 13.442 12.675 767 6,1%
of which Handsets 124 189 (65) -34,5% 213 368 (155) -42,1% 261 254 7 2,8% 303 156 147 94,4% 900 967 (66) -6,8%
EBITDA 810 618 191 30,9% 887 764 123 16,1% 924 772 152 19,6% 1.132 982 150 15,3% 3.752 3.136 616 19,6%
Ebitda Margin % 24,8% 19,5% 25,1% 21,9% 25,3% 22,5% 29,1% 27,7% 26,2% 23,0%
Br Gaap
*
>25%
>5%
11
g 24,8% 19,5% 25,1% 21,9% 25,3% 22,5% 29,1% 27,7% 26,2% 23,0%
Capex 576 201 375 186,7% 436 429 7 1,6% 463 541 (78) -14,3% 1.072 1.003 69 6,8% 2.547 2.174 373 17,2%
EBITDA - Capex 234 418 (184) -44,0% 450 335 116 34,6% 461 232 229 99,0% 60 (22) 81 -376,0% 1.205 962 243 25,2%
* 2009 IFRS includes Intelig ProformaNote: Key difference between BRGAAP and IFRS is in the capitalization of handsets subsidy.
~2.5 Bln

Revenues Analysis
Outgoing voice double-digit solid growth (FMS)Gross Service Revenues
IFRS BrazilQ410 vs. Q409FY10 vs. FY09
7,8%19%
9%
30%
10%8,2%
TIM Intelig Total
Outgoing voice double digit solid growth (FMS)
Data take-up over 30% YoY in Q4
Intelig accelerating
YoY Growth, %
++ +
+
+
+
g
Acceleration of handsets sales to support data roll-out (small-screen browsing)
Higher discounts to support SIM-only strategy in
Mobile
Voice Data
Voice In Others
+ + ++
13% 18%31%
11%
postpaidVoice Out
Data
Net Revenues Service Revenues
-11%-8%
-41%
-6%
5.2%9.9%
Net Revenues
Total Net Revenues ++
YoY Growth, %
Service RevenuesYoY Growth, %
8.5%9.5%
Gross +
+
+
+
-7.6%
Handsets +99.6%15.1%
19.4%Taxes and discounts
+
+ +
12
6.1%6.0%Service
++
6,1%6.0%Net
+
+

Efficiency
Min/month, Mln R$ R$/ Gross add Mobile
Network Efficiency SAC
IFRS Brazil
% YoYMin/month, Mln R$
MOU
R$/ Gross add, Mobile
Network and
3.8 3.1 3.1 3.0 3.1
2.6 2.3 1.5
SAC*/ARPU99 100
110123 129
1.084 1 022 1 045 1.075 1.085
+30%
+0%
% YoY
ITX costs101 83 82 81 75 63 55 36
Q1 Q2 Q3 Q4 Q1 Q2 Q3 Q4
SAC*
1.084 1.022 1.045 1.075 1.085
4T 1T 2T 3T 4T
20102009
ProfitabilityBad Debt
Q1 Q2 Q3 Q4 Q1 Q2 Q3 Q420102009
1 222%
25%25%
30% 29% 28% 28%31%
R$ Bln, % Total Net Revenues
EBITDAMargin
% Gross Total Revenues
1 9%2.0%2.2%2.3%
3.2%
0.70.9 0.9
1.1 0.9 1.0 1.01.2
EBITDA
1.3%1.0%
1.9%2.0%1.7%
13
Q1 Q2 Q3 Q4 Q1 Q2 Q3 Q420102009
Q1 Q2 Q3 Q4 Q1 Q2 Q3 Q420102009
*SAC = Subsidy + Commision + 100% Advertising

Profitabilty and Cash Generation
Net Financial Position – Dec10
R$ Mln Cash
EBITDA Evolution (in R$ Mln)
- 42%+984
-274 -108 -12
+61
2,079
-1,252
1563 5414,194+18.4%
1,684, 156
984Oper FCF Non-Oper
FCF
3,541 18.4%
Q4 09 Q3 10 Q4 10
2,559 1,369 2,394
EBITDA 2009
25.8% 29.0%
EBITDA 2010
Business Generated +
Handsets
Business Received
(incoming)
Commercialexpenses
Network expenses
G&A + Others
expenses
+320Bpsp
R$ 3.38 bln (73% long term)
~22% of debt denominated in foreign currency (100% hedged against FX variation)Gross Debt
14
~22% of debt denominated in foreign currency (100% hedged against FX variation)
10.1% in Q4 10 vs. 9.67% in Q4 09 and 10.0% in Q3 10Average Annual Cost

Net Income and Proposed Dividend
Net Profit Proposed Dividend for 2010**
IFRS Brazil
Net Profit Proposed Dividend for 2010
497
R$ MlnR$ Mln2,212
+143%
777
171204+19%
5x
Total
Organic
801
129Tax
credit1,435Organic
Extraordinaryeffect
Taxcredit
Intelig* (564 mln)
672
2008 2009 2010
EPS 0,11 0,13 0,20
2009 2010
15*FX gain due to unhedged debt ** To be deliberate in the next Shareholder’s Meeting

Agenda
Results in Summary – Luca Luciani
Turnaround Accomplished – Lorenzo Lindner
Financial Results 4Q10 – Claudio Zezza
Strategy – Rogério Takayanagi
Perspectives – Luca Luciani
16

Brazil, a large and fast growing country
Gross Domestic Product (GDP)
US$ Tln 2010 Mln people
Middle Class Expansion
14.6
US$ Tln, 2010
13 20 31
200188175
A/B
Mln people
>4.8
Family Income(K R$/ month)
Expected to slow down to 4,5/5% in
2011
Possible impact from Govermt. saving program
of R$50bln
# 8
2.02 2.04 1.52.32.63.35.45.7
1.647
44
66 95 113
13
40
C
A/B
D
>4.8
1.1 –4.8
0.8 – 1.1
+3% +10% +3% +3% +2% +2% +1% +8% +3% +4%
4929 16
40E
2006 2009 2014< 0.8
USD 2 Trillion Gross Domestic Product 200 million people with average age 29 years oldUSD 2 Trillion Gross Domestic Product
+8% growth in 2010
~5% expected growth/ year for next years
200 million people with average age 29 years old
- Demographic bonus for next 10 years
- Middle-class explosion
• Class C behavior: An attractive country that
requires innovation on
17
- Very high willingness to use (everything)
- Willingness to pay (depends on new purchasing scheme)Go-To-Market to attack
emerging Class C/D people

TLC market driven by Mobile
Brazilian Telecom MarketCAGR 2010-2013
R$ BlnΔ R$ Bln13 vs. 10
+10+3-4%
CAGR 10-13Mobile
VOICE+5/7%
+40/45%
+6/8%
Incremental Revenues
120115
110 TotalDATA
Competitive positioning TIM
TIM: no trade-off in FMS
. More competition
. MTR reduction
51 55 62Mobile+11Broadband
FIXED
+20%
+40/45%
~25%
(voce)
Large room for growth in Mobile Internet access(data) for all (Class C
Mobile Attractiveness
50 48 42FixedVoice
-8
MOBILE
Fixed
FIXED (data) for all (Class C opportunity)
No brakesfor FMS
9 11 16
2010 2011 20132010 2011 2013
Voice
FixedBB
+7
Fixed
- 2%
VOICE -6%DATA
+20%Selective Intelig attack toCorporate/ SME segments(access, clouding)
Selected opportunities
(Big cities only)
18
2010 2011 20132010 2011 2013
* BRL/US$ = 1,70

Telecom expected dynamics
Acceleration of Fixed-Mobile Substitution
R$ / minute, voice
Difficulties to upgrade from BB fixed lines legacy
• Limited incumbent capability to upgrade
Annullement of mobile
price premiumMobile
<2
to adsl infrastructure:~ 5Km distance fromcentral switch
0.42 0.34
0.41 • Geo/demographic limit fi d BB i
5%
Fixed
% users per speed range, MBpsLow Speed Internet
>8 Mbps0 20 0.23
0.27 0.27
0.27 0.26 0.22
fixed BB expansion (very CAPEX intensive)
5%
77%
18%Between
2 e 8 Mbps
p
<2 MbpsQ3 10
0.20
2006 2007 2008 2009
Pure mobile has no trade-off between growth and Fixed cannibalization Difficult of fixed ops to combat FMS
Likely increase of competition in 2011 will further pressure mobile tariffs:
- Integration/Turn-around of
Need to access public funds to invest in broadband expansion
Likely to pressure for MTR cuts ( ibl glid th t ti g f id
19
existing players
- Launch of 5th national player
(possible glide path starting from mid 2011 with 10-20% reduction)

Strategy
Customer BaseSubscribers EoP Mln
Expected ResultsRationals
Natural expansion of TIM Subscribers EoP, Mln
Community matters(Size)
pCommunity pushed by word of mouthWin-back in selective 41
51
MOUMin/line/month, Average
geographic areas
Push FMS(TIM’ di ti ti i )
Price per minuteR$/min
2009 2010 2013
0.27 0.27
0 22 0.26
0.27
0.41
0 23
0.34
0.42
11683
> x2No brake for FMS
(Usage)
(TIM’s distinctiviness)Keep innovation as part of core business (push Infinity concept)
Mobile
Fixed0.22 0.23 0.20
2009 2010 2013
Digitalize the Foster webphone/ smartphone penetration
Q3 102009200820072006
Data RevenuesUnique usersInifinity Web daily unique users
1,8
13%
g ta e t einclusion of
TIM Community
(Data)
smartphone penetration Drop data price to leverage untapped demographic segment
x4> 1 Mln Infinity
Web
% on Service Revenues
DataRevenues
20
2009 2010 2013
( )LAN House substitution 22 Ago 10 29 Jan 11 (bln R$)

Agenda
Results in Summary – Luca Luciani
Turnaround Accomplished – Lorenzo Lindner
Financial Results 4Q10 – Claudio Zezza
Strategy – Rogério Takayanagi
Perspectives – Luca Luciani
21

TIM Brasil Conclusions
TIM Brasil tomorrowAttractiveness BrazilTIM Brasil 2010
4151
Bln R$, Mln lines
ServicesRevenues
Growth
5141
Customer BaseSubscribers EoP, Mln
Commu-nity “More
12.713.6
41
2009 2010
#3 Country on GDP growth*
Revenues
Customer Base
MOUMin/line/month, Average
09
mattersMore
people”10 11 12 13
25,8%29,0%
11683#4 worldwide Mobile Market
Profitability% of service revenues
EBITDA %
FMS “Talking More”
09 10 11 12 13
Internet users‘
19,6%19,6%
2009 2010
CAPEX% Data “Connected”
Internet users000 unique users
x4
22 Ago 29 Jan
25 FebruaryIndustrial Plan
2009 2010
Turnaround Accomplished
Company Repositioned
Opportunity of Brazilian mobile market
development
Competitive advantage for Pure Mobile
Perspectives
Revenues: Keeping the pace
22 Ago 2010
29 Jan 2011
22
Back to growth
Increasing profitability
Competitive advantage for Pure Mobile Ebitda: High single digit growth
Capex over Sales: Slight decrease
* Absolute growth: delta PIB 2010 – PIB 2009


