Time-activity pattern observatory from mobile web logs
Chao Wu* and Bin Xu Department of Computer Science and Technology, Tsinghua University, Beijing, China Email: [email protected] Email: [email protected] *Corresponding author
ShanShan Shi and Bin Zhao Department of Building Science, Tsinghua University, Beijing, China Email: [email protected] Email: [email protected]
Abstract: Air pollution has become a striking problem in recent years. When estimating the degree of human exposure to a particular air pollutant, time-activity pattern is one of the most important factors, which is able to quantify the time people spend in different micro-environments, such as indoor and outdoor. Traditional surveys use the method of questionnaires and telephone calls to explore the time-activity pattern. In this paper, we propose a novel method to analyse the time-activity pattern by utilising mobile web usage log. We test the method on two datasets covering about four million users. Experiments show that our method achieves an acceptable performance, and can truly measure the time-activity pattern of human beings.
Keywords: air pollution; time activity pattern; human exposure; micro-environments; mobile web log.
Reference to this paper should be made as follows: Wu, C., Xu, B., Shi, S. and Zhao, B. (2015) ‘Time-activity pattern observatory from mobile web logs’, Int. J. Embedded Systems, Vol. 7, No. 1, pp.71–78.
Biographical notes: Chao Wu is Bin Xu’s Master student.
Bin Xu received his PhD, Master and Bachelor in DCST of Tsinghua University in 2006, 1998 and 1996 respectively. He is an Associate Professor in the Department of Computer Science and Technology of Tsinghua University. He became an ACM professional member in 2009 and IEEE member in 2007. His research interests include semantic web service, body area network and data mining.
ShanShan Shi is Bin Zhao’s PhD student.
Bin Zhao received his PhD and Bachelor degrees from Tsinghua University, 1997, major in Heating, Ventilating and Air Conditioning Engineering. He is a Professor in the Department of Building Science, School of Architecture, Tsinghua University. His research interests include indoor aerosol dynamics, computational fluid dynamics (CFD) simulation of fluid flow and heat/mass transfer in built environment and services, air cleaning technology and ventilation.
This paper is a revised and expanded version of a paper entitled ‘Time-activity pattern observatory from mobile web logs’ presented at the International Workshop on Mobile Internet Big Data (IWMBD 2014), Optics Valley Kingdom Plaza, Wuhan, China, 26–28 May.
72 C. Wu et al.
1 Introduction
Air pollution has become a striking problem all over the world in recent years. Multiple air pollutants, including particulate matter (PM2.5), ozone and various chemicals, are introduced into human beings’ daily life owing to the increasing energy consumption, development of industry, usage of manufactured chemicals and so on. Human beings are exposed to various air pollutants all the time in all space and suffered from health risks. A study on global burden of disease (Lim et al., 2013) has indicated that indoor air pollution and atmospheric particle pollution ranked the 3rd and 7th place of the risk factors contributing to the burden of disease in 2010, respectively. It is also claimed (Samet et al., 2000) that fine particles are responsible for death due to all causes as well as cardiovascular diseases in 20 US cities from 1987 to 1994. Moreover, toxicologists have demonstrated that some ubiquitous air pollutants, such as polycyclic aromatic hydrocarbons (PAHs) and phthalates, are responsible for causing cancers, gene mutation and reproductive problems (Bostrom et al., 2002; Armstrong et al., 2004). Hence, protecting human beings from air pollution is urgent and crucial. Air pollutants undergo a complicated series of reactions when transporting from outdoor to indoor environments, together with the intricate indoor sources of air pollutants, leading to the difference in pollution level between indoor and outdoor environments. Thus, time-activity pattern is one of the most important exposure factors when assessing exposure to a particular air pollutant of human beings, which quantifies the fraction of time people spending in different micro-environments.
Since the time-activity pattern is critical to evaluate the exposure to air pollutant, many researches have been done to study the time-activity pattern. The time-activity pattern is not about one person’s activity, but about a certain population’s activity lasting for a relative long time (such as one year). What is more, the time-activity pattern varies from city to city. For example, the people in Sanya stay more time outdoor than in Harbin. Then, how to get the exact time fraction of activities for a period of time? The traditional way is through surveys (Chen et al., 2012a, 2012b; Wiley et al., 1991a, 1991b; Leech et al., 1996, 1999; Klepeis et al., 2001). Researchers use questionnaires and telephone interview to explore the time-activity pattern of different populations (about several hundreds to thousands of people), and get the statistical results. Researchers also used questionnaires for survey in different cities. However, survey is too subjective to record people’s activity. It is very hard for people to memorise the exact time fraction of activities for several days or months. Besides, the sample size of survey is not large enough to reflect a population’s activity. So far, there are normally several hundreds or thousands respondents in one city for the survey. Comparing to a city with a population of several million people, the sample size of respondents may not be large enough. Last but not least, survey is a time-consuming and money-consuming way.
The big data from mobile phone provides a new possibility to analyse the time-activity pattern. Nowadays,
almost every person brings a mobile phone with himself/herself and moves in the city. The moving or staying of the mobile phone can reflect the time-activity pattern of the person, such as the time spending in residences, working places, restaurants, bars, or vehicles. Through the automatic interaction between the cellular towers and mobile phones, the towers record the logs of connections of each cellular phone. The challenge is that the tower’s location is the approximate location of people rather than the people’s real locations. In this paper, we explore the time-activity pattern from mobile web log (HTTP requests and responses), combining with POI information and road network information. The result of our method achieves an acceptable performance. Comparing to the results of survey research, our method achieves three benefits. Firstly, the cellular phone’s record is more objective and is more credible than people’s memory. Secondly, the sample size of our method is much bigger. We analyse the mobile web log covering five million mobile phone users, which is almost one fourth of the city’s population. Thirdly, our method costs less time and money.
The contributions of the paper include:
1 a novel method is proposed to analyse time-activity pattern by utilising mobile web usage log
2 a new approach is presented to estimate the moving status of people.
The rest of this paper is organised as follows: In Section 2, we describe recent related work on time-activity pattern analysis. In Section 3, we give an overview of the data we use, and describe some important characteristics of the data in several aspects. Section 4 describes the method we use for time-activity pattern analysis in detail. Section 5 describes the experimental results applied to our dataset, and gives detail analysis on the result. Finally, we conclude this paper in Section 6.
2 Related work
A lot of researches have been done by other researchers. Chen et al. (2012a) have evaluated the association between the ozone mortality and the total ozone exposure, accounting for the exposure occurring in both indoor and outdoor environments. It turned out that total exposure can partially reflect the intercity difference of ozone mortality coefficient, implying that total exposure, considering the difference between indoor and outdoor, is more reasonable to assess health risks than atmospheric pollutants concentrations. This conclusion has also been validated for PM10 (particles with aerodynamic diameter smaller than 10 μm) by Chen et al. (2012b). The USA and Canada has conducted nationwide surveys, CAPS (Wiley et al., 1991a, 1991b), CHAPS (Leech et al., 1996, 1999) and NHAPS (Klepeis et al., 2001), of time-activity pattern from 1980s. All of the surveys utilised the method of diary and telephone interview to explore the time-activity pattern of different populations. Time-spent distribution in residences, working
Time-activity pattern observatory from mobile web logs 73
places, restaurants and bars, vehicles, other indoor and outdoor environments of the target population were analysed based on the surveys. Duan et al. (2013) have promoted a nation-survey of exposure factors in China recently and collected time-activity pattern of people from every province by questionnaires. However, it is suspected that time-activity pattern resulting from these methods may be too subjective to reflect the real conditions. Human’s memory can be influenced by enormous effects and may not be reliable enough to show the accurate time distribution in different micro-environment. Additionally, surveys based on a large population can be quite time-consuming and cost lots of money. Our method studies time-activity pattern from mobile web usage, which is both efficient and economic.
As the mobile web takes more and more proportions of people’s total web usage, study of mobile web user behaviour also gains a great attention recently. Cui and Roto (2008) describe how people use the web on mobile devices by contextual inquiries, and analyse contextual factor as well as user activity patterns. Tseng and Lin (2006) mine user behaviour patterns in mobile web systems based on location trace, and do experiments using simulation. Liu et al. (2013) propose a data flow testing approach for web service compositions based on OWL-S. Phatak and Mulvaney (2002) propose a fuzzy clustering method on URLs and users based on a distance matrix, and further do user profiling and recommendation. Hashimoto et al. (2012) propose an effective measure to automatic determine the appropriate number of topics on social media. Do and Gatica-Perez (2010) mine user pattern through mobile app usage and web usage. Wang (2013) investigates the effects of social network sites on learning satisfaction and learning performance of college students. Verkasalo (2009) analyses contextual patterns in mobile service usage statistically, using handset-based data which includes location and web usage data. Most of the studies use mobile phone collected data, and hardly analyse the time-activity pattern. Our method mines time-activity pattern in mobile web usage from the mobile network service provider’s perspective, which is both comprehensive and large-scale.
3 Data description and task definition
The data we use is the mobile web usage log (HTTP request log) of the cellular network (including 2G and 3G) of a mobile operator. The dataset covers the geographical range of Beijing, the capital of China. The data we use covers two urban districts, with an area of approximately 40 square kilometres. The area contains a major set of attractions, as well as one of the busiest business districts of the city. We own two datasets called dataset1 and dataset2. The time range of dataset1 is from October 24 to November 14, 2012, and the time range of dataset2 is from June 8 to June 20, 2013. Each row in the dataset corresponds to a HTTP request/response pair occurred using cellular network.
• Overview. There are totally 681,769,452 complete records in dataset1, and 1,344,654,257 complete records in dataset2.
• Users. There are 3,983,554 distinct users appearing in dataset1, and 4,084,230 distinct users appearing in dataset2. The average number of requests per user of each dataset is 171.14 and 329.23.
• Locations. 2,422 distinct cellular locations appear in dataset1, and 3,134 distinct cellular locations appear in dataset2.
For each row of the data, the mobile web logs can be formalised to:
• [userID, phoneID, time, towerID, host, agent]
• [towerID, latitude, longitude].
Besides the mobile web logs, other input data includes POI (point of interest) information and road network information. Then, the task of our research is to analyse the time fraction of indoor and outdoor (walk or in vehicle) for all the cellular users in the dataset.
4 Analyse time sequence
In this section, we cover the details about how we get time-activity pattern from mobile web usage log. First of all, we give some formal definitions of the concepts.
Definition 1: Time sequence: A time sequence represents one person’s whole mobile web usage log in one day. One log includes a time point and a cellular location, so we use a tuple (l, t) to represent a log, t is a time point and l is a cellular location. A time sequence can be expressed as
( ) ( ) ( )1 1 2 2, , , ... ,n nl t l t l t
4.1 Data preprocess
Definition 2: Continuous action: If people do one thing over a period of time, we define this as a continuous action. For example, a person goes to work by bike from 7:50 to 8:25, stays at office from 8:25 to 11:40, and has lunch from 12:10 to 12:45. These are three continuous actions.
The mobile web usage logs last for a day or several days, so a time sequence may contain several continuous actions. In one time sequence, the adjacent log may share a same cellular location, we can merge these logs into one record.
Definition 3: For a time sequence:
( ) ( ) ( )1 1 2 2, , , ... ,n nl t l t l t
If
1i i i ml l l+ += = =
we merge
( ) ( ) ( )1 1, , , ... ,i i i i i m i ml t l t l t+ + + +
74 C. Wu et al.
into (li, pi). We call pi time period, it is the time between time point ti and ti+m.
Before we analyse one time sequence, we find that a person’s cellular location may change very frequently in a short time period. This is because he is close to two cellular towers. In one time, he surf the web from one cellular tower, while in the next time the cellular tower is switched. Though he does not move, his cellular tower log changes. So, both towers should reflect people’s one location.
Definition 4: For a time sequence:
( ) ( ) ( )1 1 2 2, , , ... ,n nl p l p l p
If
1 3 2 1 2 4 2,m ml l l l l l−− = = = = =
and the distance between l1 and l2 is less than 500 metre. We define l1 and l2 are switched towers, and merge
( ) ( ) ( )1 1 2 2, , , ... ,n nl p l p l p
into 1 1( , ),l p′ 1p′ is a time period form time point t1 (the beginning of p1) to time point tn (the end of pn).
4.2 Distinguish home and working place
Now, we have a processed time sequence, and it is a series of continuous actions, how to identify each continuous action is an important task. First, we want to find this person’s home and working place. We assume that people will show a regular action in a long time, i.e., in a month, so we can analyse which tower that people stay frequently at night and in the daytime.
Definition 5: At houri, dayj, the time duration that person spend in towerk is defined as ti,j,k, where i is from 0 to 23. For example, in the first day, from 9:30 to 9:50, a person stays in the 5th tower, then T9,1,5 is 20 minutes. The average time people spend in towerk, houri
, ,1,
dayNi j kj
ι kday
TT
N==
∑
while Nday is the count of days.
Definition 6: For each i, if
,, 0.5 hour,ι kk T∃ >
we define towerk the most often appearing tower in houri:
i kMOAT tower=
For people’s action is regular in a long time, so the tower people stay most at night must be his home, the tower he stays most in the daytime must be his working place.
After we get people’s home and working place, we can easily tell the at-home action and at-office action in the time sequence, and calculate the time duration of home and working place.
4.3 Find other indoor environments
If a person is neither at home nor at office, but he stays at one location for a long time, how to judge he is indoor or outdoor? Since the location is only the tower’s location, not person’s real location, our idea is to judge according to the tower’s surrounding environment.
The radius of a cellular tower is about 250 metre, and people’s walking speed is about 5 km/h, which means a person needs about three minutes to walk away from a cellular tower. So if a person stays in a cellular tower longer than this time, we define he has a possibility to be indoor. To get this possibility, we use POI information.
POI is point of interest in short, which is a specific point location that someone may find useful or interesting. We use the term to refer to hotels, campsites, fuel stations or any other categories.
There are 21 main categories in our POI, shown in Table 1. We give a label to each category, label 0 means this category is mainly indoor environment, label 1 is mainly outdoor environment. So we can calculate the probability like this
the number of POI with label 1
the number of POI with label 0 and 1P = ∑∑
The probability multiplies the time duration people spend in one place is the expected indoor duration.
Table 1 Twenty-one main categories in our POI information
Sights Class unknown Place name address information
Auto repair Accommodation Government agencies and community groups
Road ancillary facilities
Auto sales Automotive services
Science, education and cultural services
Sports and leisure services
Corporate
Financial and insurance services
Business residential
Transportation facilities services
Living services Catering services Shopping service
Public facilities Healthcare services
Motorcycle service
Time-activity pattern observatory from mobile web logs 75
Figure 1 Cellular towers’ distribution around (a) Tsinghua University and (b) SanLiTun (see online version for colours)
(a)
(b)
Figure 2 Cellular towers’ distribution around (a) ZhongGuanCun and (b) WangFuJin (see online version for colours)
(a)
(b)
4.4 Estimate people’s moving speed by road network
Excluding the time duration people stay still, the rest of the time is moving. The problem is how to identify whether the person is in a vehicle. We need to estimate the moving speed. First, we observe the cellular towers’ distribution on the Google map, shown in Figure 1 and Figure 2.
Through the Google Map, we find that the distribution of towers is uniform, and nearly each street has a tower. The road in Beijing is almost straight from north to south, or straight from east to west, so we use a simple road map model to analyse the trace of person, which is described by Figures 2 to 5.
Figure 3 This is the simple road map model of Beijing, there are two cellular towers on it (see online version for colours)
Note: Assume a person moves from one cellular tower to
the other, the red line is the straight way, but this is impossible.
Through this model, we ignore the right way people will take, we just consider the length of the shortest way they will take, which can be easily calculated by the latitude and longitude of the two cellular towers, shown in Figure 6.
Now, we get the length of shortest way, so the speed V can be easily calculated. We can compare this speed with the normal speed of people walking and driving.
• If V ≥ 60 km/h, he is in the vehicle.
• If V ≤ 5 km/h, he is walking.
76 C. Wu et al.
• If 5 km/h < V < 60 km/h, he has a probability in the vehicle. How to get this probability?
Figure 4 We assume people always takes the shortest way, there are several possible shortest ways this people can move from one cellular tower to the other (see online version for colours)
4.5 Compare trace with road network
We use the road network to get the probability. Through the road network, we can calculate the distance between each cellular tower and its nearest road.
Definition 7: For a time sequence:
( ) ( ) ( )1 1 2 2, , , ... ,n nl p l p l p
and the distance between each tower and nearest road:
1 2, ... nd d d
Figure 5 The lengths of these shortest ways are the same, they equal the length of the black line (see online version for colours)
Figure 6 The length of the shortest way (black line) (see online version for colours)
We get the probability by the following formula.
( )
( )
arctan 1200.5 20
20arctan10.5 20
i
i
i
ii
d
dπP
d dπ
⎧ ⎛ ⎞−⎜ ⎟⎪ ⎝ ⎠− ≥⎪⎪= ⎨
⎛ ⎞⎪ ⎜ ⎟⎪ −⎝ ⎠+ ≤⎪⎩
Time-activity pattern observatory from mobile web logs 77
The probability multiplied by the time people spend in one tower is the time duration that people will spend in the vehicle.
5 Experiments
In this section, we will demonstrate the experiment results and give analysis based on the experiments.
5.1 Data
We use the data described in Section 3 to conduct the experiment. Because we need to analyse people’s whole-day action, we choose those who have record in 24 hours. The number of people who have whole-day record is shown in Table 2.
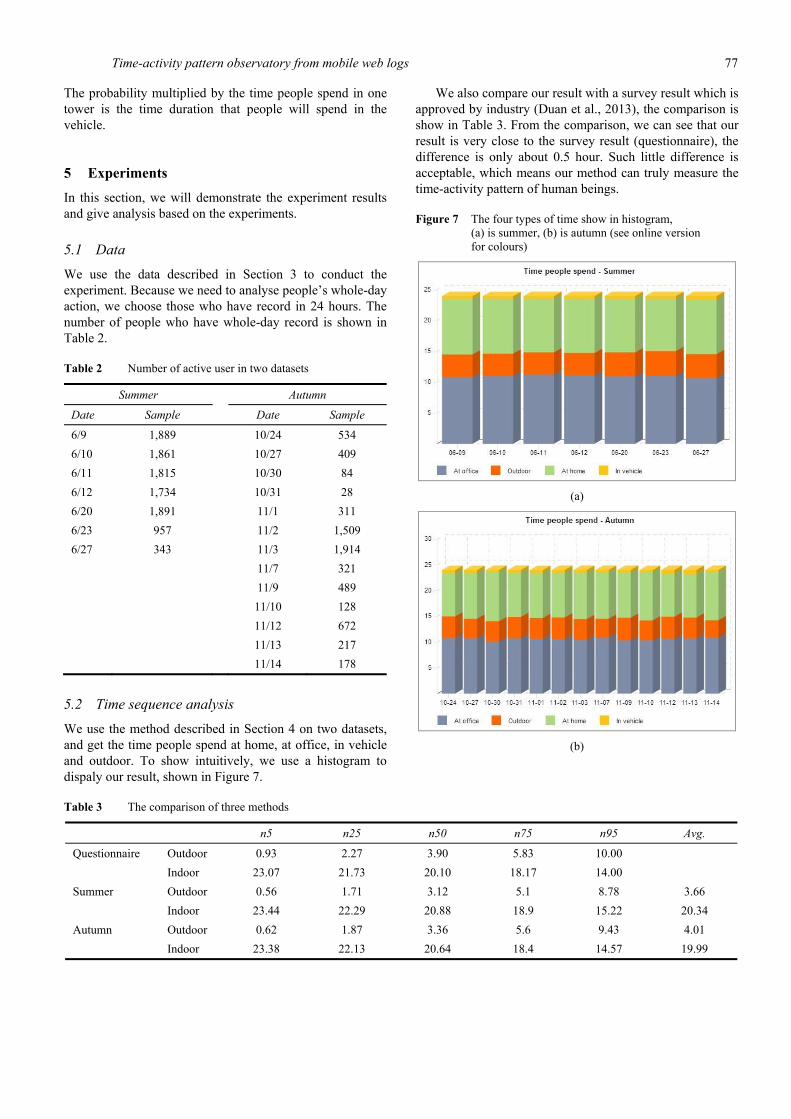
We use the method described in Section 4 on two datasets, and get the time people spend at home, at office, in vehicle and outdoor. To show intuitively, we use a histogram to dispaly our result, shown in Figure 7.
We also compare our result with a survey result which is approved by industry (Duan et al., 2013), the comparison is show in Table 3. From the comparison, we can see that our result is very close to the survey result (questionnaire), the difference is only about 0.5 hour. Such little difference is acceptable, which means our method can truly measure the time-activity pattern of human beings.
Figure 7 The four types of time show in histogram, (a) is summer, (b) is autumn (see online version for colours)
Time-activity pattern is one of the most important exposure factors when assessing exposure to a particular air pollutant of human beings. In this paper, we have presented a method for analysing the time-activity pattern on mobile web usage log. We have proposed a way to identify people’s home and working place. We also have solved a problem of switching cellular towers and the length of the shortest trace. We have applied our method to two real-world large-scale datasets of Beijing, the capital of China, covering million users, and the output shows good performance in contrast to questionnaire result.
For future work, one possibility to extend the work is to explore the people who do not have all-day web usage log.
Acknowledgements
This work is supported by China National Science Foundation under grant No. 61170212, China National High-Tech Project (863) under grant No. SS2013AA010307, and Ministry of Education-China Mobile Research Fund under grant No. MCM20130381. Beijing Key Lab of Networked Multimedia also supports our research work.
References Armstrong, B., Hutchinson, E., Unwin, J. and Fletcher, T. (2004)
‘Lung cancer risk after exposure to polycyclic aromatic hydrocarbons: a review and meta-analysis’, Environmental Health Perspectives, June, Vol. 112, No. 9, pp.970–978.
Bostrom, C., Gerde, P., Hanberg, A., Jernstrom, B., Johansson, C., Kyrklund, T., Rannug, A., Tornqvist, M., Victorin, K. and Westerholm, R. (2002) ‘Cancer risk assessment, indicators, and guidelines for polycyclic aromatic hydrocarbons in the ambient air’, Environmental Health Perspectives, June, Vol. 110, Suppl 3, pp.451–488.
Chen, C., Zhao, B. and Weschler, C.J. (2012a) ‘Assessing the influence of indoor exposure to ‘outdoor ozone’ on the relationship between ozone and short-term mortality in US communities’, Environmental Health Perspectives, Vol. 120, No. 2, p.235.
Chen, C., Zhao, B. and Weschler, C.J. (2012b) ‘Indoor exposure to ‘outdoor PM10’: assessing its influence on the relationship between PM10 and short-term mortality in US cities’, Epidemiology, Vol. 23, No. 6, pp.870–878.
Cui, Y. and Roto, V. (2008) ‘How people use the web on mobile devices’, in Proceedings of the 17th International Conference on World Wide Web, WWW’08, pp.905–914, ACM, New York, NY, USA.
Do, T-M-T. and Gatica-Perez, D. (2010) ‘By their apps you shall understand them: mining large-scale patterns of mobile phone usage’, in Proceedings of the 9th International Conference on Mobile and Ubiquitous Multimedia, MUM’10, ACM, New York, NY, USA, pp.27:1–27:10.
Duan, X. et al. (2013) Exposure Factors Handbook of Chinese Population (Adults), 1st ed., China Environment Science Press, 1 December.
Hashimoto, T., Chakraborty, B. and Shirota, Y. (2012) ‘Social media analysis – determining the number of topic clusters from buzz marketing site’, in Int. J. of Computational Science and Engineering, Vol. 7, No. 1, pp.65–72.
Klepeis, N.E., Nelson, W.C., Ott, W.R. et al. (2001) ‘The National Human Activity Pattern Survey (NHAPS): a resource for assessing exposure to environmental pollutants’, Journal of Exposure Analysis and Environmental Epidemiology, Vol. 11, No. 3, pp.231–252.
Leech, J.A., Wilby, K. and McMullen, E. (1999) ‘Environmental tobacco smoke exposure patterns: a subanalysis of the Canadian time-activity pattern survey’, Canadian Journal of Public Health, Vol. 90, No. 4, pp.244–249.
Leech, J.A., Wilby, K., McMullen, E. et al. (1996) ‘The Canadian human activity pattern survey: a report of methods and population surveyed’, Chronic Disease in Canada, Vol. 17, Nos. 3–4, pp.118–123.
Lim, S.S., Vos, T., Flaxman, A.D. et al. (2013) ‘A comparative risk assessment of burden of disease and injury attributable to 67 risk factors and risk factor clusters in 21 regions, 1990–2010: a systematic analysis for the Global Burden of Disease Study 2010’, The lancet, Vol. 380, No. 9859, pp.2224–2260.
Liu, C-H., Chen, S-L. and Huang, T-Y. (2013) ‘Data flow analysis and testing for OWL-S semantic web service compositions’, Int. J. of Computational Science and Engineering, Vol. 8, No. 4, pp.349–360.
Phatak, D. and Mulvaney, R. (2002) ‘Clustering for personalized mobile web usage’, in Proceedings of the 2002 IEEE International Conference on Fuzzy Systems, 2002, FUZZ-IEEE’02, Vol. 1, pp.705–710.
Samet, J.M., Dominici, F., Curriero, F.C. et al. (2000) ‘Fine particulate air pollution and mortality in 20 US cities, 1987–1994’, New England Journal of Medicine, Vol. 343, No. 24, pp.1742–1749.
Tseng, V.S. and Lin, K.W. (2006) ‘Efficient mining and prediction of user behavior patterns in mobile web systems’, Information and Software Technology, WAMIS 2005 Workshop, Vol. 48, No. 6, pp.357–369.
Verkasalo, H. (2009) ‘Contextual patterns in mobile service usage’, Personal and Ubiquitous Computing, June, Vol. 13, No. 5, pp.331–342.
Wang, H-I. (2013) ‘The effects of social network sites on learning performance: the study of college students in Taiwan’, Int. J. of Computational Science and Engineering, Vol. 8, No. 2, pp.111–118.
Wiley, J., Robinson, J.P., Piazza, T. et al. (1991a) Activity Patterns of California Residents, Final Report under Contract No. A7-177-33, California Air Resources Board Sacramento, CA.
Wiley, J., Robinson, J.P., Piazza, T. et al. (1991b) Study of Children’s Activity Patterns, California Environmental protection Agency, Air Resources Board Research, Sacrammento, CA.