19
Time and Apparent Time Effects on Compaction & Subsidence Rune M Holt, NTNU & SINTEF Leeuwarden, 29 October 2013 SC Meeting by Waddenacademie/KNAW & NAM

30 October 2013
Time and Apparent Time Effects on Compaction & Subsidence
Rune M Holt, NTNU & SINTEF
Leeuwarden, 29 October 2013
SC Meeting by Waddenacademie/KNAW & NAM

30 October 2013
Time Effects on Compaction & Subsidence • Creep • Consolidation
Apparent Time Effects:
• Stress Path / Arching-induced • Elasto-Plastic Transition
Both Reservoir and Surrounding Rocks are involved

30 October 2013
Creep • Creep is characterized by 3 phases: Transient, Steady-state, and Accelerating, where the rock may undergo failure • Creep mechanisms are not fully understood – a common assumption is stress-induced corrosion, which is strongly dependent on temperature & the distance in stress space to rock failure
Tran
sien
t
Stea
dy st
ate
Acc
eler
atin
g
time
strain
Rate dependent compaction model by de Waal & Smits, 1988
30 October 2013
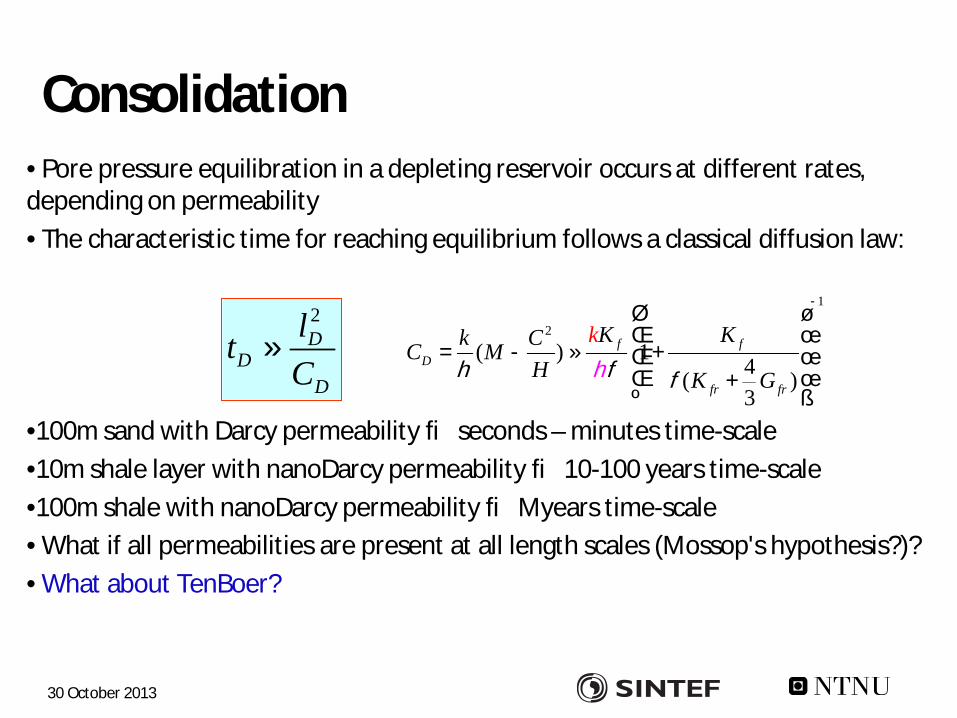
Consolidation • Pore pressure equilibration in a depleting reservoir occurs at different rates, depending on permeability • The characteristic time for reaching equilibrium follows a classical diffusion law:
•100m sand with Darcy permeability ® seconds – minutes time-scale •10m shale layer with nanoDarcy permeability ® 10-100 years time-scale •100m shale with nanoDarcy permeability ® Myears time-scale • What if all permeabilities are present at all length scales (Mossop's hypothesis?)? • What about TenBoer?
2D
DD
ltC
»
1
2
( ) 1 4( )3
f fD
fr fr
K Kk CC MH K G
kh fh f
-é ùê ú
= - » +ê úê ú+ë û

10/30/2013
Stress Path
Reservoir stress path coefficients from Rudnicki (1999); reservoir is elastically matched to the surroundings (Poisson’s ratio = 0.20)
Notice: Stresses (and pore pressure) also change in the surrounding rocks
Dh
R e=Dh/2R
h
e=h/2R 0,00
0,10
0,20
0,30
0,40
0,50
0,60
0,70
0,80
0,00 0,20 0,40 0,60 0,80 1,00
Aspect ratio
Stre
ss P
ath
Coe
ffici
ents
gv/a
gh/a
gv: "Arching" coefficient = Dsv/Dpf gh: Describes horizontal stress evolution = Dsh/Dpf (First defined by Schutjens, Hettema a.o.)
Reservoir
surface
compaction
S T R E S S A R C H
Stretching andreduction in v v
Increase in
Incresed shearstress
Casingsubject toshear
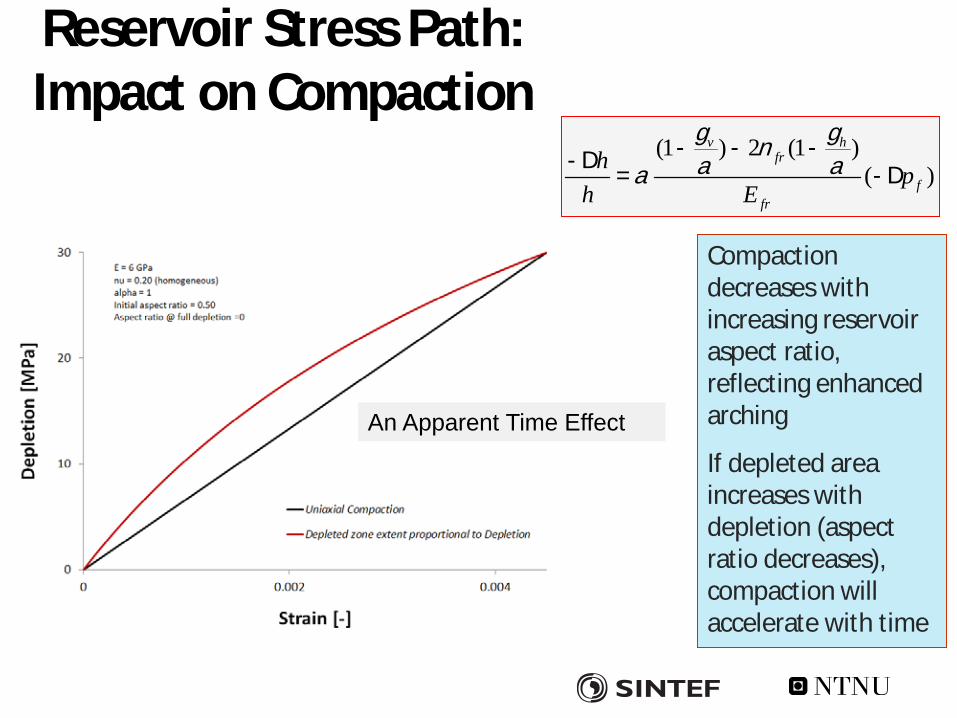
Reservoir Stress Path: Impact on Compaction
Compaction decreases with increasing reservoir aspect ratio, reflecting enhanced arching
If depleted area increases with depletion (aspect ratio decreases), compaction will accelerate with time
(1 ) 2 (1 )( )
v hfr
ffr
h ph E
g gna aa
- - --D= -D
An Apparent Time Effect

30 October 2013
Core vs. Virgin compaction: The "GRONstone" Experience
"Virgin" compaction, along a Reservoir Stress Path
"Coring" simulation, along 2 Coring Stress Paths + "Core" compaction, along a Reservoir Stress Path
Cementation: Sand & e.g. Sodium Silicate + CO2
Holt, Brignoli & Kenter; IJRM 2000
30 October 2013
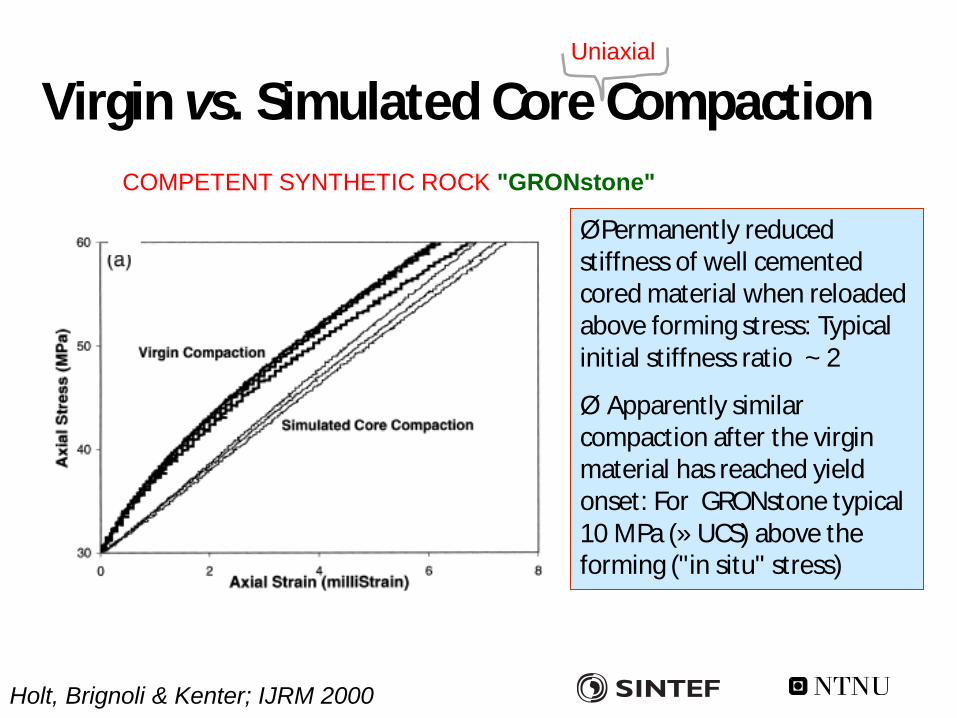
Virgin vs. Simulated Core Compaction
ØPermanently reduced stiffness of well cemented cored material when reloaded above forming stress: Typical initial stiffness ratio ~ 2
Ø Apparently similar compaction after the virgin material has reached yield onset: For GRONstone typical 10 MPa (» UCS) above the forming ("in situ" stress)
Holt, Brignoli & Kenter; IJRM 2000
COMPETENT SYNTHETIC ROCK "GRONstone"
Uniaxial
30 October 2013
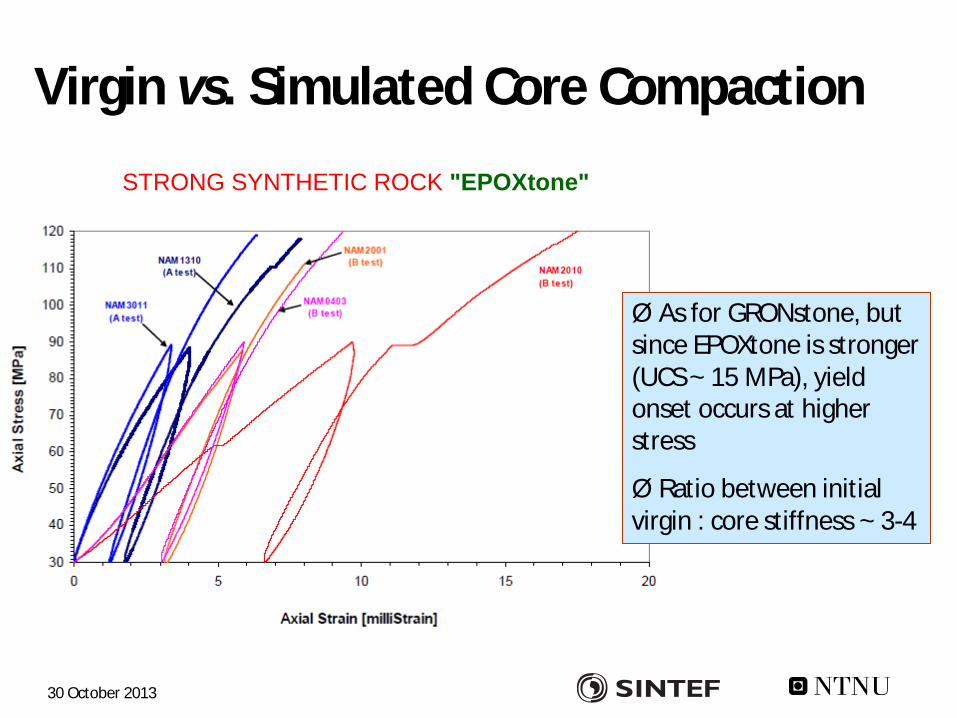
Virgin vs. Simulated Core Compaction STRONG SYNTHETIC ROCK "EPOXtone"
Ø As for GRONstone, but since EPOXtone is stronger (UCS ~ 15 MPa), yield onset occurs at higher stress
Ø Ratio between initial virgin : core stiffness ~ 3-4

Static vs Dynamic Moduli Ø Epoxy-cemented sandstone, formed at 30 MPa axial & 15 MPa
confining stress Ø Static = Dynamic Modulus directly after cementation; Undamaged
material Ø In simulated core, Dynamic > Static modulus, except during stress reversal
(unloading + reloading)
Uniaxial Strain (K0) Uniaxial Strain (K0)
Virgin Material Simulated Core
Holt et al., ARMA 2013

30 October 2013
NAM Core Compaction
• Field core from NAM tested in uniaxial strain conditions (no
pore fluid) • Note observed
nonlinearity (above 80 MPa axial stress) and
permanent strains

Why are Static ¹ Dynamic Moduli? Fluid contribution Static Dynamic
drained (normally) undrained (always)
( )
2
fr fr ff
s
K K K KK
a
f a f« +
+ -
Dispersion Ultrasonic: f ~ 1 MHz
Sonic: f ~ 10 kHz
Static: f ~ 1 Hz
+ Scale effects, Anisotropy, a.o.
Plasticity Static moduli are measured at finite strains and include elastic + plastic deformation; Dynamic moduli are measured at infinitesimal strain and are hence purely elastic.
Negligible for gas saturation
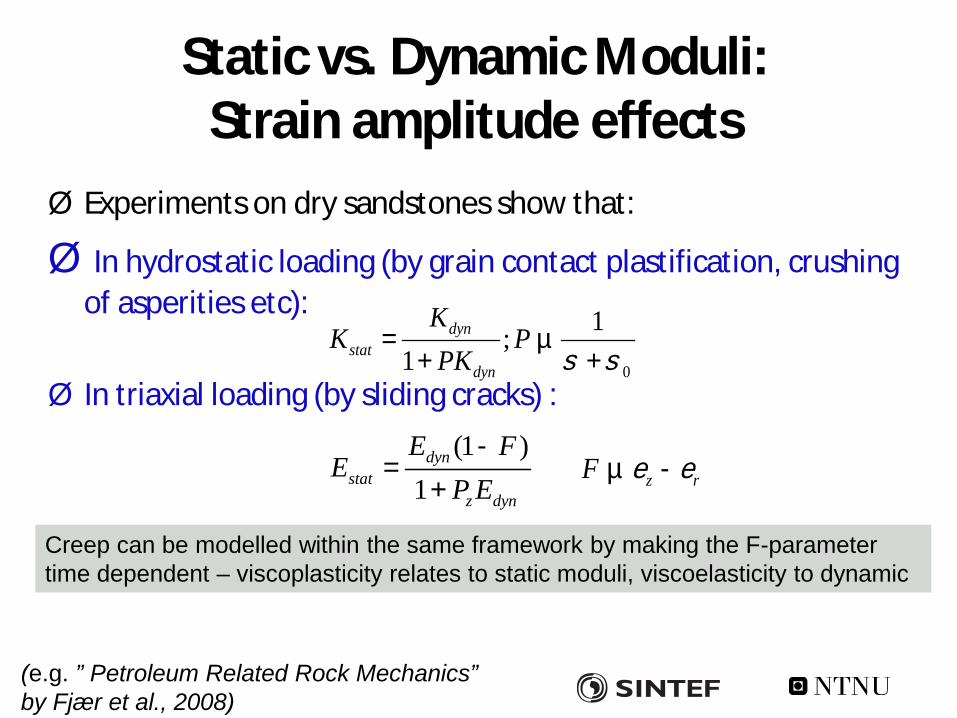
Static vs. Dynamic Moduli: Strain amplitude effects
Ø Experiments on dry sandstones show that:
Ø In hydrostatic loading (by grain contact plastification, crushing of asperities etc):
Ø In triaxial loading (by sliding cracks) :
0
1;1
dynstat
dyn
KK P
PK s s= µ
+ +
(1 )1
dynstat
z dyn
E FE
P E-
=+ z rF e eµ -
(e.g. ” Petroleum Related Rock Mechanics” by Fjær et al., 2008)
Creep can be modelled within the same framework by making the F-parameter time dependent – viscoplasticity relates to static moduli, viscoelasticity to dynamic

Reservoir Monitoring Aspects: Competent Synthetic Sandstone
ØPermanent drop of velocities after coring & reloading to forming stress
ØLow stress sensitivity during loading in the virgin material
ØLarger stress sensitivity during unloading
ØLarge stress dependence in the simulated core!
0.40
0.60
0.80
1.00
1.20
0 10 20 30 40 50 60 70
Effective vertical stress (MPa)
Verti
cal P
-wav
e ve
loci
ty (r
el.)
Simulated Core
Virgin Material
In situ stress

Discrete Particle Modelling: ”Best fit” between Laboratory and PFC3D simulations of GRONstone
30
35
40
45
50
55
60
0 1 2 3 4 5 6 7
Axial Strain [milliStrain]
Axi
al S
tres
s [M
Pa] Virgin GRONstone
Clump logick n /k s = 3.5 (uncemented) k n /k s = 1 (cemented)
5x2.5x2.5 mm sample
Epb=8 GPa; Shear = Tensile bond strength = 10 +- 10 MPa
Cored GRONstoneVirgin PFC
Cored PFC
Looked good.... Holt, Brandshaug & Cundall, NARMS 2000
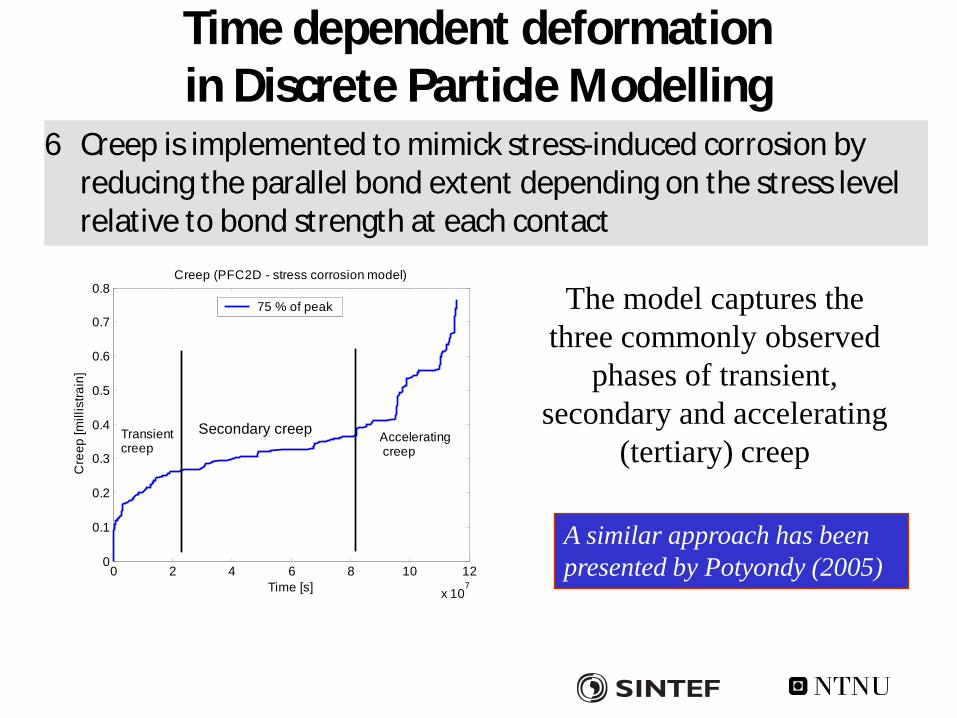
6 Creep is implemented to mimick stress-induced corrosion by reducing the parallel bond extent depending on the stress level relative to bond strength at each contact
0 2 4 6 8 10 12
x 107
0
0.1
0.2
0.3
0.4
0.5
0.6
0.7
0.8
Time [s]
Cre
ep [m
illis
train
]
Creep (PFC2D - stress corrosion model)
75 % of peak
Steady state creep Accelerating creep
Transientcreep
Secondary creep
0 2 4 6 8 10 12
x 107
0
0.1
0.2
0.3
0.4
0.5
0.6
0.7
0.8
Time [s]
Cre
ep [m
illis
train
]
Creep (PFC2D - stress corrosion model)
75 % of peak
Steady state creep Accelerating creep
Transientcreep
Secondary creep
A similar approach has been presented by Potyondy (2005)
The model captures the three commonly observed
phases of transient, secondary and accelerating
(tertiary) creep
Time dependent deformation in Discrete Particle Modelling

Time dependent deformation in Discrete Particle Modelling
6 Long-term behaviour may be assessed from short-term simulations 6 Challenge: Appropriate calibration of microscopic creep parameters 6 Other physical mechanisms may play a vital role over long time scales
Darley Dale sst experiments (from Meredith, NYRocks 1997)
PFC3D

Application example: Creep under K0 conditions
0 50 100 150 200 250 3000
0.5
1
1.5
2
2.5
3
3.5
Time [years]
Axi
al c
reep
[mS
train
]
K0 creep
PFC simulationExperimental data
A tool for the
future...
0 50 100 150
0
0.2
0.4
0.6
0.8
1
1.2
1.4
1.6
1.8
Time [days]
Axi
al c
reep
[mS
train
]
K0 creep
PFC simulationExperimental data

Concluding Remarks
Ø Time dependent compaction may be intrinsic (creep, consolidation; within reservoir & overburden) or apparent (stress arching induced, due to onset of plasticity)
Ø Rocks deform elasto-plastically – both in the Earth and in the Laboratory Ø Rock alteration due to stress relief during coring is well and
understood, and models for correction of core measured compaction exist
Ø Plastic strain evolves as failure is approached, and with it: Viscoplastic strain Ø Long term effects may be modelled, but require proper understanding
of mechanisms (hard to speed up…)


