56
Time-Domain NMR: Basic Principles and Real-World Applications Dr. Stefan Jehle - Applications Scientist - [email protected] Webinar - September 9, 2015

Time-Domain NMR: Basic Principles and Real-World Applications
Dr. Stefan Jehle - Applications Scientist - [email protected]
Webinar - September 9, 2015

TD-NMR: Basic Principles and Free Induction Decay (FID) Applications
Webinar - September 9, 2015
Dr. Stefan Jehle - Applications Scientist - [email protected]

Bruker BioSpin Compact Magnetic Resonance
Nuclear
Magnetic
N
S
Resonance MHz
A sample containing “NMR-active” nuclei
A magnetic field minispec
A radiofrequency field

NMR active nuclei have a non-zero spin which causes a magnetic moment
Materials and Atomic Nuclei in a Magnetic Field
+ +
+ +
+
Zero field External field
B0
N
S
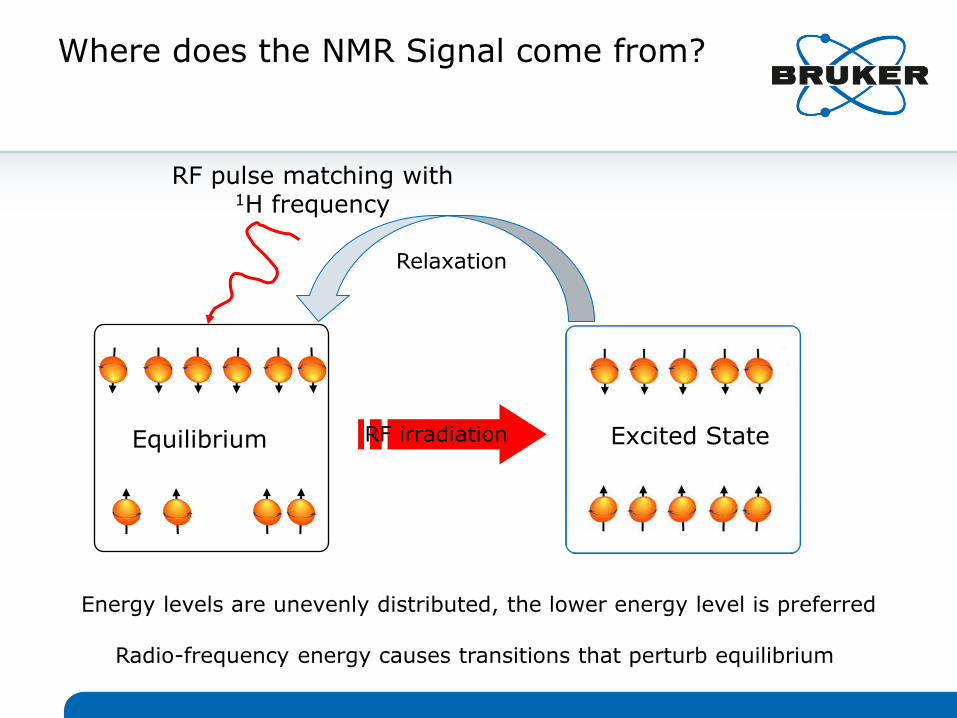
Equilibrium
RF pulse matching with 1H frequency
Energy levels are unevenly distributed, the lower energy level is preferred
Radio-frequency energy causes transitions that perturb equilibrium
Excited State
Relaxation
RF irradiation
Where does the NMR Signal come from?

N S
TRANSMITTER
RECEIVER
Bo
B1
PC PULSE TIMING
DATA ACQUISITION SIGNAL PROCESSING
NMR Basic Components
NMR spectrometer is a radio – needs a transmitter and receiver
True bulk measurement, non destructive and irrespective of color
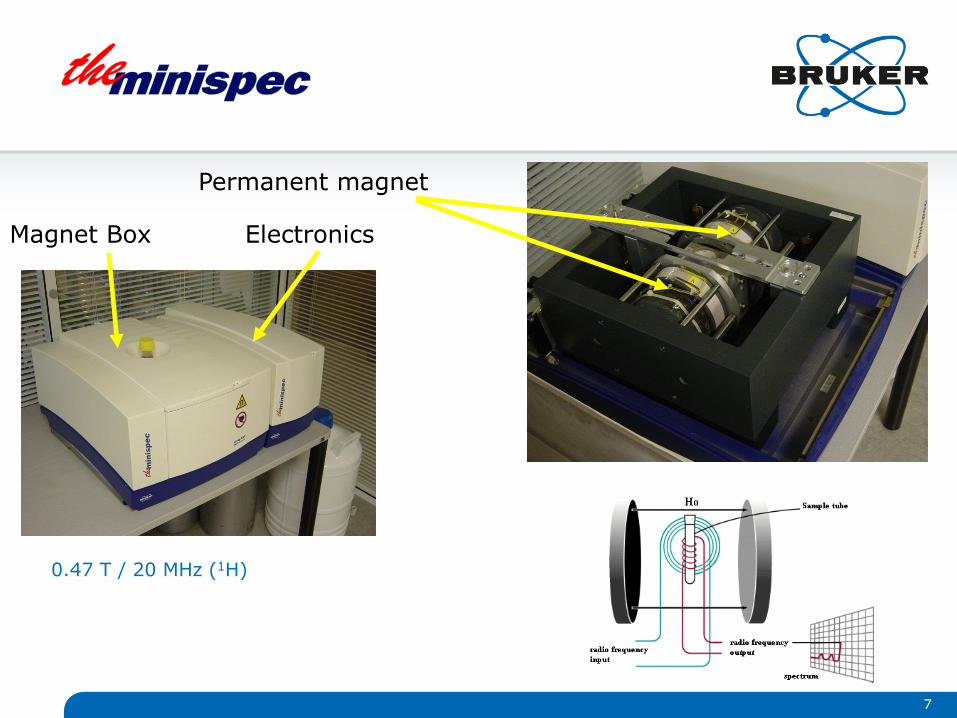
Magnet Box Electronics
Permanent magnet
0.47 T / 20 MHz (1H)
7

Pulse sequence - Vector Model
Animation adapted from: Steren Giannini http://upload.wikimedia.org/wikipedia/commons/1/11/Proton_spin_MRI.webm
NMR signal decays over time as spins return to equilibrium Free Induction Decay - FID

Real Free Induction Decay (FID) Example
NMR signal decays over time as spins return to equilibrium

Time-Domain NMR vs. NMR Spectroscopy
Time-Domain NMR (Relaxometry)
• Only time domain signal, FID
• No “chemical” information
• Measurement of physical properties
• Signal amplitude
• Bulk Quantification
• Solid vs liquid
• Morphology
NMR Spectroscopy
• NMR Spectrum after Fourier Transform
• Chemical shifts
• Structure determination
• Identification
• Quantification
spectrum spectrum FID FID (Free Induction Decay)
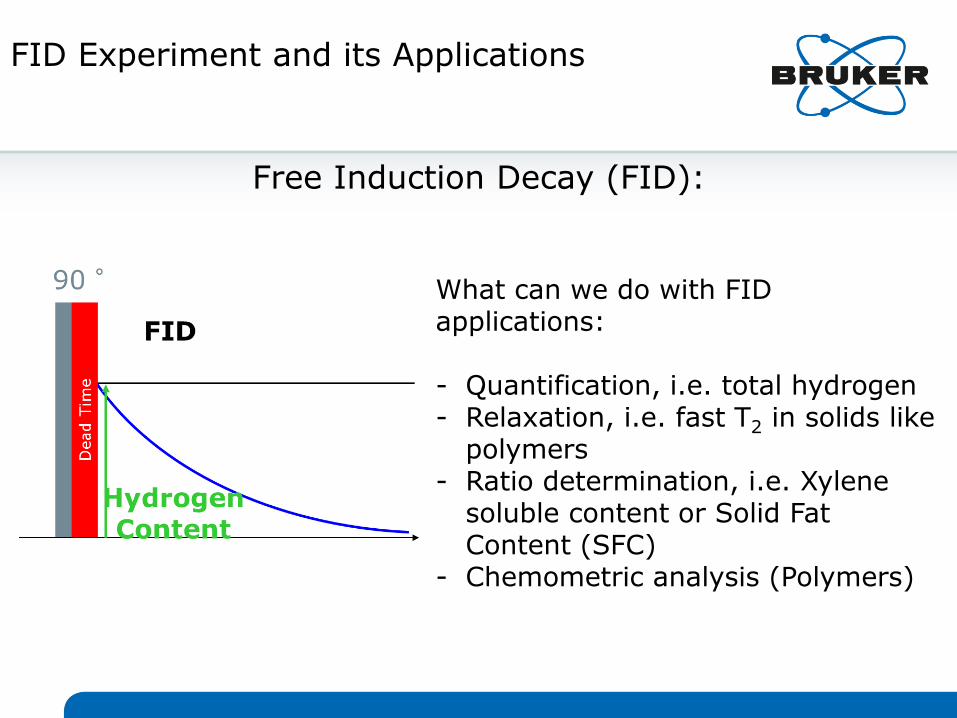
FID Experiment and its Applications
Free Induction Decay (FID):
What can we do with FID applications: - Quantification, i.e. total hydrogen - Relaxation, i.e. fast T2 in solids like
polymers - Ratio determination, i.e. Xylene
soluble content or Solid Fat Content (SFC)
- Chemometric analysis (Polymers)

0
20
40
60
80
100
120
0 100 200 300 400 500 600 700 800 900 1000
NM
R a
mp
litu
de
Time
Signal from SOLID & LIQUID
NMR signal for hydrogens in different environments decays at different rates
TD-NMR is a ‘Phase Sensor’ – Ratio Applications
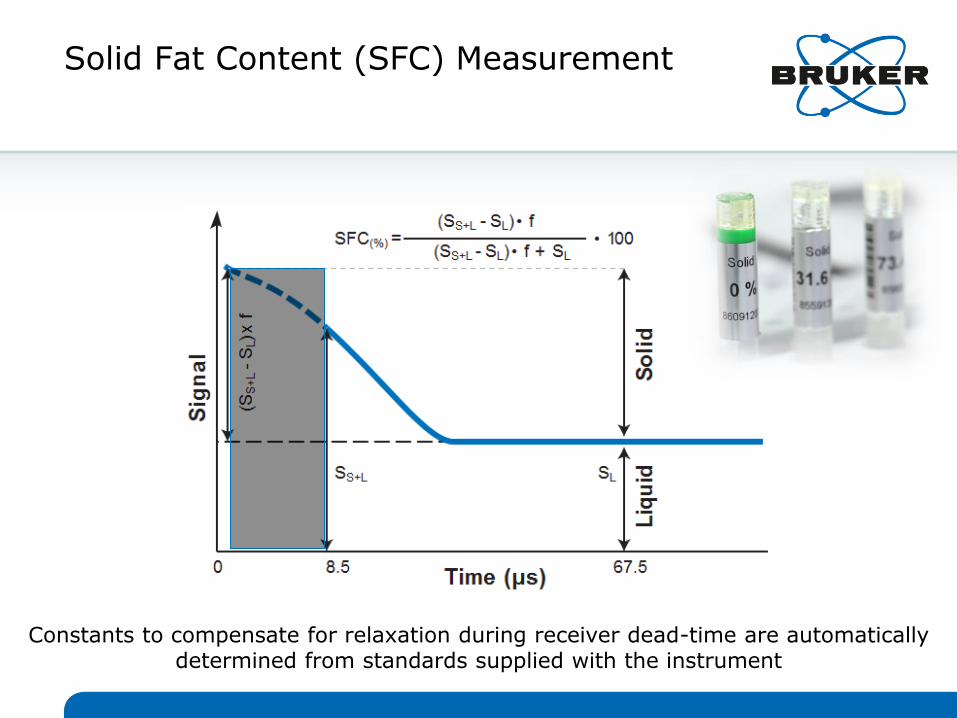
Solid Fat Content (SFC) Measurement
Constants to compensate for relaxation during receiver dead-time are automatically determined from standards supplied with the instrument

Relaxation is dependent on sample composition
Ratio of two sampling windows is used to quantify solid content
Relaxation Effects on NMR spectra
Solid
Solid
Solid
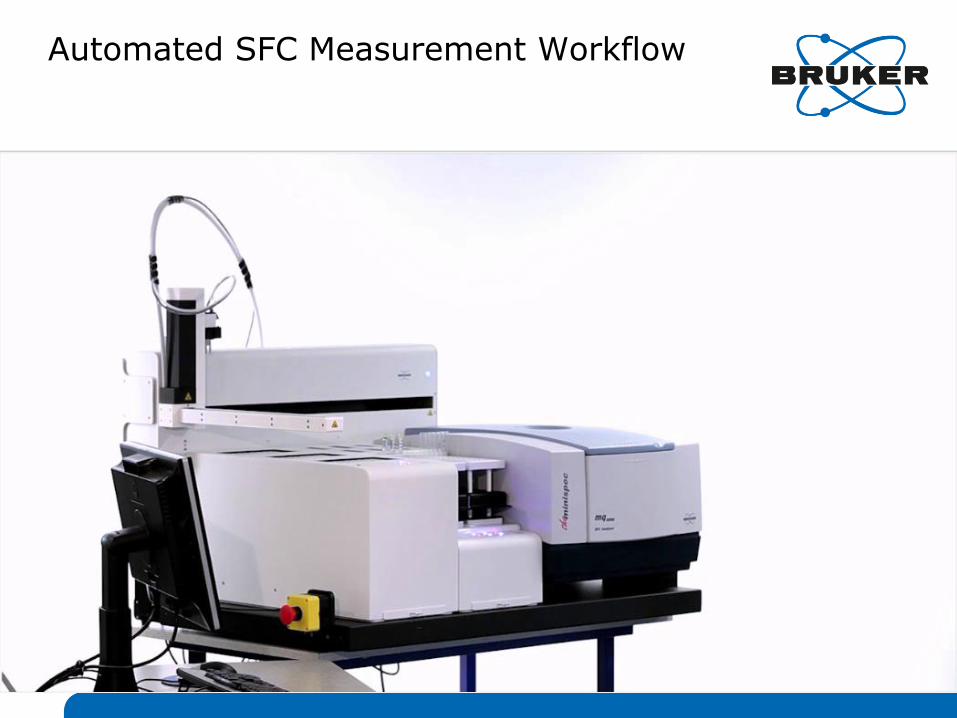
Automated SFC Measurement Workflow
Summary
• NMR signal originates from the atomic nuclei
• NMR signal amplitude correlates with total hydrogen content
• TD-NMR is a non-destructive, bulk technique
• Relaxation is the basis of Time-Domain NMR
• SFC, Xylene soluble or amorphous content are
measured with a simple ‘FID’ application
• NMR signals from Solid/Liquid hydrogens decay at different rates
• Calculate SFC ratio values from two different FID regions using pre-determined constants

www.bruker.com
© Copyright Bruker Corporation. All rights reserved.
Dr. Stefan Jehle Applications Scientist

Relaxation - a Brief Introduction and Real World Applications
Webinar - September 9, 2015
Dr. Stefan Jehle - Applications Scientist - [email protected] Dr. Jochem Struppe - Product Manager, Solid-State NMR - [email protected]

Relaxation - a Brief Introduction and Real World Applications
Two processes occur during NMR signal evolution
•Nuclear spins interact with the instrument (T1)
•Nuclear spins interact amongst themselves (T2)

Bruker BioSpin Compact Magnetic Resonance
• sample is placed in magnetic field:
• alignment of nuclei
• build up of macroscopic magnetization with a time constant T1
T1
T1
B0

T1 Measurement – why?
• To determine the recycle delay RD between scans of any NMR experiment • RD should be 5 X T1 to allow the spins to return to
thermal equilibrium
• T1 is a function of…
• molecular motion
• T1-1 = 𝛾2 𝐵2
𝑥 𝜏
𝑐
1+ 𝜔0𝜏
𝑐2
• -> quantifying components based on different T1 times
T1, T2
Liquid - fast reorientation.
Solid - slow reorientation.
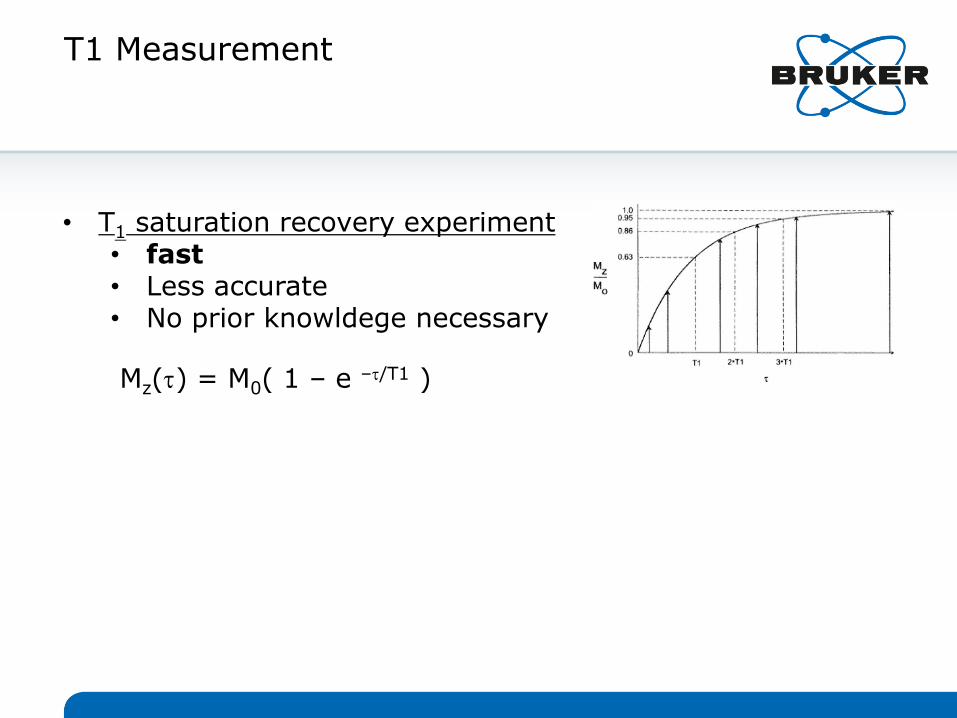
T1 Measurement
• T1 saturation recovery experiment • fast • Less accurate • No prior knowldege necessary
Mz(t) = M0( 1 – e –t/T1 )

T1 Measurement
• T1 saturation recovery experiment • fast • Less accurate • No prior knowldege necessary
Mz(t) = M0( 1 – e –t/T1 )
Mz(t) = M0( 1 – 2e –t/T1 )
• T1 inversion recovery experiment • More accurate • Relatively slow • Long recycle delay

T1 by Saturation Recovery
T1 Saturation Recovery application
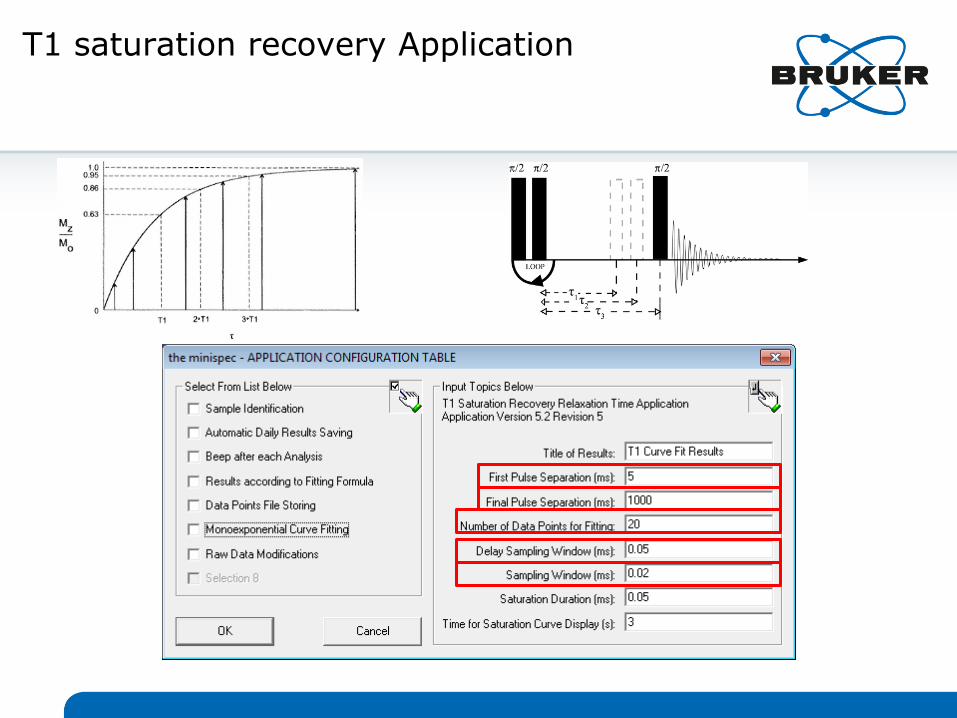
T1 saturation recovery Application
26
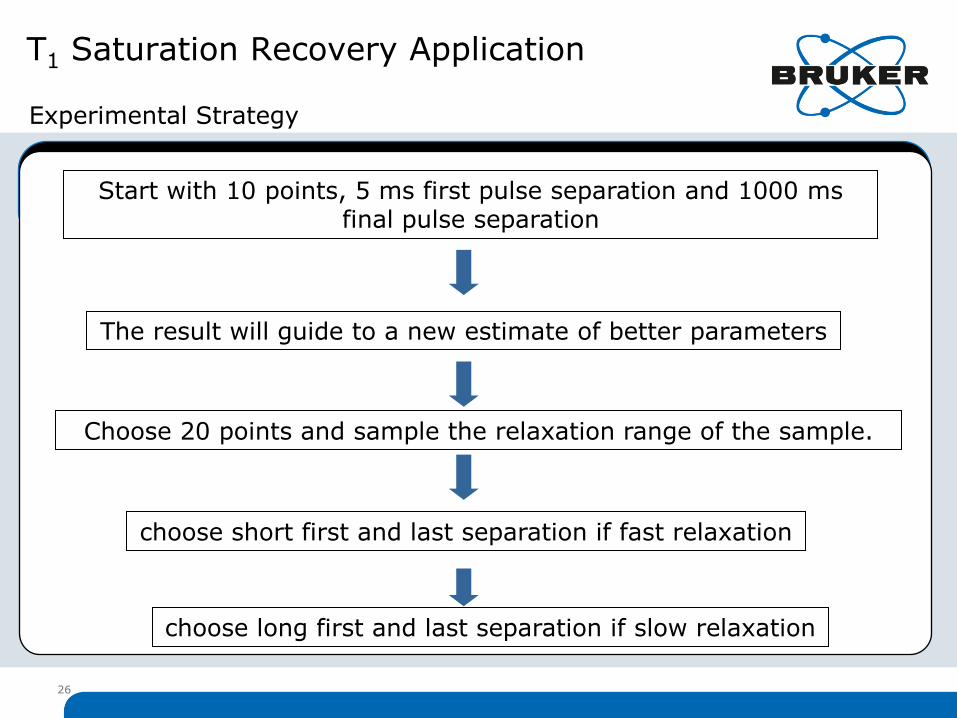
T1 Saturation Recovery Application
Start with 10 points, 5 ms first pulse separation and 1000 ms final pulse separation
The result will guide to a new estimate of better parameters
Choose 20 points and sample the relaxation range of the sample.
choose short first and last separation if fast relaxation
choose long first and last separation if slow relaxation
Experimental Strategy
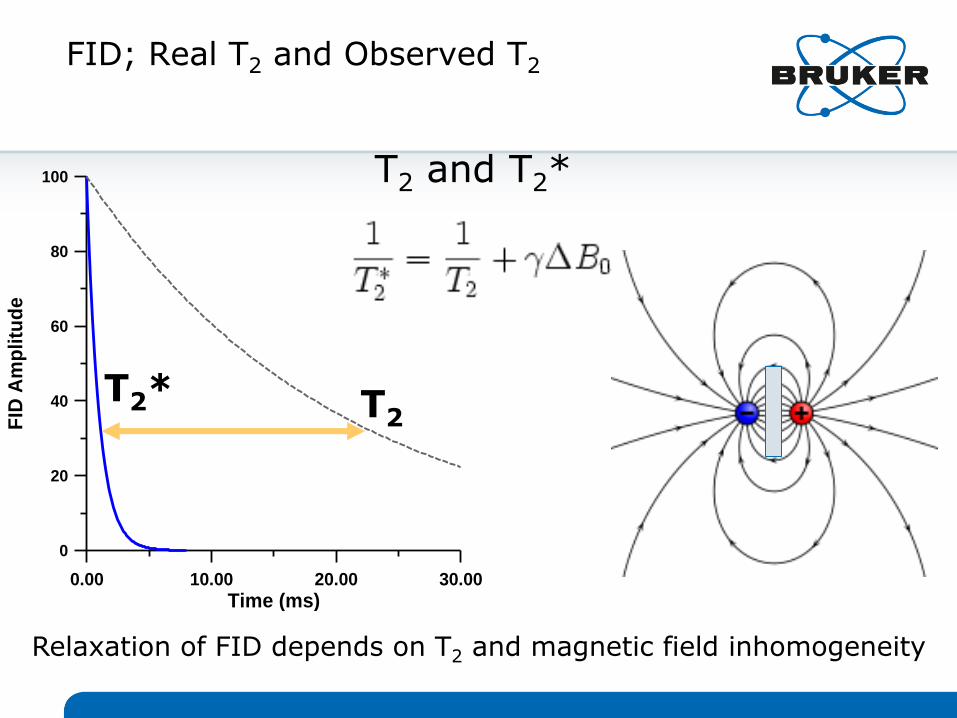
FID; Real T2 and Observed T2
0.00 10.00 20.00 30.00
Time (ms)
0
20
40
60
80
100
FID
Am
plitu
de
T2 and T2*
T2 T2*
Relaxation of FID depends on T2 and magnetic field inhomogeneity

T2 Relaxation – 3 Experiments
(a) FID (b) Hahn Echo
(c) CPMG pulse train (Carr Purcell Meiboom Gill)
Works only for very short T2, i.e. few microseconds like in solid materials

T2 Decay
http://en.wikipedia.org/wiki/File:GWM_HahnEchoDecay.gif
(c) CPMG train
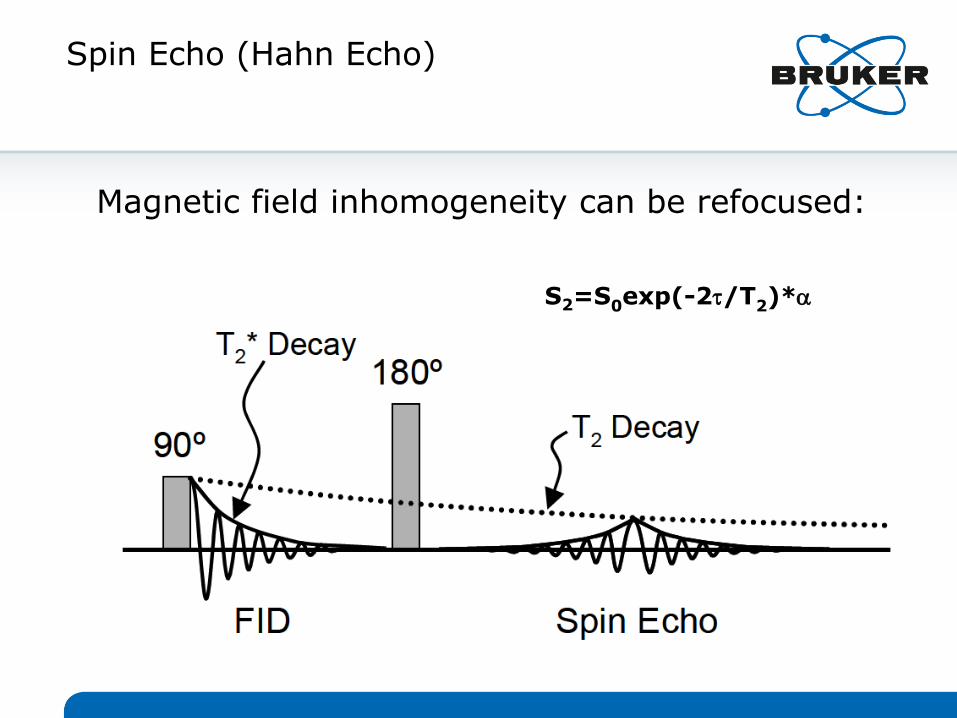
Spin Echo (Hahn Echo)
Magnetic field inhomogeneity can be refocused:
S2=S0exp(-2t/T2)*a

T2 CPMG Application
2 x points x pulse separation = total relaxation time
32
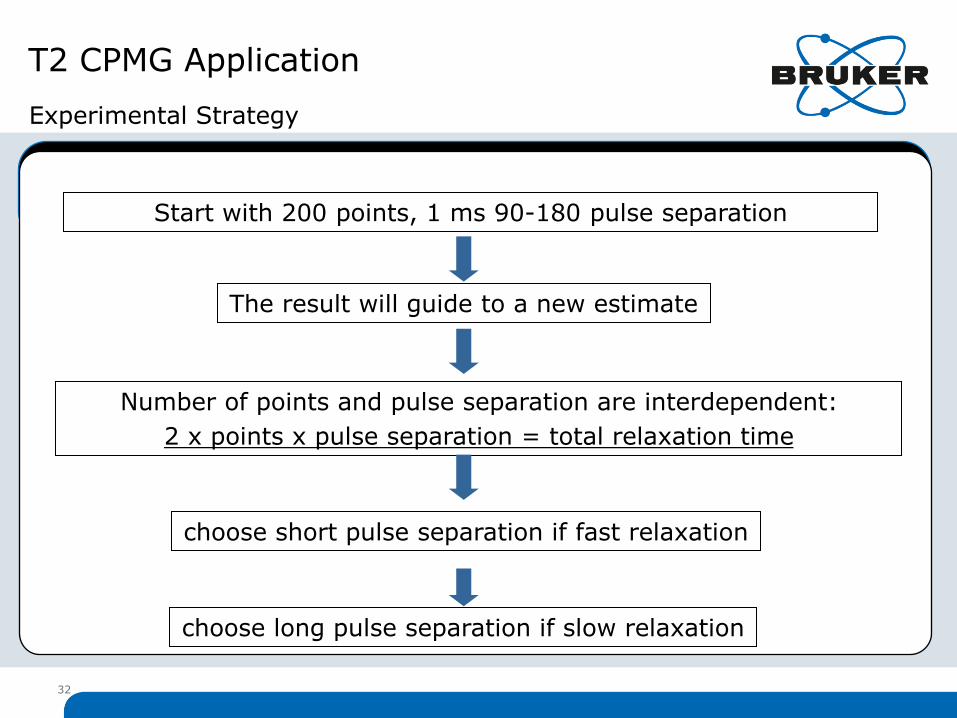
T2 CPMG Application
Start with 200 points, 1 ms 90-180 pulse separation
The result will guide to a new estimate
Number of points and pulse separation are interdependent:
2 x points x pulse separation = total relaxation time
choose short pulse separation if fast relaxation
choose long pulse separation if slow relaxation
Experimental Strategy
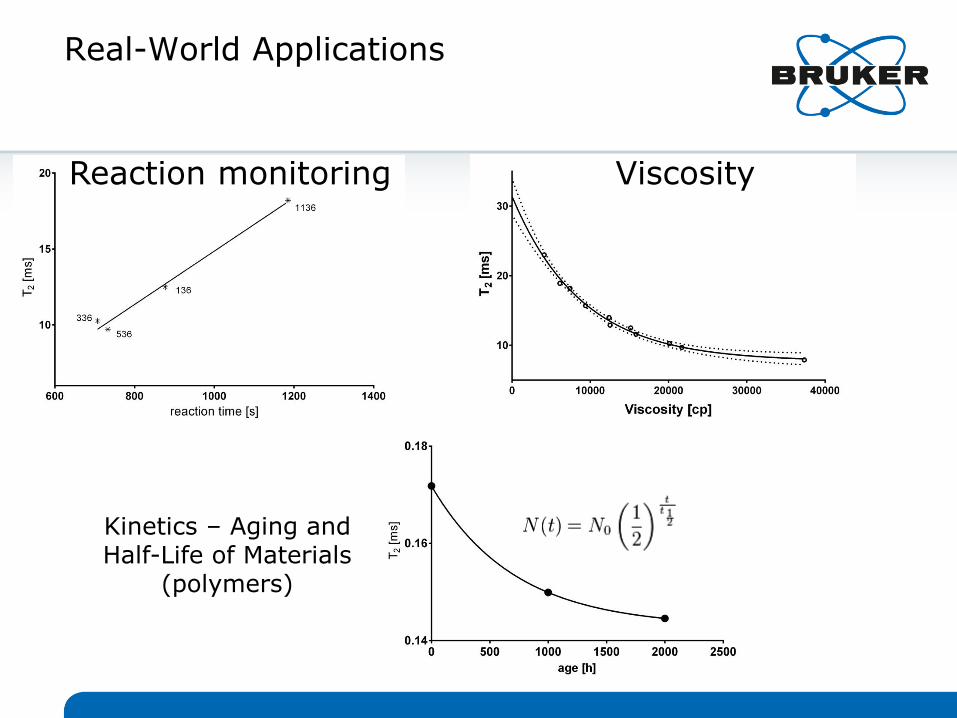
Real-World Applications
Kinetics – Aging and Half-Life of Materials
(polymers)
Reaction monitoring Viscosity

T2 – Inverse Laplace Transform
i.e. T2 Distribution of solvents in porous materials, hydration of food products like corn flakes and bread
Dynamics Center for TD-NMR data
- Peaks represent components in different environments, i.e. starch bound water and free water or water in small and large pores
- Integrals of peaks allow relative quantification of components
ILT
T2
www.bruker.com
© Copyright Bruker Corporation. All rights reserved.
Dr. Jochem Struppe [email protected]
Dr. Stefan Jehle [email protected]

Simultaneous Oil and Moisture Determination and Advanced Applications
Webinar - September 9, 2015
Dr. Stefan Jehle - Applications Scientist - [email protected]

Simultaneous Oil and Moisture Determination Chemometrics for Complex Mixture Analysis Emulsion Analysis: Droplet Size Distribution
Simultaneous Oil and Moisture Determination and Advanced Applications
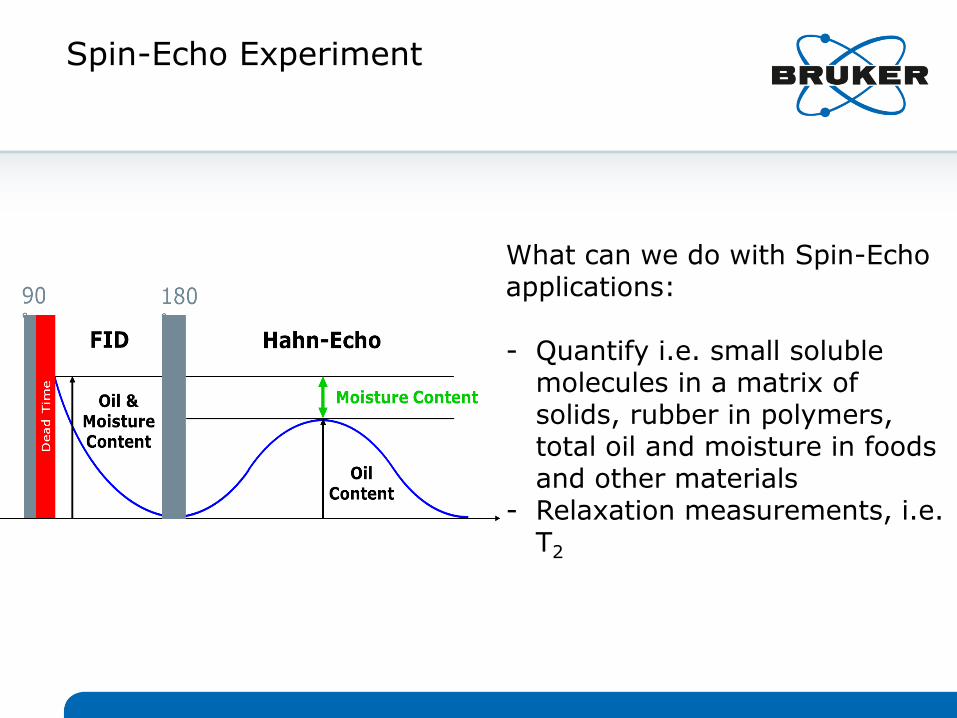
Spin-Echo Experiment
What can we do with Spin-Echo applications: - Quantify i.e. small soluble
molecules in a matrix of solids, rubber in polymers, total oil and moisture in foods and other materials
- Relaxation measurements, i.e. T2

Relaxation Profile for Protein/Carbohydrates, Moisture and Oil in Seeds
• Protein/Carbohydrates, moisture and oil have different relaxation properties which can be used to quantify components individually in materials like seeds

Spin Echo (Hahn Echo)
Experimental Parameters:
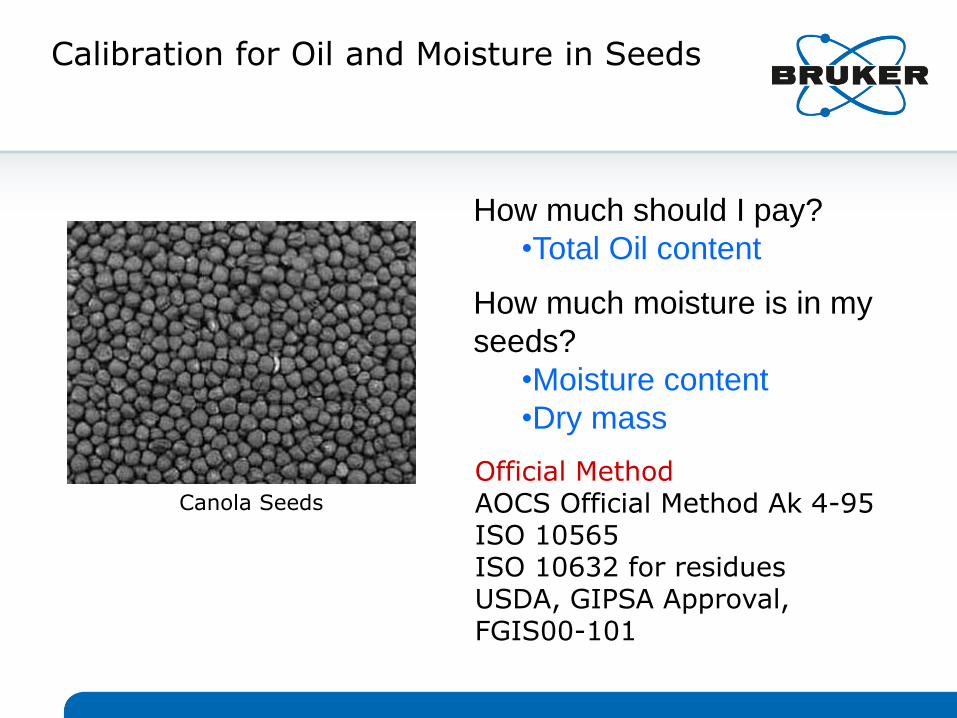
Calibration for Oil and Moisture in Seeds
Canola Seeds
How much should I pay?
•Total Oil content
How much moisture is in my
seeds?
•Moisture content
•Dry mass
Official Method AOCS Official Method Ak 4-95 ISO 10565 ISO 10632 for residues USDA, GIPSA Approval, FGIS00-101

Calibration for Oil and Moisture in Seeds
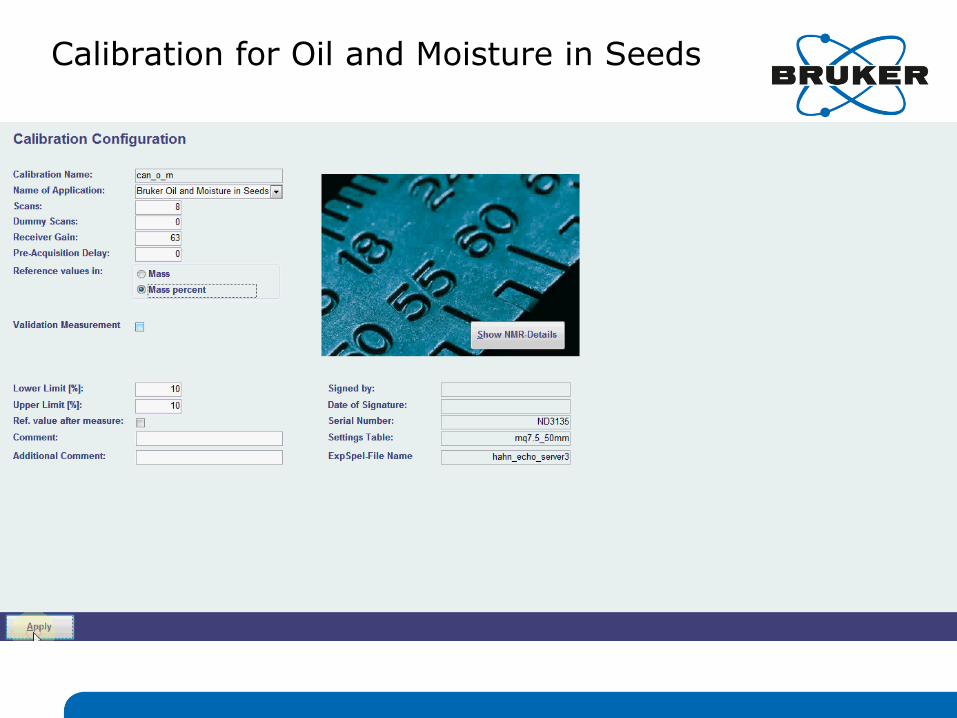
Calibration for Oil and Moisture in Seeds
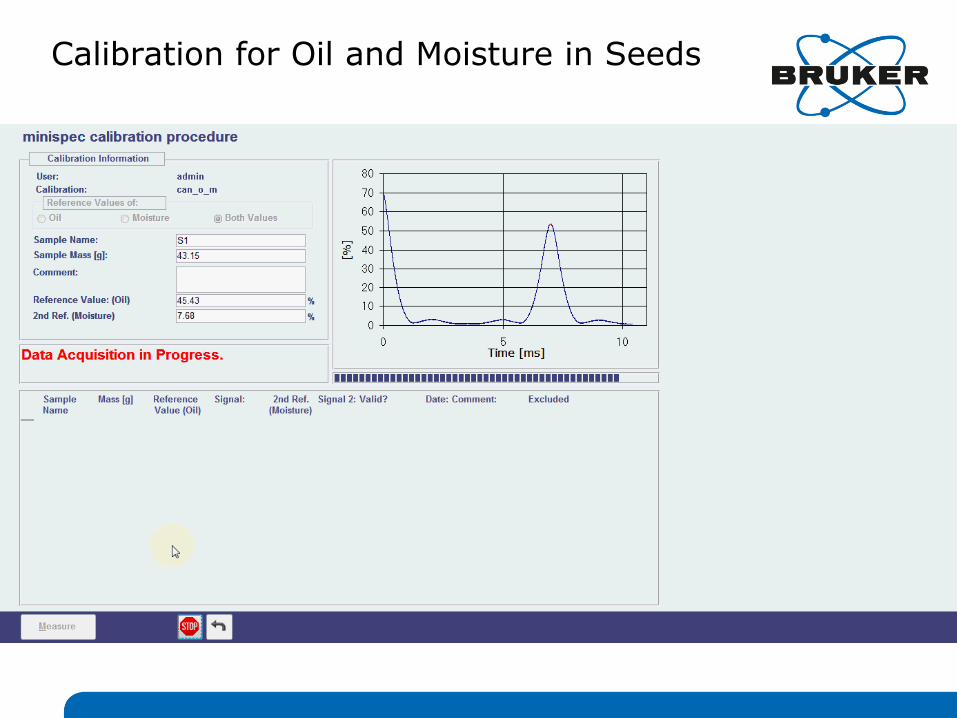
Calibration for Oil and Moisture in Seeds
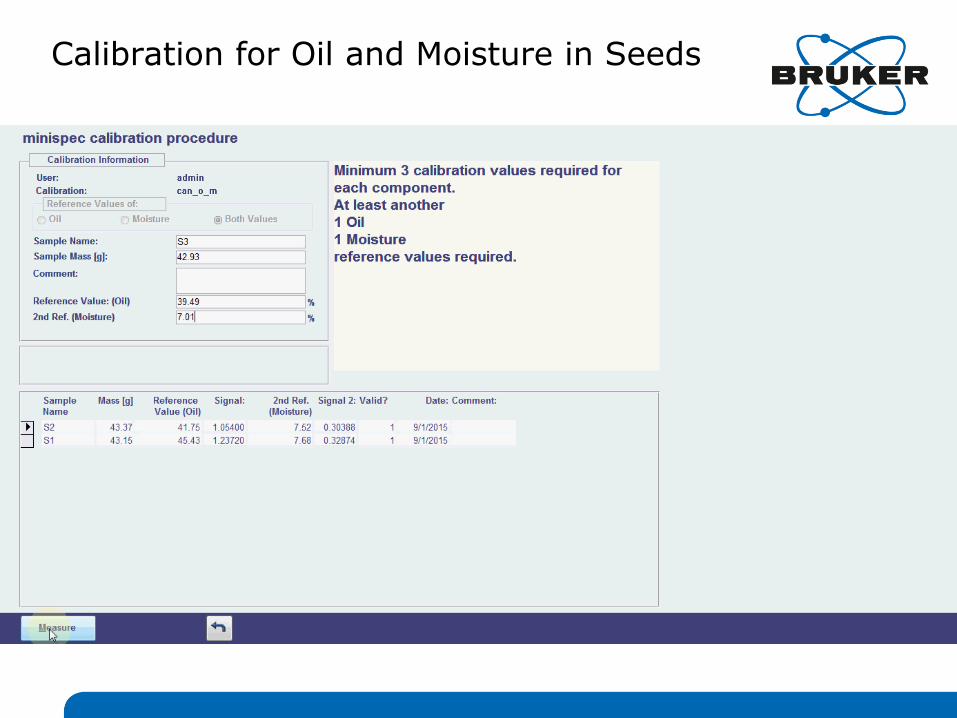
Calibration for Oil and Moisture in Seeds

Chemometrics Applications
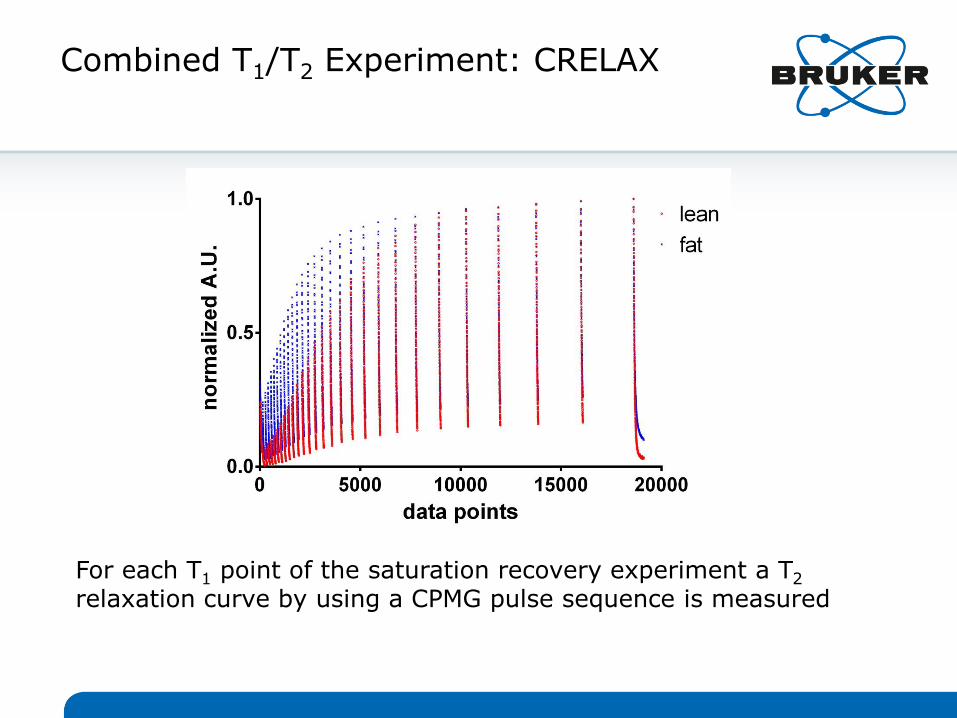
Combined T1/T2 Experiment: CRELAX
For each T1 point of the saturation recovery experiment a T2 relaxation curve by using a CPMG pulse sequence is measured
Multivariate Analysis for Quantification
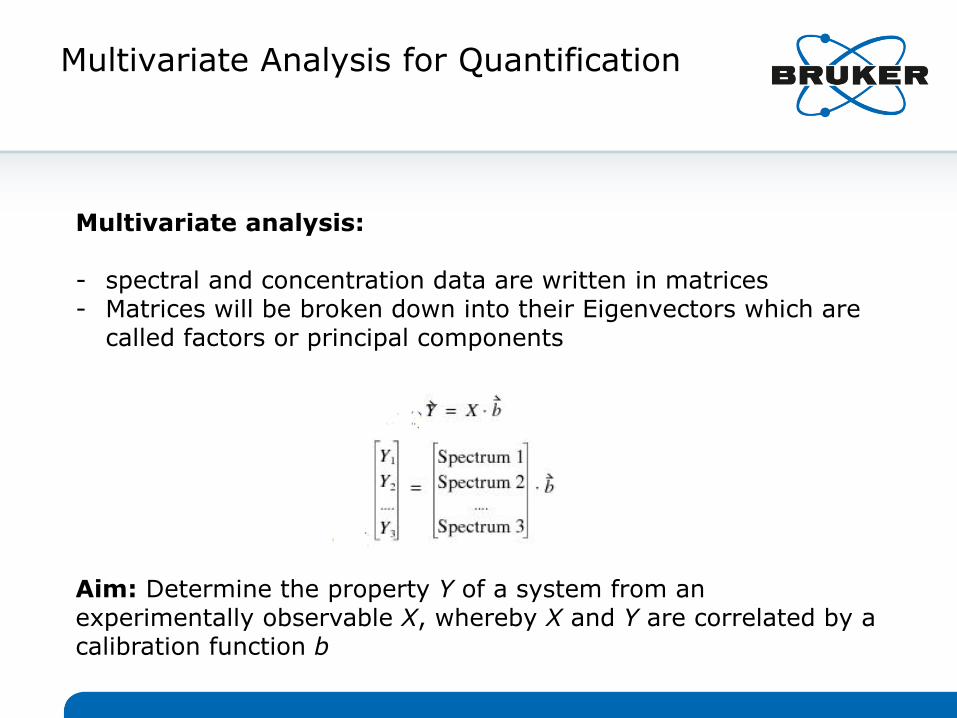
Multivariate analysis: - spectral and concentration data are written in matrices - Matrices will be broken down into their Eigenvectors which are
called factors or principal components
Aim: Determine the property Y of a system from an experimentally observable X, whereby X and Y are correlated by a calibration function b
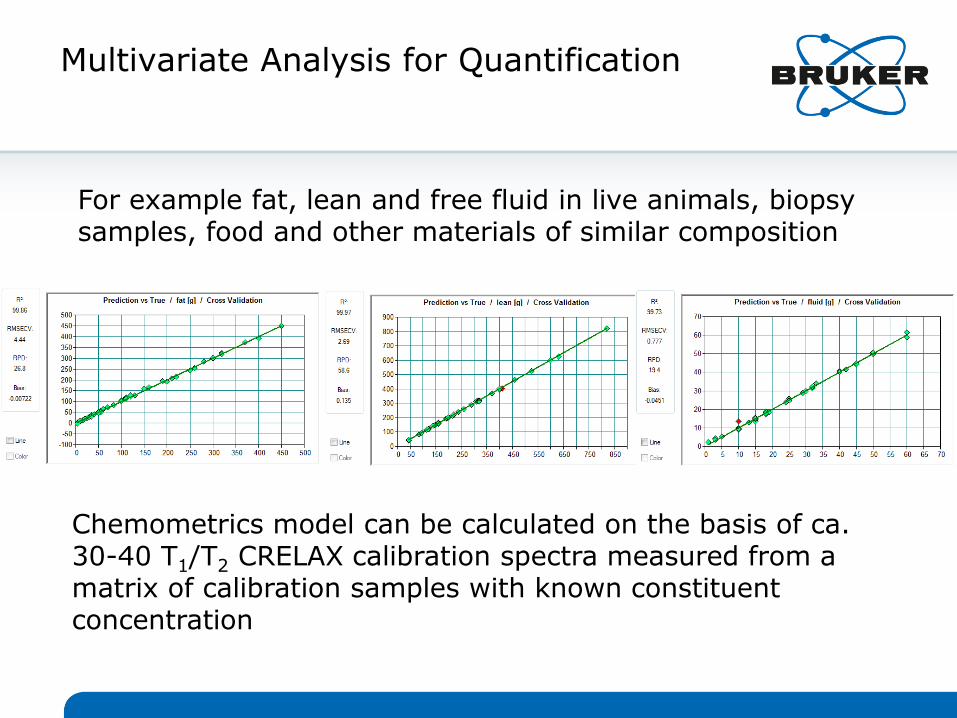
Chemometrics model can be calculated on the basis of ca. 30-40 T1/T2 CRELAX calibration spectra measured from a matrix of calibration samples with known constituent concentration
Multivariate Analysis for Quantification
For example fat, lean and free fluid in live animals, biopsy samples, food and other materials of similar composition

CRELAX for Oil Sands for the Determination of Bitumen and Water
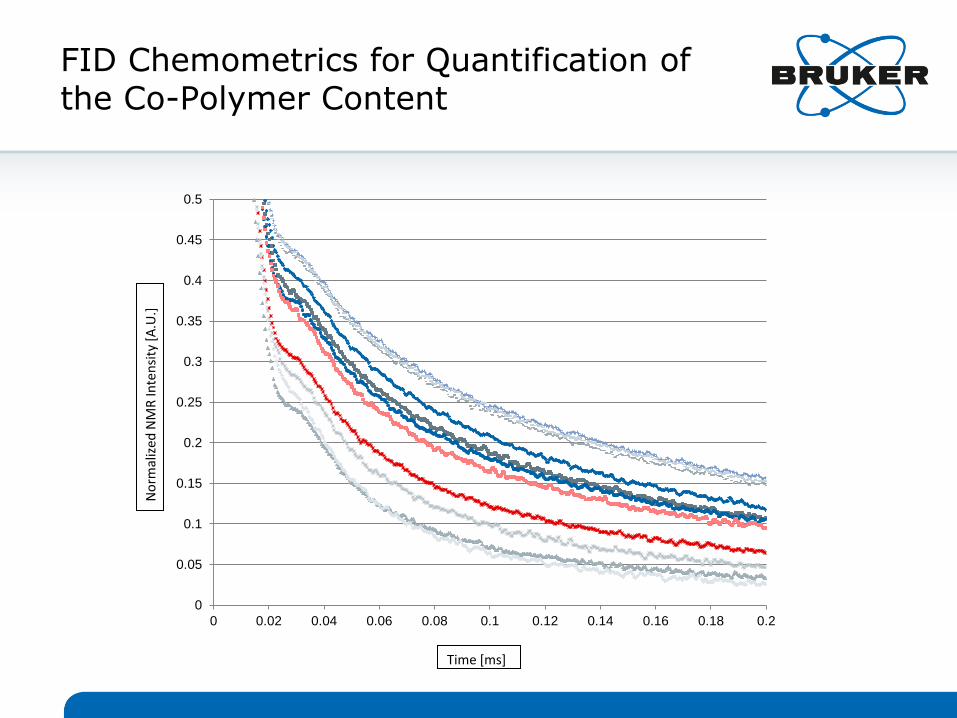
FID Chemometrics for Quantification of the Co-Polymer Content
0
0.05
0.1
0.15
0.2
0.25
0.3
0.35
0.4
0.45
0.5
0 0.02 0.04 0.06 0.08 0.1 0.12 0.14 0.16 0.18 0.2
Time [ms]
No
rmal
ized
NM
R In
ten
sity
[A
.U.]

Gradient Applications - Diffusion
water-in-oil
oil-in-water
Diffusion and Droplet Size Distribution Measurements in Materials and Products Food Industry, i.e. Margarine and
Mayonnaise Petrochemistry, i.e. Crude Oil
Emulsions Pharma and Healthcare, i.e.
Crèmes, Emulsions and Sunscreens Cosmetics, i.e. Lotions

Solid Fat Content (SFC) and melt profile of fat compositions and margarines
Oil or fat content in foods, feeds and confectionery products
Simultaneous determination of oil and moisture
Water distribution in food, i.e. cereals
Droplet size distribution in w/o and o/w emulsions
Investigation of freezing processes
Monitoring of hydrogenation process
TD-NMR Applications Areas
Food and Feed Industry

Spin Finish & Moisture on Fibers
Body Composition Analysis
Total 1H Content in Hydrocarbons, Crude Oil Emulsions, Bitumen and
Water in oil sands
Polymer Analysis, i.e. copolymer content,
crosslink density, xylene soluble content
Textile Industry Polymer Industry Petro Chemistry
Fluorine Content in Toothpaste and other materials
Contactless Check Weighing
Pharmaceutical and Healthcare Industry:
Solvents, Moisture and Crystallinity in Powders
and Tablets
TD-NMR Applications Areas

www.bruker.com
© Copyright Bruker Corporation. All rights reserved.
Dr. Stefan Jehle Applications Scientist

Q & A
Any questions?
Please type any questions you may have for our speakers in the Q&A panel and click Send.
How did we do?
When you exit the webinar, please fill out our evaluation survey to let us know. We appreciate your feedback.
Thank you!


