CONFERENCE PROCEEDINGS Visualizing the Future TIME FOR DECISIONS DECISIONS CONFERENCE TEAM President STEPHEN THORPE Program Chair MARK PALLADINO Associate Program Chair JESSICA SHEDD Pre-Conf Workshop Coordinator ALAN STURTZ Best Paper Chair MATTHEW HENDRICKSON Evaluation Coordinator LAURA UERLING Newcomer/Mentor Coordinator MARY GOODHUE LYNCH Poster Session Coordinator PAULA MAAS Proposal Peer Review Coordinator MARK ECKSTEIN Publications Coordinator CRISTI CARSON Local Arrangements Chair SHANNON TINNEY LICHTINGER Conference Website Coordinator CHRISTOPHER CHONCEK Exhibitor Coordinator GURVINDER KHANEJA Local Arrangements Coordinators ARLENE BLAYLOCK JOHN BURCZEK DREIER ELIZABETH CLUNE-KNEUER CONNIE PIERSON Technology Chair CHAD MAY Administrative Coordinator BETH SIMPSON
Transcript
CONFERENCE PROCEEDINGS
Visualizing the Future
TIME F O R
DECISIONSDECISIONS
CONFERENCE TEAM
President Stephen thorpe
Program Chair Mark palladino
Associate Program ChairJessica shedd
Pre-Conf Workshop Coordinator alan sturtz
Best Paper Chair Matthew hendrickson
Evaluation Coordinator laura uerling
Newcomer/Mentor Coordinator Mary goodhue lynch
Poster Session Coordinator Paula Maas
Proposal Peer Review Coordinator Mark eckstein
Publications Coordinator cristi carson
Local Arrangements Chair Shannon tinney lichtinger
Conference Website Coordinator christoPher choncek
Exhibitor Coordinator gurvinder khaneJa
Local Arrangements Coordinators arlene Blaylock John Burczek dreier elizaBeth clune-kneuer connie Pierson
Technology Chair chad May
Administrative Coordinator Beth siMPson
Dear NEAIR Colleagues,
The 39th
Annual NEAIR Conference held in Bethesda, Maryland, November 3-6, 2012 encouraged attendees to contribute to our conference theme of Time for Decisions: Visualizing the Future. Three hundred and nine conference attendees had the opportunity to share and gain invaluable information from institutional research and higher education colleagues. The 2012 Conference Proceedings is a result of the conference theme in action.
The Conference Program team led by Program Chair Mark Palladino and Associate Program Chair Jessica Shedd developed a program filled with plenty of variety that included four plenary/keynote sessions, 11 contributed papers, 32 workshares, five techshares, 13 special interest groups, and four table topics. Poster Session Coordinator Paula Maas organized 16 posters to be on display. These offerings went through a blind peer review process facilitated by 74 proposal reviewers and coordinated by Mark Eckstein. Pre-Conference Workshop Coordinator Alan Sturtz organized 15 workshops with 166 participants. Exhibitor Coordinator Gurvinder Khaneja and Beth Simpson partnered with 18 exhibitors who offered 8 exhibitor showcases and Lightning Talks.
A big thanks goes to Publications Coordinator Cristi Carson for all her hard work and keen eye editing the conference program, as well as compiling and organizing the 2012 Conference Proceedings. The 2012 Conference Proceedings contains papers submitted by authors as well as the 2012 Best Paper Award recipients. The award recipients were determined by Best Paper Chair Matthew Hendrickson and his committee. The 2012 Best Paper this year was awarded to Debra Allen and Theodore Coladarci of the University of Maine for their paper, Examining the Threat of Nonresponse Bias as a Follow-up to the National Survey of Student Engagement. The 2012 Best First Paper was awarded to Chunmei Yao of SUNY College at Oneonta for the paper, Using Internal Market Ratios to Detect Gender Differences in Faculty Salaries. The 2012 Best IR/Practitioner Award was awarded to Laura Ariovich and William Richman of Prince George’s Community College for their workshare session, Non-returner Survey: Why Students Leave.
Local Arrangements Chair Shannon Tinney Lichtinger and Local Arrangements Coordinators Arlene Blaylock, John Burczek Dreier, Elizabeth Clune-Kneuer, and Connie Pierson worked hard coordinating hotel, travel logistics and made sure we all enjoyed the NEAIR Third Place and all that Bethesda had to offer. Conference Website Coordinator Chris Choncek and Administrative Coordinator Beth Simpson developed and maintained the conference website as well as conference registration. Next year’s conference planning will be facilitated by online evaluations analyzed by Evaluation Coordinator Laura Uerling.
It was a pleasure to work with such an extraordinary Conference Planning Team and the many talented volunteers. A premiere professional development opportunity was the result of the efforts of these individuals. We hope you take advantage of all the great information the 2012 Conference Proceedings have to offer!
Best wishes, Stephen W. Thorpe, Ed.D NEAIR President 2011-2012
Leadership & Committees 2011-2012
Officers: President Stephen Thorpe President-Elect Catherine Alvord Secretary (’11-’14) Allison Walters Treasurer (’10-’14) George Rezendes
Steering Committee Members: Past President Gayle Fink Program Chair Mark Palladino Local Arrangements Chair Shannon Lichtinger Technology Chair Chad May Member-At-Large (’09-‘12) Emily Dibble Member-At-Large (’09-‘12) Paula Maas Member-At-Large (’10-‘13) Ann Marie Senior Member-At-Large (’10-‘13) Mary Goodhue Lynch Member-At-Large (’11-’14) Maren Hess Member-At-Large (’11-’14) Laura Uerling Administrative Coordinator (ex-officio) Beth Simpson
Standing Committees
Local Arrangements (Standing Committee) Chair Shannon Lichtinger Exhibitor Coordinator Gurvinder Khaneja AV Coordinator Jessica Shedd LAC Coordinators: Arlene Baylock John Burczek Dreier Elizabeth Clune-Kneuer Connie Pierson Membership (Standing Committee) Chair Mary Goodhue Lynch Chair-elect Maren Hess Member Laura Uerling Member Betsy Carroll Member Jane Kimble Member Ingrid Skadberg Past Chair Paula Maas Nominations (Standing Committee) Chair Gayle Fink Member – 2 YR Public Sector Gurvinder Khaneja Member Michelle Appel Member Becky Brodigan Member Elizabeth Clune-Kneuer Member Cherry Danielson Member Alexander Yin
Prof Development Services (Standing Committee) Chair Cathy Alvord Member - Program Chair-Elect Alan Sturtz Member Emily Dibble Member Nancy Ludwig Member Laura Uerling Program (Standing Committee) Chair Mark Palladino Associate Program Chair Jessica Shedd PCW Coordinator Alan Sturtz Evaluation Coordinator Laura Uerling Newcomer/Mentor Coord Mary Goodhue Lynch Peer Review Coordinator Mark Eckstein Poster Session Coord. Paula Maas Publications Coordinator Cristi Carson
Site Selection (Standing Committee) Chair Cathy Alvord Treasurer George Rezendes Past LAC/Program Nicole Marano Admin Coord (ex officio) Beth Simpson Technology (Standing Committee) Chair Chad May Conf Web Coordinator Chris Choncek LAC (ex officio) Shannon Lichtinger Program Chair (ex officio) Mark Palladino Admin Coord. (ex officio) Beth Simpson
Leadership & Committees 2011-2012
ad hoc Committees
Finance Committee Chair Emily Dibble Treasurer George Rezendes Member Julie Alig Member Rebecca Brodigan Member Gayle Fink Member Roland Pearsall Member Alan Sturtz
Grants Committee Chair Ann Marie Senior Chair-Elect Laura Uerling Member Lisa Daniels Member Peter Feigenbaum Member Jane Zeff Past Chair (ex officio) Michael Dooris
Conference Proposal Peer Reviewers Mark Eckstein, Peer Review Coordinator
Jacqueline Andrews Louis Attinasi Rosanne Bangura Melissa Barnett R. Benson Gary Boden Ellen Boylan Christina Butler Jason Canales Betsy Carroll Elizabeth Clune-Kneuer Margaret Cohen Theodore Coladarci Lauren Conoscenti Lisa Daniels Cherry Danielson Mary Ann DeMario Veena Dhankher Chrisanthy Diamantopoulos Kate Doria Michael Duggan Judy Dunham Jennifer Dunseath Nora Galambos Hong Gao Susan Gracia Jessica Greene Phil Handwerk Laura Harrington Braden Hosch Christopher Hourigan
Kristy Huntley Elizabeth Johnston-O'Connor Lisa Keating Ezekiel Kimball Daniel Larson Melanie Larson Ann Lehman Carol Lerch Paula Maas Rajiv Malhotra Tom McGuinness Peggy McKernan Pat Mizak Louise Murray Denise Nadasen Mitchell Nesler Doug Nutter Tiffany Parker Kim Pavlick Ellen Peters Maria Piteros Paul Prewitt-Freilino Heather Roscoe Elizabeth Shaffer Judith Shaw Layla Shumnok Sri Sitharaman Jacquelyn Stirn Susan Tammaro Joy Tatusko Danielle Taylor
Melissa Thorpe Steve Thorpe Rachel Tsang Laura Uerling Courtney Wade Alex Wagner Michael Whitcomb William Wilson Charlotte Woodward Jasmine Yang Alexander Yin Lillian Zhu
ACKNOWLEDGMENT
Contained within these pagers of the NEAIR 39th Annual Conference Proceedings are eight contributed conference papers authored by twelve NEAIR colleagues.
Additionally, you will find the contributed conference session and keynote presentations just a few clicks away on the NEAIR website under the Proceedings tab. These pages are only accessible to signed in NEAIR members.
Special thanks go out to Stephen Thorpe, Mark Palladino and Beth Simpson for their contributions, oversight and support with all aspects of publication responsibilities during the course of this past year.
Cristi Carson 2012-2013 NEAIR Publications Chair University of Southern Maine
Table of Contents
Can a Marketing Campaign Increase Response Rates to Online Course Evaluations? Kimberly Puhala Developing Community College Peer Institutions: Methods, Measures, & Issues. Joanna Musial-Demurat and Bruce Szelest Best Paper Examining the Threat of Nonresponse Bias as a Follow-up to the National Survey of Student Engagement. Debra Allen and Theodore Coladarci Maximizing the Utility of Alumni Feedback. Susan Tammaro NCES Projection Methodology: Institutional Research Applications. J. R. Robles Best IR/Practitioner Paper Non-returner Survey: Why Students Leave. Laura Ariovich and Allen Richman Testing Differences: Contrasts in Group Perceptions of Mission and Identity. Ellen Boylan and Kim Pavlick Best First Paper Using Internal Market Ratios to Detect Gender Differences in Faculty Salaries. Chunmei Yao
CAN A MARKETING CAMPAIGN INCREASE RESPONSE RATES? 1
Can a Marketing Campaign Increase Response Rates to Online Course Evaluations?
Kimberly Puhala
Quincy College
CAN A MARKETING CAMPAIGN INCREASE RESPONSE RATES? 2
Abstract
Switching from paper-and-pencil administration of surveys to online surveys has been shown to
result in a dramatic decrease in response rates. Fewer studies have examined response rates
when switching from paper-and-pencil course evaluations to online course evaluations. This
study examined the impact of a social marketing campaign on participation rates for online
course evaluations. In addition, the impact of having computer access and the use of pre-
notification postcards were also examined. The marketing campaign consisted of advertising the
course evaluation web link on large screen TVs, posters, through online messaging, and via
instructor announcements in class. Analysis of variance indicated that there were no differences
in response rates between marketing and non-marketing groups. Access to computers and using
a paper-and-pencil evaluation form did increase response rates when compared to online course
evaluations administered in classrooms that were not equipped with computers. Discussion
focused on the impact of online course evaluations on process and suggestions for creating
strong incentives for students to complete online course evaluations.
CAN A MARKETING CAMPAIGN INCREASE RESPONSE RATES? 3
Introduction
Implementing process efficiencies is paramount to institutional researchers, whose offices are
often under resourced. One area that is frequently under the jurisdiction of the Institutional
Research Office and is highly administrative in nature, as well as time-consuming, is the
administration of course evaluations. Efficiencies can be gained by switching to electronic
course evaluations that are administered online, yet there is often the very real fear that survey
response rates will drop significantly (Anderson, Cain, & Bird, 2005; Dommeyer, Baum, Hanna,
& Chapman, 2004; Norris & Conn, 2005; Nulty, 2008). Prior research has investigated ways to
increase response rates for surveys, in general, but few studies specifically address the
conversion of course evaluations from in-class paper-and-pencil administration to online
formats.
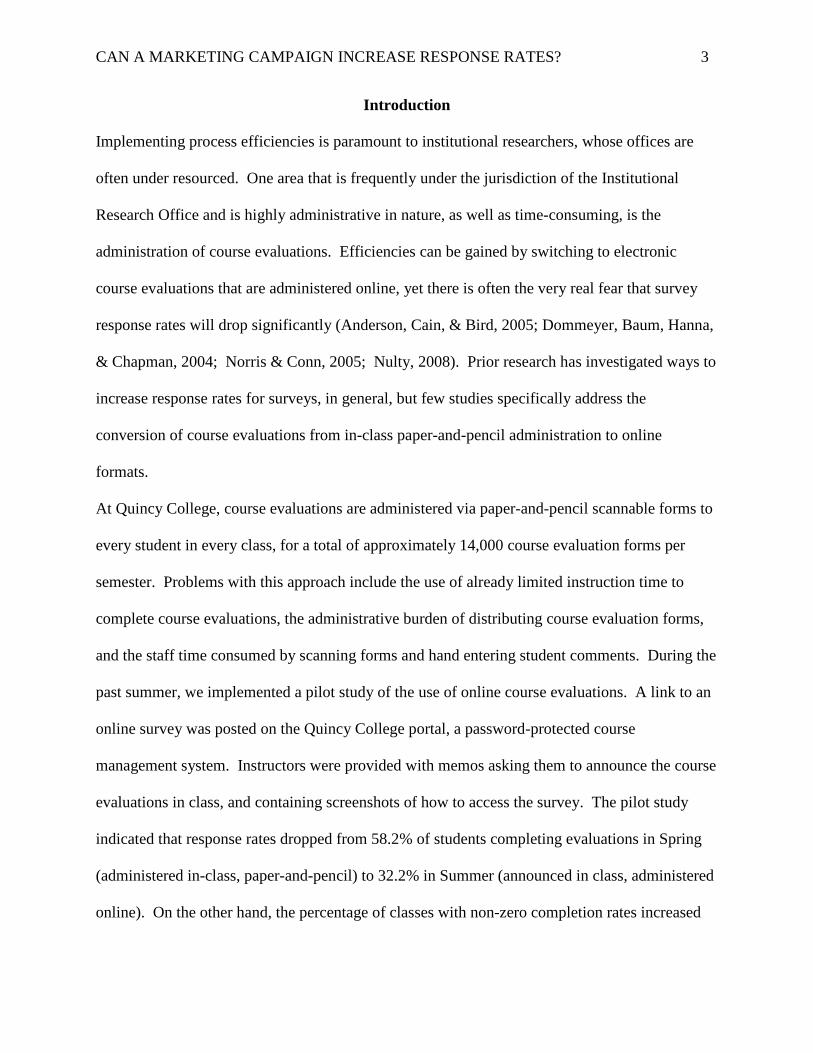
At Quincy College, course evaluations are administered via paper-and-pencil scannable forms to
every student in every class, for a total of approximately 14,000 course evaluation forms per
semester. Problems with this approach include the use of already limited instruction time to
complete course evaluations, the administrative burden of distributing course evaluation forms,
and the staff time consumed by scanning forms and hand entering student comments. During the
past summer, we implemented a pilot study of the use of online course evaluations. A link to an
online survey was posted on the Quincy College portal, a password-protected course
management system. Instructors were provided with memos asking them to announce the course
evaluations in class, and containing screenshots of how to access the survey. The pilot study
indicated that response rates dropped from 58.2% of students completing evaluations in Spring
(administered in-class, paper-and-pencil) to 32.2% in Summer (announced in class, administered
online). On the other hand, the percentage of classes with non-zero completion rates increased
CAN A MARKETING CAMPAIGN INCREASE RESPONSE RATES? 4
from 83.2% to 88.1%, which led us to conclude that the issue is motivating students to complete
the online course evaluations, rather than a breakdown in the communication of the new course
evaluation process.
A review of the literature indicates that response rates can be recovered for online course
evaluations through the use of several methods. The literature indicates that offering extra credit
or early access to course grades can return response rates to those found with paper-and-pencil
in-class administration of course evaluations (Anderson, et al., 2005; Dommeyer, et al., 2004).
However, there may be objections by faculty or administrators to use grade incentives on the
grounds that this method is coercive or may bias study results (Dommeyer, et al., 2004).
Additional studies have examined the use of incentives other than grades to boost response rates.
Strategies such as having faculty stress the importance of course evaluations, sending reminder
emails to students, posting the survey link on the course calendar, ensuring that responses are
anonymous, providing lottery incentives, and showing the students how to access the online
survey have all shown to improve response rates to online course evaluations (Anderson, et al.,
2005; Dommeyer, et al., 2004; Norris & Conn, 2005; Nulty, 2008). In addition, Nulty (2008)
indicates that using multiple methods further increases response rates. Kaplowitz, Hadlock, &
Levine found that the use of pre-notification postcards is effective at boosting response rates to
online surveys (as cited in Wren & Showers, p.4). In addition, variations in response rates may
be a function of logistics. Institutions with a higher number of computers per student have
higher response rates to online surveys (Porter & Umbach, 2006). These last two areas have not
been assessed specifically in regard to online course evaluations, which my research study
proposes to do.
CAN A MARKETING CAMPAIGN INCREASE RESPONSE RATES? 5
My research study will also introduce a novel approach to increasing response rates that draws
on techniques used in other fields. One approach that has been utilized by the field of Public
Health for decades is the use of media campaigns to initiate behavior change. This study will
examine the use of a media campaign designed specifically around course evaluations.
The main research question is whether or not a social marketing campaign can increase response
rates to online course evaluations. This study will also examine the additive effect of two other
techniques: the use of a pre-notification postcard and the accessibility of classroom computers.
Pre-notification postcards will consist of small cards with the marketing tagline and the web link
that will be distributed to students during class. All classes that teach in a computer lab will
complete the online evaluations during class time. An analysis of variance will be used to
examine the difference in response rates between the groups. The research hypotheses are as
follows:
1. The marketing campaign will increase course evaluation response rates compared to the
overall online evaluation response rates (32.2%) observed in a prior semester.
2. There will be higher response rates for those courses that are held in computer-equipped
classrooms and exposed to the marketing campaign than those exposed to the marketing
campaign alone.
3. Response rates for courses held in computer-equipped classrooms should be equal to
response rates (58.2%) seen in classrooms that complete paper-and-pencil course
evaluations.
4. There will be a higher response rate for those courses that receive pre-notification
postcards than those exposed to the marketing campaign alone.
CAN A MARKETING CAMPAIGN INCREASE RESPONSE RATES? 6
Methods
All courses that ran at Quincy College in Fall, 2011 except independent studies or internships
were included in the analysis, for a total of 718 courses. Courses were assigned to one of eight
possible study groups, which differed based on type of course evaluation (paper-and-pencil
versus online), whether the course finished before or after the start of a marketing campaign,
whether or not the course was held in a computer-equipped classroom, and whether or not the
course instructor handed out pre-notification postcards. Response rates were examined across
the eight study conditions, and group differences in response rates were analyzed using an
analysis of variance methodology.
Course Evaluations
The course evaluation form consisted of 46 questions. The first 26 questions asked the student to
rate various statements about the course on a 5-point Likert scale, from Strongly Disagree to
Strongly Agree. There was also a choice to indicate that the statement did not apply to the
course. Questions were organized in six categories, including Course Organization and
Instructional Methods, and Student Engagement. Additional questions asked students to rate
their satisfaction with different elements of the classroom. Student demographic information
was also collected, and there were three open-ended questions. Questions on the online course
evaluations were identical to the paper-and-pencil version, with the exception that students
answered one additional question about whether they preferred to do course evaluations online or
via the paper-and-pencil version. Online course evaluations were administered through
surveymonkey.com, and students could access the link from any internet-enabled computer and
were not required to complete the evaluations in class, except for the courses held in computer
CAN A MARKETING CAMPAIGN INCREASE RESPONSE RATES? 7
classrooms. No password or identification code was required to complete the online course
evaluations so that there were no barriers to accessing the course evaluations. Course evaluation
questions are included in Appendix A.
Course Assignment to Groups
Courses were assigned to study groups using both convenience and random assignment. Full-
time faculty are required by contract to have the students in their courses complete course
evaluations via paper-and-pencil, scannable forms. Therefore, all courses taught by full-time
contract faculty were assigned to the paper-and-pencil group. Courses that that ended after the
start of the marketing campaign were examined (Paper/Marketing) and compared to courses that
ended prior to the start of the marketing campaign (Paper/No Marketing). All courses taught by
adjunct faculty were assigned to complete online course evaluations, since there is no
requirement in their contract to complete paper-and-pencil evaluations. Courses held in
computer-equipped classrooms that ended after the start of the marketing campaign were
assigned to the Online/Computer/Marketing group, while those that ended before the start of the
marketing campaign were assigned to the Online/Computer/ No Marketing group. Courses that
were not taught in a computer-equipped classroom and were taught by adjunct faculty were also
assigned to online course evaluations. Those that ended prior to the start of the marketing
campaign were assigned to the Online/No Marketing group, and the remaining courses were
randomly assigned to either receive pre-notification postcards (Online/Postcard/Marketing) or to
not receive pre-notification postcards (Online/Marketing). Courses that were held exclusively
online were also included as a control group. The number of courses assigned to each study
group and the number of students in each study group are presented in Table 1.
CAN A MARKETING CAMPAIGN INCREASE RESPONSE RATES? 8
Table 1. Number of Courses and Students in Each Study Group
Study Group # Courses # Students Enrolled
Paper/Marketing 170 4,280
Paper/No Marketing 9 224
Online/Computer/Marketing 41 674
Online/Computer/No Marketing 23 362
Online/Postcard/Marketing 188 3,585
Online/Marketing Only 213 3,975
Online/No Marketing 37 610
Online Course 37 589
Total 718 14,525
Marketing Campaign
The Department of Institutional Research and Assessment collaborated with the Marketing
Department to create a marketing campaign that lasted for a three-week period. The marketing
campaign included the following components:
• The creation of a catchy tagline encouraging completion of the course evaluations
• Posting the course evaluation tagline and link on the College’s large screen TVs
• Placement of laminated signs at all college student use computers with the tagline
and the survey link
• Placement of large, cardboard posters announcing the campaign in each of three
academic buildings
• Placement of a reminder “button” on the college website
• Distribution of the survey link via student email
• Two email reminders to complete the course evaluation
CAN A MARKETING CAMPAIGN INCREASE RESPONSE RATES? 9
• Facebook and Twitter reminders to complete the course evaluations
• Faculty encouragement of students to complete online course evaluations with an
emphasis on their importance
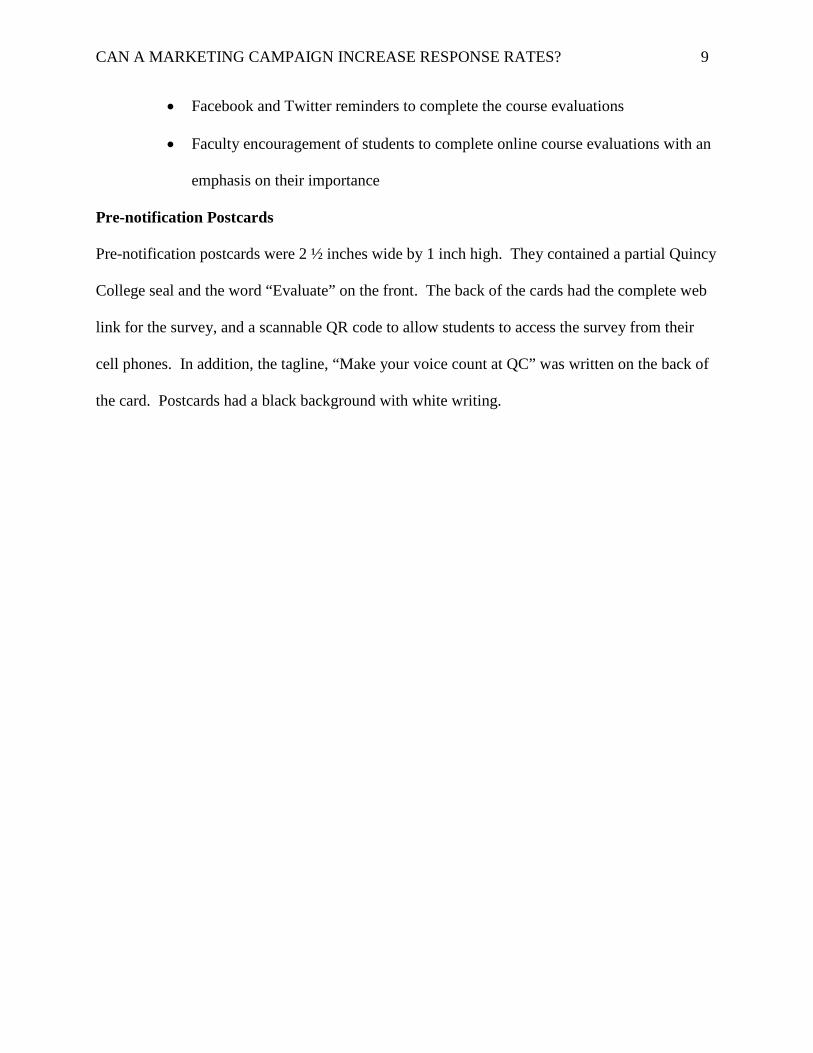
Pre-notification Postcards
Pre-notification postcards were 2 ½ inches wide by 1 inch high. They contained a partial Quincy
College seal and the word “Evaluate” on the front. The back of the cards had the complete web
link for the survey, and a scannable QR code to allow students to access the survey from their
cell phones. In addition, the tagline, “Make your voice count at QC” was written on the back of
the card. Postcards had a black background with white writing.
CAN A MARKETING CAMPAIGN INCREASE RESPONSE RATES? 10
Results
The response rates to the paper-and-pencil administration in the semesters prior to switching to
online course evaluations were 60.6% in Fall 2010 and 58.2% in Spring 2011. A pilot test of the
switch to online course evaluations was conducted in Summer 2011, and overall response rates
fell to 32.2%. The overall response rate to the Fall 2011 online course evaluations was 36.2%.
Analysis of Variance was conducted and indicated that courses where students completed paper-
and-pencil evaluations had higher overall response rates than those who completed online
evaluations in a computer-equipped classroom, which had higher response rates than courses
whose students completed online evaluations (63.8% vs. 41.4% versus 22.6%, F=238, p<.001).
Analysis of Variance was used to further investigate the differences in response rates between
the eight study groups, and specifically, whether there were any differences in response rates
based upon the marketing campaign and the pre-notification postcards. The analysis of variance
indicated that there were significant differences in response rates among the eight groups (F=71,
p<.001). However, post-hoc tests revealed that there were no significant differences in response
rates between the paper-and-pencil administration of course evaluations whether or not they were
63.8%
41.4%
22.6%
0.0%
10.0%
20.0%
30.0%
40.0%
50.0%
60.0%
70.0%
Paper-and-Pencil evaluations
Online Evaluations, computer-equipped
classroom
Online Evaluations, non-computer
classroom
Response Rates by Evaluation Type
CAN A MARKETING CAMPAIGN INCREASE RESPONSE RATES? 11
exposed to the marketing campaign (p=.078). In addition, there were no significant differences
between response rates for online evaluations that were completed in computer-equipped
classrooms, whether or not they were exposed to the marketing campaign (p=.345). Last, an
analysis of variance conducted on the four online evaluation groups that were completed outside
the classroom indicated that there were no significant differences, even if they received a pre-
notification postcard (p=.671). Results are presented in Figure 2.
Figure 2. Response Rates for Fall 2011 Online Course Evaluations by Study Group
0.0%
10.0%
20.0%
30.0%
40.0%
50.0%
60.0%
70.0%
Paper, Marketing
Paper, No Marketing
Online, Computer, Marketing
Online, Computer, No
Marketing
Online, Postcard, Marketing
Online, Marketing
Online, No Marketing
Online Course
Response Rates for Fall 2011 Online Course Evaluations by Study Group
Spring 2011 Overall Response Rate
Fall 2011 Overall Response Rate
Summer 2011 Overall Response Rate
Fall 2010 Overall Response Rate
CAN A MARKETING CAMPAIGN INCREASE RESPONSE RATES? 12
Discussion
Overall, study results indicated that there were no increases in response rates as a function of
either the marketing campaign or the pre-notification postcards. The conclusion drawn is that
students need a stronger incentive in order to motivate them to complete course evaluations. In
some ways, this is not surprising as we are seeing lower and lower response rates to surveys
across the college. This could be a result of students getting bombarded with surveys and other
electronic announcements. The results of this study were used to support the purchase of a new
online evaluation system that is integrated with our college portal. Students will have their
access restricted from the portal’s other functions if they do not complete the course evaluations.
We are hypothesizing that this will be a strong enough incentive for students to complete the
course evaluations each semester. This new system will be implemented in time for the Spring,
2013 course evaluation cycle.
There was some evidence that response rates were trending higher for the paper-and-pencil
administration of course evaluations in courses that had been exposed to the marketing
campaign. One problem may have been that there were only 9 courses in the paper-and-
pencil/no marketing group, versus 170 in the paper-and-pencil/marketing group. The reason for
this discrepancy was because of the small number of courses that ended prior to the start of the
marketing campaign, which was out of the experimenter’s control and based on the limited
number of 10-week courses offered during the semester. Perhaps replicating the study with a
higher number of courses in the paper-and-pencil/no marketing group would yield significant
differences in response rates.
A surprising finding was that response rates for online evaluations completed in computer-
equipped classrooms were lower than response rates for paper-and-pencil administration. This
CAN A MARKETING CAMPAIGN INCREASE RESPONSE RATES? 13
was surprising because the evaluations should have been administered in class in the exact same
manner that the paper-and-pencil evaluations were conducted, and therefore, all students should
have completed the course evaluation if they were in class that day. It is possible that since all
full-time faculty had to complete paper-and-pencil evaluations, while adjunct faculty completed
online course evaluations. It is possible that the higher response rates were a function of faculty
status, with full-time faculty being more committed to completing evaluations since the
evaluation process is clearly delineated in their union contract. Also, another possibility is that
instructors encountered technological difficulties with the online evaluations that contributed to
lower response rates. In fact, several instructors had reported that they had trouble accessing the
online course evaluation system.
One element of this study that is applicable to institutional researchers is the efficiency
improvements in workload required of online course evaluations versus paper-and-pencil
administration. In this particular Institutional Research office, which consists of one FTE worker
and one part-time work study student for a school with a headcount of 4,674, processing time
from when all evaluations were received in the office to when the final report was available to
the college administrators was reduced from six months to three months. The major time saving
occurred as a result of not having to scan paper-and-pencil evaluation forms or enter student
comments. The process to clean the data, analyze the data, and write up the results was
equivalent to the process for the paper-and-pencil evaluations. Additional time savings resulted
from not having to compile packets of evaluation forms for each instructor; when switching to
the online course evaluation system, one memo was distributed to all instructors that were
completing online course evaluations that contained instructions and the web link where the
survey could be found. In addition, monetary savings were achieved. The cost of a yearly
CAN A MARKETING CAMPAIGN INCREASE RESPONSE RATES? 14
subscription to surveymonkey.com is approximately $300, compared to approximately $1,500
spent in purchasing scannable evaluation forms. Plus, administering online course evaluations is
a much “greener” solution than utilizing paper-and-pencil evaluation forms. In conclusion,
although the study hypotheses were not supported, there were process improvements that
resulted from this study which led to the decision to purchase a new system that should result in
a greater incentive for students to complete course evaluations.
CAN A MARKETING CAMPAIGN INCREASE RESPONSE RATES? 15
REFERENCES
Anderson, H. M., Cain, J., & Bird, E. (2005). Online student course evaluations: Review of
literature and a pilot study. American Journal of Pharmaceutical Education, 69(1), 34-
43.
Dommeyer, C. J., Baum, P., Hanna, R. W., & Chapman, K. S. (2004). Gathering faculty
teaching evaluations by in-class and online surveys: their effects on response rates and
evaluations. Assessment & Evaluation in Higher Education, 29(5), 611-623.
Norris, J. & Conn, C. (2005). Investigating strategies for increasing student response rates to
online-delivered course evaluations. The Quarterly Review of Distance Education, 6(1),
13-29.
Nulty, D. D. (2008). The adequacy of response rates to online and paper surveys: what can be
done? Assessment & Evaluation in Higher Education, 33(3), 301-314.
Porter, S. R. & Umbach, P. D. (2006). Student survey response rates across institutions: why do
they vary? Research in Higher Education, 47(2), 229-247.
Wren, S. & Showers, N. (2010). The big payoff: Use of incentives to enhance participation in
web surveys. Association for Institutional Research IR Applications, 25, 1-11.
CAN A MARKETING CAMPAIGN INCREASE RESPONSE RATES? 16
APPENDIX A: Course Evaluation Questions
Questions 1-26 were rated on a 5-point Likert scale (Strongly Agree, Agree, Neither Agree nor Disagree, Strongly Disagree) and students were also offered the choice Doesn’t Apply.
A. Organization and Planning 1. The instructor’s expectations were clear. 2. The classes for this course were held for the allotted hours. 3. The content covered was consistent with the course objectives as stated in the
syllabus. 4. The instructor displayed knowledge of the subject. 5. The instructor summarized or emphasized important points in class.
B. Communication 6. The instructor’s presentations were clear and well organized. 7. The instructor communicated clearly in English (or the language used in the
course). 8. The instructor used challenging questions or problems. 9. The instructor inspired me to learn.
C. Faculty/Student Interaction 10. The instructor was accessible outside of class. 11. The instructor was helpful and responsive to students. 12. The instructor created a learning environment that encouraged open discussion
D. Assignments, Exams, and Grading 13. The information given to students about how they would be graded was clear. 14. Assignments were returned in a timely manner. 15. The instructor’s feedback on assignments and exams in this course was effective
in helping me learn. 16. The work load for this course was appropriate.
E. Instructional Methods 17. The articles, videos, internet, etc. were effective in helping me learn. 18. The out of class assignments were effective in helping me learn. 19. The in-class assignments were effective in helping me learn. 20. The text(s) used in this course were effective in helping me learn. 21. The instructor used a variety of teaching methods.
F. Student Engagement 22. This course contributed to my knowledge, skills or personal development. 23. This course helped me to think independently about the subject matter. 24. I studied and put effort into the course. 25. I was challenged by this course. 26. I would recommend this course to another student.
G. Overall 27. The pace of this course was: (Very Fast) (Somewhat Fast) (About right)
(Somewhat Slow) (Very Slow) 28. The overall quality of this course was: (Excellent) (Very Good) (Good)
(Fair) (Poor)
CAN A MARKETING CAMPAIGN INCREASE RESPONSE RATES? 17
Questions 29-35 were rated on a 5-point Likert scale (Very Satisfied, Satisfied, Somewhat Satisfied, Not Very Satisfied, Not At All Satisfied) and students were also offered the choice Doesn’t Apply.
H. Please rate your satisfaction with the classroom in each of the following: 29. Size of the classroom 30. Outside classroom noise/distractions 31. Classroom temperature 32. Classroom lighting 33. Cleanliness of classroom 34. Working order of Equipment and Technology 35. Ease of use of the Quincy College Portal
I. Student Information 36. Are you currently in a Certificate or Associate Degree program at Quincy
College? 37. If in a certificate or degree program at Quincy College, what is your program of
study/major? 38. How many credits are you taking this semester? 39. How many credits have you completed at Quincy College prior to this semester? 40. What was the most important reason for your taking this class? (choose one):
College Requirement, Elective, Because of the Instructor, Related to my work, Personal Interest
41. Did you take the pre-requisite for this course? 42. Do you communicate better in English or in another language? 43. What is your gender?
J. Comments 44. What did you like about this course? 45. What didn’t you like about this course? 46. What aspects of the course would you change?
Developing Community College Peer Institutions: Methods, Measures, & Issues
Joanna Musial‐Demurat Columbia‐Greene Community College
State University of New York
Bruce Szelest University at Albany
State University of New York
Abstract: Dimensions of finance, size, complexity, quality and service area characteristics are captured in the peer group development process used by a public two‐year community college. A cluster analysis approach, data integrity/limitations and campus political considerations shape the development of institutional peers.
Paper presented at the 2012 North East Association for Institutional Research, Bethesda, Maryland
2
Introduction Community colleges serve almost half of the undergraduate students in the United States, providing open access to postsecondary education, preparing students for transfer to four‐year institutions, and offering workforce development and skills training. Given the scope and importance of the community college role, it is difficult to overstate the importance of assessing and strengthening the quality of its education, performance and outcomes. Proper selection of peer groups is a key starting point in effective use of benchmarking for improvements and changes which can help to transform institutions to enhance their standing.
Both external and internal forces create a need for development of accurate peer groups for community colleges (Bers, 2006). The external factors include pressure for accountability and efficiency and thus proof that colleges provide quality education, allocate appropriately their funds, and are effective in fulfilling their missions. Community colleges must show student attainment and institutional effectiveness through analyzing intra‐institutional trends and inter‐institutional benchmarking (Juhnke, 2006). The internal motivations of selecting peer groups include self‐evaluations that may help to identify areas in which a college needs improvements and in which it is strong and needs to sustain its position. In other words, benchmarking can be used to focus college attention on practices, programs, and policies that may be in need of improvement – and on those worthy of celebration (McClenney, 2006). Both external and internal motivations support benchmarks and benchmarking (Bers, 2006).
The Columbia‐Greene Community College (CGCC) is one of 64 campuses in the State University of New York system. The system includes four university centers, nine other doctoral‐granting institutions, thirteen university colleges, nine technology colleges, and twenty nine community colleges. The 29 community colleges are very diverse and so it is not obvious how any one of them can know which other community colleges would be appropriate peers for benchmarking. Our research aims at helping individual community colleges decide how to narrow their choices of peers in order to create comprehensive benchmarking groups.
Columbia‐Greene Community College, like other community colleges, has a need to develop a list of peer institutions to support its institutional planning and effectiveness, decision making processes, and planned initiatives. Its original peer list was successfully developed about fifteen years ago and has been updated a few times since then. The college primarily used informal panel reviews and a threshold method to create its original list of peers, and later during the updating process. The latest version of Columbia‐Greene’s peers is now some 8 years old. Although the list is still basically appropriate, it needs re‐evaluation due to the fact that the last ten years have brought many changes in higher education, particularly within the SUNY system. Within New York State, and nationally, many colleges continually
3
adjust and transform themselves to meet new challenges and enhance their standing. These processes are visible across all institutions starting from research universities through university colleges and technical colleges, and community colleges. Some changes are commonly visible across groups of institutions; for example, residential student housing projects brought changes and new challenges to many community colleges in the last decade. To facilitate changes which occurred at Columbia‐Greene Community College as well as those at our historical peers, we have decided to re‐evaluate and revisit our peer group selection though applying an advanced method of peer selection used successfully for the same purposes by the University at Albany in 1996 and 2011 (Szelest 1996; Musial‐Demurat & Szelest, 2011).
Literature Review Types of comparison groups
Previous research has identified several peer types that have been successfully used during peer selections for four‐year colleges and major research universities. Brinkman and Teeter (1992) listed the best known types of comparison groups; 1) competitors, which regard to applicants, faculty, or financial resources, 2) aspirational, those institutions we strive to be like in some respects, 3) predetermined, those institutions that are natural, traditional, or which share a common jurisdictional area, and 4) peers, which can be used in benchmarking. This classification of comparison groups, for the most part, remained constant across time. It helps with identification of a pool of institutions that should be selected based on the given situation and purpose of the comparison. Three distinctive comparison groups were identified for community colleges in the five benchmarking projects discussed by Hurley (2002a): peer institutions and peer groups, comparator institutions, and benchmarking institutions. Very similar peer types are used in newer publications on comparison groups for community colleges. Horn (2008) refers to “peer grouping” while describing the use of benchmarking in term of its development, mechanics, and implications for California’s system of 109 community colleges. Juhnke (2006) uses the “peer institutions” term while discussing the National Community College Benchmark Project (NCCBP), which provides community colleges within a system to report data on key learning outcomes and indicators of institutional effectiveness and to compare their results with data from selected peer insinuations. Similarly, Manning and Bostian (2006) refer to “peer institutions” while discussing how Central Piedmont Community College (CPCC) has used data from the NCCBP to initiate and implement strategies that were demonstrated to be effective in reducing course‐withdrawal rates. Another term ‐‐“community colleges clusters”‐‐ is used by Hurley (2009) in his study of the Community College Survey of Student Engagement (CCSSE) benchmarks for extra‐large community colleges.
4
Methods
There is no one generally accepted standard technique with which to identify peer institutions. Brinkman and Teeter (1987) define cluster analysis, hybrid, threshold, and panel reviews as useful methods for peer institution selection. These methods range from a purely statistical technique like cluster analysis to mainly subjective methods like a panel review. All of them have been used for development of peer institutions for four –year colleges and research universities. These institutions have much longer histories and stronger foundations in peer selections than community colleges do (Hurley, 2002b), so that community colleges have a significant need for benchmarks of education quality (McClenney, 2006). In recent years, several scholars and practitioners have focused on using cluster analysis for selecting peer groups or clusters for community colleges. For example, Hurley (2002) discusses how cluster analysis has been employed in various community college peer grouping efforts. This statistical analysis is also applied by Hurley (2009) in research on the formation of community college clusters using the CCSSE benchmarks for extra‐large community colleges. Similarly, cluster analysis was used for peer grouping for California’s system of 109 community colleges (Hom, 2008). One of the reasons that this statistical tool has been used for peer grouping on system‐level benchmarking is that it prevents politically biased peer selections that would favor certain colleges. Hybrid approach
Although, there are advantages of using cluster analysis for peer selections, especially for system‐level analysis, in recent years several scholars have strongly recommended a hybrid approach as a useful tool in forming peer groups because it incorporates the advantages of both the data‐driven analysis and expert judgment (Ingram 1995; Zhao 1997; Lang 2000; Xu 2008; Archer, Reiss, Armacost, Sun, Fu 2009; Musial‐Demurat, Szelest 2011). The approach is used for analyzing peer groups mostly for four‐year colleges and its applicability to community college settings was not explored in detail. Thus our research aims to evaluate how the hybrid approach can be used for selection of institutional peers by community colleges. The research uses a combination of statistically driven techniques and subjective judgment methods in regard to selecting possible sets of peers, variable selection and weighting schemes. Overall, the structure of the research is based on methods and findings presented in the paper “In Search of Peer Institutions: Two Methods of Exploring and Determining Peer Institutions” (Szelest, 1996) and further developed peer selection ideas presented in Musial‐Demurat & Szelest 2011. These two publications are thus the core starting points for the present research in terms of methodological approach. Additionally, however, we now focus on a different set of institutions. Whereas the prior methodological work was developed and tested for selection of peer four–year public research universities, this new research focuses on community colleges.
5
Dimensions
Two‐year colleges differ significantly from one another, and there is a dramatic variation in terms of institutional characteristics like size, geographic location, available resources, programs, and in terms of student characteristics like enrollment patterns. These differences must be taken into consideration in the benchmarking process, both when interpreting an individual institution’s benchmark scores and when making institutional comparisons (McClenney, 2006). Dimensions like size, finance, quality, and complexity have been commonly used for peer analysis for four‐year colleges and research universities (Szelest, 1996; Zhao 1997; Weeks, Puckett, Daron 2000; Xu 2008; Gaylor 2009; Nzeukou and Muntal 2010). Hurley (2002) recommends using these dimensions for identification of peer institutions for community colleges based on his evaluation of peer analyses conducted on the state and institutional levels. However, the validity and reliability associated with these institutional variables in the four‐year college and universities levels have been established over last two decades. But this is new research focusing on community colleges (Hurley, 2002b). Thus there is a need for reevaluation of institutional dimensions/variables to determine which can best be used for peer selections for the two‐year college setting, taking into consideration the unique symbiosis of community colleges and their communities. Factors like the social‐economic profile of the surrounding community or wealth of the community are examples of factors that may be more critical for establishing benchmark groups for community colleges within the same state, as well as in other states.
Variables
Once important dimensions have been chosen, variables can be identified for determining peer institution selection. According to Aldenderfer and Blashfield (1984), the selection of variables in peer analyses is one of the most critical steps in the research process. That is because the choices of variables for peer comparisons strongly influence the characteristics of institutions and thereby the selection of peer groups.
In many peer selection studies variables are placed into major categories, which frequently are similar or the same as dimensions. Interestingly, comparison of dimensions used by researchers for analysis peers for four‐year instructions including research universities (Szelest, 1996) and two‐year institutions (Hurley, 2002) shows that the same taxonomy‐‐including institutional level, size, complexity, quality and finance‐‐can be used for selecting peers for those institutions. However, there are some differences in terms of variables used for peer selections for four‐year colleges and research universities and two‐year community colleges. For example, variables used for measuring quality differ based on type of institution; SAT scores are frequently used in four‐year colleges whereas most community colleges have an open enrollment policy and accept students without requiring these scores. Similarly, funding sources differ between different types of higher education institutions, with research
6
universities on one end of the spectrum paying a lot of attention to research expenditures and on the other end community colleges, which usually do not generate research funds. There is no consensus among scholars on the correct number of variables to use for peer comparison analyzes. Some researchers like Nzeukou and Muntal (2010) use a large number of variables grouped in a few dimensions in their analysis aiming to select peer institutions. Similarly, the IU Northwest peer institution report discuses many variables that are used during a peer selection process. Other researchers like Archer, Reiss, Armacost, Sun, Fu (2009) or Weeks, Puckett, Daron (2000) focus on fewer variables while selecting peer groups. Weights
After making decisions on the type of comparison group, methods of selecting institutions, and dimensions and variables for peer analyses, it is time for another very important step: the choice of weighting scheme. There is no agreement among scholars whether weighting in necessary during the selection of peer institutions. Some scholars (Szelest, 1996; Xu, 2008) have made conscious decisions not to weight the variables/factors in their studies. One given reason rests on the assumption that variables/ factors may receive special considerations in pre‐final analysis procedures so they do not need weighting in the final stage of peer comparison. For example, size variable is frequently considered in the initial processes of peer comparisons and is captured through multiple measures, so it may not need additional weight in the final step. Other researchers, such as Week et al (2000), have made a decision to weight the selection variables to give greater or lesser emphasis to key factors related to each campus’s mission and programs. Similarly, Hom (2008) indicate that for peer grouping study for California’s system of 109 community colleges staff needed to weight the specific criteria that applied to accountability programs. Summary
Thus this present research not only surveys fifteen years (1996‐2011) of scholarly literature on selecting peer institutions for four‐year colleges including Szelest’s (1996) methodology but also evaluates research on peer institutions for community colleges and explores how to adapt the methodology to the 2‐year setting. As such, it highlights best practices around the most frequently used methodological approaches, dimensions upon which comparisons are often based, and the individual variables and metrics used in identifying peers. The research refers to approaches already employed (by others) on community colleges for peer selections such as usage of CCSSE benchmarks for formation of community college clusters (Hurley, 2009) or peer groupings implemented in California system of 109 community colleges (Hom, 2008).
Dataset Development A dataset was developed to include 35 (public) NYS community colleges for potential analysis. Because the target institution to which peer selections are to be made is Columbia‐
7
Greene Community College, a Carnegie Associate's‐‐Public Rural‐serving Small College (2010), potential peer institutions with the similar classification ‘Associate’s Public College’ were chosen for exploration. Following the input from college leaders and the literature on intra/inter‐state benchmarking, a decision was made early in the process to consider as possible peers only community colleges within New York State. The main reason for focusing on institutions from one state lies in fact that states vary considerably in the ways community colleges are regulated, governed, and funded. For example, in some states local taxes comprise a substantial revenue source for two year colleges, whereas in other states all funds are received from the state (Bers, 2006). Similarly, some states have statewide faculty contracts, which limit an institution’s autonomy to make decisions about employees’ salaries and benefits whereas other states have much open policies related to faculty employment (Bers, 2006). Thus a decision was made to limit the pool of possible peers to only New York State colleges taking in to consideration that Columbia‐Greene Community College is located in this state. Additionally, the comparison group is restricted to public institutions due to the public control of the target institution, which is a part of the State University of New York (SUNY) system. Extraction of institutions with these criteria (public, New York State institution, Associate’s College) from the IPEDS data analysis tool resulted in a dataset of 35 institutions comprising 29 community colleges from the SUNY system and 6 community colleges from the CUNY (City University of New York) system.
Missing data are a concern in any quantitative analysis. This is true even with IPEDS data for which NCES has the power to impose monetary (and worse!) penalties for institutions that do not submit timely or accurate data. There are no doubt myriad reasons why data may show up as missing in IPEDS, including applicability, reporting errors, or even a result of extracting data from one particular IPEDS survey like the GASB financials survey as it appears that public universities should use that specific reporting form, but in reality a handful of public institutions use the FASB financial instrument. As discussed below, the analytic methods used in this research require complete data. Missing data excludes institutions from the analyses. These instances were very few, as only a few isolated instances of missing data were identified. In these instances, mean substitution was used. In addition, a flag was added to the underlying data file so that if campus leaders chose to inspect the raw data for any particular school, they could identify instances where mean substitution was used.
The rationale for using mean substitution is that because of the number of measures used (43), it is believed that using the mean value on one or two measures will not adversely affect the analyses. Again, we included a flag in the dataset to mark those measures (and institutions) in which mean substitution was used so that we could revisit the details of the data should these institutions find their way into the final peer listing. Finally with respect to missing data, it is worth noting that there were no instances in which we needed to remove a prospective institution from the analysis.
8
Variables Development
After selecting only public New York State Associate’s Colleges, we chose variables based on their appropriateness in capturing dimensions of finance, size, complexity, and quality. We based our selection of variables on a re‐evaluation of variables used in Szelest’s study (1996) and examination of the most popular variables used by other researchers in the last fifteen years. Additionally, the top administrators were asked to identify which important variables they believe should be taken into consideration based on their experiences with selecting Columbia‐Greene peers over the past fifteen years. That administrative input was essential for our selection of variables which become have become currently important for Columbia‐Greene. The final analysis includes nine financial, five size, three quality, and twenty‐six complexity measures.
Finance
The measures of institutional finance address both overall support and more specific expenditure functionality. We capture total from the IPEDS dataset. Specific expenditure account categories of instruction, academic support, student services, and institutional support are evaluated in terms of their share of core expenditures, as defined by IPEDS. Thus each specific expenditure is divided by the total operating and non‐operating expenditures. Similarly, for calculation of total revenues we include total revenues from operating and non‐operating revenues. In terms of percent of budget from different sources we evaluate the percentages of revenue generated from state appropriations, tuition and fees, and local appropriations. Local appropriations are of particular import as they constitute a unique revenue stream for the community college sector.
Size
The size measures are categorized in two groups of measuring: that represent the size of student body and the size of the faculty body. Total student FTE is used to capture both size and mission of institutions. FTE students are calculated by combining full‐time headcount and one‐third of the part‐time headcount enrolment, per the IPEDS definition. Additionally, the size of the entering full‐time first‐time freshmen cohort as a percentage of all undergraduate students and entering transfer students as a percent of new students are included in the analyses. In terms of faculty body we evaluate the number of full‐time and part‐time employees, and the number of full‐time tenured track and full‐time instructional lecturers, which helps to illustrate some important employment patterns of community colleges. All size data come from IPEDS.
9
Complexity
The twenty‐six complexity measures address student body composition, faculty composition, technical emphasis, socio‐economic characteristics of service counties, degree awarded distributions, and the residential nature of the campus. Commonly accepted indicators of student body complexity include students’ socio‐economic distribution based on the percent of freshmen who are Pell recipients, the percent of freshmen local grant recipients, and the percentage of institutional grant recipients. Additionally, age distribution as a proportion of undergraduates of traditional age (i.e., 18 to 24 year olds and 25 to 65 year olds), the percent of part‐time students, and diversification of the student body defined by the percentage with minority classification are included in the analyses. To further evaluate the student body of community colleges we made a decision to evaluate the percentage of non‐degree enrollment to reflect an essential component of the two‐year college mission. We use one individual measurement of faculty complexity: the percent of full‐time faculty who are tenured or tenure‐track, which is a crucial indicator of composition of faculty body at community colleges. Emphasis on technical education derives from the percent of degrees awarded in technical majors versus the percent of degrees awarded in liberal art, social services, and business majors. Three indicators of social‐economic profile of the surrounding community or wealth of the community are also incorporated into the analyses. These include: county(s) population (2011) served by a college, estimated median household income 2006‐2010 from county(s) served by a college, and estimate unemployment rate (August 2011‐September 2012) in a county(s). These variables are especially important when we take into consideration the unique symbiosis of community colleges and their communities. The residential nature is measured by the presence or absence of residential housing for students. Interestingly, a few years ago this indicator would not be relevant to community colleges, which in majority did not have residence halls. But more recently, many of them have made a decision to add on‐campus housing options to their service offerings. Lastly, due to the fact that athletes are more likely to live in residence halls, we decided to include a measure for whether colleges are members of the National Junior College Athletic Association (NJCAA) or not.
Quality
Unfortunately, it is not easy to directly verify the quality of higher education institutions due to a lack of well‐defined and measureable indicators. In particular, the traditional proxies for quality input variables are not available for community colleges which in majority have an open enrollment policy and enroll students with minimal requirements like a high school diploma or its’ equivalent. In terms of quality output variables we focus our analysis on three
10
measurements: first year retention rate of full‐time first‐time freshmen, the graduation rate, and transfer out rate. The evaluation of these variable helps to illustrate some aspects of a college mission. The transfer out rate is an especially relevant indicator for community colleges, which in majority, prepare students not only for graduation but also for transfer to four‐year colleges.
Methodology
As in previous peer institution explorations, we conducted a number of preliminary examinations by looking at institutional attributes such as athletics conference, the presence or absence residence halls, as well as by various demographic and ecological characteristics. In the past, we have found that surveying the institutional landscape and mapping out institutional typologies to be an excellent means of educating campus stakeholders about institutional similarities and dissimilarities.
Quintile Groupings of Local Support by Degree of Urbaneness
Pcto
f Core Re
venu
es from
Local Governm
ent
City: Large 250,000+
4
5
3
2
1
City: Small < 100,000
Rural:Suburb: Large
Town: Distant
Town: Fringe
Town: Remote
Hostos
BronxLaGuardiaKingsborough
Kingsborough
B. ManhattanErie
Adirondack
Schenectady
Mohawk V
Hudson V
Orange
Finger LakesGenesee
Fulton‐Montg.Niagara
CorningTompkins Cort.Ulster
Columbia‐Gr.Sullivan
MonroeOnondaga
Dutchess
BroomeSuffolkWestchester
NassauRockland
Cayuga
Clinton
Herkimer
JamestownNorth Country
Jefferson
12
In addition to showing where each institution falls on these distributions, we have highlighted our City University of New York (CUNY) colleges in red. CUNY schools have separate funding and administrative funding structures within New York State, so it is important to highlight this difference for campus leaders. Other typologies developed for initial information sharing might include juxtaposing enrollment by the percentage of students receiving Pell grants, or student selectivity with other financial resource measures like percentage of budget allocated to instruction or student support services.
Examining these institutional typologies is also informative for the analysts. Deans and senior staff often have “insider insights” into other institutions and their cultures owing to either personal experience or professional collaborations/interactions with their counterparts across the country. This can help inform variable and measure selection, as well as aid in adding additional context to the eventual result set.
Once the institutional landscape is satisfactorily explored and campus leaders are familiarized with the data typologies, we then turn to statistical techniques to begin selecting peer institutions. The rank distance method used by Berthold (1996) is very similar to that used by the University of Kansas and described by Teeter and Christal (1987), but uses a percentile rank order of institutions on each measure rather than Z scores to calculate similarity/dissimilarity. A second method, cluster analysis, utilizes principal components analysis and factor scores to group universities that are determined to be similar across specified dimensions into clusters. This technique was developed by Terenzini et al. (1980), who were amongst this technique’s early pioneers in the late 1970s.
The Kansas classification described by Teeter and Christal (1987) utilized a weighting scheme to elevate the importance of certain variables after standardization. While the rank‐distance analysis conducted for this research does not use explicit weights for the variables chosen, an implicit weighting scheme is active in that nine financial, five sizes, twenty‐six complexity, and three quality measures are used in the analysis. Hence, elements of finance and size are more dominant in assessing institutional similarity/dissimilarity with the target institution. In addition, it should be noted that many of the measures used are highly correlated with each other, so they in effect may very well be measuring the same variable or dimension. Reducing the number of measures used in the analysis, and which measures, could influence where institutions fall out in proximity to the target institution. Hence our multi‐method approach.
Due to spmeasurethree of t
Table 1 –
Inredundanof measumeasuresome quenough vof extrac
Tcriterion hierarchi
pace and viss used; two the quality m
– Initial Extra
n order to exncy and atteures in each s in the finaite divergenvariation in tcting peer ins
o address thfor Eigenvaical aggolom
ual presentaof the five smeasures us
action using
xplore the poendant issuedimension, ncial, size, ct in terms ofthe resultingstitutions.
hese concernlue selection
merative). Th
ation limitatsize measuresed.
the Rank‐Di
ossible impas around inhwe re‐ran thomplexity af proximity tg peer set to
ns, we emplon) and a cluse factor ana
tions, Table 1es, six of the
stance meth
act of collineherent weighhe rank‐distand quality. Sto the refereo give one pa
oy factor anster analysis alysis uses pr
1 shows onlytwenty‐six c
hod
earity amonghting by virtance analysiSome analysence institutause about r
alysis (varimtechnique (rinciple com
y three of thcomplexity m
g measures, ue of the difs using diffesis runs wereion. Overallelying solely
max rotation,complete linponents ana
he nine Finanmeasures, a
as well as ffering numbering numbee similar, anl, there is y on this met
, and Kaiser’nkage, alysis to red
13
ncials nd
ber rs of d
thod
’s
uce
the originimport. Bmeasureinfluencehalt factodimensioeconomiand Liberservices ssciences dataset, dendogratarget ins
Erequired as no desweightinor studenand operdimensioof time athese wewere dee
Tinstitutiouses the relativelydistance researchdiminishi
nal forty‐thrBy definitions to unique e factor comor formationons that surfc status; Stural Arts & Scsupport; nonemphasis inand are thenam diagram stitution.
ach of the fafor each inssign inducedg scheme wnt body charrations. Basons into highand energy cere largely ‘oemed satisfa
he cluster anon based on “complete ly homogenescore betweer decides toing returns).
ree measuren, principle cfactors that
mposition by n, so some sufaced in this udent body ccience emphn‐Traditionan certificate pn used in a ccan then be
actors receivstitution. Initd implicit weas considereracteristics wed on conveh, medium, acould have bopinion’ dataactory. The d
nalysis calcuthe standardinkage” hiereous clusterseen institutioo stop cluste. Each institu
s to eleven fomponents are completchoosing thubjectivity isanalysis arecomplexity; asis in assocal emphasis; programs. Tcluster analye examined t
ves equal wetially, a conseighting scheed as senior were in fact ersations witand low impeen investeda in the first dimensions
ulates a standized factor rarchical aggs. The clusteons, which ier formationution’s cluste
factors that analysis partely uncorree extractions still presene characterizFaculty and ciate degreeBusiness cehe factor scoysis. The proto determin
eight in buildscious decisieme existed.campus offimore importh senior staortance cated in estimatplace, the hand their we
dard Euclidescores multglomerative rs are formes compared n (based on per can be as
reflect institrtitions the oelated. The rn technique, nt, albeit in aed as reflectsupport; Trae programs ; rtificate emores are expogression of e how instit
ding the cluson was mad. After the fiicials believertant than otff, it was deegories. Whing more prehigh, mediumeights were
ean distancetiplied by thetechnique toed based on at each succprofessional small as tw
tutional dimobserved varesearcher caand in decida limited mating: Size anansfer emphAcademic sphasis; and ported and sinstitutionautions cluste
sters, and code not to werst pass throed that certathers to the cided to wehile a consideecise weightm, and low cthusly defin
e measure foeir respectivo group instthe minimucessive stepl judgment ao campuses
mensions of riance in thean though ding where tnner. The nd wealth; Sohasis; Busineupport, StudLiberal arts aaved in the l clustering ver with the
omplete dataight the factough, a ain institutiocollege missight the erable amouts, given thalassificationned:
or each ve weights, aitutions intom maximum until the about , or can be b
14
e
to
ocio‐ ess dent and
via a
a is tors,
onal sion
unt t s
and o m
built
15
larger to incorporate larger numbers, but at each successive step, the number of institutions that join clusters is variable, and depends on the clustering algorithm, the weights assigned to factors (or not) and the researcher’s objective.
The underlying purpose of this analysis is to identify a small number of institutions that group closest to the target institution. Institutions can be grouped by use of a dendogram, which traces the clustering pattern of any institution to successive institutions or groups of institutions. By definition, similarity between institutions becomes less distinct as the clusters incorporate additional schools. A dendogram is then produced based on the underlying weighted factors and the distance between institutions on them. Visual inspection is then used to determine where to stop the clustering process as more and more institutions join the initial cluster.
Results
Univariate statistics for the forty‐three measures used are reported in Appendix A. Even though only public community colleges in New York State are included in the analysis, a brief review of the means and standard deviations suggests a great deal of variability on many of the measures across these institutions. This further reinforces the need for a comparison strategy. Unlike our prior explorations (1989, 1996, 2006) to identify peer institutions for public research universities that showed that the financial measures exhibited the most variability, followed by the size and then quality measures, in this analysis, there is considerably across these measures.
The (truncated) bivariate results reported in the correlation matrix in Appendix B indicate that measures, in general, are highly correlated with each other, and reinforces the concerns noted above around redundancy of measures. For example, core revenues have a Pearson’s correlation coefficient above 0.50 with several other financial measures. Furthermore, it is also highly correlated with freshman retention, the graduation rate, and the percentage of the student population that is minority. Other measures were also highly correlated both within and across the hypothetical dimensions of finance, size, quality, and complexity. While more in‐depth discussion of these relationships is not entertained here due to space limitations, the important implication is that a factor analytic technique that controls for multicolinearity is a suitable approach to effectively understanding this data set. That said, the rank distance method is still seen as beneficial in terms of educating campus decision makers about relevant data and its spread among institutions.
The second method used to develop a set of peer institutions is a factor and cluster analysis technique. When the forty‐three measures described above are subjected to principal components analysis, with varimax rotation and using Kaiser’s criterion for Eigenvalue
16
selection, eleven factors emerge which explain eight‐five percent of total variance in the data set. Appendix C shows the factor loadings and the resulting dimensions.
These results suggest that size and wealth measures largely load along a similar dimension (size and wealth) that explains the most variance (26.8%) of all the eleven dimensions extracted. The Socio‐economic factor, comprised of measures such as the percentage of full‐time undergraduates on Pell grants, median county income, the percentage of core revenue provided from tuition and fees, and the unemployment rate explain just over ten percent (10.9%) of the variance in the dataset. The remaining factors explain from 7.4 to 42 of the dataset variance.
As noted earlier, after an initial exploratory cluster analysis was conducted without factor weights, it was decided that using weights might provide a better acceptance of the clustering solution by campus‐decision makers.
Appendix D illustrates the dendogram that graphically depicts the institutional clustering sequence that results when the unweighted factor scores are submitted to the clustering algorithm. Appendix E depicts the resulting dendogram when weighted factors are used. Of primary interest in this exercise are those institutions that cluster with Columbia‐Greene, the target institution. Examining the dendogram in Appendix E shows that Columbia‐Greene first clusters with University of Adirondack CC and Jefferson CC. These two institutions are then joined by Cayuga CC. At the next iteration, Finger Lakes CC, Ulster CC, and Broome CC join this small cluster of four institutions. Then Jamestown CC joins this group, followed by Corning CC. Then the CUNY schools of Bronx CC and Hostos CC join the cluster. At the next iteration eight schools join the growing cluster, followed by a larger cluster composed of thirteen schools, then by two, and then by a final single institution, and all schools have been clustered.
The decision the researcher must make at this point is to determine where to stop the clustering. In this exercise, the decision was made to group the clusters at the stage right before the CUNY schools would have joined in what is a cluster of SUNY schools, rounded out by Jamestown CC and Corning CC. This seems a natural stopping point, due to the inherent differences between governance and funding structures between the SUNY and CUNY systems. And further supported by the fact that if the CUNY schools were included, it would not be reasonable to include additional schools, as the cluster to form after they join would bring in an additional eight schools, making the peer set too large at eighteen institutions.
Now that a cluster of peer institutions has been formed (Adirondack, Jefferson, Cayuga, Finger Lakes, Ulster, Broome, Jamestown, and Corning CCs), we might ask “how it might best be described?” These schools range in size from 1,400 to 5,100 students, with from 43 to 137 full‐time tenured, tenure‐track faculty. They serve similarly sized populations on non‐traditionally
17
aged students, but have varying levels of non‐degree students. In addition, their operating budgets run from twenty to over fifty million dollars. A more empirical approach would be to examine the original percentile rank measures for the peer cluster. One could also examine institutional rank on the factor scores themselves.
Table 3 –
Aclusters iexamine determinrepresenincludes CC. The tSUNY Movisual instwo clustclusters, import isthem the
Alternative wis to graph ththree of thene the nine mnts Columbiaa grouping othird clusterohawk Valleyspection shoters on the fbut only thrs the fact thaey explain ne
he Columbiaon than the son the sociohan the otheably higher ve student bols in the datols in the th
dividual Met
ways of lookihe factor scoe institutionamember Cola‐Greene andof three schor includes a gy CC, SUNY Mows that the first three faree were choat these partearly 50 perc
a‐Greene clusecond clusto‐economic der two clustevalues on thody complexaset, the schird cluster h
trics for Clus
ng at the inhores themseal clusters frumbia‐Greed the schoolools: SUNY grouping of Monroe CC, Columbia‐Gctor dimensosen for thisticular dimecent (45.1%)
uster has a cter, and consdimension, ters on this dihis dimensionity of Columhools in the ave higher v
ster Peers
herent attribelves. Chart 1rom the elevene peer grols listed in TaOrange CC, six schools: SUNY Onon
Greene clustesions. Differs demonstratnsions were) of the varia
onsiderably siderably lesthe Columbimension, bun than eithe
mbia‐Greene’second clustvalues on the
butes of the 1 below usesven cluster fiup describedable 3 aboveSUNY Dutch SUNY Erie Cndaga CC, aner (1) is indeences exist ation to redue chosen for ance in the i
lower valuess than the ta‐Greene cluut the seconr of the othe’s cluster is ater have lowe student bo
institutions s the mean final l solutiod above. The. The seconhess CC, and CC, SUNY Hud SUNY Niageed differentamong all ofce visual cominspection bnstitution da
e on the sizehird cluster.uster also exd cluster of er two clusteabout the avwer values, oody complex
in the peer factor scoren used to he first clustend cluster SUNY Rockl
udson Valleygara CC. Qut from the of the eleven mplexity. Obecause betwataset.
and wealth. While closxhibits lowerschools has ers. Finally, verage valueon average, axity measure
18
s to
er
and y CC, ick ther
f ween
er to r
e for and e, on
19
Chart 1 – Mean factor scores for three clusters of institutions
An alternative to looking at cluster differences to build confidence in the peer group candidates is to look at the attributes of the institutions that are in within the cluster that includes the target institution and highlight their similarities. Chart 2 below shows the mean factor scores for the nine institutions in the final Columbia‐Greene peer cluster. Once again, only the first three dimensions of size and wealth socio‐economic status, and student body complexity are examined in this particular chart.
Chart 2 – Within Cluster Attributes
‐1
‐0.5
0
0.5
1
1.5
2
1 6 7
Average of wt_F_Size_Wlth Average of wt_F_SociEco Average of wt_F_StuBody
‐1.5
‐1
‐0.5
0
0.5
1
1.5
Adiro
ndack
Broo
me
Cayuga
Columbia‐Green
e
Corning
Finger Lakes
Jamestown
Jeffe
rson
Ulster
Sum of wt_F_Size_Wlth Sum of wt_F_SociEco Sum of wt_F_StuBody
20
It is important to keep in mind that the factors scores were weighted in the final solution. Visual inspection seems to confirm that these institutions are more homogeneous than heterogeneous on these dimensions. While less similarity is observed on the student body complexity dimension than on the size and wealth or socio‐economic dimensions, we must keep in mind that the student body complexity dimension only had ‘medium’ weight, while the other two had ‘high’ weights. And the setting of weights is a subjective decision made by campus leaders.
Discussion
In summary, the rank distance and factor and cluster analysis techniques provided an overlapping group of peer institutions for the target institution, Columbia‐Greene Community College (C‐GCC). In both analyses, campus decision makers have opportunity to play an integral role in developing the list of variables and their respective measures used to differentiate institutions. With both techniques, the institutional research staff, as well as higher level campus decision makers, can clearly see how C‐GCC compares to other institutions across financial, size, complexity, and quality measures. Increased familiarity with and knowledge about these aspects of one’s own institution and its chosen peers is of importance as we move forward with programmatic initiatives. Benchmarking to external institutions is often requested/expected by governing bodies, and having an up‐to‐date set of benchmark institutions adds confidence to the exercise.
There are limitations to these methods. The rank distance method employed did not assign weights to the individual measures. While an implicit weighting scheme was in effect due to the different number of measures used to represent finance, size, quality, and complexity variables, arguments can certainly be made to add measure weighting, or to alter the number of measures. As demonstrated, the number of measures used can indeed have an impact on the result set. In the past, analyses were guided by a desire to seek peer institutions more closely related on the financial and size variables, and this analysis was conducted similarly. We will need to revisit this approach as we work with campus leaders to develop a formal set of peer institutions.
Another limitation of the rank distance method is that basing the distance measure on percentile ranks instead of on factor or standardized scores potentially minimizes the magnitude of the differences between institutions. The percentile rank approach creates a distance measure based on the rank order of institutions for different measures rather than upon the magnitude of their differences from each other. The actual distances in the raw data may be greater or smaller than the distance between ranks.
21
A final limitation of this methodology worth noting is that many of the measures used, as noted, are highly correlated with each other. In other words, to a certain degree, they may be measuring the same institutional aspects. While the measures used address different concerns campus decision makers harbor, the end result may be confounded by the highly related nature of the measures.
The factor and clustering technique, which alleviates the problem of highly correlated measures by factoring them into eleven completely uncorrelated dimensions has an advantage in this respect. In this analysis, we decided to use weights on each of the eleven dimensions to provide for a more robust clustering solution.
A well noted limitation of factor analysis is that the factors (dimensions) used for clustering are more difficult to comprehend. This is particularly true with respect to the percentile ranks used in the first analysis. While standardized factor scores do not easily lend themselves to meaningful interpretation, once can still compare factor scores across institutions, or by cluster, to convey a sense of similarity/dissimilarity.
Both of these methods provide a means of identifying peer institutions. Neither should be viewed as a turn‐key approach. The rationale for the undertaking in the first place plays a significant role in choosing variables and measures of them for consideration. Acceptance of a peer institution group by campus decision makers and relevant external audiences largely depends on accommodating and incorporating their intuition, concerns, and political objectives. The peer review process is a learning process. Through it we learn not only about the funding, quality, or size of other institutions, but more importantly, we learn about how our own institution stands in those respects.
Future Research
Future research might address the methodological limitations noted above. These include important methodological aspects, such as the sources of variables and selection of variables ‐‐‐ that in turn strongly influence the composition of the eventual peer groupings.
Due to resource, accessibility, and other constraints, this study has focused only on data available through the IPEDS database. However, there are other reliable sources of institutional data from sources such as the National Research Council (NRC), and the National Science Foundation (NSF) which can provide additional measures for peer analyses. Looking to the future, these sources can be used to incorporate variables that better measure, for example, the quality dimension through faculty work products such as the number of publications per faculty or the number of citations per faculty. Other possibilities may exist as well.
22
References:
Aldenderfer, M. S., & Blashfield, R. K. (1984). Cluster Analysis. Beverly Hills, CA: Sage
Archer, S. J., Reiss E., Armacost R. L., Sun Y., & Fu, Y. (2009). A Large Metropolitan Research University’s Approach to Benchmarking Peer Selection. Proceeding of Association for Institutional Research 49th Annual Conference, Atlanta, Georgia.
Bers, T.H. (2006). Limitations of Community College Benchmarking and Benchmarks. New Direction for Community Colleges, no. 134, Summer 2006.
Berthold, C. A. (1996). Aids to Navigation: Using Interinstitutional Databases in the University of
Maryland System. Paper presented at the 36th Annual Forum of the Association for Institutional Research, Albuquerque, NM, May 1996.
Bostian, B., Manning, T.M. (2006). Using Benchmark and Assessment Data to Facilitate Institutional Change. New Direction for Community Colleges, no. 134, Summer 2006.
Brinkman, P. T. and Teeter, D. J. (1987). Methods for Selecting Comparison Groups, in Conducting Interinstitutional Comparisons, Paul T. Brinkman (ed), New Directions for Institutional Research, no. 53., Vol XIV, Number 1., San Francisco: Jossey‐Bass.
Gaylor, S.S. (2009). Use of a Comparison Group and Modeling to Inform Decision‐Making and Planning. Proceeding of Association for Institutional Research 49th Annual Conference, Atlanta, Georgia.
Hom, W. (2008). Peer Grouping: The Refinement of Performance Indicators. New Forums Press,
16 (1), 45‐51.
Hurley, R.G. (2002a). Determining community college institutional peer groups and assessing the stability of institutional peer group membership over specified time periods. Unpublished doctoral dissertation, University of South Florida, Tampa, FL.
Hurley, R.G. (2002b). Identification and assessment of community college peer institutional selection systems. Community College Review, 29 (4), 1‐27.
Hurley, R.G. (2009). Formation of Community College Clusters Using the CCSSE Benchmarks for Extra‐Large Community Colleges. New Forums Press, 16 (2), 103‐108.
Ingram, J. A. (1995). Using IPEDS Data for Selecting Peer Institutions. (ERIC Document Reproduction Service No. ED387010).
23
IU Northwest Peer Institution Selection and Analysis (2006) Report presented by the Board of Trustees.
Juhnke, R. (2006). The National Community College Benchmark Project. New Direction for
Community Colleges, no. 134, Summer 2006. Lang, D. W. (2000). Similarities and Differences: A Case Study in Measuring Diversity and
Selecting Peers in Higher Education. Higher Education 39: 93–129, 2000. Kluwer Academic Publishers. Printed in the Netherlands.
Lang, D. W., & and Zha, Q., (2004). Comparing Universities: A Case Study between Canada and China. Higher Education Policy, 2004, 17, (339–354).
McClenney, K.M. (2006). Benchmarking Effective Educational Practice. New Direction for Community Colleges, no. 134, Summer 2006.
Musial‐Demurat, J., & Szelest, B. P., (2011). The “Art and Science” of Developing Institutional Peers: Methods of Exploring and Determining Peer Institutions. Proceeding of North East Association for Institutional Research 38th Annual Conference, Boston, Massachusetts.
Nzeukou, M., & Muntal, D. (2010). A Knowledge‐Based Selection Methodology of Peer Institutions. Proceeding of Association for Institutional Research 50th Annual Conference, Chicago, Illinois.
Teeter, D. J. & Brinkman, P. T. (1992). Peer Institutions in The Primer for Institutional Research,
Whiteley, M.A., Porter, J.D., and Fenske, R.H. (eds), Tallahassee: Association for Institutional Research.
Teeter, D. J. & Christal, M. E. (1987.) Establishing Peer Groups: A Comparison of Methodologies. Planning for Higher Education, Vol. 15, No. 2, 1987.
Terenzini, P.T., Hartmark, L., Lorang, W.G. Jr., & Shirley, R.C.. (1980). A Conceptual and Methodological Approach to the Identification of Peer Institutions. Research in Higher Education, Vol. 12, No. 4, 1980, Agathon Press, Inc.
Weeks, S. F., Puckett, D., & Daron, R. (2000). Developing peer groups for the Oregon University System: From politics to analysis (and back). Research in Higher Education, 41, 1–20.
Xu, J. (2008).Using the IPEDS Peer Analysis System in Peer Group Selection. Professional File,
Association for Institutional Research, Number 110, Winter 2008.
24
Zhao, J., & Dean, D. C. (1997). Selecting Peer Institutions: A Hybrid Approach. Paper presented at the 1997 AIR Forum in Orlando, FL.
Appendix
x A – Univariate Statisticcs
25
A
Appendix B – (trruncated) Correelation Matrix (aa complete correlattion matrix is availaable from the authhors, upon request))
26
Appendix
x C – Factor Matrix
27
AAppendix D – Deendogram, unWWeighted Factorrs
28
AAppendix E – Deendogram, Weigghted Factors
29
30
EXAMINING THE THREAT OF NONRESPONSE BIAS AS A FOLLOW-UP TO THE
NATIONAL SURVEY OF STUDENT ENGAGEMENT
Debra Allen Theodore Coladarci Assistant Director Director
Office of Institutional Research University of Maine
Office of Institutional Research University of Maine
2
The National Survey of Student Engagement (NSSE), an online survey administered to
freshmen and seniors, can be used to measure the quality of student experiences. NSSE survey
items, described by NSSE as representing “empirically confirmed good practices,” relate to
individual student behaviors as well as student perceptions of their college experience.
Institutions—over 750 last year—use NSSE to support decision making, design goals, and
analyze progress in such areas as accreditation, accountability reporting, strategic planning, and
program assessment (Banga, Pike, & Hansen, 2009).
NSSE can be a valuable tool, but with a national response rate of approximately 27% and
roughly one third of institutions achieving response rates below 30% (NSSE, 2011), there are
concerns regarding the degree to which institutions can generalize their results to their student
population. Low response rates do not necessarily suggest a lack of representativeness, however;
a survey yielding a low response rate may still produce a sample that is representative of its
population (Dey, 1997; Groves, 2006). It is only when there are discrepancies between
responders and nonresponders in perceptions or behaviors relevant to the survey topic that
nonresponse bias is introduced and becomes a threat to the validity of inferences made from the
survey results. NSSE acknowledges the impact that nonresponse bias may have on the
interpretation of an institution’s results and therefore encourages institutions to conduct their
own nonresponse studies (Chen, 2006).
In short, our purpose in conducting the present study was to meet NSSE’s call for
institutional-level nonresponse studies. Our institution, the University of Maine, is a land-grant
university with a total student population of approximately 11,000 (roughly 8,270 of whom are
degree-seeking undergraduates). UMaine administered the web-based NSSE to all freshmen and
seniors in spring 2011, achieving a response rate of approximately 21%. To determine the
3
degree to which these respondents are representative of the remaining 79% of freshmen and
seniors, we addressed the following questions:
a) How do the demographic characteristics of nonresponders compare with those of the
responders?
b) What reasons for nonresponse are subsequently offered by nonresponders?
c) How do nonresponders’ perceptions of their UMaine experience compare with those of
responders, using a selection of items from the NSSE survey?
Related Literature
NSSE Overview
NSSE emerged from the efforts of a design team, lead by Peter Ewell of the National
Center for Higher Education Management Systems, that had been tasked by Pew Charitable
Trusts to develop an instrument to measure the extent to which college students show good
educational practices and to assess what they gain from their college experience (Kuh, 2009).
The survey was first administered to 276 institutions in 2000; in 2011, 751 institutions from the
United States and Canada participated (NSSE, 2011). Institutions use NSSE to identify areas
where institutional policies or practices may be improved to promote good educational practices,
and to serve as an external accountability measure of overall quality (NSSE, 2011). The
Voluntary System of Accountability (VSA), an initiative through which institutions report
measures of student outcomes, chose NSSE as one of the options schools can use for assessing
student engagement. NSSE data, along with other information provided in the spirit of
accountability and public disclosure, appear conspicuously on the participating institution’s
website, in the “College Portrait.” In addition to engagement data, the College Portrait provides
general consumer information as well as measures of student success and progress, learning
outcomes, and perceptions and experiences.
4
The three core purposes of the NSSE are to provide actionable data to institutions so that
they can improve the undergraduate experience, highlight and document effective educational
higher education practices, and advocate for public acceptance and use of standard measures for
college quality (Kuh, 2009). Through five sets of questions, students are asked about (a) their
participation in sports and activities, study time, interaction with faculty members; (b) what they
see their institution as requiring of them; (c) their perceptions of their college environment
(including factors believed to impact satisfaction, academic achievement, and persistence); (d)
information regarding their socioeconomic and educational background; and e) their educational
and personal growth since starting at the institution.
For ease in analysis and interpretation, NSSE developed five benchmark scales of
effective educational practice that capture institutional characteristics and student behavior
highly aligned with both learning and personal development. Comprising a total of 42 items, the
five benchmark scales are Level of Academic Challenge, Active and Collaborative Learning,
Student-Faculty Interaction, Enriching Educational Experiences, and Supportive Campus
Environment (Kuh, 2009).
Although NSSE is a well-known and frequently used survey, validity concerns have been
raised regarding the accuracy of student self-reports (Porter, Rumann, & Pontius, 2011), the
weak relationship with student academic outcomes (Gordon, Ludlum, & Hoey, 2008), and low
response rates (Porter & Whitcomb, 2005). In light of these concerns, institutions should take
steps to verify the validity of the data collected at their own institution. In fact, Chen et. al.
(2009), in their outline of best practices for analyzing NSSE data, suggest that determining the
quality of an individual institution’s data should be a priority for any analyst using NSSE data.
They stress the importance of verifying that population estimates are accurate, and recommend
5
that institutions consider sampling error, analyze the potential for nonresponse bias, and examine
the proportional representation of student subgroups within their responder samples.
Nonresponse bias in survey research
Over time, survey response rates have suffered a noticeable decline (Dey, 1997). As a
result, the awareness of and concerns regarding nonresponse bias has also grown in recent years.
The following is a more comprehensive definition of nonresponse bias and a summary of the
methods used to examine its existence.
Definition of nonresponse bias. As mentioned above, the literature on nonresponse bias
suggests that bias is not necessarily a function of low response rates. Rather, it is only when
there is a discrepancy between respondents and nonrespondents on relevant attitudes,
perceptions, and behaviors that bias is introduced. Low response rates then serve to exacerbate
the level of bias (Groves, 2006; Pike 2008).
Nonresponse bias, and the degree to which it is a problem, is often related to the reasons
for nonresponse (Groves, 2006; Rogelberg & Luong, 1998). Rogelberg and Luong (1998)
outline the four major classes of nonresponse as inaccessibility, inability to respond,
carelessness, and noncompliance. Each reason is likely to affect bias in a different way,
something that Groves (2006) stresses should be taken into account by survey researchers. For
example, nonresponse due to an inability to contact a person is likely to introduce a different
level of bias than nonresponse because of a refusal to answer questions about the particular
subject. Both reasons will have an impact on response rate, but biased responses are more likely
with the latter. The former may be completely unrelated to the attitudes, behaviors, or
perceptions of interest in the survey.
Thus, there are four important considerations when interpreting survey results: response
rates across various subgroups in the population of interest; demographic differences between
6
responders and nonresponders; distinctions between responders and nonresponders in the
attitudes, perceptions, or behaviors measured by the survey; and reasons for nonresponse. The
first two can be examined using existing data that are often readily available, but one must
collect data from the nonresponder group in order to address the latter two concerns.
Methods for examining nonresponse bias. Nonresponse bias can be examined using a
number of methods. There are three approaches researchers regard most promising for studying
Note. Adapted from UMaine Institutional Report 2011 (Respondent Characteristics), National Survey of Student Engagement, 2011.
Tables 2 and 3 provide freshman and senior response rates broken down by gender,
residency, enrollment status, transfer status, cumulative GPA, and college of major.1 The tables
show the results of the χ2 tests of independence, which assess whether there were differences
across groups in the proportion of students who responded to the survey, representing an over- or
under-representation among respondents. For example, the results in Table 2 show a statistically
significant difference related to gender. One can see that females had a higher response rate
(26.5%) than males (15.3%) and, further, were more highly represented among the respondents
(61.4% vs. 38.6%). This distribution of males and females is in contrast to that in the total
student population (47.9% vs. 52.1%). If there was no relationship between gender and
response, the split between females and males among the respondents would have been more
reflective of that seen in the total population.
Among freshmen, a significantly higher proportion of females, first-time students, and
students living on campus responded to the survey. As for seniors, more likely to respond were
1 We created our dataset from the spring database, which only includes students who are registered for courses during the spring semester. Because the names supplied to NSSE were taken from the fall 2010 student database, some students who received surveys were not registered for classes in spring 2011. To restrict the sample to only students who were enrolled during the time of the survey administration, we excluded these students. This resulted in the exclusion of six freshmen and 13 seniors who responded to the NSSE survey.
14
females, full-time students, nonresidents, and students living on campus. Academic
achievement, as measured by cumulative GPA, also was related to survey participation: For both
freshmen and seniors, the response rate of students with GPAs above 3.5 was roughly double
that of students with GPAs below 2.5. Across colleges,2 there were differences in response rates
among seniors but not among freshmen. The College of Natural Sciences, Forestry, and
Agriculture enjoyed the highest senior response rate (32.5%), while the College of Business,
Public Policy, and Health showed the lowest (18.6%).
2 BPPH = College of Business, Public Policy, and Health, EHD = College of Education and Human Development, ENGR = College of Engineering, LAS = College of Liberal Arts and Sciences, NSFA = College of Natural Sciences, Forestry, and Agriculture. Further, DLL = Division of Lifelong Learning and EXPL = Explorations (a program for undecided students and/or students requiring additional academic preparation).
In summary, the results of the χ2 tests of independence show statistically significant
differences across demographic groups. An overview of the groups with disproportionately high
response rates appears in Table 4.
Table 4. Summary of Demographic Comparisons
More likely to respond among freshmen were: • Females • New students (as opposed to transfers) • Students living on campus • Students with higher GPAs
More likely to respond among seniors were:
• Females • Full-time students • Students living on campus • Students in the college of NSFA • Students with higher GPAs
Although there were differences in response rates across demographic groups, such
differences are only indicative of nonresponse bias if there were also discrepancies in responses
to pertinent survey items. To identify whether such a threat exists, we conducted between-group
comparisons using the demographic categories in Table 4 on the four items used in the
nonresponder analysis (relationships with faculty members, quality of academic advising,
perception of overall experience, and likelihood of attending again) and the five benchmark
scores (Academic Challenge, Active and Collaborative Learning, Student-Faculty Interaction,
Enriching Educational Experiences, Supportive Campus Environment). We used the χ2 test of
independence for the ordinal and nominal items and the independent sample t test or one-way
analysis of variance for those with interval responses. The following is a summary of the
statistically significant findings, with the complete results available upon request.
18
Among freshmen, there was a statistically significant difference associated with living
situation: Freshmen living off campus had a more positive view of their interaction with faculty
members (M = 35.8, SD = 20.5) than those living on campus (M = 29.3, SD = 16.8), t(339) =
2.40, p < .05. This difference corresponded to an effect size of approximately one third of a
standard deviation (d = .35). Also, there was a significant effect associated with GPA and the
Academic Challenge benchmark (F(3, 329) = 2.81, p < .05). However, follow-up pairwise
comparisons were not statistically significant. Such a contradictory finding can be attributed to
the conservative nature of the pairwise comparison test which, in order to reduce the probability
of Type 1 error, corrects for the multiple comparisons being made.
The threat of nonresponse bias appears to be more pronounced among seniors, with
discrepancies seen in relation to gender, college, and GPA. Males and females differed
significantly in perceptions of their overall educational experience (χ2(1, N = 423) = 5.61, p <
.01): 85% of females indicated their overall educational experience was good or excellent
compared with 76% of males. In addition to being more satisfied with their overall experience,
senior females also showed slightly higher Academic Challenge benchmark scores than males
(t(446) = 3.0, p < .01), corresponding to an effect size of roughly one quarter of a standard
deviation (d = .28).
Seniors of varying achievement levels differed in their perceptions of their relationships
with faculty members (F(2, 434) = 4.5, p < .01) and the support provided by the campus
environment (F(3, 417) = 3.4, p < .05). Tukey post-hoc comparisons indicate that students with
GPAs of 3.5 or higher reported significantly more favorable sentiments regarding interactions
with faculty (M = 5.5, SD = 1.2) than students with GPAs below 2.5 (M = 4.6, SD = 1.6),
equaling an effect size of .30. Students with GPAs of 3.5 or higher also scored more highly on
19
the Supportive Campus Environment benchmark (M = 56.6, SD = 18.0) than students with GPAs
of 2.5 or below (M = 43.6, SD = 23.5), corresponding to an effect size of .30.
Finally, seniors across colleges differed in their perceptions of the quality of academic
advising they received (χ2(4) = 11.5, p < .05) and the support provided by the campus
environment (F(4, 416) = 5.0, p < .01). ENGR seniors were the most positive in regard to
academic advising (75% indicating good or excellent), while their LAS counterparts were the
least positive (51% reporting good or excellent). Students in EHD were highest on the
Supportive Campus Environment benchmark (M = 61.0, SD = 16.9), whereas students in NSFA
(M = 51.4, SD = 18.6) and LAS (M = 51.8, SD = 18.4) were the lowest. The differences between
the EHD students and those in NSFA and LAS correspond to effect sizes of .26 and .25,
respectively.
Follow-up telephone interviews among nonresponders Response rates. Table 5 displays a summary of the number of calls attempted, and the
number and percentage of students who opted to participate in the telephone interviews.
Approximately one third of the students with valid phone numbers for whom contact attempts
were made participated in the interviews. Combined, almost 80% of the freshmen and seniors
we ultimately were able to reach agreed to participate in the telephone interview. The telephone
interviewees represent approximately 3% of the nonresponder population as a whole.
20
Table 5. Response Rates for Follow-Up Analysis
Freshmen Seniors Total phone numbers attempted 193 175 Incorrect or disconnected numbers 41 31 Total valid numbers 152 144 Declined to be interviewed 11 15 Total telephone survey participants 50 50 Total not reached 91 79 Telephone survey participants as percentage of students reached 82% 77%
Telephone survey participants as percentage of valid numbers 33% 35%
Telephone survey participants as percentage of all nonresponders 3% 3%
Representativeness of telephone sample. Tables 6 and 7 report the demographic
characteristics of the telephone interviewees compared with the characteristics of the
nonresponder population as a whole. We used χ2 goodness of fit tests to examine whether the
differences between the two groups were statistically significant. The results show that the
sample of interviewees was generally representative of the population of nonresponders. The
one area where the nonresponder and telephone survey samples differed is in the proportion of
freshmen in the various colleges: EXPL students were more highly represented among
telephone interviewees than nonresponders (28% vs. 12.8%), while the opposite was true for
BPPH (2% vs. 7.3%) and ENGR (12% vs. 17.8%) students.
21
Table 6. Nonresponder Population vs. Telephone Survey Interviewees: Demographic Characteristics of Freshmen
Reasons for nonresponse. When asked the reason for their non-response to the NSSE,
those students who did remember receiving the survey—approximately two thirds— offered two
primary reasons: they were too busy, or they just did not get to it or feel like it. There were only
minimal differences between freshmen and seniors in response to this question. Table 8 shows
the breakdown by class level.
Table 8. Reasons for Nonresponse
Freshmen Seniors n % n % Don't remember the survey 19 38.0% 18 36.7% Was too busy 14 28.0% 13 26.5% Just did not get to it or feel like it 17 34.0% 16 32.7% Other 0 0.0% 2 4.1%
Note. One senior did not provide a reason for nonresponse. Relationships with faculty members. Overall, telephone interviewees indicated a
slightly more favorable perception of their relationships with faculty members than did NSSE
responders. Table 9 displays the mean ratings for responders and telephone interviewees.
24
Table 9. Responders vs. Telephone Interviewees: Relationships with Faculty Members
Responders Telephone
Interviewees n M SD n M SD Overall 761 5.2 1.4 96 5.5 1.1
in web and paper surveys. Research in Higher Education, 44(4), 409 – 432.
Running head: MAXIMIZING ALUMNI FEEDBACK 1
Maximizing the Utility of Alumni Feedback
Susan Tammaro
Dean of Institutional Research and Assessment
Regis College
2 MAXIMIZING ALUMNI FEEDBACK
Abstract
An alumni survey designed to assess institutional effectiveness, identify internship & career
opportunities for current students, and obtain information to support fundraising and recruitment
was implemented at Regis College. The ways in which the results were used are detailed,
followed by a discussion of lessons learned and plans for future research and actions.
3 MAXIMIZING ALUMNI FEEDBACK
Maximizing the Utility of Alumni Feedback
Assessing institutional effectiveness is a “complicated collage of evaluation and
assessment challenges for institutions” (Volkwein, 2010a, p. 26). Alumni surveys are a powerful,
but sometimes underutilized assessment tool. Alumni can provide a unique perspective of
institutional effectiveness that is more complete than that of current students or any other
constituency group. Alumni have direct experience with both an institution and with the impact
of their education once they graduate. As Volkwein points out (2010b), the alumni perspective
and connection is increasingly important to institutions of higher learning because alumni are
now recognized as important sources of both information and financial support. Maintaining an
accurate database of contact information, reaching alumni in an effective and efficient manner,
and getting alumni to respond to requests for information all present challenges. An alumni
survey was implemented at Regis College despite those challenges. The purpose of this was to
improve our database of alumni information, identify internship and career opportunities for
current students, obtain information concerning institutional effectiveness to prepare for a
reaccreditation review, and to obtain information that would support future fundraising and
recruitment efforts. As Volkwein succintly states, “Alumni are important sources of information
and support, and alumni studies should occupy a prominent place in the institutional research
portfolio”(2010b, p. 137).
Alumni surveys have been used for a variety of purposes and can have a significant
impact on public policy and advancement of higher education. Cabrera, Weerts, and Zulick
(2005) discuss the three primary purposes of alumni surveys: 1) outcomes data, 2 engagement
4 MAXIMIZING ALUMNI FEEDBACK
and competencies information, and 3) alumni giving. Previous literature indicates that inclination
to give can be predicted by the quality of an individual’s educational experience, the extent to
which an institution prepared the graduate for a career, the extent to which a graduate maintains
contact with the institution, the graduate’s current impressions of the institution, and the
graduate’s capacity to give (Cabrera, Weerts, and Zulick, 2005). All of these factors can be
assessed with an alumni survey. This knowledge can then be used for targeted fundraising
appeals.
Alumni surveys are typically implemented for a rather limited purpose by a single
constituency group (Borden, 2005). For example, Davidson-Shivers, Inpornjivit & Sellers (2004)
surveyed 125 alumni of an instructional design master’s and doctoral program (along with 100
current students) in order to evaluate the programs and facilitate strategic planning. Landrum and
Lisenbe (2008) also used an alumni survey to evaluate instructional and departmental quality.
This information was used for both shaping the direction of an academic department, and to
inform students about opportunities available to them after graduation.
Bossart, Wentz and Heller (2009) described the results of an alumni survey administered
at the University of Wisconson-Strout. Consistent with previous research, their findings
indicated that alumni were very satisfied with their program, would attend UW-Strout again if
they could do it over, and felt that their education was worth their investment in time and money.
In 2008 Hennessy (as cited in Bossart, Wentz and Heller, 2009) reported that 78% of college
graduates would attend the same university again if they could do it over. The UW-Strout results
also showed that career advising and academic advising earned the lowest alumni ratings, which
is consistent with previous surveys, such as the survey at Southwest Texas State University
(Ogletree, 1999). Career and academic advising are areas that are increasingly important.
5 MAXIMIZING ALUMNI FEEDBACK
College students, and their families, are focused on the “value proposition” of a college
education more strongly than ever before, which leads to an increased desire for explicit
outcomes data and career services as they make their college decisions. Alumni research can
provide important information to help meet these demands.
Borden (2005) points out that it is both possible and desirable for campuses to align
alumni surveys to serve multiple purposes, rather than for a limited purpose by a single
constituency group. It is the role of the institutional researcher to implement such a survey, and
to ensure that the results of the survey are interpreted, disseminated and applied to policy
decisions. Borden states that effective use of alumni survey results are “pivotal to linking
improvement and accountability” (Borden, 2005, p.70). This position is consistent with the
recommendations made by Volkwein (2010a & 20010b). In addition to a multifunctional survey,
Davidson-Shivers, Inpornjivit & Sellers (2004) state that for data from alumni to continue to be
useful, the databases must be maintained and feedback updated. Hoey & Gardner (1999) report
results of an ongoing alumni and employer survey program used to improve institutional
effectiveness. They point out that the maximum effectiveness of this approach does not begin to
accrue until several cycles of data collection occur. At least three cycles of data collection are
needed for trend analysis to begin.
This paper describes a multifunctional alumni survey which was implemented at Regis
College. The survey was intended to meet the needs of our career planning, academic planning,
institutional advancement and enrollment offices; to help us assess institutional effectiveness;
and to provide baseline data that would enable us to analyze institutional trends going forward.
6 MAXIMIZING ALUMNI FEEDBACK
Method
A survey was made available to all Regis College Alumni in electronic and paper
formats: through a link on our alumnae page, in an email to all alumni who have provided an
email address, through alumni Facebook pages, as an insert in our alumni magazine, and in the
materials packet for all annual reunion attendees. All electronic requests for information
included a link to the survey formatted in SurveyMonkey; the paper requests included a copy of
the survey and a return envelope. The data collection began May 1, 2012 and continued until
July 31, 2012. Respondents were asked to indicate their level of agreement with 25 statements
designed to assess their opinion of the value and benefits of their Regis College degree such as
“Regis prepared me to succeed in my career” and “the education I received at Regis was worth
the investment in time and money” or to assess services such as “Regis provides valuable
academic advising” and “Regis provides strong career development services.” They were also
asked to rate 20 items indicating how much emphasis they believe Regis College should place on
a variety of experiences or services such as career advising, study abroad opportunities, a broad
liberal arts education, a global education, and faculty/student interaction outside of the
classroom. Finally, respondents were asked to provide information about perceived importance
of contributing to Regis, their contact information; year of graduation and major; information
about additional degrees attained; employment status, employer and salary; volunteer and
community service work; and accomplishments they are particularly proud of. The survey
questions are provided in the Appendix.
7 MAXIMIZING ALUMNI FEEDBACK
Results
Seven hundred ninety eight alumni returned surveys by the end of July, 2012. The vast
majority of responses were electronic: 689 SurveyMonkey responses and 109 paper responses,
with 76 of the paper surveys originating in our alumni magazine, and 33 in annual reunion
packages. As shown in Figure 1, responses were well distributed across graduation decades, and
the preference to respond electronically was equally distributed. A comparison of paper and
electronic responses yielded no significant differences. Paper responders were not older than
electronic responders, nor were they likely to show attitudes different from the electronic
responders.
The majority (59%) of survey respondents has either obtained an advanced degree, or is
currently enrolled in a graduate program, as shown in Figure 2.
26 25 19 8 12 17
10
52
110 109
107
126
141
34
0
20
40
60
80
100
120
140
160
180
1940s 1950s 1960s 1970s 1980s 1990s 2000s Unknown
Figure 1. Response by Graduation Decade and Modality
On-Line
Paper
8 MAXIMIZING ALUMNI FEEDBACK
Figure 2. Degree status of Regis Graduates
In addition to the 59% of respondents who already have at least one advanced degree, 30% of all
respondents are considering furthering their education. The desire for additional education was
most noticible among recent graduates, those who completed their education between 2007 and
2011, as shown in Figure 3.
Figure 3. % of 2007 – 2011 graduates who are considering advanced education
Figures 4 and 5 show salaries reported by the respondents.
BA/BS 41%
MA/MS 42%
PhD 6%
Prof 5%
Currently Enrolled 6%
Yes 69%
No 31%
9 MAXIMIZING ALUMNI FEEDBACK
Figure 4. Current salary of all survey respondents.
Figure 5. Current salary of 2007-2011 graduates.
Very, very few respondents reported that they were currently seeking employment, and most are
employed full time, as shown in Table 1.
163
44
95
127
85
41
14 33
86
0
20
40
60
80
100
120
140
160
180
2
11
14 15
5
1 0 0 3
0
2
4
6
8
10
12
14
16
10 MAXIMIZING ALUMNI FEEDBACK
Table 1. Employment status All
Respondents 2007-2011 Graduates
Employed Full Time 60% 77% Employed Part Time 13% 17%
Not Employed, Not Seeking Employment 23% 4% Not Employed, Seeking Employment 4% 2%
Respondents provided an impressive list of professional accomplishments,
service/volunteer/advocacy work, and recognitions/rewards/honors that they have received. A
very brief sample, selected to show the diversity of experiences in provided in Table 2.
Table 2. Sample accomplishments, advocacy work, and recognitions
Professional Accomplishments Bringing several products to market in oncology and hematology I am known throughout the country as a tenured, proficient, Latin teacher Working with to help them combat childhood obesity COO of a Rehabilitation Hospital Being a member of the federal judiciary for 22 years Being executive director or a domestic violence/sexual assault program
Service/Volunteer/Advocacy Work I am a guardian ad litem, representing the interests of abused/neglected children in court Dog Bones - Therapy Dog team Board of Directors; Historical Society Trustee of Family Foundation that supports grassroots community projects Working for the UN in peacekeeping operations Immigration Advocacy and Skill Training
Recognitions, Awards, Honors National Park Service Star Award for helping to develop/pilot new education programs Resident of the year. Medical School Class President Army's White Plume Award for service to Soldiers and their Families Grant recipient from the Geraldine Dodge Foundation for work in education Elected first woman Mayor of my city
Respondents were asked to indicate how important it is for them to contribute financially to
Regis College and, if they do feel it is important, they were asked to describe their motivation for
11 MAXIMIZING ALUMNI FEEDBACK
giving. Table 3 shows attitudes toward giving for all respondents, and that 2007-2011 graduates
are more likely to feel that it is important.
Table 3. Responses to, “How important is it for you to contribute financially to Regis College?
All Respondents
2007-2011 Graduates
Very Important 29% 38% Somewhat Important 52% 44%
Not Important 19% 18%
As shown in Table 4, reasons for giving varied a bit between all respondents and the most recent
graduates. Recent graduates were less inclined to cite the desire to “give back” as their
motivation, and slightly more inclined to cite peer encouragement, ensuring an excellent
education for future students, and the tax benefits of charitable giving.
Table 4. Motivation for Giving All
Respondents 2007-2011 Graduates
Regis College gave me an exceptional education; I want to give back.
57% 31%
Fellow Regis College alums encourage me to give 9% 14% Regis needs my support to ensure an excellent education for
future students 60% 63%
The tax benefits of charitable giving 13% 20%
In addition to giving financially, respondents indicated that they felt it was quite important to
contribute to Regis College in other ways, with the younger alums most likely to feel this is
important, as shown in Table 5.
12 MAXIMIZING ALUMNI FEEDBACK
Table 5. Responses to, “How important is it for you to contribute to Regis College in other ways?
All Respondents
2007-2011 Graduates
Very Important 21% 38% Somewhat Important 53% 44%
Not Important 26% 18%
Respondents were asked to indicate their agreement with a series of statements about Regis on a
5 point likert scale. These responses provided the information we need to assess and improve
our institutional effectiveness. Finally, they provided opinions regarding the things they believe
we should be emphasizing going forward.
Discussion
The Regis College Alumni Survey provided invaluable content and methodological
information for our institution, and for others considering implementing a similar survey.
Responses were well distributed across graduation decades. The vast majority of responses
(86%) were electronic. Interestingly, alums graduating in the 1940s were just as likely to
respond electronically as our most recent graduates. Paper responders were not older than the
electronic responders, nor did they reveal different attitudes than the electronic responders. This
suggests that the use of on-line communication technologies has become sufficiently ubiquitous
that we can use survey tools such as SurveyMonkey and assume that we are accessing a
representative sample of our alumni population. We cannot, however, assume that a sample such
as this is unbiased. All respondents were contacted through Regis Alumni sources. It is likely
that we were contacting graduates who are motivated to stay in touch with Regis and our
respondents were a self-selected group who were motivated to provide feedback. It is highly
13 MAXIMIZING ALUMNI FEEDBACK
likely that their opinions were more positive than a true random sample of graduates would hold.
Given most of the goals of this survey -- to improve our database of alumni information, identify
internship and career opportunities for current students, obtain “success stories” for recruitment
purposes, and obtain information that would support future fundraising efforts, this sample is
appropriate. It is important to recognize, however, that this sample does not provide a true
measure of institutional effectiveness. Never-the-less results did identify important institutional
issues we should address and it did identify specific issues we need to obtain additional
information about, using a more systematic sample.
The majority of our respondents (59%) have obtained an advanced degree since
graduating from Regis and most (69%) of our 2007-2011 graduates are considering additional
education, even though 39% of this group already has an advanced degree or are currently
enrolled in a graduate program. We will be using this information to learn more about the
graduate programs they are interested in, as we expand our graduate programming at Regis.
Likewise, almost all of our respondents are employed. Only 4% overall and 2% of the
2007-2011 graduates reported that they are currently seeking employment. This is excellent
news, but this is an area that is probably impacted by response bias. It is more likely that our
graduates who are feeling successful would respond to the survey than those who are not feeling
successful. The results must be interpreted with caution, therefore. Despite the probability that
these results do not provide a full picture of alumni employment, they do provide an excellent
source of information for Institutional Advancement, recruitment, and for career and networking
opportunities or classroom speakers. Most respondents included specific information about their
work and their employers. This is an invaluable resource for us going forward. Likewise, the
salary information provided helps us as we discuss the paths our alums of various majors took
14 MAXIMIZING ALUMNI FEEDBACK
with our current and potential students. Information about professional accomplishments,
service and advocacy work, and awards and recognitions is equally valuable.
Not surprisingly, given our biased sample, the majority of respondents indicated that it is
important for them to contribute financially to Regis College. It was surprising, however, to
learn that our recent graduates were the ones who were the most likely to indicate that it is very
important. Likewise, most respondents indicated that it was important to contribute in other
ways and the young alums were again more likely to indicate that this is so. This is a significant
finding. Young alums are telling us that they are ready, willing, and able to be involved. This is
a relatively untapped resource. Although young alums usually have less financial means to give,
it is important to establish a relationship and begin the mutually beneficial habits that will sustain
both Regis and our graduates. Graduates who cannot give a great deal financially still have a
much to offer experientially. Internship placements and career opportunities are very important
to us. Further, we know that people who give in one manner tend to be more inclined to give in
other ways. This means that alums who can provide opportunities or service now will be also be
inclined to give financially when they can. Likewise, our financial donors are likely to provide
additional types of experiential support if we ask.
This survey has had an immediate impact on our operations at Regis. Based on the
feedback that was much less positive than we would have liked we have already made dramatic
changes to our career services and advising services. We have hired a new Director of Career
and Internship Services and a task force is currently preparing a report on a revised academic
advising model with a goal of implementing the new model in the fall of 2013. The alumni
employment and experience information is being added to the career and internship database.
Faculty have access to contact and experience information for classroom speakers, focus groups
15 MAXIMIZING ALUMNI FEEDBACK
and advisory boards. Institutional Advancement is taking full advantage of the updated contact
information and the information about the alums who feel it is important to contribute to Regis.
Information about graduate programs our alums are in and are considering attending is informing
our own curriculum development as we consider how to best prepare our students for their future
endeavors. Finally, we are using the information about what our graduates are doing in our
admissions and recruitment messaging.
We will be conducting follow up research to address some of the questions these results
raised. For example, we want to learn more about the areas alums advised us to emphasize and
about the areas in which they indicated that we have room for improvement. We will also be
asking our respondents what we can or should do to foster relationships with our graduates,
which we know are mutually beneficial.
Although we do not plan to conduct another full scale survey such as this one for at least
five years, we will be conducting targeted annual surveys. We will be getting in touch with
graduates of specific majors as those programs undergo review, we will be following up with
specific populations to learn more about how their experience compares with other students.
Specifically, we want to learn about the experiences and opinions of graduates who are
traditionally underserved, first generation, and/or low income. We want to learn all we can to
ensure that we are maximizing the experience, and the probability of success, for future students
from these vulnerable populations.
We will be following up with specific academic ability groupings – do students who
come to us with a high ability profile experience Regis and their life after graduation differently,
or do we succeed at closing the gaps between these groups? Finally, we will use these results as
16 MAXIMIZING ALUMNI FEEDBACK
baseline data and follow up with specific questions so we can track institutional effectiveness
trends.
Future data collection will take advantage of electronic surveys. We will be holding
focus groups, and we will intentionally contact a balanced sample of graduates in order to more
accurately assess our ability to fulfill our mission. In addition, we will continue to work with
those alumni who are interested and motivated to maintain contact with their alma mater. We
have learned that alums, especially young alums, are an underutilized resource. They are
motivated to give, and are telling us that they want to maintain a connection.
17 MAXIMIZING ALUMNI FEEDBACK
References
Borden, V. M. (2005). Making an impact with alumni surveys. New Directions for Institutional
Research, 126, 61 - 72.
Bossart, S., Wentz, M., and Heller, T. (2009). Using alumni perspectives for university
evaluation and planning. College Student Journal, 43, 411-428.
Cabrera, A.F., Weerts, D. J., and Zulick, B.J. (2005). Making an impact with alumni surveys.
New Directions for Institutional Research, 126, 5 – 17.
Davidson-Shivers, G., Inpornjivit, K., & Sellers, K. (2004). Using alumni and student databases
for program evaluation and planning. College Student Journal, 4, 510-520.
Hoey, J. J. & Gardner, D. C. (1999). Using surveys of alumni and their employers to improve an
institution. New Directions for Institutional Research, 101, 43 – 59.
Landrum, R.E. & Lisenbe, N.R. (2008). Use of alumni perceptions to evaluate instructional and
departmental quality. College Student Journal, 42, 408-415.
Ogletree, S. M. (1999). Improving career advising: Responding to alumni surveys. Journal of
Instructional Psychology, 26, 42 – 45.
Volkwein, J. F. (2010a). A model for assessing institutional effectiveness. New Directions for
Your opinion is one of the most important indicators of the effectiveness of a Regis education.
The perspective of alumni, who can evaluate how their experience has influenced their present work, activities, and beliefs, provides important feedback that we use to shape the things we do for current and future students. Your perceptions help us gain a complete picture of how well we are doing and what areas need improvements.
Please take a few minutes to complete the accompanying Alumni Survey. Your responses and those of your former classmates will be used to advance the mission of Regis College and to guide and enrich the experience of future students.
Please know that every response is significant and that we value your perspective.
Thank you for your support of your alma mater.
19 MAXIMIZING ALUMNI FEEDBACK
1. Please indicate your level of agreement with the following statements:
Strongly Disagree
Disagree
Neither Agree
or Disagree
Agree
Strongly
Agree
Regis prepared me to succeed in my career. If given the opportunity to start over, I would again choose to attend Regis.
The education I received at Regis made a significant contribution to the general quality of my life.
The education I received at Regis deepened my understanding of moral and ethical problems.
Regis empowered me to challenge myself academically.
Regis empowered me to serve and to lead. Regis is a diverse and welcoming community. The education I received at Regis was worth the investment in time and money.
Regis increased my appreciation of art, music, and theater.
My spiritual life was enhanced at Regis. Since graduation I have felt an increasing loyalty to Regis.
I would recommend Regis to others. Regis offers numerous opportunities to learn outside the classroom.
Regis provides valuable academic advising. Regis provides strong career development services.
Faculty members at Regis are excellent. Regis provides strong support and attention to individual students.
Regis should be concerned about the level of drinking and/or drug use on campus.
Regis should be concerned about discrimination or harassment on campus.
Regis should be concerned about declining academic standards.
20 MAXIMIZING ALUMNI FEEDBACK
2. Using a scale in which 1 is poor and 5 is excellent, how would you rate the following?
Poor Excellent My overall experience with Regis College as a student. 1 2 3 4 5 The value of a Regis College degree in the job market. 1 2 3 4 5 My treatment as an alum. 1 2 3 4 5 My current feeling of connection to Regis College. 1 2 3 4 5
3. Using a scale in which 1 is “none at all” and 4 is “a great deal” please indicate how much emphasis you believe Regis College should place on each of the following:
None At All
A Great Deal
Faculty/student interaction outside the classroom 1 2 3 4 Academic advising 1 2 3 4 Career advising 1 2 3 4 Leadership development 1 2 3 4 Community service 1 2 3 4 Internships 1 2 3 4 A global education 1 2 3 4 Study abroad opportunities 1 2 3 4 Faculty research 1 2 3 4 Student research 1 2 3 4 A broad liberal arts education 1 2 3 4 Intercollegiate athletics 1 2 3 4 Extracurricular activities (other than athletics) 1 2 3 4 Commitment to Catholic mission 1 2 3 4 Heritage of Sisters of Saint Joseph 1 2 3 4 Campus Ministry activities 1 2 3 4 Skills valuable in the workforce 1 2 3 4 Moral/ethical development 1 2 3 4 Need-based financial aid 1 2 3 4 Merit-based financial aid 1 2 3 4
4. In what year did you graduate? __________ 5. What was your major? ____________________ 6. What was your favorite class at Regis? ___________________
21 MAXIMIZING ALUMNI FEEDBACK
7. Please indicate the highest level of education you completed _____ Bachelor’s degree _____ Master’s degree Program of study, degree, and school ______________________________ _____ Professional degree (Law, Medicine, etc) Program of study, degree, and school ______________________________ _____ Doctorate Program of study, degree, and school ______________________________ 8. Are you currently enrolled in a graduate program?
_____ Yes Program of study, degree, and school ______________________________ _____ No
9. Are you considering continuing your education? _____ Yes Program and degree ______________________________ _____ No
10. Current employment status
_____ Employed full time Employer and position _________________________
_____ Employed part time Employer and position _________________________
_____ Not employed, seeking employment _____ Not employed, not seeking employment
11. Current Salary range _____ I am not currently working
_____ Less than $25,000 _____ $25,000 – $49,999 _____ $50,000 – $74,999
_____ $75,000 – $99,999 _____ $100,000 – $124,999 _____$125,000 – $149,999 _____$150,000 or over _____ I prefer not to say
12. Please share a professional accomplishment you are proud of. 13. Please tell us about any community service/volunteer work/advocacy work you are involved
with. 14. Please tell us about any professional and/or community recognitions (awards or honors) since
graduation.
22 MAXIMIZING ALUMNI FEEDBACK
15. How important is it for you to contribute financially to Regis College?
_____ Very important _____ Somewhat important _____ Not important
16. If it is somewhat or very important to contribute financially to Regis College, which of the
following describes your motivation to do so (indicate all that apply)? _____ Regis College gave me an exceptional education; I want to give back. _____ Fellow Regis College alums encourage me to give _____ Regis College needs my support to ensure an excellent education for future
students _____ The tax benefits of charitable giving _____ Other ____________________________________________________
17. How important is it for you to contribute to Regis College in other ways?
_____ Very important _____ Somewhat important _____ Not important
18. Please provide your preferred mailing address:_________________________________
19. Please provide your preferred email address___________________________________ 20. Please provide your preferred telephone number________________________________
NCES Projection Methodology:Institutional Research Applications
J. R. Robles, PhDCenter for Planning and Institutional Effectiveness
State University of New YorkEmpire State College
November 2012NEAIR 39th annual meeting
Bethesda, MD
The NCES report of projections for 2020, include forecasts for several indicators andstrata within the post-secondary educational system. A Holt-Winter filter model is pre-sented as a generalization of the NCES techniques with comparable results. Applicationsto enrollment and completions time series are discussed in the context of institutionalresearch.
1 Introduction
NCES Reports focusing on projections, which include the Projections of EducationStatistics to 2020 (Hussar and Bailey, 2011), use global and stratified time series topredict enrollments and completions, which are of particular importance for institutionalresearch (IR). NCES projection techniques rely on classic concepts in time series analysis:linear models and smoothing. However, standard practices in educational research arefocused on traditional cross-sectional linear models (Henson, Hull and Williams, 2010).This has a two-fold impact on the use of projections: projection figures may be mis-interpreted or underutilized, as the origins of such projections are obscure, due to thelack of familiarity with the techniques. Second, IR departments may be limited in theuse of these techniques to make their own projections or adapt the national projectionto specific contexts as needed. Here, NCES projection methodology is explained and
1
examples of its use are provided, as well as a comparison between technique variationsand a discussion of the uses of these procedures in IR. NCES method (Hussar and Bailey,2011, p.78) includes two versions of an exponential smoothing procedure, and a lineartrend model with external predictors.These techniques have complex extensions in thefield of time series modeling with applications to institutional data (Weiler,1980;Li andCheng, 2007; Cryer and Chan, 2008; Huang et. al, 2011).1 In this paper, the discussion islimited to the exponential smoothing techniques and a well know model that generalizesboth specifications. NCES projections use other models, including linear equations forcompletions, and some of those equations include external regressors tied to populationchanges. The discussion here is limited to the smoothing techniques, given the widerrange of applications to IR, in situations in which external regressors may not be avail-able or convenient to use. On the other hand, IR researchers may be more familiar withthe regression-based models and may benefit more from an illustration of the smoothingtechniques.
1.1 Exponential Smoothing
Exponential smoothing has two versions: single and double. These terms correspond toa more general formulation, that of Holt-Winters smoothing models (Winters,1960).
The single exponential smoothing procedure employed by the NCES is described asfollows:
at = αxt + (1− α)a(t−1) (1)
with0 < α < 1
, where at is the smoothed value at time t, xt is the input value at time t, and α isthe smoothing parameter. This model has been used extensively in several disciplines,and it is also known as the Exponentially Weighted Moving Average (EWMA) model.One important aspect of the EWMA model is its relationship with more general modelsfor time series. In particular, EWMA can be considered equivalent to an ARIMA(0,1,1)specification with no Auto-Regressive (AR) component and a Moving Average (MA) co-efficient 1−α, with 1/α indicating the number of time points used for the MA (size of themoving window). In practice, some of the software implementations of the Holt-Wintersmodel optimize the α parameter by minimizing the consecutive lead-out errors (from t
1Time series analysis of educational data, specially enrollment series often involve highly tech-nical treatments. Fundamental issues such as stationarity, seasonality and transformations are nottreated here due to space considerations and to keep the technical details at a minimum. The readeris encourage to review those topics in the relevant literature.
2
to t+ 1), which can render a different parameter space than the standard ARIMA(0,1,1)using different constraints. There are practical ways to estimate the α parameter whichare especially useful for spreadsheet implementations, and there are also rules of thumbon how to determine the α value (Cryer and Chan, 2008). One important property tokeep in mind is that when α approaches 0, EWMA resembles a pure MA model, andwhen α approaches 1 becomes a random walk model. For most practical purposes theEWMA or exponential smoothing will deliver a different performance than these simplermodels when the α parameter is far from the extremes of the parametric space.
EWMA incorporates what is called a level component of the series, with the emphasison the MA term. In the case of series with a strong trend component, the Holt-Wintersgeneralization of the EWMA model provides away to incorporate the trend componentinto the model. An integrated level and trend smoother can be formed by adding thetrend (slope) term to the EWMA, :
at = α(xt − st−p) + (1− α)(at−1 + bt−1) (2)
bt = β(at − at−1) + (1− β)bt−1 (3)
where bt is the slope at time t and β is the smoothing parameter. This is a Holt-Winters level-trend models with parameters [α, β], referred in the NCES reports as doubleexponential smoothing. In this case, the optimization of parameter α, β is a morecomplex affair than for EWMA, requiring the identification of level and trend componentsof the series. Nevertheless, Holt-Winters models are implemented in most statisticalsoftware packages and may be used as smoothers even with spreadsheet software.
In this paper, the α specification (level) is compared with the α, β specification (level-trend) for illustration purposes, in order to show how these different Holt-Winters specifi-cations can perform with some example data. These specifications are called exponentialsmoothing and double exponential smoothing in the NCES reports.
1.2 Forecast Performance metrics
The accuracy of the predictions are analyzed using the Mean Absolute Percentage Error(MAPE) metric, typically predicting the value of the series at tn+1, from the prior seriesvalues (t0 − tn). MAP error can be defined as:
et = 100|xt − x̂t|
xt(4)
where et is the MAP error at time t, xt is the observed value and x̂t is the forecast valuefor time t.
3
Several aspects of this projection approach may be of special interest for the IRcommunity: the interpretation and use the projection estimates across years, and theconsiderations to make when applying these projection techniques to their own data.
This article illustrates the issues involved in the interpretation of the projections andpresents a comparison of two projection techniques with national public data, later high-lighting how these techniques may be used with institution-specific data, making emphasison the MAP error metric as used by the NCES projection report. There are many otherforecasting error metrics, based upon model goodness of fit, prediction error, confidenceband width, however the MAP error metric is used here to follow the NCES standards.
2 Method
2.1 Design
This is a secondary data analysis study. Data is extracted from the NCES data sources,and the projection models are implemented to compare the projection results of the dif-ferent techniques. Variables Two time series were selected for the analysis: Enrollmentsin Public 4-year post-secondary institutions, and attainment in 4-year degrees in publicpost-secondary institutions. Each time series is accompanied by two stratification modi-fiers: gender and course load, both treated as categorical variables, to show the variabilityof the model performance across strata. The period of observation was 1991-2009, andthe time-resolution was one data point per year.
2.2 Analysis
2.2.1 Comparison of projection techniques
Projections of enrollment and degrees conferred were compared using the MAPE metric,for the whole series (1991-2009), obtaining the MAPE estimate for lag1 (next year)projection for the full series. The models compared were the ERWMA and the Holt-Winters level-trend models. Following NCES report conventions , these are results areinterpreted by their magnitude rather than statistical significance.
2.2.2 Stability of the enrollment projections for post-secondary institutions
Enrollment projection Mean Absolute Percent Error (MAPE) was analyzed for the 2011projected value using 10 time lags, as reported by NCES. This analysis was combinedwith an Auto-correlation analysis of the enrollment series using a 10 year window. Results
4
taken from the NCES reports are used for secondary analysis, and independent analysesperformed by the author are presented, using Holt-Winters models evaluated for 1991-2001 series to forecast 2002-2009 values for enrollment and completions series fromIPEDS data lab.
3 Data sources
All secondary data sources: NCES projection and Reports tables, Integrated Postsec-ondary Education Data System (IPEDS) Data Center (Enrollment and Completions Sur-veys)
4 Results
4.1 Comparison between the Techniques
Several series were analyzed with the single and double exponential smoothing models,according to Holt-Winters specifications. These independent analyses were carried out onenrollment and completion series for national numbers in the period of 1991-2009. Theresults shown here are typically for models forecasting 2009 from the series 1991-2008(1 year lead-out projections).
The single exponential (EWMA) model results show MAPE of 2.24% for Enrollmentsin Public 4 year institutions. For part-time enrollments, MAPE was 2.06 for females and2.26 for males. For completions, bachelor degrees conferred by public institutions, MAPEestimates were 2.6 for females and 2.33 for male students. In all these EWMA models,the optimal parameter estimate for a was 0.99.
The Holt-Winters level-trend model (double exponential smoothing), for enrollments,yielded a MAPE estimate of 1.06%. For part-time, MAPE was 1.32 (Female), and1.38(Male). For Bachelor degrees, MAPE estimate was 1.28 (Female), and 1.73 (Male).For this model, parameter estimates showed greater variation: the enrollment series witha > 0.77 and b > 0.9 for all strata. For the completions series, a > 0.9 and b < 0.1 in allthe cases. Generally speaking, the completions series have a stronger trend componentthan the enrollment series for this particular dataset.
The MAPE differences between models are related to their goodness of fit. Thelevel-trend Holt-Winters model shows better fit than the ERWMA, as shown in Figure1. The better fit for the α, β double-exponential model may be due to the presence ofa strong trend on this completions series. As can be seen in the figure 1, the smoothed
5
Figure 1: Comparison of single and double exponential smoothing: Bachelor Degrees(Female) 1991-2009
series for the level-trend model tends to be closer to the observed values, especially atthe end of the time period, in which the linear trend is more dominant.
6
4.2 Stability of projection accuracy over time
The prediction accuracy decreases over time (a standard result for time-series projections).MAPE doubles in size from 1 year lag (1.7%) to 3 years lag (3.9%), and multiplies bya factor of 7+ at the 10 year lag (13.2%) (Hussar and Bailey, 2011, p. 119). This is apattern which can be observed in many forecasting situations, but it is clearly illustratedby the NCES results.
Figure 2: Lag-correlation plot: Enrollment in 4-year Public institutions 1991-2009.The circles represent observed data points, the center dotted line represent the pro-jected values and the solid lines the upper and lower-bound of the 95% confidenceinterval (CI) for the projection.
One possibility would be to forecast the series using an auto-regressive model insteadof exponential smoothing. However, further analysis reveals that such model would havesimilar issues in terms of long-term forecasting.
Lag-scatterplots (Figure 2), show how auto-correlation decreases sharply with years,from a strong auto-correlation in lag 1, to a weak relationship by lag 10 (ten years lead-out), consistent with the decrease in the projections accuracy exhibited by the MAP errormetric . In this case, an AR model will have the same declining forecasting accuracy overtime, given the weak serial correlation observed in the series just after a few lags (years).
7
So far, the analysis have focused on point estimates of the forecast values. However,a more comprehensive analysis of the forecasting model can be accomplished by includingthe confidence interval of the forecast, to put the forecasting accuracy in a better context.
Figure 3 shows Holt-Winters level-trend model forecasting enrollment in 4-year publicinstitutions. This plot shows forecasts for 2002-2009 based upon the 1991-2001 series.The projected values describe a linear trend, which decreases in accuracy until the very lastyear in which the observed point re-aligns with this trend. This highlights the difficultiesinvolved in the evaluation of forecasting models using a single data point. On the otherhand, the plot shows how the confidence band for the projection expands over time,making the forecast band much narrower for short lead-out times.
YEAR
1995 2000 2005
6000
6500
7000
7500
8000
8500 Observed
ProjectedEnrollment in Public 4-Year Institutions
(in thousands)
Figure 3: Holt-Winters Forecasting: Enrollment in 4-year Public institutions 1991-2009. The circles represent observed data points, the center dotted line represent theprojected values and the solid lines the upper and lower-bound of the 95% confidenceinterval (CI) of the projection.
Figure 4 show how the presence of a strong trend component can stabilize the predic-tion accuracy, given that the model takes that trend into account, such as the level-trendHolt-Winters model used. It also shows how stratification plays a crucial role in theidentification and interpretation of these forecasting models. For this case, while theconfidence band widens over time, the projected value remain at a similar distance fromthe observed values, describing a rather parallel trend. In contrast with the prior series
8
shown in Figure 3, the strong linear trend keeps the accuracy of the forecast relativelystable.
YEAR
1995 2000 2005
60
00
00
70
00
00
80
00
00
90
00
00
10
00
00
011
00
00
0
Observed
Projected
Bachelor Degrees Conferred (Female)
Figure 4: Holt-Winters Forecasting: Bachelor Degrees (Female) 1991-2009. Thecircles represent observed data points, the center dotted line represent the projectedvalues and the solid lines the upper and lower-bound of the 95% CI.
The MAP error values as shown in Figure 5 indicate how the short-term forecast erroris very small when compared to the long-term forecasting error. In this case, there is aninitial negative trend, and then a period with no clear observable trend. Just after 2005(the middle of the forecast period), the observed data start to show a positive trend. Thisresult in MAP error estimates that grow from 2.9% in 2005 to 13.7% in 2009. Whencompared with Figure 4, this shows how the differences in the series, both the series usedto fit the model and the one projected, can interact with the model specification to affectthe stability of the forecasting accuracy.
For illustration purposes, the model based upon the 1991-2001 can be called a long-term model or long-memory models.2. A much short-term model can be built using the2002-2006 series to forecast the 2007-2009 values. Such short-memory model won’tinclude the effects of the negative trend observed at the beginning of the series.
2Long-memory models are a special kind of time series models, however, here the term is usedjust to draw the difference between the short and long-term impact on the forecast, and not in thestrict sense of the definition of a long-memory model
9
YEAR
1995 2000 2005
55
06
00
65
07
00
75
08
00
85
09
00
Observed
Projected
Part-Time Enrollment in 4-Year Institutions(Male)
MAPe= 2.1 % 2.5 2.52.9
4.5
8.0
9.4
13.7
Figure 5: Holt-Winters Forecasting: Part-Time Enrollment (Male) 1991-2009. . Thecircles represent observed data points, the center dotted line represent the projectedvalues and the solid lines the upper and lower-bound of the 95% CI. The numbersright above the points are the respective MAP error estimates for each projectedvalue.
The contrast between the long and short-memory models is illustrated in Figure6, which include projected series and confidence bands for both models. The shorter,narrower projection band covering just the 3 final point of the series corresponds tothe short-memory model. This plot shows that even with the short memoy model, thechanges in the series makes forecasting a difficult task for this kind of model. Theprojected series is much closer to the observed values but 2 of the 3 observed values falloutside the confidence band for the forecast. This may be an indication that a differentkind of model is required for this series, and illustrates once again how stratification canaffect modeling and forecasting.
5 Discussion
NCES projection reports illustrate two important properties of time series forecasts: sen-sitivity to stratification and differential accuracy of short-term vs long-term projections.Projection accuracy decreases as the lag between the observed and projected value in-
10
YEAR
1995 2000 2005
55
06
00
65
07
00
75
08
00
85
09
00
Observed
Projected
Part-Time Enrollment in 4-Year Institutions(Male)
Short-Memory Model
Figure 6: Comparison of long and short-memory Holt-Winters Forecasting with con-fidence band: Part-Time Enrollment (Male) 1991-2009
creases. This is a regular occurrence in time series projections, even with the large samplesize. On the other hand, given how the Holt-Winters model parameters are optimized,short-term projections are favored by such procedure.
Caution should be exercised when making projections of enrollment and completionsof particular institutions, or even interpreting the NCES projections, given that accuracydecreases sharply over time. Most series can be predicted within a 2% MAPE for thefirst year, but MAPE increases after 3+ years. The judgment about an acceptable errorwill depend on the institutional priorities and the sample size, which can have a stronginfluence the accuracy of the predictions. As to the different projection techniques, itis important to consider the combination of techniques and stratification. The samestratification variable can modify the accuracy of projections in different directions: forthe ERWMA model, gender stratification affects the accuracy of predictions in oppositedirections for enrollments vs completions. Overall, the Holt-Winters level-trend model,combining the MA and slope components, performs better with the NCES data. The useof NCES projections as reference values is recommended with the relevant stratification(institution type, sector, demographics).
It is important to recognize that several of the examples presented here contain astrong trend component, thus favoring the two parameter version of the model. For
11
practical applications in IR, checking both versions of the model could be a good ap-proach, as with single-institution data with no strong trend, the EWMA model mayprovide a more parsimonious specification.
The NCES projection techniques can be applied using institution specific numbersto create statistically sound forecasts. These techniques can be applied to enrollment,completions and graduation and retention rates treated as time series.
6 Final Comments
The exponential smoothing projection approach provides the institutional researcher witha flexible tool to make statistically sound projections, with applications to enrollmentsand completions. The NCES projections are a very useful reference for IR scientists andpractitioners, showing the robustness of the methodology and applicability across multiplestrata.
Some necessary adaptations need to be made in order to apply these techniques toa specific institutions. There are important differences in the sheer volume of data, andthe magnitude of the quantities handled. On the other hand, for a national series it ismore meaningful to use external indicators (i.e. census data) in regression-type modelsfor forecasting. For the specific institution, the relationship of those external regressorsto the local numbers can be more indirect or delayed.
Another consideration that goes beyond this paper is using different time resolutionssuch as monthly or quarterly data. In such cases there’s an additional component to beconsidered which is seasonality. In such cases, the Holt-Winters model can accommodatethe seasonal component.
Regardless of the model chosen, projections are statistical estimates, which shouldbe interpreted in the context of a confidence band. It should be highlighted that theprojection error is an integral part of the model-building process, as stated by the NCESreport:
Projections of a time series usually differ from the final reported datadue to errors from many sources, such as the properties of the projectionmethodologies, which depend on the validity of many assumptions. (Hussarand Bailey 2011, p. 1.)
Forecasting models are complex dynamic analytic components which need to be main-tained and revisited on a regular basis, and forecasting error is just one element of quanti-tative feedback that must be used to improve the model. Given the relative simplicity ofthe Holt-Winters model, and the ability to make projections without external predictors,
12
this segment of the NCES methodology has shown to be useful for IR, provided that isused for short-term forecasting, and with the necessary caveats about the difference inthe volumes of data.
13
References
1. Cryer, J. D. ; Chan, K.S. (2008). Time series analysis. Second Edition. NewYork: Springer.
2. Henson, R. K.; Hull, D. M. ; Williams, C. S. (2010). Methodology in Our Edu-cation Research Culture : Toward a Stronger Collective Quantitative Proficiency.Educational Researcher, 39, 229-240
3. Huang, Y.; Horng S.; He ,M; Fan, P.; Kao T.; Khan, M.; Lai, J.; Kuo, I. (2011) Ahybrid forecasting model for enrollments based on aggregated fuzzy time series andparticle swarm optimization. Expert Systems with Applications, 38, 8014–8023.
4. Hussar, W.J., and Bailey, T.M. (2011). Projections of Education Statistics to2020 (NCES 2011-026). U.S. Department of Education, National Center for Edu-cation Statistics. Washington, DC: U.S. Government Printing Office.
5. Li, S.-T.; Cheng, Y.-C. (2007). Deterministic fuzzy time series model for forecast-ing enrollments. Computers and Mathematics with Applications, 53, 1904–1920.
6. Weiler, W. C. A Model for Short-Term Institutional Enrollment Forecasting. TheJournal of Higher Education, 51,314-327.
7. Winters, P. (1960). Forecasting sales by exponentially weighted moving averages.Management Science, 6:324–342.
14
1
IR Report
Non-returner Survey: Why Students Leave
Laura Ariovich and W. Allen Richman
Prince George’s Community College
310 Largo Rd Largo, MD 20774
Abstract Prince George’s Community College has regularly conducted the Non-Returner Survey since 2001. The survey is administered in the Fall to students who were enrolled in the previous Spring, but did not enroll or graduate in the following Fall semester. A new methodology used in Fall 2011 raised the survey response rate, saved resources, and yielded, for the first time, an actionable data set. Introduction Prince George’s Community College (PGCC) is a large suburban college located in Largo, Maryland, with a predominantly African American population. Offering a broad range of credit and non-credit programs, the College attracts over 40,000 credit and noncredit students annually. In Fall 2011, the College had a headcount of 14,647 credit students. The majority of these students were part-time (70%) and female (60%).
As do other Maryland community colleges, Prince George’s Community College periodically surveys its non-returners, defined as those credit students who were enrolled in the Spring but did not return in the following Fall. There are two questions in the survey that are required for State reporting:
1. What was your main goal in attending PGCC in Spring 2011?
2. Do you believe you achieved the above goal at PGCC?
In the past, the methodology used by the Office of Planning, Assessment, and Institutional Research (OPAIR) consisted of identifying all non-returners and then drawing a random sample of 1,000 students, who would receive the survey questionnaire by postal mail. Students who did not reply would receive a second mailing. Even with the second mailing, the survey had very low response rates. Between 84 and 160 respondents—or about 1.7-3% of the actual non-returner population—filled out the survey between 2001 and 2007. The low response rate severely limited the survey’s utility and did not help identify non-returners’ reasons for leaving.
2
Moreover, the survey had little use to inform interventions aimed at reducing the non-returner population.
The purpose of this report is to underscore the importance of the non-returner survey in the context of the typical enrollment flow at PGCC, present a revamped methodology to survey non-returners, and discuss the survey findings and next steps to reduce the non-returner rate.
PGCC Enrollment “Flow” and the Importance of Studying Non-Returners As background research for the survey, OPAIR examined the College’s enrollment trends from 2007 to 2012. As seen in Figure 1, PGCC’s Fall enrollment has been fairly consistent over time, notwithstanding a slight annual increase from 2008 to 2010.
Figure 1: PGCC Fall Credit Enrollment
However, the stability of overall enrollment trends is deceptive when the “flow” of students enrolling and not returning is not examined. An examination of the typical enrollment flow from the Spring to the Fall semester for 2007-2011 showed that each Spring the College loses 5,000 to 6,000 students, approaching 40% of the credit population. Despite the massive Spring exodus, the College manages to maintain its overall enrollment in the Fall by “replacing” the lost students with three sources of incoming students: students new to College, students who transfer into PGCC from other institutions, and students who renew their attendance after having stopped for one or more semesters (see Figure 2).
11,861 12,110 13,685
14,814 14,647
0
2,000
4,000
6,000
8,000
10,000
12,000
14,000
16,000
2007 2008 2009 2010 2011
3
Figure 2: PGCC Enrollment Flow
Analyzing the student enrollment flow brought to the fore the previously overlooked loss and “replacement” of students from Spring to Fall. These data highlighted the need to learn more about the non-returner student population and take steps to reduce the non-returner rate.
Revamping the Non-Returner Survey In fall 2011, OPAIR revamped the Non-returner Survey with the purpose of acquiring useful and actionable data. Instead of sending the survey through postal mail to a random sample of 1,000 students, an electronic survey was sent to all non-returning students with valid email addresses. After the initial email, four reminders were sent to those who had not yet responded. Reminders were sent on different days of the week and at different times during the day. All reminders produced an initial jump in the number of responses (though the size of this jump diminished over time).
In order to increase the Non-Returner Survey response rate, OPAIR relied on two strategies. The initial invitation to fill out the survey and all reminders were directly signed by PGCC President.
4
In addition, all respondents who filled out the survey within the first 25 days were entered into a raffle to win a $50 gift card (with the exception of those who were employed by PGCC at the time of the survey). The survey was open for a month, but the majority of respondents (close to 72%) filled out the survey by the deadline for the raffle.
Response Rate The Non-returning Student Survey was sent by email as an electronic questionnaire. Out of the initial population of students who did not return in Fall 2011, 6,265 actually received the questionnaire; the rest (169 students) had no email addresses on file or had invalid email addresses. From this pool, 964 (15.4%) responded, yielding more than six times the best response rate of previous non-returner surveys. An analysis of demographic and other data for the 964 respondents showed that:
• 70% were female • They had a mean age of 34 • They attended a median of 6 semesters at PGCC • They completed a median of 26 hours at PGCC • 40% were currently attending another institution • 70% were working • 60% planned to return to PGCC
Although only the first three questions in the questionnaire were required, 96% of respondents completed the full survey. In addition, 65% of respondents chose to answer the open-ended question: “In what ways could PGCC better serve your educational needs?” As shown by these comments and by direct email replies sent by respondents, students valued the survey as an opportunity to convey their experiences, offer suggestions, and even ask for assistance to resume their college attendance.
Findings: What we learned about non-returners An analysis of the mandatory questions showed that nearly 50% of non-returners came to PGCC to earn an associate’s degree, whereas smaller percentages came to transfer (26%) or for other reasons (26%). Among those who came to PGCC for an associate’s degree, one third (33%) did not achieve their goal, one third partially achieved their goal, and one third achieved their goal completely (see Figure 3). Among those who came to PGCC to transfer or for other reasons (e.g., update skills, personal enrichment, etc.), the rate of students not completing their goals was significantly smaller, around 15%. Thus, more non-returners came to PGCC to obtain an
5
associate’s than to transfer or for other reasons. However, those seeking an associate’s were significantly less likely to achieve their academic goal.
Figure 3
In addition to the mandatory questions, the survey asked students about any hurdles which may have prevented them from returning to the college in the Fall semester. The students ranked these potential barriers as “major reasons,” “minor reasons,” and “not a reason” for not enrolling in the Fall (see Table 1). Approximately one third of respondents reported leaving because they had achieved their academic goal or transferred to another institution. Examining only those students who reported leaving without obtaining their educational goal or transferring, the factors identified by most students as a “major reason” for leaving were not having money to enroll (43%), personal problems (38%), being unhappy with one’s academic progress (25%), and being unhappy with the College’s services for students (25%).
Table 1
Item % Major Reason I did not have the money to enroll. 43 I could not attend college due to personal problems. 38 I was unhappy with my academic progress. 26 I was unhappy with the services for students at PGCC. 25
6
Equally important, the survey helped identify factors that were not perceived by students as reasons for leaving. Surprisingly, these factors included being unable to find childcare, lack of transportation, moving away from the area, and being unhappy with activities for students at the College. In all these cases, 85% of respondents or more indicated that the listed item was “not a reason” for leaving (see Table 2).
Table 2
Item % Not a Reason I could not find child care so that I could attend classes. 88 I could not get to campus due to lack of transportation. 85 I moved away from the area. 85 I needed a break from school. 77 The classes or programs I wanted were not available. 76 My educational goal changed. 75
Student Feedback in response to the Open-Ended Question As stated earlier, one of the impressive elements of the 2011 Non-Returner Survey dataset was that 65% of respondents typed answers to the open-ended question. A quick review of open-ended responses showed that most were detailed and somewhat lengthy. Given the richness of these data, students’ comments were coded and analyzed with NVivo, a qualitative research software program. The analysis was conducted in three stages:
Stage 1: Tentative categories were formulated based on a preliminary review of all comments.
Stage 2: All comments were coded based on the tentative categories. As part of this process, the categories were reformulated to achieve a better fit with the data.
Stage 3: Some categories were merged and others eliminated based on the type of comments and the number of quotes included in each category. All comments were then recoded using the final set of categories. The analysis focuses on the four categories in the final set that contained the larger number of comments.
The results of this analysis are summarized in Table 3. As shown in the table, roughly a quarter of comments reflected positive experiences with the College. However, there were also areas where students found barriers to success. Slightly over 25% of comments cited lack of responsiveness to student issues and concerns, including problems in specific areas such as advising and financial aid as well as more generalized concerns with interdepartmental communication and customer service. A much smaller but still sizeable set of concerns (13%)
7
addressed the lack of available courses at times that would fit students’ schedules. The last set of comments (8%) had to do with students’ difficulties paying for college and requests for greater flexibility or assistance in this area.
Table 3: Analysis of students’ comments (summary)
Main categories (may overlap) Percent of all comments
Subcategories within main category (may overlap)
Positive comments about PGCC
26%
Goal achievement Encompassing positive experience Positive experiences with faculty No complaints
Lack of college responsiveness
28% Problems with academic advising Problems with financial aid Problems with faculty General problems with college responsiveness
Lack of course availability 13% Locations, times, days, and frequency More online or hybrid courses
Affordability 8%
Students’ responses to the open-ended question offered a unique glance at their experiences with academic and nonacademic services. Understanding non-returners’ perspectives is an essential step in any successful effort to remove hurdles to student success. A more detailed account of the main classes of comments and subcategories is presented below.
Main category: Positive Comments Even though the wording of the question prompted respondents to think about ways to improve PGCC, over a quarter of those who did respond (26%) had positive things to say about the college. There were four subcategories of positive comments:
• Subcategory 1: Goal achievement Some students thanked the college for helping them achieve their educational goals. Students in this group had a variety of goals: preparing for transfer to a four-year university, completing one course or a few courses for a degree pursued at another institution, completing a class needed for teacher certification, or simply updating their skills.
• Subcategory 2: Encompassing positive experience
8
Some students declared explicitly that they had a positive experience at PGCC. In some cases, students praised the institution as a whole without providing further details. In other cases, students detailed specific aspects that they valued at the college, including their classes, the service received, the broad range of programs, and the flexible schedule.
• Subcategory 3: Positive experiences with faculty Some students emphasized their positive experiences with faculty. Students in this group thanked PGCC faculty for believing in them, for helping them achieve their educational and career goals, and for assisting them with specific course challenges and skills.
• Subcategory 4: No complaints Some students simply declared or implied that they had no complaints about their experience at PGCC. Students in this group used words such as “fine,” “OK,” and “fair” to characterize PGCC and/or their experience at the college. In some cases, students clarified that it was external reasons or personal problems, rather than something to do with the institution itself, which led to a temporary break in college attendance.
Main Category: Lack of College responsiveness Over a quarter of those who responded to the open-ended question (28%) were not satisfied with the level or the quality of support they received at the college. In some cases, students complained about the customer service received at the college. In others, students expressed a need for greater empathy, additional help, or stronger guidance as they negotiated the challenges of their academic and personal lives. There were four subcategories of comments about the lack of college responsiveness:
• Subcategory 1: Problems with academic advising Some students complained about their experience with academic advising. Students expressed dissatisfaction with what they perceived as unfriendly staff and long waits. They also complained about having received incorrect advice as well as inconsistent advice from different advisors. Finally, students regretted having received insufficient guidance, with negative consequences down the road.
• Subcategory 2: Problems with financial aid As it happened with academic advising, some students were dissatisfied with what they perceived as unfriendly staff and long waiting times in the financial aid office. Others complained about insufficient guidance regarding the application process, eligibility criteria, and funding opportunities. In addition, students complained about not having received proper notification regarding important requirements and deadlines. Finally,
9
students perceived a lack of empathy and leniency towards those facing difficult life circumstances.
• Subcategory 3: Problems with faculty Some students complained about their experiences with faculty. Students expressed dissatisfaction with what they perceived as a lack of connection between students and faculty. In their view, some faculty members knew the materials but did not know or did not care enough about their students. Students complained also about insufficient support and guidance with in-class learning and take-home assignments. Finally, some students who struggled with academic or personal problems expressed a need for greater empathy and understanding from instructors.
• Subcategory 4: General problems with college responsiveness Some respondents complained about poor customer service and inadequate support for students in specific areas outside of academic advising, financial aid, or the classroom. Others felt that the problems with college responsiveness were systemic and thus exceeded a particular group of people or a specific department.
Main Category: Lack of Course availability Almost 13% of those who responded to the open-ended question had suggestions and complaints about course availability. There were two subcategories of comments about course availability:
• Subcategory 1: Locations, times, days, and frequency For some students, it was a problem that classes were not available at specific locations, at specific times (especially in the evening), or on specific days to better fit their schedule. Other students expressed frustration at the fact that courses required for their programs were not offered regularly, which unnecessarily extended the time needed for completion. Students who expressed concerns about course availability often mentioned these problems in reference to upper-level courses or courses needed in the later stages of their programs.
• Subcategory 2: More online or hybrid courses Some students expressed an interest in greater availability of online or hybrid courses. It is important to note that within the whole group of comments about course availability, comments referring specifically to online or hybrid courses were in the minority.
10
Main Category: Affordability Close to 8% of those who responded to the open-ended question were concerned about college affordability and most of them expressed a need for greater financial assistance. In particular, students were interested in grants, scholarships, and work/study options. Some of these comments reflect a need for better information and guidance about available financial aid opportunities and the process of applying for grants and scholarships. Some students may not be aware of the competitive nature and stringent requirements often associated with the disbursal of grant funds.
Summary and next steps Since 2001, PGCC has surveyed non-returners, defined as those credit students who had attended classes in the Spring but did not re-enroll the following Fall. However, the College had approached the survey more as a mandatory reporting requirement than as an intentional effort to collect actionable data.
In 2011, OPAIR conducted an analysis of the typical student flow at PGCC as background research for that year’s Non-Returner Survey. This analysis showed that 5,000 to 6,000 students enrolled in the Spring typically leave the following Fall. Interventions which might retain even 10-20% of the 6,000 potential non-returners would result in a 4-8% increase in Fall enrollments. Furthermore, aiding students who are at risk of exiting across these two semesters would likely have an impact on completion rates as well.
In order to learn more about non-returners, OPAIR adopted a new methodology to conduct the 2011 Non-Returner Survey. The new methodology dramatically increased the response rate from the low single digits to 15.4%. Furthermore, the survey produced high-quality data as shown by the high proportion of students completing the survey and providing detailed comments in response to the open-ended question. The new methodology had the additional advantage of saving resources when compared to the traditional method of sending repeated mailings to a subset of non-returners.
By ensuring high student participation and engagement with the survey, the new methodology produced a wealth of information about non-returners’ experiences with academic and nonacademic services. In addition, the survey helped to identify major hurdles and constraints faced by these students, which could inform interventions to reduce the non-returner rate. The ensuing follow-up actions were proposed:
1. Focus on removing barriers in those areas identified by most students as “major reasons” for not returning, including assisting students in applying and staying eligible for financial aid, helping students experiencing lack of academic progress, and improving nonacademic services.
11
2. Improve internal communication and customer service to make the college more “responsive” to student issues and concerns.
3. Reach out to students before they leave. The Non-Returner Survey focuses on students who have already stopped attending the College, at least temporarily. As a complement, an “intervention survey” should be conducted in the Spring to identify those students who are considering not returning, connect them with College services, and remove barriers to their continued enrollment and success.
1
Title: Testing Differences: Contrasts in group perceptions of mission and identity
Presented: North East Association for Institutional Research (NEAIR) Annual Conference,
Bethesda, Maryland, November 3-6, 2012.
Authors: Ellen Boylan, Ph.D., Marywood University, Scranton, PA and Kim Pavlick, Ph.D., The
University of Scranton
Introduction
Effective assessment of perceptions of stakeholders about college mission and identity
provides insight into whether an institution’s vision and purpose are being realized. Perceptions
of staff, students, and faculty of their university can influence how fully each group engages in
their community (Ferrari and Velcoff, 2004). This research addresses the need to go beyond the
frequently-studied student population and measure faculty and staff groups on their
perceptions of an institution’s effectiveness in achieving overarching goals. This is especially
important since it is those individuals who realize the seemingly esoteric goals of the institution
in the practical contexts of their work on campus.
The purpose of this research is to measure the perceptions of institutional mission of
two groups, staff and faculty, at two universities and assess performance based on individual
results and by a comparison of outcomes by institution and by demographic characteristics. The
research is described in two phases. The first covers the research design and administration of
the instrument, data collection, and preliminary analysis of results. That work was previously
presented in a Workshare session at the North East Association of Institutional Research
(NEAIR) Conference 2011. The second phase consists of additional analysis of data and a
discussion of results and implications.
2
The research is in part framed by the theory of the two-step flow of communication
(Katz & Lazarsfeld, 1955). It examines whether the mission and identity of the institution is
being communicated adequately by leadership to constituents by virtue of the goals and
programs the institution pursues and whether that is discernible in data obtained on relevant
perceptions of staff and faculty. Results reported here help to illuminate how opinion leaders
influence reception of the message of mission and identity by audiences of staff of faculty and
what existing or proposed programming is perceived as supporting mission and identity.
Figure 1: Reimagined Two-Step Flow Model for the purposes of the current research
This research is also informed by Engagement Theory (Kuh, G.D., Pace, C.R. & Vesper, N,
1997). Findings from research on student engagement suggest that what an institution is, its
profile, matters less than what it does, for example, in instruction, programming and campus
interactions. Engagement theory holds true for faculty and staff, as well, in that their
perceptions of mission and identity are influenced not just by static words or published
3
assertions, but by the active commitment and initiative they observe in the surrounding
university environment.
Mission statements of institutions often include similar purposes and constructs, but the
interpretation and practical applications by campus are unique and affect groups differently.
Therefore, it can be expected that not all campus constituencies will share the same
perceptions of purpose and identity, so this research intends to elucidate whether and to what
extent differences by group do exist. There has been previous research using the DMV
Inventory with a student sample at a single institution (Ferrari et al., 2009), but this is the first
study to conduct a quantitative assessment of faculty and staff perceptions of mission at two
different religiously-affiliated universities in eastern United States.
This quantitative research involved data collection on perceptions of mission and
identity of staff and faculty at two private, religiously-affiliated postsecondary institutions and
subsequent analysis of results by institution and between institutions. Data was obtained by
administering the DePaul Mission and Values Inventory (DMV) to the two groups. Analysis of
results lends perspective to understanding current perceptions within institutions and the
extent and nature of differences between groups and institutions. The discussion sheds light on
the impact of institutional initiatives around mission and identity on perceptions of constituents
and aids our understanding of how community cohesiveness on campus relative to goals might
be enriched.
Background
Content analysis of mission statements by Abelman & Dalessandro (2009) reveals similar
themes across many institutions, as well as the consistent use of what the researchers call
4
“visionary” terminology. Despite similarities, a variety of approaches, both strategic and
programmatic, are taken by institutions to carry out mission imperatives. In the same way,
even though many characteristics and goal statements of identity and mission at the
institutions in this study are similar, this research investigates whether differences exist in
perceptions of their separate constituencies. Consider the finding of Borne et al. (2000) that
institutions that clearly articulate their missions are more effective at strategic planning. If so,
the appearance in this research of differences in perceptions between the institutions may
perhaps be accounted for by programs and activities related to strategic plans, which are
essentially derived from institutional mission statements.
Research suggests that maintaining identity can be positive for an institution of higher
education (Estanek, James & Norton, 2006). A longitudinal study of 824 private colleges from
1975 to the present found that religious colleges are more likely to survive than secular
institutions (Porter and Ramirez, 2009). Administrators are taking notice. For example, at the
2009 conference of the Association of Catholic Colleges and Universities (ACCU), the focus of
presidents gathered there was on two issues they believe most important to their institutions
today: the United States economy and its impact on students and the Catholic identities of their
institutions (Ziegler, 2009). Thus, administrators of Catholic institutions understand the
importance of communicating and sustaining the mission and identities of the institutions they
serve.
Morphew and Hartley (2006) point out that mission, regardless of an institution’s
affiliation, helps distinguish institutional imperatives and has the capacity to inspire and
5
motivate those within to communicate its characteristics, values and history to key external
constituents. “Ultimately, the life force of any institution is its mission” (Scott, 2006).
Estanek, James, and Norton (2006) said the optimum way to assess mission and identity
in higher education is “best grounded in the mission of the individual institutions” (p. 205).
Mission statements from a host of colleges across the nation were examined using content
analysis. It was concluded that, since mission statements firmly convey the goals and objectives
of a postsecondary institution, they could appropriately be employed as bases for assessing the
presence of mission and identity within the community and programs of institutions. Prior
research recommends that institutions communicate mission via administrative operations,
student services, academic programs and student services (Ferrari and Cowman, 2004).
One instrument being used to study mission and identity is the Mission and Values
Inventory, which was developed by researchers at DePaul University in Chicago. Initially, Ferrari
and Velcoff (2006) surveyed more than five hundred staff members there and found the
majority of those surveyed understood DePaul’s mission, Catholic values, and mission-driven
activities. Results also indicated that the majority of staff members surveyed believed that
institutional mission is conveyed throughout the institution via the administration, academics,
policies, and student services (Ferrari and Velcoff, 2006).
Assumptions and Limitations
It is assumed that the DMV Inventory is an effective tool for obtaining reliable data on
faculty and staff perceptions of mission and identity at postsecondary institutions. It is further
assumed that employing a subset of mission and identity-focused questions from the DMV and
not the entire inventory will nonetheless generate sound results adequate to the purposes of
6
this research. It should be noted that a limitation of the DMV is that some items pose two
questions in one statement. Despite many similarities in the institutional characteristics and
mission statements of the colleges involved in the study, it is assumed that some differences in
group perceptions do exist and are discernible using the methodology proposed.
This research is limited to a sample of two postsecondary institutions. Each institution is
religiously-affiliated, although with different orders of religious. Survey participants were
limited to faculty and staff at the institutions, so no comparative student data was obtained.
Additionally, the medium of communication to prospective respondents was limited at one
university to a single email message distribution to faculty and staff and did not allow for
distribution of any follow-up or reminder message. The survey administration was electronic,
only, limiting the survey distribution to only those with ready access to a computer.
Importance
This research contributes to scholarship in the areas of institutional mission
effectiveness, strategic planning, program assessment and engagement. Assessing perceptions
of mission and identity by these groups can give evidence to affirm or discount the assertions
by Borne et.al (2000) that institutions clearly articulating their missions are more effective at
strategic planning and at planning for growth and enhancement of the institution (Amis et.al,
2000, Detomasi, 1995).
The study yields data on staff and faculty groups from institutions in the eastern region
of the nation. Previously, only institutions in the Midwest had been investigated using portions
of this instrument. Additionally, results of this research are able to inform accreditation and
strategic planning reporting needs of the institutions in the study in new ways by providing
7
Procedure
Select two “like” institutions for the study populations mission statements
All part-time and full-time members of the staff and faculty (n=2,021) at both
institutions were invited to participate in the study via an email invitation containing a web link
to the survey, available on the Survey Monkey platform. The survey requested that
respondents rank the 16 mission and identity-related items according to a 7-point Likert scale
ranging from strongly agree to strongly disagree. Mean scores were produced by item. Artificial
constructs were created on an a priori basis to allow comparison of construct means by
institutions and groups using more robust factor scores.
Participants
The survey population consisted of all full-time and part-time employees of University A
(n = 870) and University B (n = 1,151). There were 364 respondents to the survey, signifying an
18 percent response rate overall. The distribution of the 364 respondents by institution is
University A, n = 206 (24 percent) and University B, n = 158 (14 percent).
Data
Prior to performing frequency analysis, data were reverse coded on responses according
to the DMV Inventory scale of 1=strongly agree, 7=strongly disagree to 1=strongly disagree to
7=strongly agree. This would parallel our cultural inclination to perceive higher scores as
“strong” and lower ones, “weak.” Therefore, results showing higher means by item would
indicate better performance relative to lower means. Frequency analysis indicated that the
distribution of respondents by position at both institutions was 54 percent staff and 44 percent
faculty, with 2 percent unknown. Employment status of respondents is 86 percent full-time and
14 percent part-time. By gender, 69 percent of respondents are female and 31 percent are
male. Just 3 percent of respondents are non-Caucasian
9
Table 1: Demographic characteristics by institution
Analysis and Results
In the first phase of analysis for this research, tests were conducted to explore
differences between mean scores by item. Also, factor analysis was performed on the data and
no resulting constructs were observed. However, artificial “theme constructs” were created on
an a priori basis by the researchers by assembling questions into three theme areas: Mission
Perception, Identity Perception and Programs. The intent was to allow for more robust analysis
by using “theme construct” means that had been created from the aggregated results from the
several items comprising each of the Mission Perception (Table 1), Identity Perception, and
Programs theme areas. Mean scores for theme constructs by institution and position were also
produced (Table 1b).
10
Table 1: “Mission perception” means by position and institution
Item Faculty Staff All
A B A B A B
I believe that (institution)… -is innovative. 5.14 4.97 5.30 5.11 5.23 5.04
- is inclusive. 5.81 5.24 6.10 5.22 5.96 5.23
- takes risks that are consistent with its mission and values 5.17 4.63 5.41 4.85 5.32 4.75 - is pragmatic, grounding education in the realities of everyday life. 5.67 5.43 5.68 5.40 5.69 5.44
-mission and values are visible to all. 5.90 5.47 5.84 5.45 5.89 5.48
I support… 5.51 5.21 6.00 5.16 5.80 5.19 -our current approach to fostering leadership potential of individuals.
Table 1b: Comparison of “Mission Perception” means by institution
A (n=187)
B (n=145)
All (n=332)
5.66 5.19 5.45*
*p<.01
In a second phase of analysis for this research, tests were performed to investigate
differences between subject groups using an ANOVA statistic. According to Ploutz-Snyder
(2005), “one can apply the ANOVA statistic to answer fairly complex questions about
differences between and within groups, over time and across multiple conditions.”
Mean scores were determined for each DMV item for all responses, as well as by
institution (Table 2), institution by gender, and institution by gender and position (faculty
versus staff). The ANOVA test was performed using DMV item mean scores as dependent
variables and “institution,” “gender” and “position” as independent variables. The data indicate
that faculty and staff share strong agreement that their institutions are inclusive and foster
leadership potential. Additionally, faculty and staff strongly agree that the heritage of their
institutions is evident and that a variety of services from campus ministries are offered.
11
Significant differences are seen in male and female perceptions of mission and identity, and
there are significant differences between part-time and full-time employees on perceptions of
inclusiveness.
Table 2: Item means by institution
The data show agreement between female and male respondents on perceptions of an
atmosphere of respect, fostering leadership, and promoting connectedness to a global
community. However, females perceive greater inclusiveness, caring, and availability of
campus ministry services, while males perceive risk-taking is consistent with the mission and
agree more strongly that the mission is visible to all. Not surprisingly, results indicate that part-
time staff members are significantly different in their perception of inclusiveness of the
community.
A(N=208)
7 Atmosphere that fosters mutual understanding and respect 5.89 5.30 ***
8 Care for each community member 6.03 5.55 ***
9 Innovation and pursuit of new and effective approaches 5.23 5.01
10 Inclusive: provide access for all 5.96 5.21 ***
11 Risks consistent with mission and values 5.32 4.71 ***
12 Pragmatic: grounded in realities of everyday life 5.69 5.42
13 Mission and values are visible to all 5.89 5.46 **
14 Religious heritage remains relevent 6.03 5.82
15 Support institution's approach to expressing identity 5.83 5.38 ***
16 Fostering leadership potential of individuals 5.80 5.17 ***
17 Freely examine religious and secular value systems 5.58 5.28 *
explore the relative differences in emphasis on individual constructs in the texts of the
institutions' mission statements and linked conceptually to the quantitative results obtained
here so deeper understanding of the dynamics at work at each place can be understood. The
quantitative results can be used to assess how strongly faculty and staff perceive the
communication of mission on campus and which areas need to be strengthened. Comparison of
these results can also be made with available data on student perceptions from engagement
studies like the National Survey of Student Engagement (NSSE) and the Higher Education
Research Cooperative (HERI) College Student Beliefs and Values study conducted in 2004, to
observe how employees groups compared to student groups on their perception of constructs.
Another compelling investigation would be a comparison of results by institutions in different
regions of the country, since data from both eastern and mid-western schools is available.
Results can also inform policy and programming recommendations made to leaders of member
schools by the Catholic Higher Education Research Cooperative (CHERC) and the Association of
Catholic Colleges and Universities (ACCU).
A worthy endeavor of the leadership of any college or university is to affirm in context
and programs the presence of a strong and current mission statement and sense of identity.
Responding actively to outcomes of research on campus perceptions of the environment will
foster stronger affiliation with mission and identity and bring together the campus community
in fruitful action that creates a rich and positive place of work and learning for all.
Author Biography: Ellen Boylan, Ph.D., is Director of Planning and Institutional Research at
Marywood University, Scranton, Pennsylvania. Kim Pavlick, Ph.D., is Assistant Professor of
Communication at the University of Scranton, Scranton, Pennsylvania.
15
References Amis, J., Slack, T., Hinings, C.R. (2002). Values and organizational change. The Journal of Applied
Behavioral Science,38,436-465. Doi:10.1177/002188602237791. Bourne, B., Gates, L., Cofer, J. (2000). Setting strategic directions using critical success factors.
Planning for Higher Education, 28, 10-18. Detomasi, D. (1995). Mission statements: One more time. Planning for Higher Education, 24,
31-35. Dwyer, J. & Zech, C. (1998). American Catholic higher education: An ACCU study on mission and
identity, faculty development, and curricular revision. Current Issues in Higher Education, 19 (1), 3-32.
Estanek, S. James, M. & Norton, D. (2006). Assessing Catholic Identity: A study of mission statements of Catholic colleges and universities. Catholic Education: A Journal of Inquiry and Practice, 10 (2), 199-216.
Feldner, S. N (2006). Living our mission: A study of university mission building. Communication Studies, 57 (1), 67-85. doi:1199313561
Ferrari, J.R., Cowman, S., Milner, L., Gutierrez, R., & Drake, P. (2009). Impact of school sense of Community within a faith-based university: Administrative and academic staff perceptions on institutional mission and values. Social Psychology of Education,12, 515- 528. doi: 10.1007/s11218-009-9093-3
Ferrari, J.R. & Guitierrez, R. E. (2010). Passing the torch: Maintaining faith-based traditions during transition of leadership. Education, 131, 64-72.
Ferrari, J.R., McCarthy, B.J., & Milner, L.A.(2009). Involved and focused? Students’ perceptions of the institutional identity, personal goal orientation, and levels of campus engagement. College Student Journal, 44, 886-896.
Ferrari, J. & Velcoff, J. (2006). Measuring staff perceptions of university identity and activities: The mission and values inventory. Christian Higher Education. Retrieved www.informaworld.com/index/759221666.pdf
Gallin, A. (2001). Negotiating identity: Catholic higher education since 1960. Notre Dame, IN: University of Notre Dame Press.
Hellwig, M.K. (2004). Evaluating the mission and identity of a Catholic college or university. In Association of Governing Boards of Universities and Colleges, Association of Jesuit Colleges and Universities, and Association of Catholic Colleges and Universities, Mission and identity: A handbook for trustees of Catholic colleges and universities (pp. 45-52). Washington, DC: Author.
Higher Education Research Institute (HERI). Spirituality in higher education: A national survey of college students’ search for meaning and purpose. Retrieved http://spirituality.ucla.edu/
Inside Higher Education (2009). Spiritual accountability. Retrieved from http://www.insidehighered.com/layout/set/pri...assessment/01/02/2007/News Katz, E. & Lazarsfeld, P. (1955). Personal Influence. New York: The Free Press. Kuh, G.D., Pace, C.R. & Vesper, N. (1997). The development of process indicators to estimate
student gains associated with good practices in higher education. Research in Higher Education, 38: 435-454.
Morphew, C. & Hartley, M. (2006). Mission statements: A thematic analysis of rhetoric across institutional type. The Journal of Higher Education, 77 (3), 456-461. doi:10.1353/jhe.2006.0025
National Survey of Student Engagement. NSSE Findings. Retrieved http://nsse.iub.edu/html/reports.cfm. Peck, K. & Stick, S. (2008). Catholic and Jesuit identity in higher education. Christian Higher
Education, 7 (3), 200-225. doi:10.1080/15363750701818394 Ploutz-Snyder (2005). Analysis of variance applications in institutional research. In Coughlin,
M.A. (Ed.), Applications of Intermediate/Advanced Statistics in Institutional Research, The Association for Institutional Research (16), 51-88.
Porter, S. & Ramirez, T. (2009). Survival of the wealthiest. Inside Higher Education. Retrieved from http://www.insidehighered.com/layout/set/print/news/2009/04/17/closing. Scott, J.C. (January/February 2006). The Journal of Higher Education, 77 (1), 1-39. http://www.jstor.org/stable/pdfplus/3838730.pdf?acceptTC=true
Stripling, J. (November 17, 2010). The Catholicity Test. Retrieved from Inside Higher Education. http://www.insidehighered.com/layout/set/print/news/2010/11/17/catholic
Ziegler, J. (2009, February 27). Economic crisis, Catholic identity are top concerns of college presidents. The National Catholic Register. Retrieved from http://www.ncregister.com//site/print_article/17443.
APPENDIX A DePaul Mission and Values (DMV) Inventory
Institution Identity Scale
Please rate the items below according to this scale: 1=strongly disagree to 7=strongly agree 1. I believe that at _______ our very diverse personal values and religious beliefs contribute to
an atmosphere that fosters mutual understanding and respect. 2. I believe that we manifest personalism by our care for each member of the university
community. 3. I believe that _______ University is innovative. We are never content with maintaining a
"business as usual" approach. Our efforts are marked by innovation and single-minded pursuit of new and effective approaches to meet the needs of our students, society and the educational marketplace.
4. I believe that _______ University is inclusive. We provide access for all to higher education regardless of class, race, religion, sexual orientation, disability, ethnicity or economic barriers. The university community is welcoming and draws great strength from its diversities.
5. I believe that _______ University takes risks that are consistent with its mission and values. Historically the university has always stepped outside of tradition and beyond "status quo" approaches, encouraging and demonstrating an adventurous and entrepreneurial spirit. The measure of our success has always been the measure of our risks.
6. I believe that _______University is pragmatic grounding its education in the realities of everyday life. Through its curricula and through the delivery of its programs and services, the university offers students practical solutions to their needs for higher education, career advancement and personal growth.
7. I believe that _______ University's mission and values are visible to all. Its education and operations are grounded in values of service, respect, justice, holistic education and creating quality educational opportunities especially for the underserved and disadvantage in our society.
8. I believe that our religious heritage remains relevant to the university today. 9. I support our current approach to expressing its identity. 10. I support our current approach to expressing its fostering the leadership potential of
individuals. 11. I believe that our university invites all inquirers to freely examine Catholicism, other faith
traditions and other secular values systems in light of their respective contributions to the human enterprise.
12. I believe that the curricula at our schools and colleges have appropriate expressions of the university's Catholic identity.
13. I support my institution’s current approach to expressing its Catholic identity. 14. Campus Ministry provides a variety of services and programs designed to serve the
University community and enhance the institution's Catholic identity. 15. The University sponsors a variety services and programs to demonstrate the connectedness
to the global community.
18
APPENDIX B Demographic Items
USING INTERNAL MARKET RATIOS
TO DETECT GENDER DIFFERENCES IN FACULTY SALARIES
Chunmei Yao, Ed. D.
Associate Director of Institutional Research
Office of Institutional Assessment & Effectiveness
SUNY College at Oneonta
Discipline and market are two related factors that are frequently used in the evaluation of
faculty salary equity at colleges and universities (Balzer, et al., 1996; Haignere, 2002; Luna,
2007; Moore, 1992). Although it is assumed that the variation of market factors should be
responsible for explaining differences in faculty salaries, this assumption has not been tested yet
(Bellas, 1994). In general, salary differences across disciplines are considered as market neutral
by AAUP and CUPA (Bellas, 1997; Haignere, 2002). The observed differences in faculty
salaries at large are not considered a result of gender discrimination, but rather the effect of
market factors; specifically, the supply of qualified faculty relative to the demand for their work
and service by employers (Bellas, 1997; Semelroth, 1978; Waldauer, 1984).
For decades, market factors have had great impact on differentiation of faculty salaries
across disciplines at colleges and universities. Since the 1980s, differences in faculty salaries
across disciplines have increased, especially in disciplines related to Business/Economics and
Engineering. According to the Annual Report on the Economic Status of the Profession
published by AAUP (1980-2010), using assistant professors and the discipline of English as
reference groups, the proportions of average salaries in Education, Fine Arts, Foreign Languages,
Communications, and Philosophy have decreased since 1980-81 (Figure 1). However, the
proportion of average salaries in Business and Economics related programs has increased from
Faculty Salary Study 1
124% in 1980-81 to 187% in 2009-10, representing a 51 percent increase over the time. As a
result, faculty who have taught in fields with lower market values have suffered “pay penalty.”
These observed differences cannot be totally explained by variances in individual characteristics
(e.g., gender, race, and highest degree), professional maturity (e.g., rank and years of experience),
and performance.
Figure 1: Percentage of Salary Change by Discipline (1980-81 vs. 2009-10)
Bellas (1994) points out that in higher education, the unequal job opportunities between
male and female faculty at the entry-level position have continued, resulting in more female
faculty concentrated in disciplines with relatively lower market values, such as English, Foreign
Languages, Education, and Fine Arts (Barbezat, 1991; Braskmp, Muffo, & Langston, 1978;
Exhibitors and Posters on display for informal viewing - Crystal Ballroom Level
Your Third Place - Conference Registration and Internet Café - Crystal Ballroom Level
Your Third Place - Crystal Ballroom Level
Saturday Evening Dinner Groups (Meet at the Concours Terrace)
M O N D A Y November 5, 2012
8:00 am - 7:00 pm
7:30 am - 8:45 am
8:00 am - 8:45 amPenn State’s Graduate Certificate
in Institutional Research(Loomis)
The Delaware Study and Out-of-Classroom Faculty Activity Study
(Walters)
Greater Philadelphia Assoc. for Institutional Research
(GPHLAIR)(May)
SUNY Association for Institutional Research and Planning Officers (AIRPO)
(Karp, Szelest)
Meeting Federal Disclosure Requirements
(Hammond, Finkle - U.S. Department of Education)
Higher Education Data Sharing (HEDS) Consortium
(Blaich)
U.S. News Rankings & Update(Morse)
Using Tk20’s Assessment System to Optimize Outcomes
Assessment: Case Studies(Rogers, Carroll, Levy)
9:00 am - 10:15 am
10:15 am - 10:45 am
Susquehanna/Severn Potomac/Patuxet Diplomat Ambassador Cabinet Judiciary Congressional Old Georgetown Embassy
10:45 am - 11:30 am
Expanding the Role of IR – Practices in Financial Aid
Reporting (Beads, Gillespie)
Creating a Longitudinal Data File to Study Faculty Careers
(Deutsch, Iglesias, Finkelstein)
Case Study: Transfer Success from 2-Year to Regional Center(Muntz, Lang, Mund, Nadasen,
Bell, Appel)
Creating a Campus Climate Surveythat Fits Your Institution's Values
(Turrentine)
An Examination of Tuition Discounting Before/During the
Great Recession (Duggan, Mathews)
Into the Void: What Happens to Our Reports?
(Sharkenss, Butler, Terkla)
Inventing a New Wheel: Assembling a Campus-Wide
Doctoral Program Review(Filep, Blaustein)
Are Students Dropping Out or Dragging Out the College
Experience?(Stratton, Wetzel)
Demonstration of Blue Software for the Automation of Surveys
and Course Evaluations by eXplorance
(Bedard)
11:45 am - 1:15 pm
1:30 pm - 2:15 pm
Persistence Puzzles' Missing Pieces: Non-Cognitive Data from
ePortfolios(Easterling)
Using Internal Market Ratios to Detect Gender Differences in
Faculty Salaries(Yao)Paper
Developing Community College Peer Institutions: Methods,
Measures, & Issues(Musial-Demurat, Szelest)
Paper
Using Sipina (Free Software) to Reduce the Number of Variables
Considered (Welsh)Screenshots
IPEDS Update(Bell, Lenihan)
The Future of Student Learning Outcomes in the VSA
(Keller, Hinds)
Developing an Internal Survey Protocol
(Flanders)
How Less Selective, Four-year Institutions Responded to the
Great Recession(Duggan, Piteros)
BINGO, Business Intelligence In Great Organizations, BI Speed
Learning in 10 Minute Increments
(Rouse)
2:30 pm - 3:15 pm
Visualizing the News: Bringing Environmental Scanning into the
21st Century(Ashton)
Maximizing the Utility of Alumni Feedback
(Tammaro)
Finding Ways to Help Students Succeed in Calculus at a STEM
Institution(Mahoney, Yang, Piper)
Putting Data First: Expanding IR Data Accessibility Using Online
Tools(Butler)
The “Trial” of Triangulation: Measuring Curricular Change
Effectiveness(Stassen)
Got Transfer Students? What About Them?
(McDonnell, Kamal, King)
An Examination of the Students Who Left After First Year
(Gao)
NCES Projection Methodology: Institutional Research
Applications(Robles)
Four Years of Predictive Modeling and Lessons Learned
(Johnson, Crawford)
3:15 pm - 3:45 pm
3:45 pm - 4:30 pm
Mapping the Pipeline: Changing Demographics and Enrollment
Impacts(Randall, Abbey)
Examining the Threat of Nonresponse Bias as a Follow-up
to the NSSE(Allen, Coladarci)
Paper
Application of Student Success Data to Decision Making and
Resource Allocation(Doherty)
A Novice Approach to Report Creation using VBA and Excel
Macros(Clements)
Measuring Student Engagement Through a Longitudinal Study
(Brodigan)
Strategies for Improving Retention and Student Success(Laguilles, Coughlin, Uerling,
Hamler, Fink)
Sharing Data on Campus: Creation of a University
Factsheet(Sisco)
Engaging the Campus in Outcomes Assessment:
Techniques and Best Practices(Rogers)
Discover a Comprehensive Approach to Institutional
Effectiveness with Campus Labs(VanZile-Tamsen, Weisman)
4:45 pm - 5:30 pm
5:30 pm - 6:30 pm
6:30 pm
Color Coding Contributed Paper Workshare Techshare SIG Focus Group - By Invitation Only table topics NEAIR Member & Exhibitor Presentation
2-yearInstitution Interest
KEYNOTE ADDRESS: David Bergeron (U.S. Department of Education)Lessons the Data Teach Us
Crystal Ballroom
Monday Evening Dinner Groups (Sign-up at Conference Registration located in the Crystal Ballroom Foyer, Meet in Lobby/Concours Terrace)
Data With a Twist Keynote: Catherine Plaisant (University of Maryland) Information Visualization: from Data to Insight
Crystal Ballroom
Data With a Twist Reception - Includes Formal Poster Session - Crystal Ballroom Level(Presenters will be available from 5:30pm - 6:30 pm; Best Visual Display Award will be presented at 6:00 pm)
Dessert/Coffee Break - Crystal Ballroom
Luncheon and Business Meeting - Crystal Ballroom
Coffee Break - Crystal Ballroom Level
Continental Breakfast - Crystal Ballroom
Your Third Place - Conference Registration, Exhibitors, Internet Café, and Posters on display for informal viewing - Crystal Ballroom Level
NOTE: SIGS will be held in the breakout rooms below, Table Topics will meet at designated tables in the Crystal Ballroom during breakfast. Please eat breakfast prior to joining a SIG.
Coffee Break - Crystal Ballroom
CLOSING PLENARY -Tina Leimer (Reshaping IR listserv, Ashford University) Visualizing the Future of Institutional Research
Crystal Ballroom
Your Third Place - Conference Registration, Exhibitors, and Internet Café - Crystal Ballroom Level