35
Time- predictability of a computer system Master project in progress By Wouter van der Put
| Date post: | 22-Dec-2015 |
| Category: |
Documents |
| View: | 216 times |
| Download: | 0 times |

Time-predictabilityof a computer system
Master project in progress
By Wouter van der Put

2
How long does it take?
Reading memory
0
10
20
30
40
50
60
70
80
90
100
10 12 14 16 18 20 22 24 26
Runtime [s]
Fre
qu
en
cy
Core 1 & 1
Core 1 & 2
Core 1 & 8
3
Goal
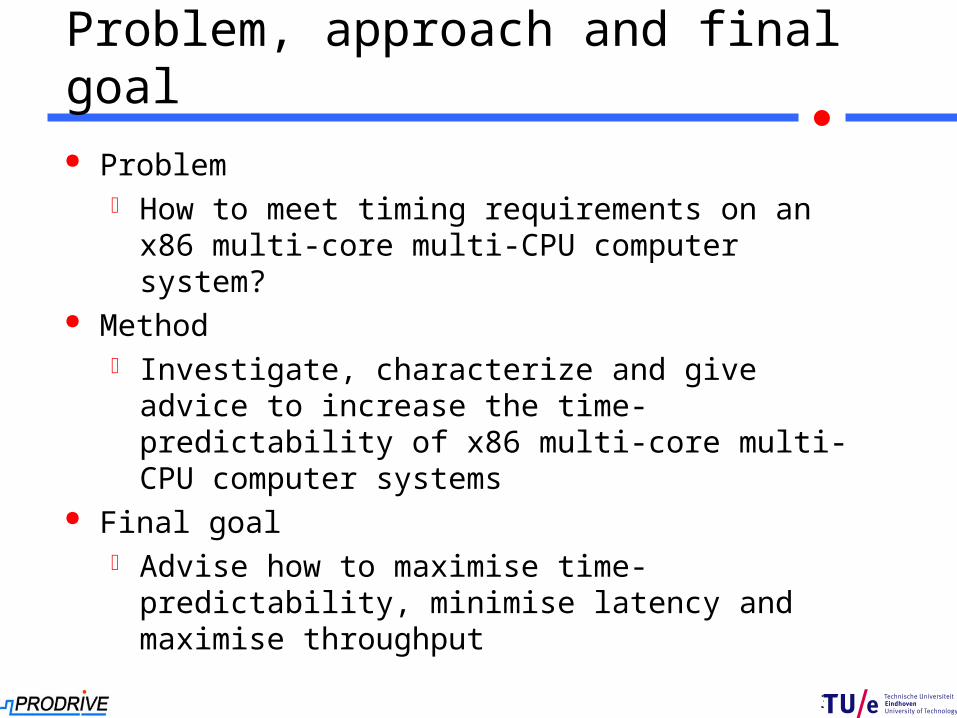
Problem, approach and final goal Problem
How to meet timing requirements on an x86 multi-core multi-CPU computer system?
Method Investigate, characterize and give advice to
increase the time-predictability of x86 multi-core multi-CPU computer systems
Final goal Advise how to maximise time-predictability,
minimise latency and maximise throughput

4
Overview
Time-predictability Influenced by (bottom-up approach)
Hardware– Processor (architecture)– Memory (hierarchy)– System architecture (motherboard)
Software– Operating System (scheduling)– Algorithms and their data (regularity)
Approach Theory: Explore (CPU) architectures Practice: Perform measurements Conclusion
Focus on contemporary architecture Quad-core dual-CPU Intel Nehalem server
(next slide)

5
Time-predictability
White = observed
Black = reality

6
Overview
Nehalem/Tylersburg architecture
QPI
DDR3
DDR3
DDR3
DDR3
DDR3
DDR3
ICH10R
2x2
ESI
2x16
8x4
4x8
1x4
Tylersburg 36DIOH
QPI QPI
Nehalem-EP Nehalem-EP
PCIe

7
Overview
Processor
QPI
DDR3
DDR3
DDR3
DDR3
DDR3
DDR3
ICH10R
2x2
ESI
2x16
8x4
4x8
1x4
Tylersburg 36DIOH
QPI QPI
Nehalem-EP Nehalem-EP
PCIe

8
Processor
Theory – Time-predictability Designed to improve average case latency
Memory access– Caches: reduce average access time
Hazards– Prediction: reduce average impact
Complexity increases Time-predictability almost impossible to describe Instruction Set Architecture expands (next slide)

9
Processor
Theory – Historical overview

10
Processor
Theory – Nehalem architecture In novel processors
Core i7 & Xeon 5500s 3 cache levels 2 TLB levels 2 branch predictors Out-of-Order execution Simultaneous Multithreading Loop stream decoder Dynamic frequency scaling

11
Processor
Theory – Nehalem pipeline (1/2)
Instruction Fetch and PreDecode
Instruction Queue
Decode
Rename/Alloc
Retirement unit(Re-Order Buffer)
Scheduler
EXE Unit Cluster 0
EXE Unit Cluster 1
EXE Unit Cluster 5
Load Store
L1D Cache and DTLB
L2 Cache
Inclusive L3 Cache by all cores
Micro-code ROM
QPI

12
Processor
Theory – Nehalem pipeline (2/2)
13
Processor
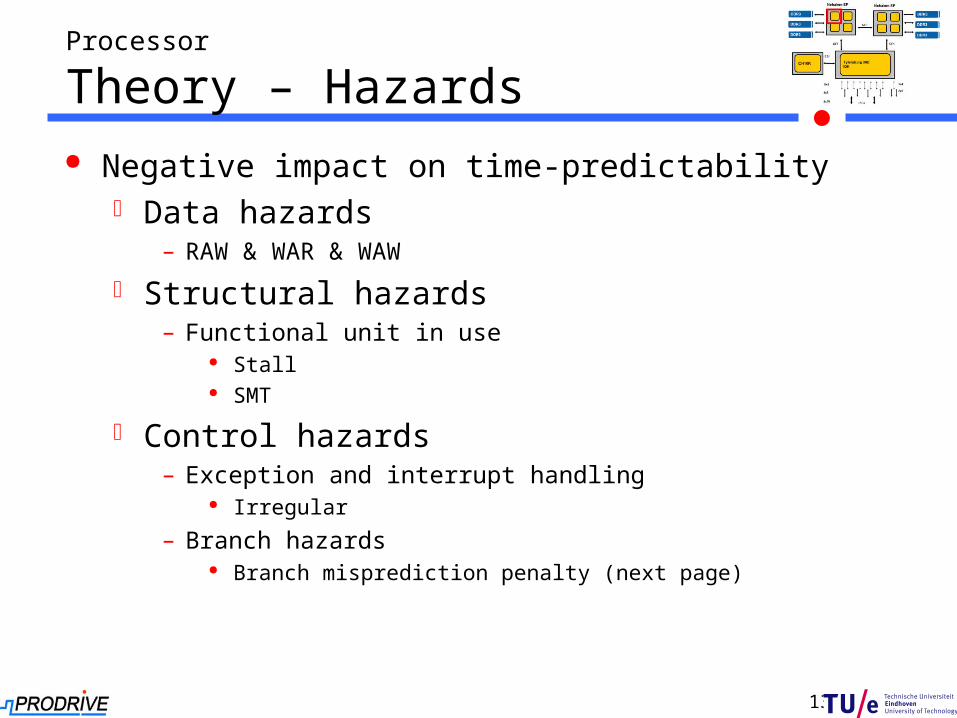
Theory – Hazards Negative impact on time-predictability
Data hazards– RAW & WAR & WAW
Structural hazards– Functional unit in use
Stall SMT
Control hazards– Exception and interrupt handling
Irregular
– Branch hazards Branch misprediction penalty (next page)

14
Processor
Practice – Branch prediction
for (a=0;a<99999999;a++)
{
if random<BranchPoint
DoSomething;
else
DoSomething;
}
//BranchPoint=0%...100%10,0
10,5
11,0
11,5
12,0
12,5
13,0
13,5
14,0
14,5
0% 20% 40% 60% 80% 100%
Branch probability
Ru
ntim
e [s
]
Lower latency by max 30%

15
Processor
Conclusion Branch prediction
Make your branches predictable– Lower latency by max 30%
If input-dependent– Decreases time-predictability
Other features increase throughput,but decrease time-predictability Out-of-Order execution Simultaneous Multithreading Loop stream decoder Dynamic frequency scaling

16
Overview
Memory hierarchy
QPI
DDR3
DDR3
DDR3
DDR3
DDR3
DDR3
ICH10R
2x2
ESI
2x16
8x4
4x8
1x4
Tylersburg 36DIOH
QPI QPI
Nehalem-EP Nehalem-EP
PCIe

17
Memory hierarchy
Theory – Overview (1/2)
Level Capacity Associativity (ways)
Line Size (bytes)
Access Latency (clocks)
Access Throughput (clocks)
Write Update Policy
L1D 4 x 32 KiB 8 64 4 1 Writeback
L1I 4 x 32 KiB 4 N/A N/A N/A N/A
L2U 4 x 256 KiB 8 64 10 Varies Writeback
L3U 1 x 8 MiB 16 64 35-40 Varies Writeback
Core
L1D L1I
L2U
Core
L1D L1I
L2U
Core
L1D L1I
L2U
Core
L1D L1I
L2U
L3U
Memory controller QPI QPI
Core
L1D L1I
L2U
Core
L1D L1I
L2U
Core
L1D L1I
L2U
Core
L1D L1I
L2U
L3U
Memory controllerQPI QPIQPI
Main memory
DD
R3
Main memory
DD
R3
IOH

18
Memory hierarchy
Theory – Overview (2/2)
Hit rate Access time
L1$ 95% 4,000 clock cycles
L2$ 95% 10,000 clock cycles
L3$ 95% 40,000 clock cycles
Mem 100,000 clock cycles
Minimum 4,000 clock cycles
Average 4,383 clock cycles
Maximum 100,000 clock cycles
Goal Minimise average latency
Result Program (and input)
influences hit rate and thus average latency
Input may influence time-predictability

19
Negative impact on time-predictability Locality of reference
– Temporal locality
– Spatial locality Sequential locality Equidistant locality Branch locality
Write policy– Write-through (Latency: Write = 1, Read = 1)
– Write-back (Latency: Write = 0, Read = 2)
Memory hierarchy
Theory – Caches (1/2)

20
Memory hierarchy
Theory – Caches (2/2) Negative impact on time-predictability
Cache types– Instruction cache
– Data cache
– Translation Lookaside Buffer (TLB)
(Non-)Blocking caches Replacement policy
– Fully associative
– N-way set associative
– Direct mapped (1-way associative)

21
Memory hierarchy
Practice – Method
.codestart:mov eax, alloc(1073741824)mov ecx, 0loopy:mov ebx, [eax+911191543]mov ebx, [eax+343523495]... (100,000x)mov ebx, [eax+261645419]mov ebx, [eax+275857221]inc ecxcmp ecx, 80000000jnz loopyfree eaxexitend start
Assembly: no compiler
Begin
Allocate variable number of bytes
For ecx = 0 to BIG_NUMBER (run 10s)
Read random data from array... (100,000x)Read random data from array
Next ecx
Free memory
End

22
Memory hierarchy
Practice – Results (1/3)
-
0,200
0,400
0,600
0,800
1,000
1,200
1,400
1,600
1,800
2,000
1,0E+03 1,0E+04 1,0E+05 1,0E+06 1,0E+07 1,0E+08 1,0E+09 1,0E+10
Memory size
L1 Data Cache Miss Rate L2 Cache Miss Rate

23
Memory hierarchy
Practice – Results (2/3)
0,00%
20,00%
40,00%
60,00%
80,00%
100,00%
120,00%
140,00%
1,0E+03 1,0E+04 1,0E+05 1,0E+06 1,0E+07 1,0E+08 1,0E+09 1,0E+10
Memory size
L1 Data Cache Miss Performance Impact Bus Utilization TLB miss penalty

24
Memory hierarchy
Practice – Results (3/3)
-
20,000
40,000
60,000
80,000
100,000
120,000
1,0E+03 1,0E+04 1,0E+05 1,0E+06 1,0E+07 1,0E+08 1,0E+09 1,0E+10
Memory size
Clocks per Instructions Retired - CPI

25
Memory hierarchy
Conclusion
Stay in the cache(here 4x32KiB L1 / 2x6MIB L2)e.g. by splitting large dataset into smaller pieces
Possible speed gain of more than 50x!

26
Overview
System architecture
QPI
DDR3
DDR3
DDR3
DDR3
DDR3
DDR3
ICH10R
2x2
ESI
2x16
8x4
4x8
1x4
Tylersburg 36DIOH
QPI QPI
Nehalem-EP Nehalem-EP
PCIe
27
System architecture
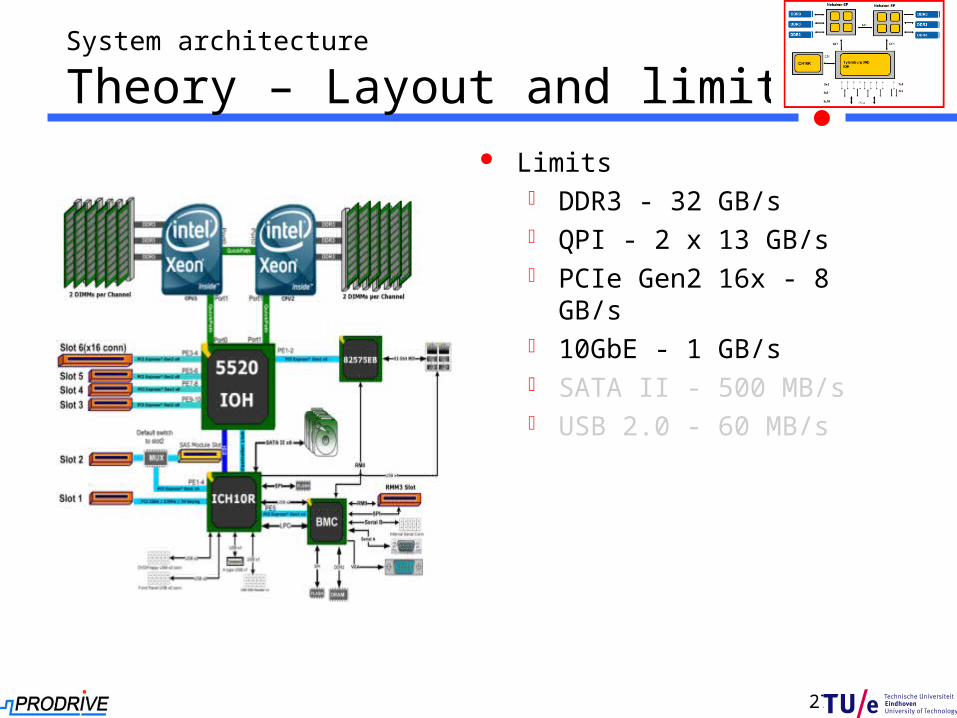
Theory – Layout and limits Limits
DDR3 - 32 GB/s QPI - 2 x 13 GB/s PCIe Gen2 16x - 8 GB/s 10GbE - 1 GB/s SATA II - 500 MB/s USB 2.0 - 60 MB/s

28
System architecture
Practice – Results (1/4)Reading memory
y = 1.3914x
y = 2.8685x
0
5
10
15
20
25
0 1 2 3 4 5 6 7 8 9
Threads
Ru
nti
me
[s]
Linear (Multi-core; Multi-CPU) Linear (Single-core; Single CPU)
~9 GiB/s
~18 GiB/s

29
System architecture
Practice – Results (2/4)

30
System architecture
Practice – Results (3/4)
31
System architecture
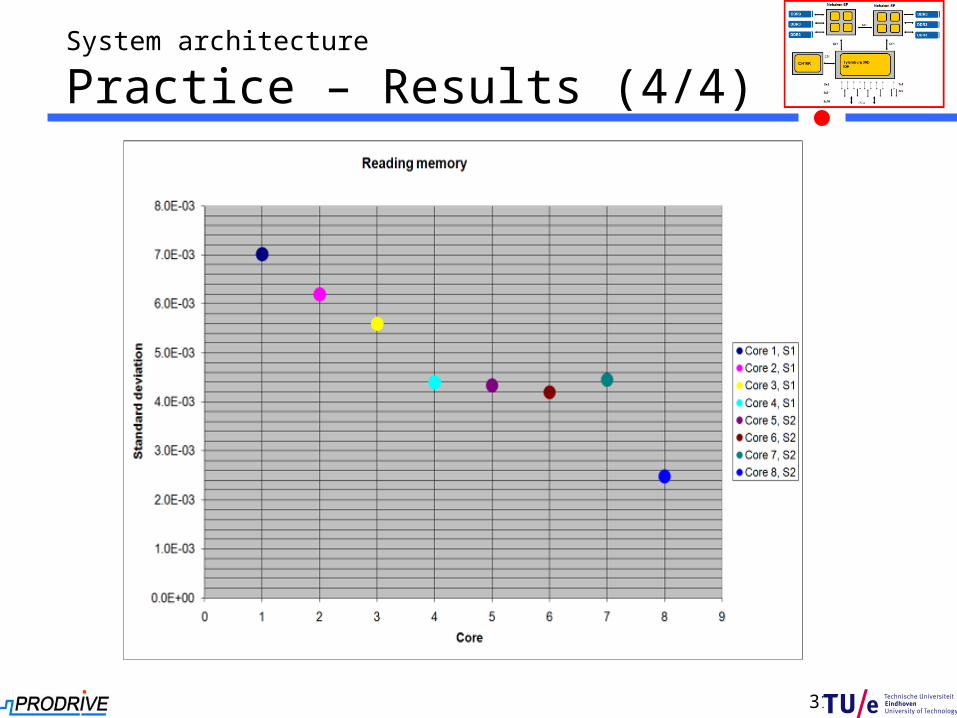
Practice – Results (4/4)
32
System architecture
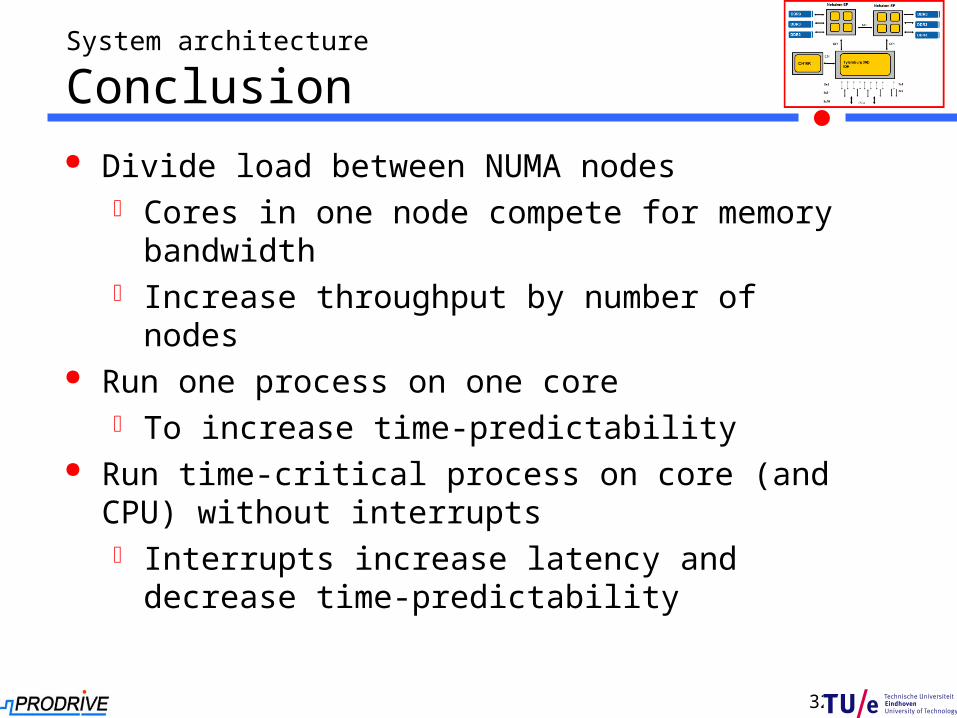
Conclusion Divide load between NUMA nodes
Cores in one node compete for memory bandwidth Increase throughput by number of nodes
Run one process on one core To increase time-predictability
Run time-critical process on core (and CPU) without interrupts Interrupts increase latency and decrease time-
predictability
33
Overview
Operating system
QPI
DDR3
DDR3
DDR3
DDR3
DDR3
DDR3
ICH10R
2x2
ESI
2x16
8x4
4x8
1x4
Tylersburg 36DIOH
QPI QPI
Nehalem-EP Nehalem-EP
PCIe
34
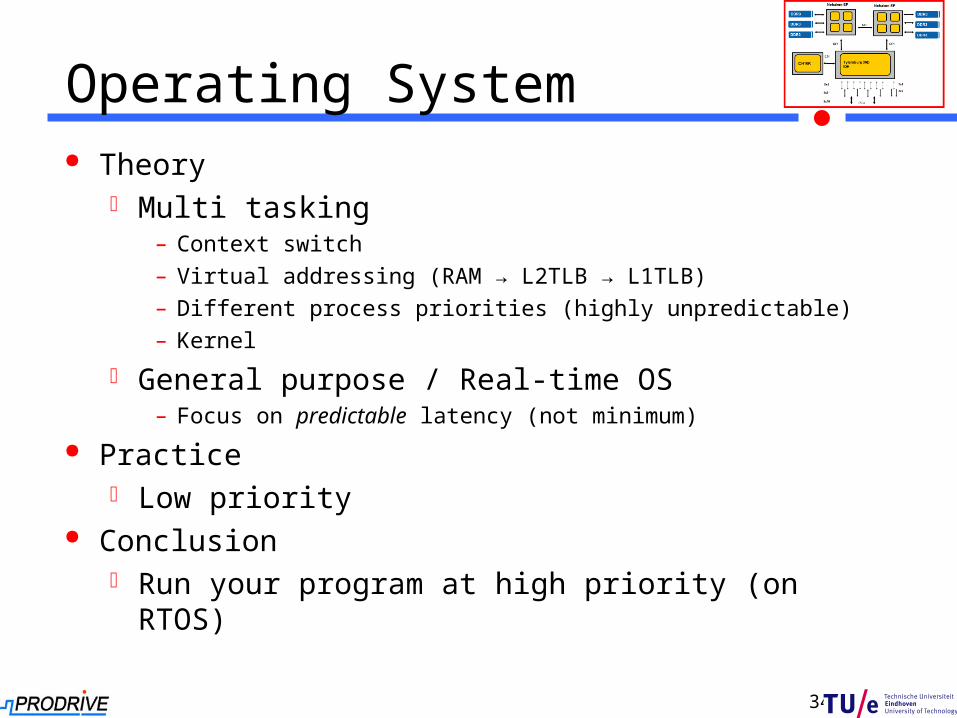
Operating System Theory
Multi tasking– Context switch
– Virtual addressing (RAM → L2TLB → L1TLB)
– Different process priorities (highly unpredictable)
– Kernel
General purpose / Real-time OS– Focus on predictable latency (not minimum)
Practice Low priority
Conclusion Run your program at high priority (on RTOS)
35
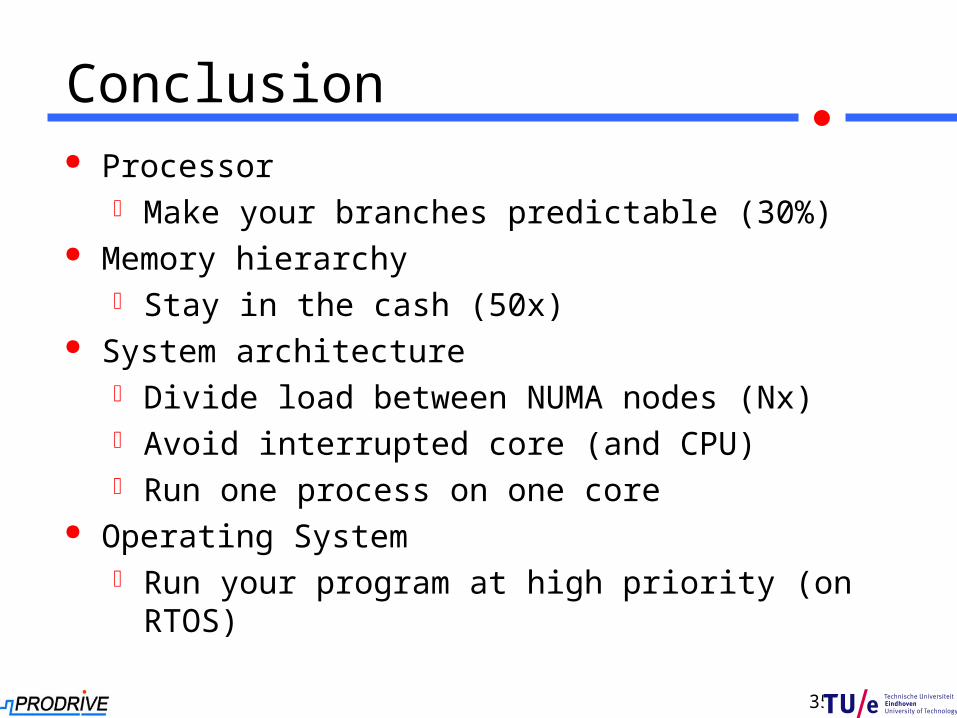
Conclusion Processor
Make your branches predictable (30%) Memory hierarchy
Stay in the cash (50x) System architecture
Divide load between NUMA nodes (Nx) Avoid interrupted core (and CPU) Run one process on one core
Operating System Run your program at high priority (on RTOS)


