Time-series clustering – A decade review Saeed Aghabozorgi, Ali Seyed Shirkhorshidi n , Teh Ying Wah Department of Information System, Faculty of Computer Science and Information Technology, University of Malaya (UM), 50603 Kuala Lumpur, Malaysia article info Article history: Received 13 October 2014 Accepted 27 April 2015 Available online 6 May 2015 Keywords: Clustering Time-series Distance measure Evaluation measure Representations abstract Clustering is a solution for classifying enormous data when there is not any early knowledge about classes. With emerging new concepts like cloud computing and big data and their vast applications in recent years, research works have been increased on unsupervised solutions like clustering algorithms to extract knowledge from this avalanche of data. Clustering time-series data has been used in diverse scientific areas to discover patterns which empower data analysts to extract valuable information from complex and massive datasets. In case of huge datasets, using supervised classification solutions is almost impossible, while clustering can solve this problem using un- supervised approaches. In this research work, the focus is on time-series data, which is one of the popular data types in clustering problems and is broadly used from gene expression data in biology to stock market analysis in finance. This review will expose four main components of time-series clustering and is aimed to represent an updated investigation on the trend of improvements in efficiency, quality and complexity of clustering time-series approaches during the last decade and enlighten new paths for future works. & 2015 Elsevier Ltd. All rights reserved. 1. Introduction Clustering is a data mining technique where similar data are placed into related or homogeneous groups without advanced knowledge of the groups’ definitions [1]. In detail, clusters are formed by grouping objects that have maximum similarity with other objects within the group, and minimum similarity with objects in other groups. It is a useful approach for exploratory data analysis as it identifies structure(s) in an unlabelled dataset by objectively organizing data into similar groups. Moreover, clustering is used for exploratory data analysis for summary generation and as a pre-processing step for other data mining tasks or as a part of a complex system. With increasing power of data storages and processors, real-world applications have found the chance to store and keep data for a long time. Hence, data in many applications is being stored in the form of time-series data, for example sales data, stock prices, exchange rates in finance, weather data, biomedical measurements (e.g., blood pressure and electrocardiogram measurements), biometrics data (image data for facial recognition), particle tracking in physics, etc. Accordingly, different works are found in variety of domains such as Bioinformatics and Biology, Genetics, Multimedia [2–4] and Finance. This amount of time-series data has provided the opportunity of analysing time-series for many researchers in data mining communities in the last decade. Consequently, many researches and projects relevant to analysing time-series have been performed in various areas for different purposes such as: subsequence matching, anomaly detection, motif discovery [5], indexing, clustering, Contents lists available at ScienceDirect journal homepage: www.elsevier.com/locate/infosys Information Systems http://dx.doi.org/10.1016/j.is.2015.04.007 0306-4379/& 2015 Elsevier Ltd. All rights reserved. n Corresponding author. Tel.: þ60 196918918. E-mail addresses: [email protected](S. Aghabozorgi), [email protected], [email protected](A. Seyed Shirkhorshidi), [email protected](T. Ying Wah). Information Systems 53 (2015) 16–38
Transcript
Contents lists available at ScienceDirect
Information Systems
Information Systems 53 (2015) 16–38
http://d0306-43
n CorrE-m
shirkhoShirkhotehyw@
journal homepage: www.elsevier.com/locate/infosys
Time-series clustering – A decade review
Saeed Aghabozorgi, Ali Seyed Shirkhorshidi n, Teh Ying WahDepartment of Information System, Faculty of Computer Science and Information Technology, University of Malaya (UM),50603 Kuala Lumpur, Malaysia
a r t i c l e i n f o
Article history:Received 13 October 2014Accepted 27 April 2015Available online 6 May 2015
Clustering is a solution for classifying enormous data when there is not any earlyknowledge about classes. With emerging new concepts like cloud computing and bigdata and their vast applications in recent years, research works have been increased onunsupervised solutions like clustering algorithms to extract knowledge from thisavalanche of data. Clustering time-series data has been used in diverse scientific areasto discover patterns which empower data analysts to extract valuable information fromcomplex and massive datasets. In case of huge datasets, using supervised classificationsolutions is almost impossible, while clustering can solve this problem using un-supervised approaches. In this research work, the focus is on time-series data, which isone of the popular data types in clustering problems and is broadly used from geneexpression data in biology to stock market analysis in finance. This review will expose fourmain components of time-series clustering and is aimed to represent an updatedinvestigation on the trend of improvements in efficiency, quality and complexity ofclustering time-series approaches during the last decade and enlighten new paths forfuture works.
& 2015 Elsevier Ltd. All rights reserved.
1. Introduction
Clustering is a data mining technique where similar dataare placed into related or homogeneous groups withoutadvanced knowledge of the groups’ definitions [1]. In detail,clusters are formed by grouping objects that have maximumsimilarity with other objects within the group, and minimumsimilarity with objects in other groups. It is a useful approachfor exploratory data analysis as it identifies structure(s) in anunlabelled dataset by objectively organizing data into similargroups. Moreover, clustering is used for exploratory dataanalysis for summary generation and as a pre-processing
orgi),
idi),
step for other data mining tasks or as a part of a complexsystem.
With increasing power of data storages and processors,real-world applications have found the chance to store andkeep data for a long time. Hence, data in many applicationsis being stored in the form of time-series data, for examplesales data, stock prices, exchange rates in finance, weatherdata, biomedical measurements (e.g., blood pressure andelectrocardiogram measurements), biometrics data (imagedata for facial recognition), particle tracking in physics, etc.Accordingly, different works are found in variety of domainssuch as Bioinformatics and Biology, Genetics, Multimedia[2–4] and Finance. This amount of time-series data hasprovided the opportunity of analysing time-series for manyresearchers in data mining communities in the last decade.Consequently, many researches and projects relevant toanalysing time-series have been performed in various areasfor different purposes such as: subsequence matching,anomaly detection, motif discovery [5], indexing, clustering,
S. Aghabozorgi et al. / Information Systems 53 (2015) 16–38 17
classification [6], visualization [7], segmentation [8], identi-fying patterns, trend analysis, summarization [9], andforecasting. Moreover, there are many on-going researchprojects aimed to improve the existing techniques [10,11].
In the recent decade, there has been a considerable amountof changes and developments in time-series clustering areathat are caused by emerging concepts such as big data andcloud computing which increased size of datasets exponen-tially. For example, one hour of ECG (electrocardiogram) dataoccupies 1 gigabyte, a typical weblog requires 5 gigabytes perweek, the space shuttle database has 200 gigabytes andupdating it requires 2 gigabytes per day [12]. Consequently,clustering craved for improvements in recent years to copewith this incremental avalanche of data to keep its reputationas a helpful data-mining tool for extracting useful patterns andknowledge from big datasets. This review is opportune,because despite the considerable changes in the area, there isnot a comprehensive review on anatomy and structure oftime-series clustering. There are some surveys and reviewsthat focus on comparative aspects of time-series clusteringexperiments [6,13–17] but none of them tend to be ascomprehensive as we are in this review. This research workis aimed to represent an updated investigation on the trend ofimprovements in efficiency, quality and complexity of cluster-ing time-series approaches during the last decade andenlighten new paths for future works.
1.1. Time-series clustering
A special type of clustering is time-series clustering. Asequence composed of a series of nominal symbols from aparticular alphabet is usually called a temporal sequence, anda sequence of continuous, real-valued elements, is known as atime-series [15]. A time-series is essentially classified asdynamic data because its feature values change as a functionof time, which means that the value(s) of each point of atime-series is/are one or more observations that are madechronologically. Time-series data is a type of temporal datawhich is naturally high dimensional and large in data size[6,17,18]. Time-series data are of interest due to their ubiquityin various areas ranging from science, engineering, business,finance, economics, healthcare, to government [16]. Whileeach time-series is consisting of a large number of data pointsit can also be seen as a single object [19]. Clustering suchcomplex objects is particularly advantageous because it leadsto discovery of interesting patterns in time-series datasets. Asthese patterns can be either frequent or rare patterns, severalresearch challenges have arisen such as: developing methodsto recognize dynamic changes in time-series, anomaly andintrusion detection, process control, and character recogni-tion [20–22]. More applications of time-series data are dis-cussed in Section 1.2. To highlight the importance and theneed for clustering time-series datasets, potentially overlap-ping objectives for clustering of time-series data are given asfollows:
1.
Time-series databases contain valuable information thatcan be obtained through pattern discovery. Clustering isa common solution performed to uncover these patternson time-series datasets.
2.
Time-series databases are very large and cannot be handledwell by human inspectors. Hence, many users prefer to dealwith structured datasets rather than very large datasets. Asa result, time-series data are represented as a set of groupsof similar time-series by aggregation of data in non-overlapping clusters or by a taxonomy as a hierarchy ofabstract concepts.
3.
Time-series clustering is the most-used approach as anexploratory technique, and also as a subroutine in morecomplex data mining algorithms, such as rule discovery,indexing, classification, and anomaly detection [22].
4.
Representing time-series cluster structures as visualimages (visualization of time-series data) can help usersquickly understand the structure of data, clusters,anomalies, and other regularities in datasets.
The problem of clustering of time-series data is formallydefined as follows:
Definition 1:. Time-series clustering, given a dataset of ntime-series data D¼ F1; F2; ::; Fnf g; the process of unsuper-vised partitioning of D into C ¼ C1;C2; ::;Ck
� �, in such a way
that homogenous time-series are grouped together basedon a certain similarity measure, is called time-series clus-tering. Then, Ci is called a cluster, where D¼ [k
i ¼ 1 Ci andCi\Cj ¼∅ for ia j.
Time-series clustering is a challenging issue because firstof all, time-series data are often far larger than memory sizeand consequently they are stored on disks. This leads to anexponential decrease in speed of the clustering process.Second challenge is that time-series data are often highdimensional [23,24] which makes handling these data diffi-cult for many clustering algorithms [25] and also slows downthe process of clustering [26]. Finally, the third challengeaddresses the similarity measures that are used to make theclusters. To do so, similar time-series should be found whichneeds time-series similarity matching that is the process ofcalculating the similarity among the whole time-series usinga similarity measure. This process is also known as “wholesequence matching” where whole lengths of time-series areconsidered during distance calculation. However, the processis complicated, because time-series data are naturally noisyand include outliers and shifts [18], at the other hand thelength of time-series varies and the distance among themneeds to be calculated. These common issues have made thesimilarity measure a major challenge for data miners.
1.2. Applications of time-series clustering
Clustering of time-series data is mostly utilized for dis-covery of interesting patterns in time-series datasets [27,28].This task itself, fall into two categories: The first group is theone which is used to find patterns that frequently appears inthe dataset [29,30]. The second group are methods to discoverpatterns which happened in datasets surprisingly [31–34].Briefly, finding the clusters of time-series can be advantageousin different domains to answer following real world problems:
Anomaly, novelty or discord detection: Anomaly detectionare methods to discover unusual and unexpected patternswhich happen in datasets surprisingly [31–34]. For example,
Table 1Samples of objectives of time-series clustering in different domains.
Category Clustering application Researchworks
Aviation/Astronomy
Astronomical data (star light curves) – pre-processing for outlier detection [41]
Biology Multiple gene expression profile alignment for microarray time-series data clustering [42]Functional clustering of time series gene expression data [43]Identification of functionally related genes [44–46]
Climate Discovery of climate indices [47,48]Analysing PM10 and PM2.5 concentrations at a coastal location of New Zealand [49]
Energy Discovering energy consumption pattern [50,51]
Environment andurban
Analysis of the regional variability of sea-level extremes [52]Earthquake - Analysing potential violations of a Comprehensive Test Ban Treaty (CTBT) – Pattern discovery andforecasting
[53,54]
Analysis of the change of population distribution during a day in Salt Lake County, Utah, USA [55]Investigating the relationship between the climatic indices with the clusters/trends detected based on clusteringmethod.
[56]
Finance Finding seasonality patterns (retail pattern) [57]Personal income pattern [58]Creating efficient portfolio ( a group of stocks owned by a particular person or company) [59]Discovery patterns from stock time-series [60]Risk reduced portfolios by analyzing the companies and the volatility of their returns [61]Discovery patterns from stock time-series [29,62]Investigate the correlation between hedging horizon and performance in financial time-series. [63]
Medicine Detecting brain activity [64,65]Exploring, identifying, and discriminating pathological cases from MS clinical samples [66]
Psychology Analysis of human behaviour in psychological domain [67]Robotics Forming prototypical representations of the robot’s experiences [68,69]Speech/voicerecognition
Speaker verification [70]Biometric voice classification using hierarchical clustering [71]
User analysis Analysing multivariate emotional behaviour of users in social network with the goal to cluster the users from afully new perspective-emotions
[72]
S. Aghabozorgi et al. / Information Systems 53 (2015) 16–3818
in sensor databases, clustering of time-series which are pro-duced by sensor readings of a mobile robot in order to discoverthe events [35].
1-
Recognizing dynamic changes in time-series: detec-tion of correlation between time-series [36]. For exam-ple, in financial databases, it can be used to find thecompanies with similar stock price move.
Fig. 1. Time-series clustering taxonomy.
2- Prediction and recommendation: a hybrid techniquecombining clustering and function approximation percluster can help user to predict and recommend [37–40].For example, in scientific databases, it can addressproblems such as finding the patterns of solar magneticwind to predict today’s pattern.
3-
Pattern discovery: to discover the interesting patternsin databases. For example, in marketing database, differ-ent daily patterns of sales of a specific product in a storecan be discovered.
Table 1 depicts some applications of time-series data indifferent domains.
1.3. Taxonomy of time-series clustering
Reviewing the literature, one can conclude that most ofclustering time-series related works are classified into threecategories: “whole time-series clustering”, “subsequence clus-tering” and “time point clustering” as depicted in Fig. 1. Thefirst two categories are mentioned by Keogh and Lin [242] Onbehalf of Ali Shirkhorshidi ([email protected]).
�
Whole time-series clustering is considered as cluster-ing of a set of individual time-series with respect to theirsimilarity. Here, clustering means applying conventional
S. Aghabozorgi et al. / Information Systems 53 (2015) 16–38 19
(usually) clustering on discrete objects, where objectsare time-series.
�
Subsequence clustering means clustering on a set ofsubsequences of a time-series that are extracted via asliding window, that is, clustering of segments from asingle long time-series.
�
Time point clustering is another category of clusteringwhich is seen in some papers [74–76]. It is clustering oftime points based on a combination of their temporalproximity of time points and the similarity of the corre-sponding values. This approach is similar to time-seriessegmentation. However, it is different from segmentationas all points do not need to be assigned to clusters, i.e.,some of them are considered as noise.
Essentially, sub-sequence clustering is performed on asingle time-series, and Keogh and Lin [242] represented that
this type of clustering is meaningless. Time-point clusteringalso is applied on a single time-series, and is similar to time-series segmentation as the objective of time-point clusteringis finding the clusters of time-point instead of clusters oftime-series data. The focus of this study is on the “wholetime-series clustering”. A complete review on whole time-series clustering is performed and shown in Table 4. Review-ing the literature, it is noticeable that various techniques havebeen recommended for the clustering of whole time-seriesdata. However, most of them take one of the followingapproaches to cluster time-series data:
1.
Customizing the existing conventional clustering algorithms(which work with static data) such that they become
Fig. 2. The time-series clust
compatible with the nature of time-series data. In thisapproach, usually their distance measure (in conventionalalgorithms) is modified to be compatible with the raw time-series data [16].
2.
Converting time-series data into simple objects (staticdata) as input of conventional clustering algorithms [16].
3.
Using multi resolutions of time-series as input of amulti-step approach. This approach is discussed furtherin Section 5.6.
Beside this common characteristic, there are generallythree different ways to cluster time-series, namely shape-based, feature-based and model-based.
Fig. 2 shows a brief of these approaches. In the shape-based approach, shapes of two time-series are matched aswell as possible, by a non-linear stretching and contractingof the time axes. This approach has also been labelled as araw-data-based approach because it typically works directlywith the raw time-series data. Shape-based algorithmsusually employ conventional clustering methods, whichare compatible with static data while their distance/simi-larity measure has been modified with an appropriate onefor time-series. In the feature-based approach, the rawtime-series are converted into a feature vector of lowerdimension. Later, a conventional clustering algorithm isapplied to the extracted feature vectors. Usually in thisapproach, an equal length feature vector is calculated fromeach time-series followed by the Euclidean distance mea-surement [77]. In model-based methods, a raw time-seriesis transformed into model parameters (a parametric model
ering approaches.
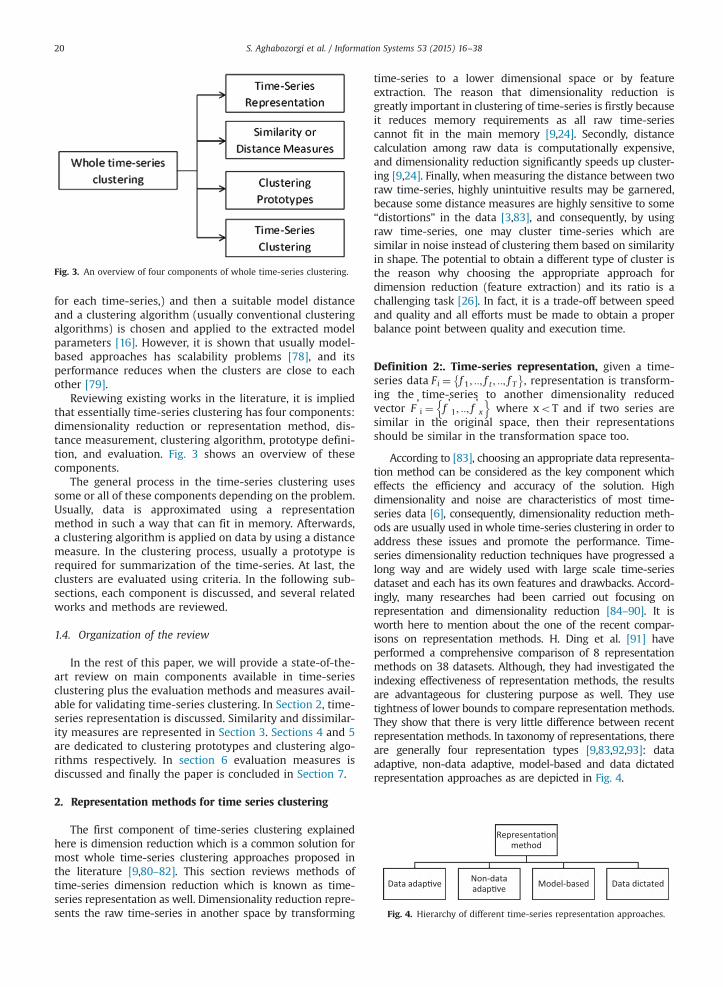
Fig. 3. An overview of four components of whole time-series clustering.
Fig. 4. Hierarchy of different time-series representation approaches.
S. Aghabozorgi et al. / Information Systems 53 (2015) 16–3820
for each time-series,) and then a suitable model distanceand a clustering algorithm (usually conventional clusteringalgorithms) is chosen and applied to the extracted modelparameters [16]. However, it is shown that usually model-based approaches has scalability problems [78], and itsperformance reduces when the clusters are close to eachother [79].
Reviewing existing works in the literature, it is impliedthat essentially time-series clustering has four components:dimensionality reduction or representation method, dis-tance measurement, clustering algorithm, prototype defini-tion, and evaluation. Fig. 3 shows an overview of thesecomponents.
The general process in the time-series clustering usessome or all of these components depending on the problem.Usually, data is approximated using a representationmethod in such a way that can fit in memory. Afterwards,a clustering algorithm is applied on data by using a distancemeasure. In the clustering process, usually a prototype isrequired for summarization of the time-series. At last, theclusters are evaluated using criteria. In the following sub-sections, each component is discussed, and several relatedworks and methods are reviewed.
1.4. Organization of the review
In the rest of this paper, we will provide a state-of-the-art review on main components available in time-seriesclustering plus the evaluation methods and measures avail-able for validating time-series clustering. In Section 2, time-series representation is discussed. Similarity and dissimilar-ity measures are represented in Section 3. Sections 4 and 5are dedicated to clustering prototypes and clustering algo-rithms respectively. In section 6 evaluation measures isdiscussed and finally the paper is concluded in Section 7.
2. Representation methods for time series clustering
The first component of time-series clustering explainedhere is dimension reduction which is a common solution formost whole time-series clustering approaches proposed inthe literature [9,80–82]. This section reviews methods oftime-series dimension reduction which is known as time-series representation as well. Dimensionality reduction repre-sents the raw time-series in another space by transforming
time-series to a lower dimensional space or by featureextraction. The reason that dimensionality reduction isgreatly important in clustering of time-series is firstly becauseit reduces memory requirements as all raw time-seriescannot fit in the main memory [9,24]. Secondly, distancecalculation among raw data is computationally expensive,and dimensionality reduction significantly speeds up cluster-ing [9,24]. Finally, when measuring the distance between tworaw time-series, highly unintuitive results may be garnered,because some distance measures are highly sensitive to some“distortions” in the data [3,83], and consequently, by usingraw time-series, one may cluster time-series which aresimilar in noise instead of clustering them based on similarityin shape. The potential to obtain a different type of cluster isthe reason why choosing the appropriate approach fordimension reduction (feature extraction) and its ratio is achallenging task [26]. In fact, it is a trade-off between speedand quality and all efforts must be made to obtain a properbalance point between quality and execution time.
Definition 2:. Time-series representation, given a time-series data Fi ¼ f 1; ::; f t ; ::; f T
� �, representation is transform-
ing the time-series to another dimensionality reducedvector F'i ¼ f '1; ::; f
'x
n owhere xoT and if two series are
similar in the original space, then their representationsshould be similar in the transformation space too.
According to [83], choosing an appropriate data representa-tion method can be considered as the key component whicheffects the efficiency and accuracy of the solution. Highdimensionality and noise are characteristics of most time-series data [6], consequently, dimensionality reduction meth-ods are usually used inwhole time-series clustering in order toaddress these issues and promote the performance. Time-series dimensionality reduction techniques have progressed along way and are widely used with large scale time-seriesdataset and each has its own features and drawbacks. Accord-ingly, many researches had been carried out focusing onrepresentation and dimensionality reduction [84–90]. It isworth here to mention about the one of the recent compar-isons on representation methods. H. Ding et al. [91] haveperformed a comprehensive comparison of 8 representationmethods on 38 datasets. Although, they had investigated theindexing effectiveness of representation methods, the resultsare advantageous for clustering purpose as well. They usetightness of lower bounds to compare representation methods.They show that there is very little difference between recentrepresentation methods. In taxonomy of representations, thereare generally four representation types [9,83,92,93]: dataadaptive, non-data adaptive, model-based and data dictatedrepresentation approaches as are depicted in Fig. 4.
Table 2Representation methods for time-series data.
Representation method Complexity Type Comments Introducedby
Discrete Fourier Transform(DFT)
O(n(log(n)) Non data adaptive,Spectral
Usage: [20,108]Natural SignalsPros:No false dismissals.Cons:Not support time warped queries
Discrete Wavelet Transform(DWT)
O(n) Non data adaptive,Wavelet
Usage: [85,108,109]stationary signalsPros:Better results than DFTCons:Not stable results, Signals must havea length n¼2some_integer
Singular Value Decomposition(SVD)
very expensive O(Mn2) Data adaptive Usage: [20,97]text processing communityPros:underlying structure of the data
Discrete Cosine Transformation(DCT)
a Non data adaptive,Spectral
- [97]
Piecewise LinearApproximation (PLA)
O(n log n) complexity for“bottom up” algorithm
Data adaptive Usage: [86]natural signals, biomedicalCons:Not (currently) indexable, veryexpensiveO(n2N)
Piecewise AggregateApproximation (PAA)
Extremely Fast O(n) Non data adaptive - [24,90]
Adaptive Piecewise ConstantApproximation (APCA)
O(n) Data adaptive Pros: [87]Very efficientCons:complex implementation
Perceptually important point(PIP)
a Non data adaptive Usage: [110]Finance
Chebyshev Polynomials (CHEB) a Non data adaptive,Wavelet, Orthonormal
– [99]
Symbolic Approximation (SAX) O(n) Data adaptive Usage: [111]string processing and bioinformaticsPros:Allows Lower bounding andNumerosity ReductionCons:Discretize and alphabet size
Clipped Data a Data dictated Usage: [83]HardwareCons:Ultra compact representation
Indexable Piecewise LinearApproximation (IPLA)
a Non data adaptive - [101]
a Not indicated by authors.
S. Aghabozorgi et al. / Information Systems 53 (2015) 16–38 21
2.1. Data adaptive
Data adaptive representation methods are performed onall time-series in datasets and try to minimize the global
reconstruction error [94] using arbitrary length (non-equal)segments. This technique has been applied in differentapproaches such as Piecewise Polynomials Interpolation(PPI) [95], Piecewise Polynomials Regression (PPR) [96],
Table 3Similarity measure approaches in the literature.
Distance measure Characteristics Method Definedby
Dynamic Time Warping(DTW)
Elastic Measure (one-to-many/one-to-none) Very well in deal with temporal drift. Shape-based [118,119]Better accuracy than Euclidean distance [129,114,120,90].Lowe efficiency than Euclidean distance and triangle similarity.
Pearson’s correlationcoefficient and relateddistances
Invariant to scale and location of the data points Compressionbaseddissimilarity
[124]
Euclidean distance (ED) Lock-step Measure (one-to-one) using in indexing, clustering and classification,Sensitive to scaling.
Able to capture not only the dependencies between variables, but also the serialcorrelation in the measurements
Model based [116]
Cross-correlation baseddistances
Noise reduction, able to summarize the temporal structure Shape-based [132]
Cosine wavelets – Compressionbaseddissimilarity
[126]
Autocorrelation – Compressionbaseddissimilarity
[133]
Piecewise normalization It involves time intervals, or “windows,” of varying size. But it is not clear how todetermine these “windows.”
Compressionbaseddissimilarity
[125]
LCSS Noise robustness Shape-based [120,121]Cepstrum A spectral measure which is the inverse Fourier transform of the short-time logarithmic
amplitude spectrumCompressionbaseddissimilarity
[107]
Probability-based distance Able to cluster seasonality patterns Compressionbaseddissimilarity
[57]
ARMA – Model based [107,117]Short time-series distance(STS)
Sensitive to scaling. Feature-based [44]Can capture temporal information, regardless of the absolute values
J divergence – Shape-based [53]Edit Distance with RealPenalty (ERP)
Robust to noise, shifts and scaling of data, a constant reference point is used Shape-based [134]
Minimal Variance Matching(MVM)
Automatically skips outliers Shape-based [122]
Edit Distance on Realsequence (EDR)
Elastic measure (one-to-many/one-to-none), uses a threshold pattern Shape-based [135]
Histogram-based Using multi-scale time-series histograms Shape-based [136]Threshold Queries (TQuEST) Threshold-based Measure, considers intervals, during which the time-series exceeds a
certain threshold for comparing time-series rather than using the exact time-seriesvalues.
Model based [137]
DISSIM Proper for different sampling rates Shape-based [138]Sequence WeightedAlignment model (Swale)
Similarity score based on both match rewards and mismatch penalties. Shape-based [139]
Spatial Assembling Distance(SpADe)
Pattern-based Measure Model based [140]
Compression-baseddissimilarity measure(CDM)
In [123] Keogh et al. a parameter-light distance measure method based on Kolmogorovcomplexity theory is suggested. Compression-based dissimilarity measure (CDM) isadopted in this paper.
Compressionbaseddissimilarity
[123]
Triangle similarity measure Can deal with noise, amplitude scaling very well and deal with offset translation, lineardrift well in some situations [141].
Shape-based [141]
Dictionary-basedcompression
Lang et al. [142] develop a dictionary compression score for similarity measure. Adictionary-based compression technique is suggested to compute long time-seriessimilarity
Compressionbaseddissimilarity
[142]
S. Aghabozorgi et al. / Information Systems 53 (2015) 16–3822
Piecewise Linear Approximation (PLA), Piecewise ConstantApproximation (PCA), Adaptive Piecewise Constant Approx-imation (APCA) [87], Singular Value Decomposition (SVD)[20,97], Natural Language, Symbolic Natural Language (NLG)
[98], Symbolic Aggregate ApproXimation (SAX) and iSAX[84]. Data adaptive representations can better approximateeach series, but the comparison of several time-series ismore difficult.
S. Aghabozorgi et al. / Information Systems 53 (2015) 16–38 23
2.2. Non-data adaptive
Non-data adaptive approaches are representations whichare suitable for time-series with fix size (equal-length)segmentation, and the comparison of representations ofseveral time-series is straightforward. The methods in thisgroup are Wavelets [85]: HAAR, DAUBECHIES, Coeiflets,Symlets, Discrete Wavelet Transform(DWT), spectral Cheby-shev Polynomials [99], spectral DFT [20], Random Mappings[100], Piecewise Aggregate Approximation (PAA) [24] andIndexable Piecewise Linear Approximation (IPLA) [101].
2.3. Model based
Model based approaches represent a time-series in astochastic way such as Markov Models and Hidden MarkovModel (HMM) [102–104], Statistical Models, Time-seriesBitmaps [105], and Auto-Regressive Moving Average (ARMA)[106,107]. In the data adaptive, non-data adaptive, and modelbased approaches user can define the compression-ratiobased on the application in hand.
2.4. Data dictated
In contrast, in data dictated approaches, the compression-ratio is defined automatically based on raw time-series suchas Clipped [83,92]. In the following table (Table 2) the mostfamous representation methods in the literature are shown.
2.5. Discussion on time series representation methods
Different approaches for representation of time-seriesdata are proposed in previous studies. Most of theseapproaches are focused to speed up the process and reducethe execution time and mostly they emphasis on indexingprocess for achieving to this goal. At the other hand someother approaches consider the quality of representation, asan instance in [83], the authors focus on the accuracy ofrepresentation method and suggest a bit level approxima-tion of time-series. Each time-series is represented by a bitstring, and each bit value specifies whether the data point’svalue is above the mean value of the time-series. Thisrepresentation can be used to compute an approximateclustering of the time-series. This kind of representationwhich also referred to as clipped representation has cap-ability of being compared with raw time-series, but in theother representations, all time-series in dataset must betransformed into the same representation in terms ofdimensionality reduction. However, clipped series are the-oretically and experimentally sufficient for clustering basedon similarity in change (model based dissimilarity measure-ment) not clustering based on shape. Reviewing the litera-ture shows that limited works are available for discretevalued time-series and also it is noticeable that most ofresearch works are based on evenly sampled data whilelimited works addressed unevenly sampled data. Addition-ally data error is not taken into account in most of researchworks. Finally among all of the papers reviewed in thisarticle, none of them addressed handling multivariate timeseries data with different length for each variable.
3. Similarity/dissimilarity measures in time-seriesclustering
This section is a review on distance measurementapproaches for time-series. The theoretical issue of time-series similarity/dissimilarity search is proposed by Agrawalet al. [108] and subsequently it became a basic theoretical issuein data mining community. Time-series clustering relies ondistance measure to a high extent. There are different measureswhich can be applied to measure the distance among time-series. Some of similarity measures are proposed based on aspecific time-series representations, for example, MINDISTwhich is compatible with SAX [84], and some of them workregardless of representation methods, or are compatible withraw time-series. In traditional clustering, distance betweenstatic objects is exactly match based, but in time-series cluster-ing, distance is calculated approximately. In particular, in orderto compare time-series with irregular sampling intervals andlength, it is of great significance to adequately determine thesimilarity of time-series. There is different distance measuresdesigned for specifying similarity between time-series. TheHausdorff distance, modified Hausdorff (MODH), HMM-baseddistance, Dynamic Time Warping (DTW), Euclidean distance,Euclidean distance in a PCA subspace, and Longest CommonSub-Sequence (LCSS) are the most popular distance measure-ment methods that are used for time-series data. References ondistance measurement methods are given in Table 3. One of thesimplest ways for calculating distance between two time-seriesis considering them as univariate time-series, and then calcu-lating the distance measurement across all time points.
Definition 3:. Univariate time-series, a univariate time-series is the simplest form of temporal data and is asequence of real numbers collected regularly in time, whereeach number represents a value [25].
Definition 4:. Time-series distance, let Fi ¼ f i1; ::; f it ;�
::; f iT gbe a time-series of length T. If the distance between twotime-series is defined across all time points, then distðFi; FjÞis the sum of the distance between individual points
distðFi; FjÞ ¼XT
t ¼ 1
distðf it ; f jtÞ ð3:1Þ
Researches done on shape-based distance measuring oftime-series usually have to challenge with problems such asnoise, amplitude scaling, offset translation, longitudinalscaling, linear drift, discontinuities and temporal drift whichare the common properties of time-series data, theseproblems are broadly investigated in the literature [86].The choice of a proper distance approach depends on thecharacteristic of time-series, length of time-series, repre-sentation method, and of course on the objective of cluster-ing time-series to a high extent. This is depicted in Fig. 5.
Typically, there are three objectives which respectivelyrequire different approaches [112].
3.1. Finding similar time-series in time
Because this similarity is on each time step, correlationbased distances or Euclidean distance measure are properfor this objective. However, because this kind of distance
Fig. 5. Distance measure approaches in the literature.
S. Aghabozorgi et al. / Information Systems 53 (2015) 16–3824
measuring is costly on raw time-series, the calculation isperformed on transformed time-series, such as Fouriertransforms, wavelets or Piecewise Aggregate Approximation(PAA). Keogh and Kasetty [6], have done an comprehensivereview on this matter. Clustering of time-series that arecorrelated, (e.g., to cluster time-series of share price relatedto many companies to find which shares change togetherand how they are correlated) is categorized as clusteringbased on similarity in time [83,112].
3.2. Finding similar time-series in shape
The time of occurrence of patterns is not important tofind similar time-series in shape. As a result, elastic meth-ods [108,113] such as Dynamic time Warping (DTW) [114] isused for dissimilarity calculation. Using this definition,clusters of time-series with similar patterns of change areconstructed regardless of time points, for example, tocluster share price related to different companies whichhave a common pattern in their stock independent on itsoccurrence in time-series [112]. Similarity in time is anespecial case of similarity in shape. A research has revealedthat similarity in shape is superior to metrics based onsimilarity in time [115].
3.3. Finding similar time-series in change (structuralsimilarity)
In this approach, usually modelling methods such asHidden Markov Models (HMM) [116] or an ARMA process[107,117] are utilized, and then similarity is measured onthe parameters of fitted model to time-series. That is,clustering time-series with similar autocorrelation struc-ture, e.g., clustering of shares which have a tendency toincrease after a fall in share price in the next day [112]. Thisapproach is proper for long time-series, not for modest orshort time-series [21].
Clustering approaches could be classified into two cate-gories based on the length of time-series: “shape level” and“structure level”. The “shape level” is usually utilized tomeasure similarity in short-length time-series clusteringsuch as expression profiles or individual heartbeats bycomparing their local patterns, whereas “structure level”measures similarity which is based on global and high levelstructure, and it is used for long-length time-series datasuch as an hour’s worth of ECGs or yearly meteorological
data [21]. Focusing on shape-based clustering of shortlength time-series, in this study, shape level similarity isused. Depending on the objective and length of time-series,the proper type of distance measures is determined. Essen-tially, there are four types of distance measure in theliterature. Please refer to Table 3 for references on the typesof distance measure. Shape-based similarity measure is tofind the similar time-series in time and shape, such asEuclidean, DTW [118,119], LCSS [120,121], MVM [122]. It is agroup of methods which are proper for short time-series.Compression based similarity is suitable for short and longtime-series, such as CDM [123], Autocorrelation, Short time-series distance [44], Pearson’s correlation coefficient andrelated distances [124], Cepstrum [107], Piecewise normal-ization [125] and Cosine wavelets [126]. Feature basedsimilarity measure are proper for long time-series, such asStatistics, Coefficients, Model based similarity is proper forlong time-series, such as HMM [116] and ARMA [107,117].
A survey on various methods for efficient retrieval ofsimilar time-series were given by Last and Kandel [127].Furthermore, in [16], authors have presented the formulasof various measures. Then, Zhang et al. [128] have per-formed a complete survey on the aforementioned distancemeasurements and compared them in different applica-tions. In Table 3, different measures are compared in termsof complexity and their characteristics.
3.4. Discussion on distance measures
Choosing an adequately accurate distance measure iscontroversial in time-series clustering domain. There aremany distance measure proposed by researchers whichwere compared and discussed in Section 3. However, thefollowing conclusion can be drawn from literature.
1)
Investigating the mentioned approaches as similarity/dissimilarity measure, it is implied that the most effec-tive and accurate approaches are the ones which arebased on dynamic programming (DP) which are veryexpensive in time execution (the cost of comparing twotime-series is quadratic in the length of the time-series)[143]. Although, usually some constraints are taken forthese distance/similarity measurements to mitigate thecomplexity [119,144], it needs careful tuning of para-meters to be efficient and effective. As a result, again, atrade-off between speed and accuracy should be foundin usage of this metrics. In another view, it is worthwhileto understand the extent that distance measure iseffective in large scale datasets of time-series. Thismatter is not obtained from literature because most ofthe considered works are based on rather small datasets.
2)
In the similarity measure researches, varieties of chal-lenges are considered pertaining to distance measure-ment. A big challenge is the issue of incompatibility ofdistance metric with the representation method. Forexample, one of the common approaches that is appliedto time-series analysis is based upon frequency-domain[85,109], while using this space, it is difficult to find thesimilarity among sequences and produce value-baseddifferences to be used in clustering.
S. Aghabozorgi et al. / Information Systems 53 (2015) 16–38 25
3)
Euclidean distance and DTW are the most commonmethods for similarity measure in time-series clustering.A research has shown that, in terms of time-series classi-fication accuracy, the Euclidean distance is surprisinglycompetitive [145], however, DTW also has its strength insimilarity measurements which cannot be declined.
4. Time-series cluster prototypes
Finding the cluster prototype or cluster representative isan essential subroutine in time-series clustering approaches[3,86,112,114,146,147]. One of the approaches to address thelow quality problem in time-series clustering is remedyingthe issue of inaccurate prototypes of clusters, especiallyin partitioning clustering algorithms such as k-Means,k-Medoids, Fuzzy C-Means (FCM), or even Ascendant Hier-archical Clustering which requires a prototype. In thesealgorithms, the quality of clusters is highly dependent onquality of prototypes. Given time-series in a cluster, it is clearthat the cluster’s prototype Rj minimizes the distance betweenall time-series in the cluster and its prototype. Time-series Rj
that minimizes E Ci;Rj� �
is called a Steiner sequence [148].
E Ci;Rj� �¼ 1
n
Xn
x ¼ 1
distðFx;RjÞ; Ci ¼ F1; F2; ::; Fnf g ð4:1Þ
There are a few methods for calculating prototypespublished in the literature of time-series, however most ofthese publications have not proved the correctness of theirmethods [149]. But, generally three approaches can be seenfor defining the prototypes:
1.
The medoid sequence of the set. 2. The average sequence of the set. 3. The local search prototype.
In following these three approaches are explained anddiscussed.
4.1. Using medoid as prototype
In time-series clustering, the most common way toapproach optimal Steiner sequence is to use cluster medoidas the prototype [150]. In this approach, the centre of acluster is defined as a sequence which minimizes the sum ofsquared distances to other objects within the cluster. Giventime-series in a cluster, the distance of all time-series pairswithin the cluster is calculated using a distance measuresuch as Euclidean or DTW. Then, one of the time-series inthe cluster, which has lower sum of square error is definedas medoid of the cluster [151]. Moreover, if the distance is anon-elastic approach such as Euclidean, or if the centroid ofthe cluster can be calculated, it can be said that medoid isthe nearest time-series to centroid. Cluster medoid is verycommon among works related to time-series clustering andhas been used in many papers such as: [77,150,152,153].
4.2. Using averaging prototype
If the time-series are from equal length, and distance metricis a none-elastic distance metric (e.g., Euclidean distance) in
clustering process, then the averaging method is a simpleaveraging technique which is equal to mean of the time-seriesat each point. However, in the case that there are time-serieswith different length [149] or in the case which the similaritybetween time-series is based on “similarity in shape”, its one-to-one mapping nature, makes it unable to capture the actualaverage shape. For example, in the cases that Dynamic TimeWarping (DTW) or Longest Common Sub-Sequence (LCSS) arevery appropriate [154], averaging prototype is evaded, becauseit is not a trivial task. For more evidence, one can see manyworks in the literature [86,112,114,146,155,156], which avoidusing elastic approaches (e.g., DTW and LCSS) where there is aneed to use a prototype without providing adequate reasons(whether the clustering is based on similarity in time orshape). Two averaging methods using DTW and LCSS arebriefly explained following in this section.
Shape averaging using Dynamic Time Warping (DTW):in this approach, one method to define the prototype of acluster is by combination of pairs of time-series hierarchi-cally or sequentially. For example, shape averaging usingDynamic Time Warping, until only one time-series is left[154]. The drawback of this method is its dependency on theordering of choosing pairs which results in different finalprototypes [2]. Another method is the approach mentionedby Abdulla and Chow [157], where authors proposed across-words reference template (CWRT), where at first, themedoid is find as the initial guess, then all sequences arealigned by DTW to the medoid, and then the average time-series is computed. The resulting time-series has the samelength as the medoid, but the method is invariant to theorder of processing sequences [77]. In another study, theauthors present a global averaging method for defining theprototypes [158]. They use an averaging approach wherethe distance method for clustering or classification is DTW.However, its accuracy is dependent on the length of theinitial average sequence and value of its coordinates.
Shape averaging using Longest Common Sub-Sequence(LCSS): the longest common subsequence [159] generallypermits to make a summary of a set of sequences. Thisapproach supports the elastic distances and unequal sizetime-series. Aghabozorgi et al. [160] and Aghabozorgi, Wah,Amini, and Saybani [161] propose a fuzzy clustering approachfor time-series clustering, and utilize the averaging method byLCSS as prototype.
4.3. Using local search prototype
In this approach, at first the medoid of cluster is com-puted, then using averaging method (Section 4.2), averagedprototype is calculated based on warping paths. Afterward,new warping paths are calculated to the averaged prototype.Hautamaki et al. [77] propose a prototype obtained by localsearch, instead of medoid to overcome the poor quality intime-series clustering in Euclidean space. They apply medoid,average and local search on k-Medoids, Random Swap (RS)and Agglomerative Hierarchical clustering (where k-means isused to fine-tune the output) to evaluate their work. Theyfigured out that local search provides the best clusteringaccuracy and also more improvement to k-Medoids. However,it is not clear how much improvement it has in comparison
S. Aghabozorgi et al. / Information Systems 53 (2015) 16–3826
with other works such as medoid averaging methods whichare another frequently used prototype.
4.4. Discussion
One of the problems which lead to low accuracy ofclusters is poor definition or updating method of prototypesin time-series clustering process, especially in partitioningapproaches. Many clustering algorithms suffer from lowaccuracy of representation methods [77,149]. Moreover, theinaccurate prototype can affect convergence of clusteringalgorithms which results in low quality of obtained clusters[149]. Different approaches of defining prototypes werediscussed in Section 4. In this study, the averaging approachis used in order to find the prototypes of the sub-clustersbecause the used distance metric is a none-elastic distancemetric (ED). Although for the merging purpose, an arbitrarymethod can be used if it is compatible with elastic methodssuch as [158], however for different schemes the simple“medoid” is used as prototype to be compatible with theelasticity of distance metric DTW, with k-Medoids algo-rithm, and also to provide fair condition for evaluation ofthe proposed model with existing approaches.
5. Time-series clustering algorithms
In this section, the existing works related to clustering oftime-series data are concentrated and discussed. Some ofthem are using raw time-series and some try to usereduction methods before clustering of time-series data.As it is demonstrated in Fig. 6, generally clustering can bebroadly classified into six groups: Partitioning, Hierarchical,Grid-based, Model-based, Density-based clustering andMulti-step clustering algorithms. In the following, theapplication of each group in time-series clustering is dis-cussed in detail.
5.1. Hierarchical clustering of time-series
Hierarchal clustering [150] is an approach of cluster analysiswhich makes a hierarchy of clusters using agglomerative ordivisive algorithms. Agglomerative algorithm considers eachitem as a cluster, and then gradually merges the clusters(bottom-up). In contrast, divisive algorithm starts with allobjects as a single cluster and then splits the cluster to reachthe clusters with one object (top-down). In general, hierarch-ical algorithms are weak in terms of quality because theycannot adjust the clusters after splitting a cluster in divisivemethod, or after merging in agglomerative method. As a result,usually hierarchical clustering algorithms are combined withanother algorithm as a hybrid clustering approach to remedythis issue. Moreover, some extended works are done toimprove the performance of hierarchical clustering such as
Fig. 6. Clustering
Chameleon [162], CURE [163] and BIRCH [164] where themerge approach is enhanced or constructed clusters arerefined.
Similarly in hierarchical clustering of time-series, nestedhierarchy of similar groups is generated based on a pair-wisedistance matrix of time-series [165]. Hierarchical clustering hasa great visualization power in time-series clustering [86,166]which makes it an approach to be used for time-seriesclustering to a great extent. For example, Oates, Schmill, andCohen [167] use agglomerative clustering to produce theclusters of the experiences of an autonomous agent. Theyuse Dynamic Time Warping (DTW) as a dissimilarity measurewith a dataset containing 150 trials of real Pioneer data in avariety of experiences. In another study by Hirano andTsumoto [168], the authors use average linkage agglomerativeclustering which is a type of hierarchical approach for time-series clustering. Moreover, in many researches, hierarchical isused to evaluate dimensionality reduction or distance metricdue to its power in visualization. For example, in a study [9],the authors presented Symbolic Aggregate Approximation(SAX) representation and they used hierarchical clustering toevaluate their work. They show that using SAX, hierarchicalclustering has a result similar with Euclidean distance.
Additionally, in contrast to most algorithms, hierarchyclustering does not require the number of clusters as aninitial parameter which is a well-known and outstandingfeature of this algorithm. It is also a strength point in time-series clustering, because usually it is hard to define thenumber of clusters in real world problems. Moreover,despite many algorithms, hierarchical clustering has theability to cluster time-series with unequal length. It ispossible to cluster unequal time-series using this algorithmif an appropriate elastic distance measure such as DynamicTime Warping (DTW) [118,119] or Longest Common Sub-sequence (LCSS) [120,121] is used to compute the dissim-ilarity/similarity of time-series. In fact the reality thatprototypes are not necessary in its process has made thisalgorithm capable to accept unequal time-series. However,hierarchical clustering is essentially not capable to dealeffectively with large time-series [21] due to its quadraticcomputational complexity and accordingly, it leads to berestricted to small datasets because of its poor scalability.
5.2. Partitioning clustering
A partitioning clustering method makes k groups from nunlabelled objects in the way that each group contains atleast one object. One of the most used algorithms of parti-tioning clustering is k-Means [169] where each cluster has aprototype which is the mean value of its objects. The mainidea behind k-Means clustering is the minimization of thetotal distance (typically Euclidian distance) between allobjects in a cluster from their cluster center (prototype).
P: Better accuracy over traditional clusteringalgorithms
S. Aghabozorgi et al. / Information Systems 53 (2015) 16–3828
Prototype in k-Means process is defined as mean vector ofobjects in a cluster. However, when it comes to time-seriesclustering, it is a challenging issue and is not trivial [149].Another member of partitioning family is k-Medoids (PAM)algorithm [150], where the prototype of each cluster is one ofthe nearest objects to the centre of the cluster. Moreover,CLARA and CLARANS [170] are improved version of k-Medoidalgorithm for mining in spatial databases. In both k-Meansand k-Medoids clustering algorithms, number of clusters, k,has to be pre-assigned, which is not available or feasible to bedetermined for many applications, so it is impractical inobtaining natural clustering results and is known as one oftheir drawbacks in static objects [21] and also time-seriesdata [15]. It is even worse in time-series because the datasetsare very large and diagnostic checks for determining thenumber of clusters is not easy. Accordingly, authors in [171]investigate the role of choosing correct initial clusters inquality and time-execution of k-Means in time-series cluster-ing. However, k-Means and k-Medoids are very fast comparedto hierarchical clustering [169,172] and it has made them verysuitable for time-series clustering and has been used in manyworks [18,60,77,112,173].
k-Means and k-Medoids algorithms make clusters whichare constructed in ‘hard’ or ‘crispy’ manner and it meansthat an object is either a member of a cluster or not. On theother hand, FCM (Fuzzy c-Means) algorithm [174,175] andFuzzy c-Medoids algorithm [176] build ‘soft’ clusters. Infuzzy clustering, an object has a degree of membership ineach cluster [177]. Fuzzy partitioning algorithms have beenused for time-series clustering in some areas. For example,in [70], authors use FCM (Fuzzy c-Means) to cluster time-series for speaker verification. In another work [178], theauthors use fuzzy variant to cluster similar object motionsthat were observed in a video collection. They adopt an EM-based algorithm and a mixture of HMMs to cluster time-series data. Then, each time-series is assigned to eachcluster to a certain degree. Moreover, using FCM, authorsin [132] cluster MRI time-series of brain activities. They useraw univariate time-series of equal length. As distance
metric, they use Euclidian distance and cross-correlation.They evaluate their work with different numbers of clusters(k) and recommend using a large number of clusters asinitial clusters. However, it is not defined how they achievethe optimal number of clusters in this work.
Generally, partitioning approaches, whether crispy orfuzzy, need defining prototypes and their accuracy aredirectly depends on the definition of these prototypes andtheir updating method. Hence, they are more compatiblewith finding clusters of similar time-series in time andpreferably with equal length time-series because definingthe prototype for elastic distance measures which handlethe similarity in shape is not very straight forward which isdiscussed in Section 4.
5.3. Model-based clustering
Model-based clustering attempts to recover the originalmodel from a set of data. This approach assumes a model foreach cluster, and finds the best fit of data to that model. Indetail, it presumes that there are some centroids chosen atrandom, and then some noise is added to them with a normaldistribution. The model that is recovered from the generateddata defines clusters [179]. Typically, model-based methodsuse either statistical approaches, e.g., COBWEB [180], or NeuralNetwork approaches, e.g., ART [181] or Self-Organization Map[182]. In some of works in time-series clustering area, authorsuse Self-Organizing Maps (SOM) for clustering of time-seriesdata. As mentioned, SOM is a model-based clustering based onneural networks, which is similar to processing that happensin the brain. For example, in [25], authors use SOM to clustertime-series features. However, because SOM needs to definethe dimension of weight vector, it cannot work well with time-series of unequal length [16]. Additionally, there are a fewarticles which use model based clustering of time-series datawhich are composed of polynomial models [112], Gaussianmixed models [183], ARIMA [106], Markov chain [68] andHidden Markov models [184,185]. In general, model basedclustering has two drawbacks: first, it needs to set parameters
S. Aghabozorgi et al. / Information Systems 53 (2015) 16–38 29
and it is based on user assumptions which may be false andconsequently the result clusters would be inaccurate. Second, ithas a slow processing time (especially neural networks) onlarge datasets [186].
5.4. Density-based clustering
In density based clustering, clusters are subspaces ofdense objects which are separated by subspaces in whichobjects have low density. One of the famous algorithmswhich works by density-based concept is DBSCAN [187]where a cluster is expanded if its neighbours are dense.OPTICS [188] is another density-based algorithm whichaddresses the issue of detecting meaningful clusters in dataof varying density. The model proposed by Chandrakala andChandra [189] is one of the rare cases, where the authorspropose a density based clustering method in kernel featurespace for clustering multivariate time-series data of varyinglength. Additionally they present a heuristic method offnding the initial values of the parameters used in theirproposed algorithm. However, reviewing the literature it isnoticeable that density-based clustering has not been usedbroadly for time-series data clustering because of its ratherhigh complexity.
5.5. Grid-based clustering
The grid-based methods quantize the space into a finitenumber of the cells that form a grid, and then performclustering on the grid’s cells. STING [190] and Wave Cluster[191] are two typical examples of clustering algorithmswhich are based on grid-based concept. To the best of ourknowledge, there is no work in the literature applying grid-based approaches for clustering of time-series. In Table 4 asummary of related works are mentioned based on theadopted representation method, distance measure, cluster-ing algorithm and if it is applicable, definition of prototype.
Considering many works, it was understood that in mostof models, the authors use time-series data as raw data ordimensionality reduced data, with standard traditionalclustering algorithms. It is obvious that this type of analyz-ing time-series which use a brute-force approach withoutany optimization is a proper solution for scientific theories,but not for real world problems, because they are naturallyvery slow or inaccurate in large data bases. As a result, inmany studies the attention of the researchers has drawn tousing more customized algorithms for time-series dataclustering as the ultimate solution.
In the following section, specific approaches are dis-cussed and emphasize is on the solutions which areaddressing the low quality of time-series clustering pro-blems due to the mentioned issues in process of clustering.
5.6. Multi-step clustering
Although there are many studies to improve the qualityof representation approaches, distance measurement, andprototypes, a few articles emphasis on enhancing algo-rithms and present a new model (usually as a hybridmethod) for clustering of time-series data. In the followingthe most related works are presented and discussed:
1.
Cheng-Ping Lai et al. [205] describe the problem of over-looking of information using dimension reduction. Theyclaim that overlooked information could provide differentmeaning in time-series clustering results. To solve thisissue, they adopt a two-level clustering method, whereboth the whole time-series and the subsequence of time-series are taken into account in the first and second levelrespectively. They used SAX transformation as dimensionreduction method and CAST as clustering algorithm in thefirst level in order to group first-level data. In the secondlevel, to measure distances between time-series, DynamicTime Warping (DTW) has been used for varying lengthdata, and Euclidean distance for equal length data. Finally,second-level data, of all the time-series, are then groupedby a clustering algorithm.In this study, the distance measure method used in orderto find the first level result, is not clear while it is of greatimportance, because, for example, if the length of time-series are different (which is a possible case), it will effecton choosing dimension reduction and distance measure-ment methods. Another issue is that the authors haveused CAST algorithm in their proposed approach for twotimes, once for making initial clusters, then for splittingeach cluster into sub-clusters (although they used it 3times in pseudo code). However, using CAST algorithmneeds determining the threshold of affiliation which is avery sensitive parameter in this algorithm [212]. Addition-ally in this work, more granulated time-series are clus-tered which is actually based on the sub-sequenceclustering. However, the work done by Keogh and Lin[73] indicates that subsequence clustering is meaningless.The authors in that work define “meaningless” as whenthe clustering output is independent of the input. Andfinally, their experimental result is not based on thepublished datasets in the literature. Therefore, there isnot a way to compare their method with existingapproaches for time-series clustering.
2.
The authors in [206] also propose a new multi-levelapproach for shape based time-series clustering. In thefirst step, some candidate time-series are chosen from amade one-nearest neighbour network. In order to makethe network of time-series, authors propose triangledistance for calculating similarity between time-seriesdata. Then, hierarchical clustering is performed on cho-sen candidate time-series. To handle the shifts in time-series, Dynamic Time Warping (DTW) is utilized in thesecond step of clustering. Using this approach the size ofdata is reduced by approximately ten per cent.One of the issues in this algorithm is that it needs anearest-neighbour network in the first level while com-plexity of making the nearest-neighbour network is O(n2) which is very high. As a result, they try to reduce thesearch area by using k-Means as pre-clustering of dataand limit the search only in each cluster to reduce thecost of network creation. However, because raw time-series is used in the process of pre-clustering to reducethe size of data, making the network itself is still verycostly. As a result, the complexity of whole clustering ishigh which is not applicable on large datasets.Another problem is that pre-clusters developed in thismodel may not be accurate because the pre-clusters are
S. Aghabozorgi et al. / Information Systems 53 (2015) 16–3830
constructed by a non-elastic distance measure on rawtime-series and it may be affected by outliers.Although the experimental results are based on twosyntactic datasets, however, the results should be testedon more datasets [6] because characteristics of time-seriesvaries in different data-sets from different domains.Finally, the error rate of choosing the candidates iscomputed but the quality of the final clusters has notmeasured using any standard and common metrics to becomparable with other methods.
3.
In a group of works, an incremental clustering approachis adopted which exploit the multi-resolution character-istic of time-series data to cluster them in multi-step, forinstance, Vlachos et al. [165] developed a method basedon standard k-Means and Discrete Wavelet Transform(DWT) decomposition to cluster time-series data. Theyextended the k-Means algorithm to perform clustering oftime-series incrementally at different resolutions ofDWT decomposition. At first, they use Haar wavelettransformations to decompose all the time-series. Afterthat, they apply the k-Means clustering on variousregulations from a chaos to a finer level. At the end ofeach level, the extracted centers are reused as the initialcenters for the next level of resolution. They doubled thecenter coordinates of each level because the length of atime-series is doubled in next level. In this algorithm,more and more detail are used during the clusteringprocess. In order to compute the clustering error, theycomputed clustering error at the end of each level bysumming up the number of objects clustered incorrectlydivided by the cardinality of the dataset. In anothersimilar work, Lin et al. [18] generalized this work andpresented an anytime version of the partitioned cluster-ing algorithm (k-mean and EM) for time-series. In thismethod also, authors use the multi-resolution propertyof wavelets in their algorithm. Following these works,Lin et al. in [213] present a multi-resolution clusteringapproach based on multi-resolution PAA (MPAA) for theincremental clustering algorithm of time-series.Considering speed of clustering these approaches arequite good, however, in all these models, it is not clearthat to what level it should be continued (the termina-tion point). Additionally, in each iteration, all the time-series which are in the same resolution are re-clusteredagain. Therefore, the noise in some of them can affect thewhole process. Moreover, this model is applicable onlyfor partitioning clustering, which implies that it is notworking for other types of algorithms such as arbitraryshape algorithms or hierarchical algorithms in the casewhere user needs the structure of data (the hierarchy ofclusters). Another problem which these models shouldresolve is working with distance measures such as DTWwhich at first, are very costly and cannot be applied onwhole dataset, and secondly, defining the prototypesusing them is not a trivial task.
4.
A new approach presented recently by Aghabozorgi andWah [62] on co-movement of the stock market by usinga three-phase method: (1) pre-clustering of time series;(2) purifying and summarization; and (3) merging. Thisnew 3-PhaseTime series Clustering model (3PTC), canconstruct the clusters based on similarity in shape. This
model facilitates the accurate clustering of time seriesdata sets and is designed specifically for very large timeseries data sets. In the first phase of the model, data arepre-processed, transformed into a low dimensionalspace, and grouped approximately. Then, the pre-clustered time series are refined in the second phaseusing an accurate clustering method, and are repre-sented by some prototypes. Finally, in the third phase,the prototypes are merged to construct the ultimateclusters. To evaluate the accuracy of the proposed model,the 3PTC is tested extensively using published timeseries data sets from diverse domains. results show theadvantage of the proposed method wherein the analysisallows better prediction and understanding of the co-movement of companies even with local shifts.
5.
In another work [211], a hybrid clustering algorithmcalled Two-step Time series Clustering (TTC) algorithmis proposed based on the similarity in shape of timeseries data. In this method, time series data are firstgrouped as subclusters based on similarity in time.Thesubclusters are then merged using the k-Medoids algo-rithm based on similarity in shape.This model has twocontributions, first it is more accurate than other con-ventional and hybrid approaches and second, it deter-mines the similarity in shape among time series datawith a low complexity. To evaluate the accuracy of theproposed model, the model is tested extensively usingsyntactic and real-world time series datasets. The resutlsin the experiments with various datasets and withdifferent evaluation methods, show that TTC outper-forms other conventional and hybrid clustering.
6. Time-series clustering evaluation measures
In this section evaluation method for clustering algorimsare discussed. Keogh and Kasetty [6] have made an inter-esting research on different articles in time-series miningand conclude that the evaluation of time-series miningshould follow some disciplines which are recommended as:
�
The validation of algorithms should be performed onvarious ranges of datasets (unless the algorithm iscreated only for a specific set). The used dataset shouldbe published and freely available
�
Implementation bias must be avoided by careful designof the experiments
�
If possible, data and algorithms should be freely provided � New methods of similarity measures should be compared
with simple and stable metrics such as Euclidean distance.
In general, evaluating of extracted clusters is not easy inthe absence of data labels [26] and it is still an openproblem. The definition of clusters depends on the user,the domain, and it is subjective. For example, the number ofclusters, the size of clusters, definition for outliers, anddefinition of the similarity among the time-series in aproblem are all the concepts which depend on the task athand and should be declared subjectively. These have madethe time-series clustering a big challenge in the data miningdomain. However, owing to the classified data labelled by
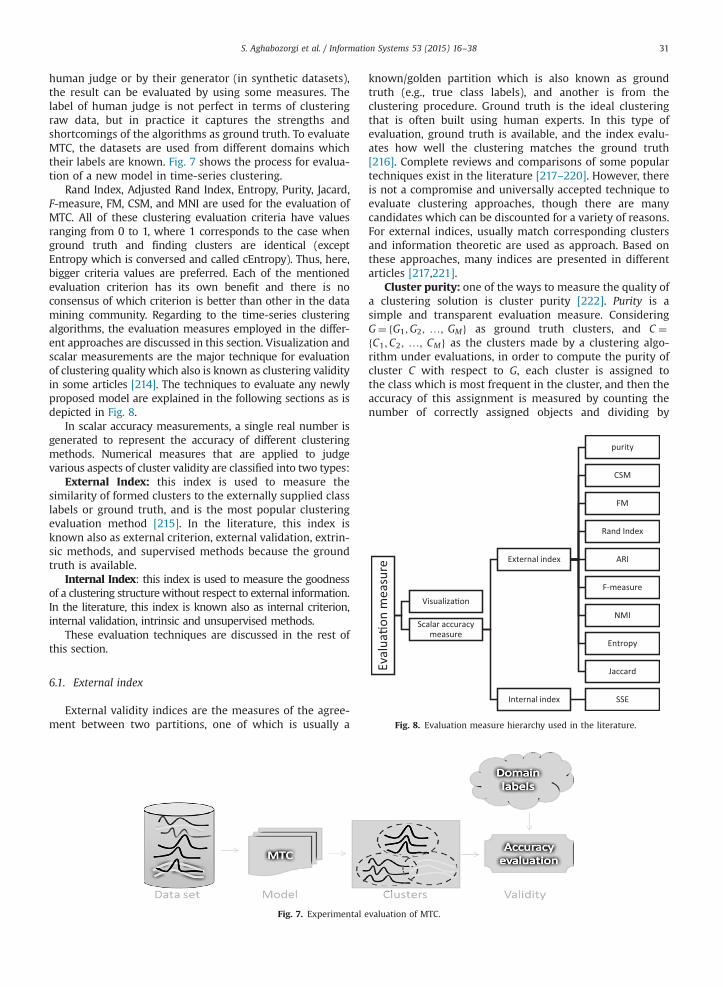
Fig. 8. Evaluation measure hierarchy used in the literature.
S. Aghabozorgi et al. / Information Systems 53 (2015) 16–38 31
human judge or by their generator (in synthetic datasets),the result can be evaluated by using some measures. Thelabel of human judge is not perfect in terms of clusteringraw data, but in practice it captures the strengths andshortcomings of the algorithms as ground truth. To evaluateMTC, the datasets are used from different domains whichtheir labels are known. Fig. 7 shows the process for evalua-tion of a new model in time-series clustering.
Rand Index, Adjusted Rand Index, Entropy, Purity, Jacard,F-measure, FM, CSM, and MNI are used for the evaluation ofMTC. All of these clustering evaluation criteria have valuesranging from 0 to 1, where 1 corresponds to the case whenground truth and finding clusters are identical (exceptEntropy which is conversed and called cEntropy). Thus, here,bigger criteria values are preferred. Each of the mentionedevaluation criterion has its own benefit and there is noconsensus of which criterion is better than other in the datamining community. Regarding to the time-series clusteringalgorithms, the evaluation measures employed in the differ-ent approaches are discussed in this section. Visualization andscalar measurements are the major technique for evaluationof clustering quality which also is known as clustering validityin some articles [214]. The techniques to evaluate any newlyproposed model are explained in the following sections as isdepicted in Fig. 8.
In scalar accuracy measurements, a single real number isgenerated to represent the accuracy of different clusteringmethods. Numerical measures that are applied to judgevarious aspects of cluster validity are classified into two types:
External Index: this index is used to measure thesimilarity of formed clusters to the externally supplied classlabels or ground truth, and is the most popular clusteringevaluation method [215]. In the literature, this index isknown also as external criterion, external validation, extrin-sic methods, and supervised methods because the groundtruth is available.
Internal Index: this index is used to measure the goodnessof a clustering structure without respect to external information.In the literature, this index is known also as internal criterion,internal validation, intrinsic and unsupervised methods.
These evaluation techniques are discussed in the rest ofthis section.
6.1. External index
External validity indices are the measures of the agree-ment between two partitions, one of which is usually a
Fig. 7. Experimental e
known/golden partition which is also known as groundtruth (e.g., true class labels), and another is from theclustering procedure. Ground truth is the ideal clusteringthat is often built using human experts. In this type ofevaluation, ground truth is available, and the index evalu-ates how well the clustering matches the ground truth[216]. Complete reviews and comparisons of some populartechniques exist in the literature [217–220]. However, thereis not a compromise and universally accepted technique toevaluate clustering approaches, though there are manycandidates which can be discounted for a variety of reasons.For external indices, usually match corresponding clustersand information theoretic are used as approach. Based onthese approaches, many indices are presented in differentarticles [217,221].
Cluster purity: one of the ways to measure the quality ofa clustering solution is cluster purity [222]. Purity is asimple and transparent evaluation measure. ConsideringG¼ fG1;G2; …; GMg as ground truth clusters, and C ¼fC1;C2; …; CMg as the clusters made by a clustering algo-rithm under evaluations, in order to compute the purity ofcluster C with respect to G, each cluster is assigned tothe class which is most frequent in the cluster, and then theaccuracy of this assignment is measured by counting thenumber of correctly assigned objects and dividing by
valuation of MTC.
S. Aghabozorgi et al. / Information Systems 53 (2015) 16–3832
number of objects in the cluster. A bad clustering has purityvalue close to 0, and a perfect clustering has a purity of 1.However, high purity is easy to achieve when the number ofclusters is large, in particular, purity is 1 if each objects getsits own cluster. Thus, one cannot only rely on purity as thequality measure. Purity was used for evaluation of time-series clustering in different studies [4,21].
�
Cluster Similarity Measure (CSM): CSM [16] is a simplemetric used for validity of clusters in time-series domain[18,26,107,223].
�
Folkes and Mallow index (FM): This metric is the indexfor computing the accuracy of time-series clustering inmultimedia domain [26,83].
�
Jaccard Score: Jaccard [224] is one of the metrics that hasbeen used in various studies as external index [22,26,83].
�
Rand index (RI): A popular quality measure [22,26,83]for evaluation of time-series clusters is the Rand index[225,226], which measures the agreement between twopartitions and shows how much clustering results areclose to the ground truth.
�
Adjusted Rand Index (ARI): RI does not take a constantvalue (such as zero) two random clustering. Hence, in[227], authors suggest a corrected-for-chance version ofthe RI which works better than RI and many otherindices [228,229]. This approach was used in geneexpression domain successfully [230,231].
�
F-measure: F-measure [232] is a well-established mea-sure for assessing the quality of any given clusteringsolution with respect to ground truth. F-measure com-pares how closely each cluster matches a set of categoriesof ground truth. F-measure has been used in clustering oftime-series data [22,66,233,234] and in natural languageprocessing for evaluating clustering [235].
�
Normalized Mutual Information (NMI): as mentioned,high purity in the large number of clusters is a drawbackof purity measure. In order to make trade-off between thequality of the clustering against the number of clusters,NMI [236] is utilized as quality measure.in various studies[26,237,238]. Moreover, NMI can be used to compareclustering approaches with different numbers of clusters,because this measure is normalized [216].
�
Entropy: entropy [239,240] of a cluster shows howdispersed classes are with a cluster (this should below). Entropy is a function of the distribution of classesin the resulting clusters.
In short, one of the most popular approaches for qualityevaluation of clusters is external indices to find how good thefinding cluster results are [215] which also is used forevaluation of the proposed models in this study. However, itis not directly applicable in real-life unsupervised tasks,because the ground truth is not available for all datasets.Therefore, in the case that ground truth is not available,internal index is used which is discussed in following section.
6.2. Internal index
Typical objective functions in clustering, formalize the goalof attaining high intra-cluster similarity (objects within a
cluster are similar) and low inter-cluster similarity (objectsfrom different clusters are dissimilar). Internal validationcompares solutions based on the goodness of fit between eachclustering and the data. Internal validity indices evaluateclustering results by using only features and informationinherent in a dataset. They are usually used in the case thattrue solutions (ground truth) are unknown. However, thisindex can only make comparisons between different clusteringapproaches that are generated using the same model/metric.Otherwise, it makes assumptions about cluster structure.
There are many internal indices such as Sum of SquaredError, Silhouette index, Davies-Bouldin, Calinski-Harabasz,Dunn index, R-squared index, Hubert-Levin (C-index),Krzanowski-Lai index, Hartigan index, Root-Mean-Square Stan-dard Deviation (RMSSTD) index, Semi-Partial R-squared (SPR)index, Distance between two clusters (CD) index, Weightedinter-intra index, Homogeneity index, and Separation index.Sum of Squared Error (SSE) is an objective function thatdescribes the coherence of a given cluster, “better” clustersare expected to give lower SSE values [241]. For evaluation ofclusters in terms of accuracy, the Sum of Squared Error (SSE)can be used as the most common measure in different works[18,165]. For each time-series, the error is the distance to thenearest cluster.
7. Conclusion
Although different researches have been conducted ontime-series clustering, the unique characteristics of time-series data are barriers that fail most of conventionalclustering algorithms to work well for time-series. Inparticular, the high dimensionality, very high feature corre-lation, and typically large amount of noise that characterizetime-series data have been viewed as an interestingresearch challenge in time-series clustering. Accordingly,most of the studies in the literature have concentrated ontwo subroutines of clustering:
1.
A vast number of researches have focused on high dimen-sional characteristic of time-series data and tried to presenta way of representing time-series in a lower dimensioncompatible with conventional clustering algorithms.
2.
Different efforts have been taken on presenting a dis-tance measurement based on raw time-series or therepresented data.
The common characteristic in both above approaches isclustering of the transferred, extracted or raw time-seriesusing conventional clustering algorithms such as k-Means,k-Medoid or hierarchical clustering. However, most of themsuffer from neglecting the data which is caused by dimen-sionality reduction, inaccurate similarity calculation due tohigh complexity of accurate measures, and lack of quality inclustering algorithms because of their nature which issuitable for static data.
Highlighting the four representation methods discussed inthis article it can be concluded that the main goal of dataadaptive methods is to minimize the global reconstructionerror using arbitrary length segments. They are better inapproximating each series but when there is several time-
Fig. 9. four aspect of studying time-series clustering.
S. Aghabozorgi et al. / Information Systems 53 (2015) 16–38 33
series they face difficulty. At the other hand, non-dataadaptive methods are suitable for the fixed size time-seriesand model based approaches represent the time series instochastic ways. In these three approaches user can define thecompression-ratio based on the application in hand while indata dictated approaches, the compression-ratio is definedautomatically based on raw time-series.
At the other hand, one of the important challenges inchoosing representation methods is to have a compatibleand appropriate similarity measure. Reviewing and compar-ing available similarity measures in this study revealed thatthe most effective and accurate approaches are those whichare based on dynamic programming (DP) which are expen-sive in computation and their complexity needs to be tunedand handled before application. After all, literature showsthat the most popular similarity measures in time-seriesclustering are Euclidean distance and DTW.
Another challenging issue which can affect the accuracyof clustering is choosing the appropriate prototype. Themost commonly used prototype is medoid while usingAveraging method is scarce, because it is limited to be usedfor time-series with equal length and with using non-elasticdistance measures. After all, results show that the bestclustering accuracy among other prototypes mentioned inthis study belong to the local search prototype.
Finally reviewing time-series clustering algorithms revealsthat comparing to other algorithms; partitioning algorithmsare widely used because of their fast response. However, as thenumber of clusters needs to be pre-assigned, these algorithmsare not applicable in most real world applications. In addition,because of their dependency to prototypes, they are moresuitable for clustering equal length time-series. Hierarchicalclustering at the other hand doesn’t need the number ofclusters to be pre-defined and also it has a great visualizationpower in time-series clustering and is a prefect tool forevaluation of dimensionality reduction or distance metricsand also the ability to cluster time-series with unequal lengthis its other superiority in comparison to partitioning algorithmsas well. But hierarchical clustering is restricted to the smalldatasets because of its quadratic computational complexity.Model based and density based algorithms usage is scarce forthe same problem of slow process and high complexity. Inaddition model based algorithms are suffering from theirdependence on user assumptions for parameters. Recently
few studies are focusing on improving and enhancing algo-rithms by representing newmodels which are mostly based oncombination of different algorithms as hybrid or multistepclustering algorithms.
Further research works on time-series representationcan address unattended or barely attended areas such asmultivariate time series data with different length,unevenly sampled data and discrete valued time-series. Interms of similarity measures, many of proposed similaritymeasures do not show any improvements to Euclideandistance and as experiments in [6] shows their error ratesare even worse. Consequently still the need for more precisesimilarity measure is not fulfilled. The same story goes tocluster prototypes, although a lot of studies are conducted,still none of them could beat the medoid and averagingprototypes which are the most used approaches.
Actually, by assuming that time-series clustering can beimproved by advancements in four different aspects as isrepresented in Fig. 9, considering the literature, it can beconcluded that most of the studies are focusing on improv-ing representation methods, distance measurement meth-ods, and prototypes while the portion of enhancingclustering approaches is approximately less than 10% incomparison with other parts:
Among a few approaches and algorithms which have beenproposed for time-series clustering, there are some studieswhich have taken explicit or implicit strategies for increasingthe quality (considering the scalability). However, as clusteringapproaches are either accurate which are constructed expen-sively, or inaccurate but made inexpensively, one still can seethe problem of low quality or lack of meaningfulness in theclusters. In brief, although there are opportunities for improve-ment in all four aspect of time-series clustering, it can beconcluded that the main opportunity for future works in thisfiled could be working on new hybrid algorithms with usingexisting or new clustering approaches in order to balance thequality and the expenses of clustering time-series.
Acknowledgements
This research is supported by University of MalayaResearch Grant no vote RP0061-13ICT.
S. Aghabozorgi et al. / Information Systems 53 (2015) 16–3834
References
[1] P. Rai, S. Singh, A survey of clustering techniques, Int. J. Comput. Appl.7 (12) (2010) 1–5.
[2] V. Niennattrakul, C. Ratanamahatana, On clustering multimedia timeseries data using k-means and dynamic time warping, in: Proceedingsof the International Conference on Multimedia and Ubiquitous Engi-neering, 2007, MUE ’07, 2007, pp. 733–738.
[3] C. Ratanamahatana, Multimedia retrieval using time series repre-sentation and relevance feedback, in: Proceedings of 8th Interna-tional Conference on Asian Digital Libraries (ICADL2005), 2005,pp. 400–405.
[4] C. Ratanamahatana, V. Niennattrakul, Clustering multimedia datausing time series, in: Proceedings of the International Conference onHybrid Information Technology, 2006, ICHIT ’06, 2006, pp. 372–379.
[5] J. Lin, E. Keogh, S. Lonardi, J. Lankford, D. Nystrom, Visually miningand monitoring massive time series, in: Proceedings of 2004 ACMSIGKDD International Conference on Knowledge Discovery and dataMining – KDD ’04, 2004, p. 460.
[6] E. Keogh, S. Kasetty, On the need for time series data miningbenchmarks: a survey and empirical demonstration, Data Min.Knowl. Discov. 7 (4) (2003) 349–371.
[7] K. Haigh, W. Foslien, and V. Guralnik, Visual query language: findingpatterns in and relationships among time series data, SeventhWorkshop on Mining Scientific And Engineering Datasets, 2004,pp. 324–332.
[8] E. Keogh, S. Chu, D. Hart, Segmenting time series: a survey and novelapproach, Data Min. Time Ser. Databases 57 (1) (2004) 1–21.
[9] J. Lin, E. Keogh, S. Lonardi, and B. Chiu, A symbolic representation oftime series, with implications for streaming algorithms, in: Proceed-ings of 8th ACM SIGMOD Workshop on Research Issues Data Miningand Knowledge Discovery – DMKD ’03, 2003, p. 2.
[10] J. Zakaria, S. Rotschafer, A. Mueen, K. Razak, E. Keogh, Mining massivearchives of mice sounds with symbolized representations, in:SIGKDD, 2012, pp. 1–10.
[11] T. Rakthanmanon, A.B. Campana, G. Batista, J. Zakaria, E. Keogh,Searching and mining trillions of time series subsequences underdynamic time warping, in: proceedings of the Conference on Knowl-edge Discovery and Data Mining, 2012, pp. 262–270.
[12] E. Keogh, A decade of progress in indexing and mining large timeseries databases, in: Proceedings of the International Conference onVery Large Data Bases (VLDB), 2006, pp. 1268–1268.
[13] S. Laxman, P.S. Sastry, A survey of temporal data mining, Sadhana 31(2) (2006) 173–198.
[14] V. Kavitha, M. Punithavalli, Clustering time series data stream—aliterature survey, Int. J. Comput. Sci. Inf. Secur. 8 (1) (2010)arxiv:1005.4270.
[15] C. Antunes, A.L. Oliveira, Temporal data mining: an overview, in: KDDWorkshop on Temporal Data Mining, 2001, pp. 1–13.
[16] T. Warrenliao, Clustering of time series data—a survey, PatternRecognit. 38 (11) (2005) 1857–1874.
[17] S. Rani, G. Sikka, Recent techniques of clustering of time series data: asurvey, Int. J. Comput. Appl 52 (15) (2012) 1–9.
[18] J. Lin, M. Vlachos, E. Keogh, D. Gunopulos, Iterative incrementalclustering of time series, Adv. Database Technol 2004 (2004)521–522.
[19] R. Kumar, P. Nagabhushan, Time series as a point—a novel approachfor time series cluster visualization in: Proceedings of the Conferenceon Data Mining, 2006, pp. 24–29.
[20] C. Faloutsos, M. Ranganathan, Y. Manolopoulos, Fast subsequencematching in time-series databases, ACM SIGMOD Rec. 23 (2) (1994)419–429.
[21] X. Wang, K. Smith, R. Hyndman, Characteristic-based clustering fortime series data, Data Min. Knowl. Discov. 13 (3) (2006) 335–364.
[22] M. Chiş, S. Banerjee, A.E. Hassanien, Clustering time series data: anevolutionary approach, Found. Comput. Intell. 6 (1) (2009) 193–207.
[23] J. Lin, E. Keogh, W. Truppel, Clustering of streaming time series ismeaningless, in: Proceedings of 8th ACM SIGMOD Workshop onResearch Issues Data Mining and Knowlegde Discovery DMKD 03,2003, p. 56.
[24] E. Keogh, M. Pazzani, K. Chakrabarti, S. Mehrotra, A simple dimen-sionality reduction technique for fast similarity search in large timeseries databases, Knowl. Inf. Syst. 1805 (1) (2000) 122–133.
[25] X. Wang, K.A. Smith, R. Hyndman, D. Alahakoon, A Scalable Methodfor Time Series Clustering, 2004.
[26] H. Zhang, T.B. Ho, Y. Zhang, M.S. Lin, Unsupervised feature extractionfor time series clustering using orthogonal wavelet transform,Informatica 30 (3) (2006) 305–319.
[27] H. Wang, W. Wang, J. Yang, P.P.S. Yu, Clustering by pattern similarityin large data sets, in: Proceedings of 2002 ACM SIGMOD Interna-tional Conference Management data – SIGMOD ’02, vol. 2, 2002,p. 394.
[28] G. Das, K.I. Lin, H. Mannila, G. Renganathan, P. Smyth, Rule discoveryfrom time series,, Knowl. Discov. Data Min 98 (1998) 16–22.
[29] T.C. Fu, F.L. Chung, V. Ng, R. Luk, Pattern discovery from stock timeseries using self-organizing maps, in: Workshop Notes of KDD2001Workshop on Temporal Data Mining, 2001, pp. 26–29.
[30] B. Chiu, E. Keogh, S. Lonardi, Probabilistic discovery of time seriesmotifs, in: Proceedings of the Ninth ACM SIGKDD InternationalConference on Knowledge Discovery and Data Mining, 2003,pp. 493–498.
[31] E. Keogh, S. Lonardi, B.Y. Chiu, Finding surprising patterns in a timeseries database in linear time and space, in: Proceedings of theEighth ACM SIGKDD, 2002, pp. 550–556.
[32] P.K. Chan, M.V. Mahoney, Modeling multiple time series for anomalydetection, in: Proceedings of Fifth IEEE International Conference onData Mining, 2005, pp. 90–97.
[33] L. Wei, N. Kumar, V. Lolla, E. Keogh, Assumption-free anomalydetection in time series, in: Proceedings of the 17th InternationalConference on Scientific and Statistical Database Management, 2005,pp. 237–240.
[34] M. Leng, X. Lai, G. Tan, X. Xu, Time series representation for anomalydetection, in: Proceedings of 2nd IEEE International Conference onComputer Science and Information Technology, 2009, ICCSIT 2009,2009, pp. 628–632.
[35] P.M. Polz, E. Hortnagl, E. Prem, Processing and Clustering Time Seriesof Mobile Robot Sensory Data. Technical Report, ÖsterreichischesForschungsinstitut für Artificial Intelligence, Wien, TR-2003-10,2003, 2003.
[36] W. He, G. Feng, Q. Wu, T. He, S. Wan, J. Chou, A new method forabrupt dynamic change detection of correlated time series,, Int. J.Climatol. 32 (10) (2011) 1604–1614.
[37] A. Sfetsos, C. Siriopoulos, Time series forecasting with a hybridclustering scheme and pattern recognition, IEEE Trans. Syst. ManCybern 34 (3) (2004) 399–405.
[38] N. Pavlidis, V.P. Plagianakos, D.K. Tasoulis, M.N. Vrahatis, Financialforecasting through unsupervised clustering and neural networks,Oper. Res. 6 (2) (2006) 103–127.
[39] F. Ito, T. Hiroyasu, M. Miki, H. Yokouchi, Detection of Preference ShiftTiming using Time-Series Clustering, 2009, pp. 1585–1590.
[40] D. Graves, W. Pedrycz Proximity fuzzy clustering and its applicationto time series clustering and prediction in: Proceedings of the 201010th International Conference on Intelligent Systems Design andApplications ISDA10, 2010, pp. 49–54.
[41] U. Rebbapragada, P. Protopapas, C.E. Brodley, C. Alcock, Findinganomalous periodic time series, Mach. Learn. 74 (3) (2009)281–313.
[42] N. Subhani, L. Rueda, A. Ngom, C.J. Burden, Multiple gene expressionprofile alignment for microarray time-series data clustering, Bioin-formatics 26 (18) (2010) 2281–2288.
[43] A. Fujita, P. Severino, K. Kojima, J.R. Sato, A.G. Patriota, S. Miyano,Functional clustering of time series gene expression data by Grangercausality, BMC Syst. Biol. 6 (1) (2012) 137.
[44] C. Möller-Levet, F. Klawonn, K.H. Cho, O. Wolkenhauer, Fuzzyclustering of short time-series and unevenly distributed samplingpoints, Adv. Intell. Data Anal. (2003) 330–340.
[45] J. Ernst, G.J. Nau, Z. Bar-Joseph, Clustering short time series geneexpression data, Bioinforma. 21 (Suppl. 1) (2005) i159–i168. 21.
[46] Mikhail Pyatnitskiy, I. Mazo, M. Shkrob, E. Schwartz, E. Kotelnikova,Clustering gene expression regulators: new approach to diseasesubtyping, PLoS One 9 (1) (2014) e84955.
[47] M. Steinbach, P.N. Tan, V. Kumar, S. Klooster, and C. Potter, Discoveryof climate indices using clustering, in: Proceedings of the Ninth ACMSIGKDD International Conference on Knowledge Discovery And dataMining, 2003, pp. 446–455.
[48] M. Ji, F. Xie, Y. Ping, A dynamic fuzzy cluster algorithm for timeseries, Abstr. Appl. Anal. 2013 (2013) 1–7.
[49] M.A. Elangasinghe, N. Singhal, K.N. Dirks, J.A. Salmond,S. Samarasinghe, Complex time series analysis of PM10 and PM2.5for a coastal site using artificial neural network modelling and k-means clustering, Atmos. Environ. 94 (2014) 106–116.
[50] K. Košmelj, V. Batagelj, Cross-sectional approach for clustering timevarying data, J. Classif 7 (1) (1990).
[51] F. Iglesias, W. Kastner, Analysis of similarity measures in times seriesclustering for the discovery of building energy patterns, Energies 6(2) (2013) 579–597.
S. Aghabozorgi et al. / Information Systems 53 (2015) 16–38 35
[52] M.G. Scotto, A.M. Alonso, S.M. Barbosa, Clustering time series of sealevels: extreme value approach, J. Waterw. Port, Coastal, Ocean Eng.136 (4) (2010) 215–225.
[53] R.H.R. Shumway, Time-frequency clustering and discriminant analy-sis, Stat. Probab. Lett 63 (3) (2003) 307–314.
[54] Shen Liu, E.A. Maharaj, B. Inder, Polarization of forecast densities: anew approach to time series classification, Comput. Stat. Data Anal.70 (2014) 345–361.
[55] Y. Sadahiro, T. Kobayashi, Exploratory analysis of time series data:detection of partial similarities, clustering, and visualization, Com-put. Environ. Urban Syst. 45 (2014) 24–33.
[56] M. Gorji Sefidmazgi, M. Sayemuzzaman, A. Homaifar, M.K. Jha,S. Liess, Trend analysis using non-stationary time series clusteringbased on the finite element method, Nonlinear Process. Geophys. 21(3) (2014) 605–615.
[57] M. Kumar, N.R. Patel, Clustering seasonality patterns in the presenceof errors, in: Proceedings of Eighth ACM SIGKDD, 2002, pp. 557–563.
[58] A.J. Bagnall, G. Janacek, B. De la Iglesia, M. Zhang, Clustering timeseries from mixture polynomial models with discretised data in:Proceedings of the Second Australasian Data Mining Workshop,2003, pp. 105–120.
[59] H. Guan, Q. Jiang, Cluster financial time series for portfolio, in:Proceedings of the International Conference on Wavelet Analysis andPattern Recognition, 2007, pp. 851–856.
[60] C. Guo, H. Jia, N. Zhang, Time series clustering based on ICA for stockdata analysis, in: Proceedings of 4th International Conference onWireless Communications, Networking and Mobile Computing,2008. WiCOM ’08, 2008, pp. 1–4.
[61] A. Stetco, X. Zeng, J. Keane, Fuzzy cluster analysis of financial timeseries and their volatility assessment, in: Proceedings of 2013 IEEEInternational Conference on Systems, Man, and Cybernetics, 2013,pp. 91–96.
[62] S. Aghabozorgi, T. Ying Wah, Stock market co-movement assessmentusing a three-phase clustering method, Expert Syst. Appl. 41 (4)(2014) 1301–1314.
[63] Y.-C. Hsu, A.-P. Chen, A clustering time series model for the optimalhedge ratio decision making, Neurocomputing 138 (2014) 358–370.
[64] A. Wismüller, O. Lange, D.R. Dersch, G.L. Leinsinger, K. Hahn, B. Pütz,D. Auer, Cluster analysis of biomedical image time-series, Int. J.Comput. Vis 46 (2) (2002) 103–128.
[65] M. van den Heuvel, R. Mandl, Pol, H. Hulshoff, Normalized cut groupclustering of resting-state fMRI data, PLoS One 3 (4) (2008) e2001.
[66] F. Gullo, G. Ponti, A. Tagarelli, G. Tradigo, P. Veltri, A time seriesapproach for clustering mass spectrometry data, J. Comput. Sci. 3 (5)(2011) 344–355. 2010.
[67] V. Kurbalija, J. Nachtwei, C. Von Bernstorff, C. von Bernstorff, H.-D.Burkhard, M. Ivanović, L. Fodor, Time-series mining in a psychologi-cal domain, in: Proceedings of the Fifth Balkan Conference inInformatics, 2012, pp. 58–63.
[68] M. Ramoni, P. Sebastiani, P. Cohen, Multivariate clustering bydynamics, in :Proceedings of the national Conference on ArtificialIntelligence, 2000, pp. 633–638.
[69] Gopalapillai, Radhakrishnan, D. Gupta, T.S.B. Sudarshan, Experimen-tation and analysis of time series data for rescue robotics, Recent AdvIntell Inf 253 (2014) 443–453.
[70] D. Tran, M. Wagner, Fuzzy c-means clustering-based speaker ver-ification, Adv. Soft Comput. 2002 2275 (2002) 363–369.
[71] Fong, Simon, Using hierarchical time series clustering algorithm andwavelet classifier for biometric voice classification, J. Biomed. Bio-technol. (2012) 215019.
[72] J. Zhu, B. Wang, B. Wu, Social network users clustering based onmultivariate time series of emotional behavior, J. China Univ. PostsTelecommun 21 (2) (2014) 21–31.
[73] E. Keogh, J. Lin, Clustering of time-series subsequences is mean-ingless: implications for previous and future research, Knowl. Inf.Syst. 8 (2) (2005) 154–177.
[74] A. Gionis, H. Mannila, Finding recurrent sources in sequences, in:Proceedings of the Seventh Annual International Conference onRESEARCH in Computational Molecular Biology, 2003, pp. 123–130.
[75] A. Ultsch, F. Mörchen, ESOM-Maps: Tools for Clustering, Visualiza-tion, and Classification with Emergent SOM, 2005.
[76] F. Morchen, A. Ultsch, F. Mörchen, O. Hoos, Extracting interpretablemuscle activation patterns with time series knowledge mining, J.Knowl. BASED 9 (3) (2005) 197–208.
[77] V. Hautamaki, P. Nykanen, P. Franti, Time-series clustering byapproximate prototypes, in: Proceedings of 19th InternationalConference on Pattern Recognition, 2008, ICPR 2008, 2008, no. D,pp. 1–4.
[78] M. Vlachos, D. Gunopulos, G. Das, “Indexing time-series underconditions of noise,”, in: M. Last, A. Kandel, H. Bunke (Eds.), DataMining in Time Series Databases, World Scientific, Singapore, 2004,p. 67.
[79] T. Mitsa, Temporal Data Mining, vol. 33, Chapman & Hall/CRC Taylorand Francis Group, Boca Raton, FL, 2009.
[80] E. Keogh, Hot sax: efficiently finding the most unusual time seriessubsequence, in: Proceedings of Fifth IEEE International Conferenceon Data Mining ICDM05, 2005, pp. 226–233.
[81] E. Ghysels, P. Santa-Clara, R. Valkanov, Predicting volatility: gettingthe most out of return data sampled at different frequencies,J. Econom 131 (1–2) (2006) 59–95.
[82] G. Duan, Y. Suzuki, K. Kawagoe, Grid representation of time seriesdata for similarity search, in: The institute of Electronic, Information,and Communication Engineer, 2006.
[83] C. Ratanamahatana, E. Keogh, A.J. Bagnall, S. Lonardi, A novel bit leveltime series representation with implications for similarity searchand clustering, in: Proceedings of 9th Pacific-Asian InternationalConference on Knowledge Discovery and Data Mining (PAKDD’05),2005, pp. 771–777.
[84] J. Lin, E. Keogh, L. Wei, S. Lonardi, Experiencing SAX: a novelsymbolic representation of time series”, Data Min. Knowl. Discov.15 (2) (2007) 107–144.
[85] K. Chan, A.W. Fu, Efficient time series matching by wavelets, in:Proceedings of 1999 15th International Conference on Data Engi-neering, vol. 15, no. 3, 1999, pp. 126–133.
[86] E. Keogh, M. Pazzani, An enhanced representation of time serieswhich allows fast and accurate classification, clustering and rele-vance feedback, in: Proceedings of the 4th International Conferenceof Knowledge Discovery and Data Mining, 1998, pp. 239–241.
[87] E. Keogh, K. Chakrabarti, M. Pazzani, S. Mehrotra, Locally adaptivedimensionality reduction for indexing large time series databases,,ACM SIGMOD Rec 27 (2) (2001) 151–162.
[88] I. Popivanov, R.J. Miller, Similarity search over time-series data usingwavelets, in: ICDE ’02: Proceedings of the 18th International Con-ference on Data Engineering, 2002, pp. 212–224.
[89] Y.L. Wu, D. Agrawal, A. El Abbadi, “ comparison of DFT and DWTbased similarity search in time-series databases, in: Proceedings ofthe Ninth International Conference on Information and KnowledgeManagement, 2000, pp. 488–495.
[90] B.K. Yi, C. Faloutsos, Fast time sequence indexing for arbitrary Lpnorms, in: Proceedings of the 26th International Conference on VeryLarge Data Bases, 2000, pp. 385–394.
[91] H. Ding, G. Trajcevski, P. Scheuermann, X. Wang, E. Keogh, Queryingand mining of time series data: experimental comparison of repre-sentations and distance measures,, Proc. VLDB Endow 1 (2) (2008)1542–1552.
[92] A.A.J. Bagnall, C. “Ann” Ratanamahatana, E. Keogh, S. Lonardi,G. Janacek, A bit level representation for time series data miningwith shape based similarity, Data Min. Knowl. Discov. 13 (1) (2006)11–40.
[93] J. Shieh, E. Keogh, iSAX: disk-aware mining and indexing of massivetime series datasets, Data Min. Knowl. Discov. 19 (1) (2009) 24–57.
[94] X. Wang, A. Mueen, H. Ding, G. Trajcevski, P. Scheuermann, E. Keogh,Experimental comparison of representation methods and distancemeasures for time series data, Data Min. Knowl. Discov. (2012)p. Springer Netherlands,.
[95] Y. Morinaka, M. Yoshikawa, T. Amagasa, S. Uemura, The L-index: anindexing structure for efficient subsequence matching in timesequence databases, in: Proceedings of 5th PacificAisa Conferenceon Knowledge Discovery and Data Mining, 2001, pp. 51–60.
[96] H. Shatkay S.B. Zdonik, Approximate queries and representations forlarge data sequences, in: Proceedings of the Twelfth InternationalConference on Data Engineering, 1996, pp. 536–545.
[97] F. Korn, H.V. Jagadish, C. Faloutsos, Efficiently supporting ad hocqueries in large datasets of time sequences, ACM SIGMOD Record 26(1997) 289–300.
[98] F. Portet, E. Reiter, A. Gatt, J. Hunter, S. Sripada, Y. Freer, C. Sykes,Automatic generation of textual summaries from neonatal intensivecare data, Artif. Intell. 173 (7) (2009) 789–816.
[99] Y. Cai and R. Ng, Indexing spatio-temporal trajectories with Cheby-shev polynomials, in: Procedings of 2004 ACM SIGMOD Interna-tional, 2004, p. 599.
[100] E. Bingham, Random projection in dimensionality reduction: appli-cations to image and text data, in: Proceedings of the Seventh ACMSIGKDD International Conference on Knowledge Discovery and DataMining, 2001, pp. 245–250.
S. Aghabozorgi et al. / Information Systems 53 (2015) 16–3836
[101] Q. Chen, L. Chen, X. Lian, Y. Liu, Indexable PLA for efficient similaritysearch, in: Proceedings of the 33rd International Conference on Verylarge Data Bases, 2007, pp. 435–446.
[102] D. Minnen, T. Starner, M. Essa, C. Isbell, Discovering characteristicactions from on-body sensor data, in: Proceedings of 10th IEEEInternational Symposium on Wearable Computers, 2006, pp. 11–18.
[103] D. Minnen, C.L. Isbell, I. Essa, T. Starner, Discovering multivariatemotifs using subsequence density estimation and greedy mixturelearning, Proc. Natl. Conf. Artif. Intell. 22 (1) (2007) 615.
[104] A. Panuccio, M. Bicego, and V. Murino, A Hidden Markov Model-based approach to sequential data clustering, in Structural, Syntactic,and Statistical Pattern Recognition, T. Caelli, A. Amin, R. Duin, R. De,and M. Kamel, Eds. 2002.
[105] N. Kumar, N. Lolla, E. Keogh, S. Lonardi, Time-series bitmaps: apractical visualization tool for working with large time seriesdatabases, SIAM 2005 Data Min (2005) 531–535.
[106] M. Corduas, D. Piccolo, Time series clustering and classification bythe autoregressive metric, Comput. Stat. Data Anal. 52 (4) (2008)1860–1872.
[107] K. Kalpakis, D. Gada, V. Puttagunta, Distance measures for effectiveclustering of ARIMA time-series, in: Proceedings 2001 IEEE Interna-tional Conference on Data Mining, 2001, pp. 273–280.
[108] R. Agrawal, C. Faloutsos, A. Swami, Efficient similarity searchin sequence databases, Found. Data Organ. Algorithms 46 (1993)69–84.
[109] K. Kawagoe, T. Ueda, A similarity search method of time series datawith combination of Fourier and wavelet transforms, in: ProceedingsNinth International Symposium on Temporal Representation andReasoning, 2002, 86–92.
[110] F.L. Chung, T.C. Fu, R. Luk, Flexible time series pattern matching basedon perceptually important points, in: Jt. Conference on ArtificialIntelligence Workshop, 2001, pp. 1–7.
[111] E. Keogh, S. Lonardi, C. Ratanamahatana, Towards parameter-freedata mining, in: Proceedings of Tenth ACM SIGKDD InternationalConference on Knowledge Discovery Data Mining, vol. 22, no. 25,2004, pp. 206–215.
[112] A.J. Bagnall, G. Janacek, Clustering time series with clipped data,Mach. Learn. 58 (2) (2005) 151–178.
[113] W.G. Aref, M.G. Elfeky, A.K. Elmagarmid, Incremental, online, andmerge mining of partial periodic patterns in time-series databases,Trans. Knowl. Data Eng 16 (3) (2004) 332–342.
[114] S. Chu, E. Keogh, D. Hart, M. Pazzani, et al., Iterative deepeningdynamic time warping for time series, in: Proceedings of the SecondSIAM International Conference on Data Mining, 2002, pp. 195–212.
[115] C. Ratanamahatana, E. Keogh, Three myths about dynamic timewarping data mining, in: Proceedings of the International Conferenceon Data Mining (SDM’05), 2005, pp. 506–510.
[116] P. Smyth, Clustering sequences with hidden Markov models,, Adv.Neural Inf. Process. Syst 9 (1997) 648–654.
[117] Y. Xiong, D.Y. Yeung, Mixtures of ARMA models for model-based timeseries clustering, Data Min, 2002. ICDM 2003 (2002) 717–720.
[118] H. Sakoe, S. Chiba, A dynamic programming approach to continuousspeech recognition,, Proceedings of the Seventh International Con-gress on Acoustics vol. 3 (1971) 65–69.
[119] H. Sakoe, S. Chiba, Dynamic programming algorithm optimization forspoken word recognition,, IEEE Trans. Acoust. Speech Signal Process26 (1) (1978) 43–49.
[120] M. Vlachos, G. Kollios, D. Gunopulos, Discovering similar multi-dimensional trajectories, in: Proceedingsof 18th International Con-ference on Data Engineering, 2002, pp. 673–684.
[121] A. Banerjee, J. Ghosh, Clickstream clustering using weighted longestcommon subsequences, in: Proceedings of the Workshop on WebMining, SIAM Conference on Data Mining, 2001, pp. 33–40.
[122] L.J. Latecki, V. Megalooikonomou, Q. Wang, R. Lakaemper,C. Ratanamahatana, E. Keogh, Elastic partial matching of time series,,Knowl. Discov. Databases PKDD 2005 (2005) 577–584.
[123] E. Keogh, S. Lonardi, C. Ratanamahatana, L. Wei, S.H. Lee, J. Handley,Compression-based data mining of sequential data,, Data Min.Knowl. Discov. 14 (1) (2007) 99–129.
[124] J.L. Rodgers, W.A. Nicewander, Thirteen ways to look at the correla-tion coefficient,, Am. Stat 42 (1) (1988) 59–66.
[125] P. Indyk, N. Koudas, Identifying representative trends in massivetime series data sets using sketches, in: Proceedings of 26th Inter-national Conference on Very Large Data Bases, 2000, pp. 363–372.
[126] Yka Huhtala ; Juha Karkkainen and Hannu T. Toivonen "Mining forsimilarities in aligned time series using wavelets", Proc. SPIE 3695,Data Mining and Knowledge Discovery: Theory, Tools, and Technol-ogy, 150 (February 25, 1999); doi:10.1117/12.339977; http://dx.doi.org/10.1117/12.339977.
[127] M. Last, A. Kandel, Data mining in time series databases, World Sci.(2004).
[128] Z. Zhang, K. Huang, T. Tan, Comparison of similarity measures fortrajectory clustering in outdoor surveillance scenes, in: Proceedingsof 18th International Conference on Pattern Recognition, ICPR 2006,vol. 3, pp. 1135–1138, 2006.
[129] J. Aach, G.M. Church, Aligning gene expression time series with timewarping algorithms, Bioinformatics 17 (6) (2001) 495.
[130] R. Dahlhaus, On the Kullback–Leibler information divergence oflocally stationary processes, Stoch. Process. Appl 62 (1) (1996)139–168.
[131] E. Keogh, A probabilistic approach to fast pattern matching in timeseries databases, in: Proceedings of the 3rd International Conferenceof Knowledge Discovery and Data Mining, 1997, pp. 52–57.
[132] X. Golay, S. Kollias, G. Stoll, D. Meier, A. Valavanis, P. Boesiger, A newcorrelation-based fuzzy logic clustering algorithm for FMRI,, Magn.Reson. Med. 40 (2) (1998) 249–260.
[133] C. Wang, X. Sean Wang, Supporting content-based searches on timeseries via approximation,, Sci Stat Database (2000) 69–81.
[134] L. Chen R. Ng, On the marriage of lp-norms and edit distance, in:Proceedings of the Thirtieth International Conference on Very LargeData Bases-Volume 30, 2004, pp. 792–803.
[135] L. Chen, M.T. Özsu, V. Oria, Robust and fast similarity search formoving object trajectories, in: Proceedings of the 2005 ACM SIGMODInternational Conference on Management of Data, 2005, pp. 491–502.
[136] L. Chen, M.T. Özsu, Using multi-scale histograms to answer patternexistence and shape match queries,, Time 2 (1) (2005) 217–226.
[137] J. Aßfalg, H.P. Kriegel, P. Kröger, P. Kunath, A. Pryakhin, M. Renz,Similarity search on time series based on threshold queries, Adv.Database Technol. 2006 (2006) 276–294.
[138] E. Frentzos, K. Gratsias, Y. Theodoridis, Index-based most similartrajectory search, in: Proceedings of 23rd International Conferenceon Data Engineering, 2007, ICDE 2007. IEEE, 2007, pp. 816–825.
[139] M.D. Morse, J.M. Patel, An efficient and accurate method forevaluating time series similarity, in: Proceedings of the 2007 ACMSIGMOD International Conference on Management of Data SIGMOD07, 2007, p. 569.
[140] Y. Chen, M.A. Nascimento, B.C. Ooi,A.K.H. Tung, Spade: on shape-based pattern detection in streaming time series, in: Proceedings ofIEEE 23rd International Conference on Data Engineering, 2007. ICDE2007. , 2007, pp. 786–795.
[141] X. Zhang, J. Wu, X. Yang, H. Ou, T. Lv, A notime series classificationvelpattern extraction method for, Optim. Eng. 10 (2) (2009) 253–271.
[142] W. Lang, M. Morse, J.M. Patel, Dictionary-based compression for longtime-series similarity, Knowl. Data Eng. IEEE Trans 22 (11) (2010)1609–1622.
[143] S. Salvador, P. Chan, Toward accurate dynamic time warping in lineartime and space, Intell. Data Anal. 11 (5) (2007) 561–580.
[144] F. Itakura, Minimum prediction residual principle applied to speechrecognition. Minimum prediction residual principle applied tospeech recognition, IEEE Trans. Acoust. Speech Signal Process 23(1) (1975) 67–72.
[145] B. Lkhagva, Y.u. Suzuki, K. Kawagoe, New time series data represen-tation ESAX for financial applications, in: Proceedings of 22ndInternational Conference on Data Engineering Workshops, 2006,pp. 17–22.
[146] A. Corradini, Dynamic time warping for off-line recognition of asmall gesture vocabulary, in: IEEE ICCV Workshop on Recognition,Analysis, and Tracking of Faces and Gestures in Real-Time Systems,2001, pp. 82–89.
[147] L. Rabiner, S. Levinson, Speaker-independent recognition of isolatedwords using clustering techniques,, IEEE Trans. Acoust. Speech SignalProcess 27 (4) (1979) 336–349.
[148] D. Gusfield, Algorithms on Strings, Trees, and Sequences: ComputerScience and Computational Biology, Cambridge University Press,1997.
[149] V. Niennattrakul, C. Ratanamahatana, Inaccuracies of shape aver-aging method using dynamic time warping for time series data,Comput. Sci. 2007 (2007) 513–520.
[150] L. Kaufman, P.J. Rousseeuw, E. Corporation, Finding groups in data:an introduction to cluster analysis, vol. 39, Wiley Online Library,Hoboken, New Jersey, 1990.
[151] V. Vuori, J. Laaksonen, A comparison of techniques for automaticclustering of handwritten characters, Pattern Recognit., 2002 3(2002) 30168.
[152] T.W. Liao, B. Bolt, J. Forester, E. Hailman, C. Hansen, R. Kaste, J. O’May,Understanding and projecting the battle state, in: Proceedings of23rd Army Science Conference, Orlando, FL, 2002, pp. 2–3.
S. Aghabozorgi et al. / Information Systems 53 (2015) 16–38 37
[153] T.W. Liao, C.F. Ting, An adaptive genetic clustering method forexploratory mining of feature vector and time series data,, Int.J. Prod. Res. 44 (14) (2006) 2731–2748.
[154] L. Gupta, D.L. Molfese, R. Tammana, P.G. Simos, Nonlinear alignmentand averaging for estimating the evoked potential, IEEE Trans.Biomed. Eng. 43 (4) (1996) 348–356.
[155] E. Caiani, A. Porta, G. Baselli, M. Turiel, S. Muzzupappa, F. Pieruzzi,C. Crema, A. Malliani, S. Cerutti, Warped-average template techniqueto track on a cycle-by-cycle basis the cardiac filling phases on leftventricular volume,, Comput. Cardiol. 1998 (1998) 73–76.
[156] T. Oates, L. Firoiu, P. Cohen, Using dynamic time warping to bootstrapHMM-based clustering of time series, Seq. Learn. Paradig. ALGO-RITHMS, Appl 1 (1828) (2001) 35–52.
[157] W. Abdulla, D. Chow, Cross-words reference template for DTW-basedspeech recognition systems, in: TENCON 2003. Conference on Con-vergent Technologies for Asia-Pacific Region, vol. 4, 2003, pp. 1576–1579.
[158] F. Petitjean, A. Ketterlin, P. Gançarski, A global averaging method fordynamic time warping, with applications to clustering, PatternRecognit 44 (3) (2011) 678–693.
[159] L. Bergroth, H. Hakonen, A survey of longest common subsequencealgorithms, in: Proceedings of the Seventh International Symposiumon String Processing and Information Retrieval, 2000. SPIRE 2000,2000, pp. 39–48.
[160] S. Aghabozorgi, T.Y. Wah, A. Amini, M.R. Saybani, A new approach topresent prototypes in clustering of time series, in: Proceedings of the7th International Conference of Data Mining, vol. 28, no. 4, 2011,pp. 214–220.
[161] S. Aghabozorgi, M.R. Saybani, T.Y. Wah, Incremental clustering oftime-series by fuzzy clustering, J. Inf. Sci. Eng. 28 (4) (2012) 671–688.
[162] G. Karypis, E.H. Han, V. Kumar, Chameleon: hierarchical clusteringusing dynamic modeling, Comput. (Long. Beach. Calif). 32 (8) (1999)68–75.
[163] S. Guha, R. Rastogi, K. Shim, CURE: an efficient clustering algorithmfor large databases,, ACM SIGMOD Rec. 27 (2) (1998) 73–84.
[164] T. Zhang, R. Ramakrishnan, M. Livny, BIRCH: an efficient dataclustering method for very large databases, ACM SIGMOD Rec. 25(2) (1996) 103–114.
[165] M. Vlachos, J. Lin, E. Keogh, A wavelet-based anytime algorithm fork-means clustering of time series, Proc. Work. Clust (2003) 23–30.
[166] J.J. Van Wijk and E.R. Van Selow, Cluster and calendar basedvisualization of time series data, in: Proceedings of 1999 IEEESymposium on Information Vision, 1999, pp. 4–9.
[167] T. Oates, M.D. Schmill, P.R. Cohen, A method for clustering theexperiences of a mobile robot that accords with human judgments,in: Proceedings of the National Conference on Artificial Intelligence,2000, pp. 846–851.
[168] S. Hirano, S. Tsumoto, Empirical comparison of clustering methodsfor long time-series databases, Act. Min 3430 (2005) 268–286.
[169] J. MacQueen, Some methods for classification and analysis of multi-variate observations, in: Proceedings of the fifth Berkeley sympo-sium Mathematical Statist. Probability, vol. 1, 1967, pp. 281–297.
[170] R.T. Ng, J. Han, Efficient and effective clustering methods for spatialdata mining, in: Proceedings of the International Conference on VeryLarge Data Bases, 1994, pp. 144–144.
[171] U. Fayyad, C. Reina, P.S. Bradley, Initialization of iterative refine-ment clustering algorithms, in: Proceedings of the Fourth Inter-national Conference on Knowledge Discovery and Data Mining, 1998,pp. 194–198.
[172] P.S. Bradley, U. Fayyad, C. Reina, Scaling clustering algorithms to largedatabases, Knowl. Discov. Data Min (1998) 9–15.
[173] J. Beringer, E. Hullermeier, Online clustering of parallel data streams,Data Knowl. Eng. 58 (2) (2006) 180–204. Aug.
[174] J.C. Bezdek, Pattern Recognition with Fuzzy Objective FunctionAlgorithms, Kluwer Academic Publishers Norwell, MA, USA, 1981(ISBN:0306406713).
[175] J.C. Dunn, A fuzzy relative of the ISODATA process and its use indetecting compact well-separated clusters, Cybern. Syst. 3 (3) (1973)32–57.
[176] R. Krishnapuram, A. Joshi, O. Nasraoui, L. Yi, “Low-complexity fuzzyrelational clustering algorithms for web mining,”, Fuzzy Syst. IEEETrans vol. 9 (no. 4) (2001) 595–607.
[177] D. Dembélé, P. Kastner, Fuzzy C-means method for clusteringmicroarray data, Bioinformatics 19 (8) (2003) 973–980.
[178] J. Alon, S. Sclaroff, Discovering clusters in motion time-series data in:Proceedings of Computer Society Conference on Computer Visionand Pattern Recognition, 2003, pp. 375–381.
[179] J.W. Shavlik, T.G. Dietterich, Readings in Machine Learning, MorganKaufmann, San Mateo, California, 1990.
[181] G.A. Carpenter, S. Grossberg, A massively parallel architecture for aself-organizing neural pattern recognition machine, Comput. vision,Graph. image Process 37 (1) (1987) 54–115.
[182] T. Kohonen, The self-organizing map, Proc. IEEE 78 (9) (1990)1464–1480.
[183] C. Biernacki, G. Celeux, G. Govaert, Assessing a mixture model forclustering with the integrated completed likelihood, IEEE Trans.Pattern Anal. Mach. Intell 22 (7) (2000) 719–725.
[184] M. Bicego, V. Murino, M. Figueiredo, Similarity-based clustering ofsequences using hidden Markov models, Mach. Learn. data Min.pattern Recognit 2734 (1) (2003) 95–104.
[185] J. Hu, B. Ray, L. Han, An interweaved hmm/dtw approach to robusttime series clustering, in: Proceedings of 18th International Con-ference on Pattern Recognition, 2006. ICPR 2006, , vol. 3, 2006,pp. 145–148.
[186] B. Andreopoulos, A. An, X. Wang, , A roadmap of clusteringalgorithms: finding a match for a biomedical application, Brief.Bioinform. 10 (3) (2009) 297–314.
[187] M. Ester, H.P. Kriegel, J. Sander, X. Xu, A density-based algorithm fordiscovering clusters in large spatial databases with noise, In Kdd 96(34) (1996, August) 226–231.
[188] M. Ankerst, M. Breunig, H. Kriegel, OPTICS: Ordering points toidentify the clustering structure, ACM SIGMOD Rec 28 (2) (1999)40–60.
[189] S. Chandrakala, C. Chandra, A density based method for multivariatetime series clustering in kernel feature space, in: Proceedings of IEEEInternational Joint Conference on Neural Networks IEEE WorldCongress on Computational Intelligence, vol. 2008, 2008, pp. 1885–1890.
[190] W. Wang, J. Yang, R. Muntz, STING: a statistical information gridapproach to spatial data mining, in: Proceedings of the InternationalConference on Very Large Data Bases, 1997, pp. 186–195.
[191] G. Sheikholeslami, S. Chatterjee, A. Zhang, Wavecluster: A multi-resolution clustering approach for very large spatial databases, in:proceedings of the International conference on Very Large DataBases, 1998, pp. 428–439.
[192] Y. Kakizawa, R.H. Shumway, M. Taniguchi, Discrimination andclustering for multivariate time series, J. Am. Stat. Assoc 93 (441)(1998) 328–340.
[193] S. Policker, A.B.B. Geva, Nonstationary time series analysis bytemporal clustering, Syst. Man, Cybern. Part B 30 (2) (2000)339–343.
[194] J. Qian, M. Dolled-Filhart, J. Lin, H. Yu, M. Gerstein, Beyond synex-pression relationships: local clustering of time-shifted and invertedgene expression profiles identifies new, biologically relevant inter-actions1, J. Mol. Biol. 314 (5) (2001) 1053–1066.
[195] Z.J. Wang, P. Willett, Joint segmentation and classification of timeseries using class-specific features, Syst. Man, Cybern. Part B Cybern.IEEE Trans 34 (2) (2004) 1056–1067.
[196] X. Wang, K.A. Smith, R.J. Hyndman, Dimension reduction for cluster-ing time series using global characteristics, Comput. Sci. 2005 (2005)792–795.
[197] Focardi, S. M. (2001). Clustering economic and financial time series:Exploring the existence of stable correlation conditions. TechnicalReport 2001-04, The Intertek Group.
[198] J. Abonyi, B. Feil, S. Nemeth, P. Arva, Principal component analysisbased time series segmentation-application to hierarchical cluster-ing for multivariate process data, in: Proceedings of IEEE Interna-tional Conference on Computational Cybernetics, 2005, pp. 29–31.
[200] T.W. Liao, Mining of Vector Time Series by Clustering, 2005.[201] D. Bao, A generalized model for financial time series representation
and prediction,, Appl. Intell. 29 (1) (2007) 1–11.[202] D. Bao, Z. Yang, Intelligent stock trading system by turning point
confirming and probabilistic reasoning, Exp. Syst. Appl. 34 (1) (2008)620–627.
[203] W. Liu, L. Shao, Research of SAX in distance measuring for financialtime series data, in: Proceedings of the First International Confer-ence on Information Science and Engineering, 2009, no. 70572070,pp. 935–937.
[204] T.C. Fu, F.L. Chung, R. Luk, C.M. Ng, Financial time series indexingbased on low resolution clustering, in: Proceedings of the 4thIEEE International Conference on Data Mining (ICDM-2004), 2010,pp. 5–14.
S. Aghabozorgi et al. / Information Systems 53 (2015) 16–3838
[205] C.-P.P. Lai, P.-C.C. Chung, V.S. Tseng, A novel two-level clusteringmethod for time series data analysis,, Expert Syst. Appl. 37 (9) (2010)6319–6326.
[206] X. Zhang, J. Liu, Y. Du, T. Lv, A novel clustering method on time seriesdata, Expert Syst. Appl. 38 (9) (2011) 11891–11900.
[207] J. Zakaria, A. Mueen, E. Keogh, Clustering time series using unsu-pervised-shapelets, in: Proceedings of 2012 IEEE 12th InternationalConference on Data Mining, 2012, pp. 785–794.
[208] R. Darkins, E.J. Cooke, Z. Ghahramani, P.D.W. Kirk, D.L. Wild,R.S. Savage, Accelerating Bayesian hierarchical clustering of time seriesdata with a randomised algorithm, PLoS One 8 (4) (2013) e59795.
[209] O. Seref, Y.-J. Fan, W.A. Chaovalitwongse, Mathematical program-ming formulations and algorithms for discrete k-median clusteringof time-series data, INFORMS J. Comput. 26 (1) (2014) 160–172.
[210] S. Ghassempour, F. Girosi, A. Maeder, Clustering multivariate timeseries using hidden Markov models, Int. J. Environ. Res. Public Health11 (3) (2014) 2741–2763.
[211] S. Aghabozorgi, T. Ying Wah, T. Herawan, H.A. Jalab, M.A. Shaygan,A. Jalali, A hybrid algorithm for clustering of time series data basedon affinity search technique, Sci.World J. 2014 (2014) 562194.
[212] A. Bellaachia, D. Portnoy, Y. Chen, A.G. Elkahloun, E-CAST: a datamining algorithm for gene expression data, in: Workshop on DataMining in Bioinformatics, 2002, pp. 49–54.
[213] J. Lin, M. Vlachos, E. Keogh, D. Gunopulos, J. Liu, S. Yu, J. Le, A MPAA-based iterative clustering algorithm augmented by nearest neighborssearch for time-series data streams, Adv. Knowl. Discov. Data Min(2005) 333–342.
[214] R.J. Hathaway, J.C. Bezdek, Visual cluster validity for prototypegenerator clustering models, Pattern Recognit. Lett 24 (9–10) (2003)1563–1569.
[215] M. Halkidi, Y. Batistakis, M. Vazirgiannis, On clustering validationtechniques, J. Intell. Inf 17 (2) (2001) 107–145.
[216] C.D. Manning, P. Raghavan, H. Schutze, Introduction to InformationRetrieval, vol. 1, Cambridge University Press Cambridge, 2008 no. c..
[217] E. Amigó, J. Gonzalo, J. Artiles, F. Verdejo, A comparison of extrinsicclustering evaluation metrics based on formal constraints, Inf. Retr.Boston 12 (4) (2009) 461–486.
[218] M. Meila, Comparing clusterings by the variation of information,, in:B. Schölkopf, M. Warmuth (Eds.), Comparing Clusterings by theVariation of Information Learning Theory and Kernel Machines,Springer, Berlin, Heidelberg, 2003, pp. 173–187.
[219] A. Rosenberg, J. Hirschberg, V-measure: a conditional entropy-basedexternal cluster evaluation measure, in: Proceedings of the 2007Joint Conference on Empirical Methods in Natural Language Proces-sing and Computational Natural Language Learning (EMNLP-CoNLL),2007, no. June, pp. 410–420.
[220] G. Gan, C. Ma, Data Clustering: Theory, Algorithms, and Applications.2007.
[221] H. Kremer, P. Kranen, T. Jansen, T. Seidl, A. Bifet, G. Holmes,B. Pfahringer, An effective evaluation measure for clustering onevolving data streams, in: Proceedings of the 17th ACM SIGKDDinternational conference on Knowledge Discovery and Data Mining,2011, pp. 868–876.
[222] Y. Zhao, G. Karypis, Empirical and theoretical comparisons ofselected criterion functions for document clustering,, Mach. Learn.55 (3) (2004) 311–331.
[223] Y. Xiong, D.Y. Yeung, Time series clustering with ARMA mixtures,,Pattern Recognit 37 (8) (2004) 1675–1689.
[224] E. Fowlkes, C.L. Mallows, A method for comparing two hierarchicalclusterings,, J. Am. Stat. Assoc 78 (383) (1983) 553–569.
[225] J. Wu, H. Xiong, J. Chen, Adapting the right measures for k-meansclustering, in: Proceedings of the 15th ACM SIGKDD, 2009, pp. 877–886.
[226] W.M. Rand, Objective criteria for the evaluation of clusteringmethods,, J. Am. Stat. Assoc 66 (336) (1971) 846–850.
[227] L. Hubert, P. Arabie, Comparing partitions,, J. Classif. 2 (1) (1985)193–218.
[228] G.W. Milligan,, M.C. Cooper, A study of the comparability of externalcriteria for hierarchical cluster analysis,, A Study Comparitive Exter-nal Criteria Hierarchical Cluster Anal vol. 21 (no. 4) (1986) 441–458.
[229] D. Steinley, Properties of the Hubert-Arable adjusted rand index,,Psychol. Methods 9 (3) (2004) 386.
[230] K.K. Yeung, D.D. Haynor, W. Ruzzo, Validating clustering for geneexpression data,, Bioinformatics 17 (4) (2001) 309–318.
[231] K. Yeung, C. Fraley, A. Murua, A.E. Raftery, W.L. Ruzzo, Model-basedclustering and data transformations for gene expression data,Bioinformatics 17 (10) (2001) 977–987.
[232] C.J. Van Rijsbergen, Information Retrieval, Butterworths, LondonBoston, 1979.
[233] S. Kameda, M. Yamamura, Spider algorithm for clustering timeseries,, World Scientific and Engineering Academy and Society(WSEAS) vol. 2006 (2006) 378–383.
[234] C.J. Van Rijsbergen, A non-classical logic for information retrieval,Comput. J. 29 (6) (1986) 481–485.
[235] B. Larsen, C. Aone, Fast and effective text mining using linear-timedocument clustering, in: Proceedings of the Fifth ACM SIGKDDInternational Conference on Knowledge Discovery and Data Mining,1999, pp. 16–22.
[236] C. Studholme, D.L.G. Hill, D.J. Hawkes, An overlap invariant entropymeasure of 3D medical image alignment,, Pattern Recognit 32 (1)(1999) 71–86.
[237] A. Strehl, J. Ghosh, Cluster ensembles—a knowledge reuse frame-work for combining multiple partitions, J. Mach. Learn. Res. 3 (2003)583–617.
[238] X.Z. Fern, C.E. Brodley, Solving cluster ensemble problems bybipartite graph partitioning, in: Proceedings of the Twenty-firstInternational Conference on Machine Learning, 2004, p. 36.
[239] F. Rohlf, Methods of comparing classifications, Annu. Rev. Ecol. Syst.(1974) 101–113.
[240] S. Lin, M. Song, L. Zhang, Comparison of cluster representations frompartial second-to full fourth-order cross moments for data streamclustering, in: Proceedings of the Eighth IEEE International Confer-ence on Data Mining, 2008. ICDM ’08, 2008, pp. 560–569.
[241] J. Han, M. Kamber, Data Mining: Concepts and Techniques, MorganKaufmann, San Francisco, CA, 2011.
[242] E. Keogh, J., Lin, Clustering of time-series subsequences is mean-ingless: implications for previous and future research, Knowledgeand information systems 8 (2) (2005) 154–177.