38
Time Series Data in MongoDB Senior Solutions Architect, MongoDB Inc. Dave Erickson #mongodb
Time Series Data in MongoDB
Senior Solutions Architect, MongoDB Inc.
Dave Erickson
#mongodb
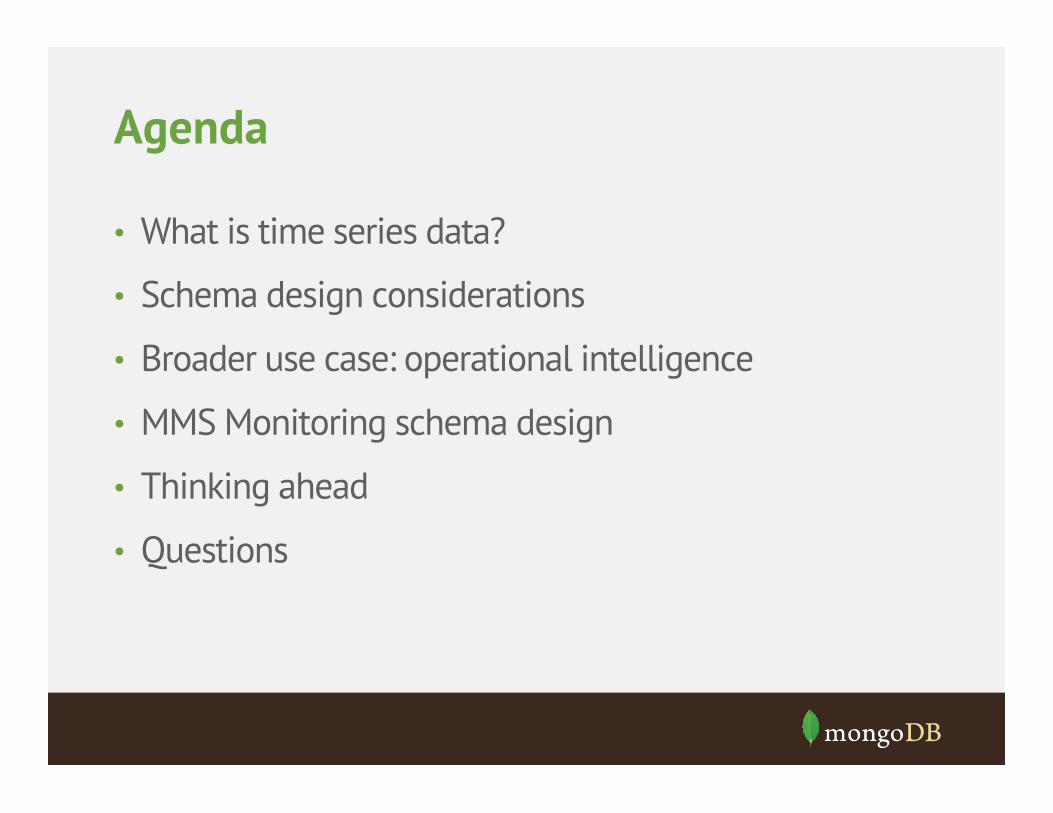
Agenda
• What is time series data?
• Schema design considerations
• Broader use case: operational intelligence
• MMS Monitoring schema design
• Thinking ahead
• Questions
What is time series data?
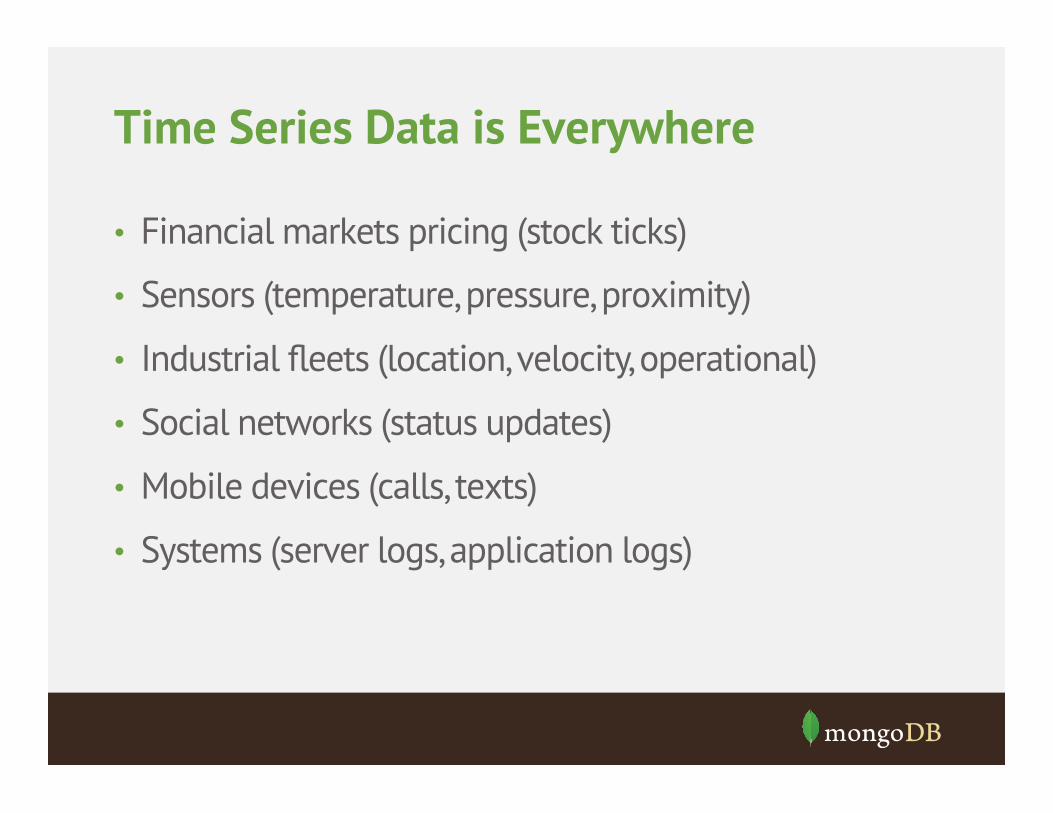
Time Series Data is Everywhere
• Financial markets pricing (stock ticks)
• Sensors (temperature, pressure, proximity)
• Industrial fleets (location, velocity, operational)
• Social networks (status updates)
• Mobile devices (calls, texts)
• Systems (server logs, application logs)
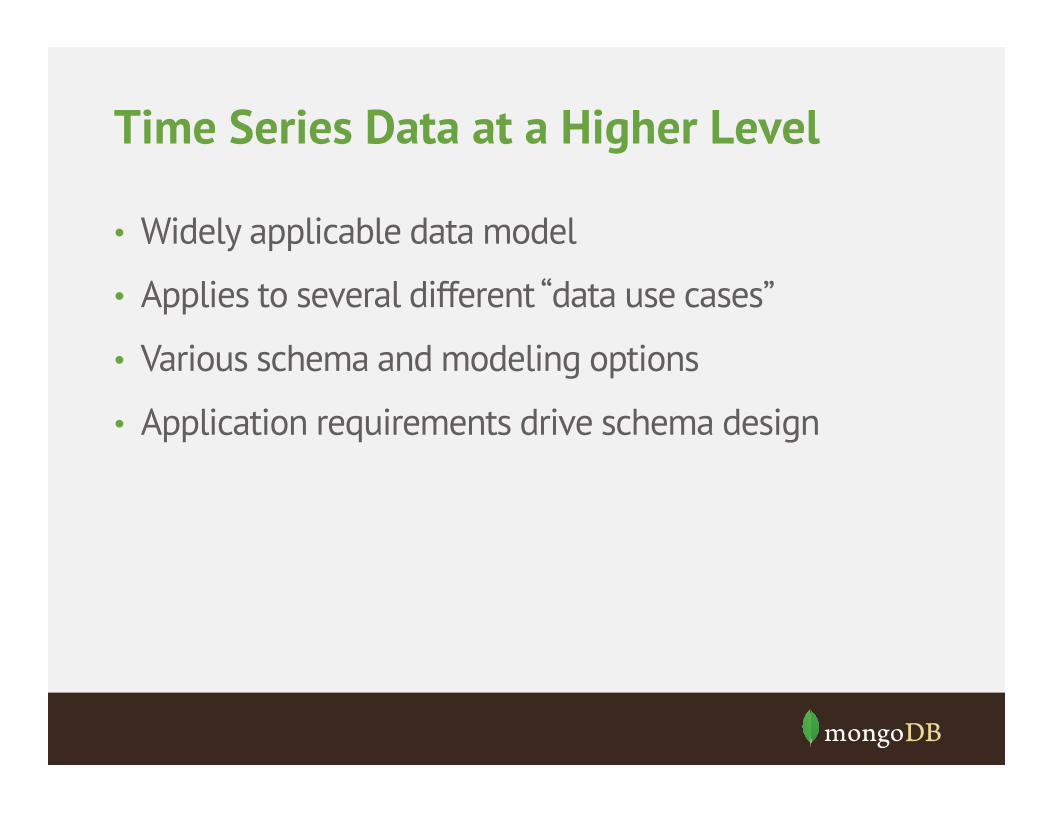
Time Series Data at a Higher Level
• Widely applicable data model
• Applies to several different “data use cases”
• Various schema and modeling options
• Application requirements drive schema design

Time Series Data Considerations
• Resolution of raw events
• Resolution needed to support – Applications – Analysis – Reporting
• Data retention policies – Data ages out – Retention

Schema Design Considerations

Designing For Writing and Reading
• Document per event
• Document per minute (average)
• Document per minute (second)
• Document per hour
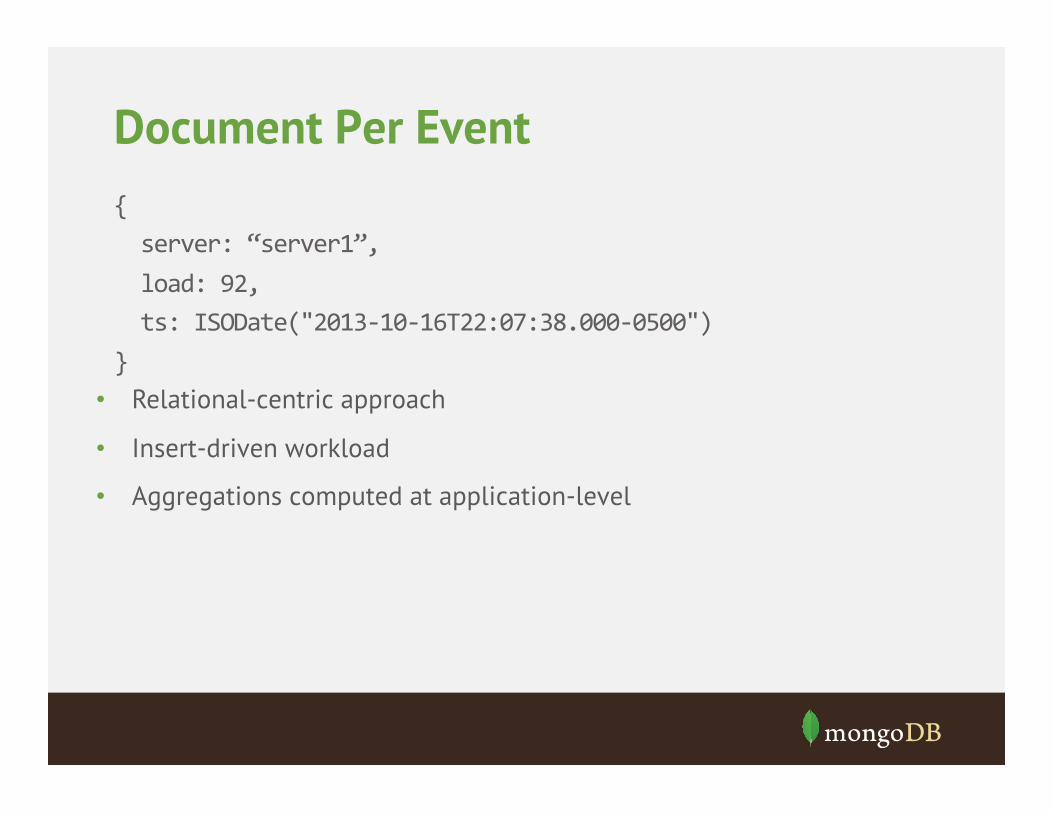
Document Per Event { server: “server1”, load: 92, ts: ISODate("2013-‐10-‐16T22:07:38.000-‐0500") } • Relational-centric approach
• Insert-driven workload
• Aggregations computed at application-level
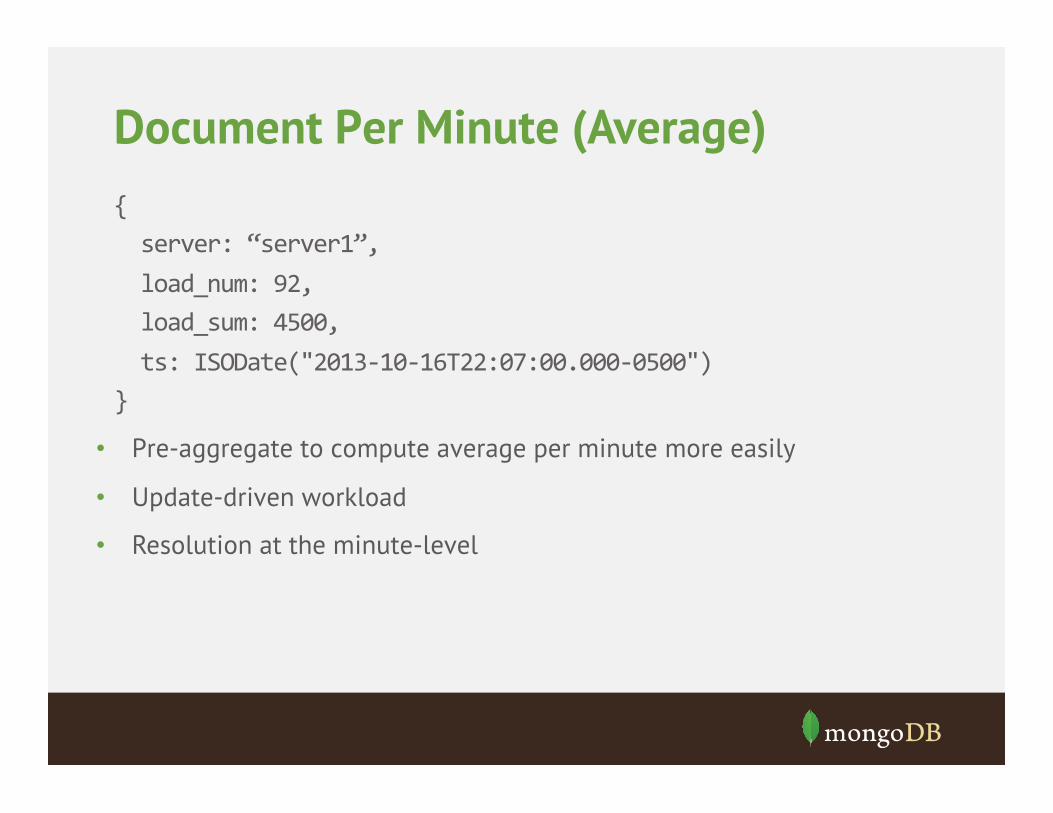
Document Per Minute (Average) { server: “server1”, load_num: 92, load_sum: 4500, ts: ISODate("2013-‐10-‐16T22:07:00.000-‐0500") } • Pre-aggregate to compute average per minute more easily
• Update-driven workload
• Resolution at the minute-level

Document Per Minute (By Second) { server: “server1”, load: { 0: 15, 1: 20, …, 58: 45, 59: 40 } ts: ISODate("2013-‐10-‐16T22:07:00.000-‐0500") } • Store per-second data at the minute level
• Update-driven workload
• Pre-allocate structure to avoid document moves
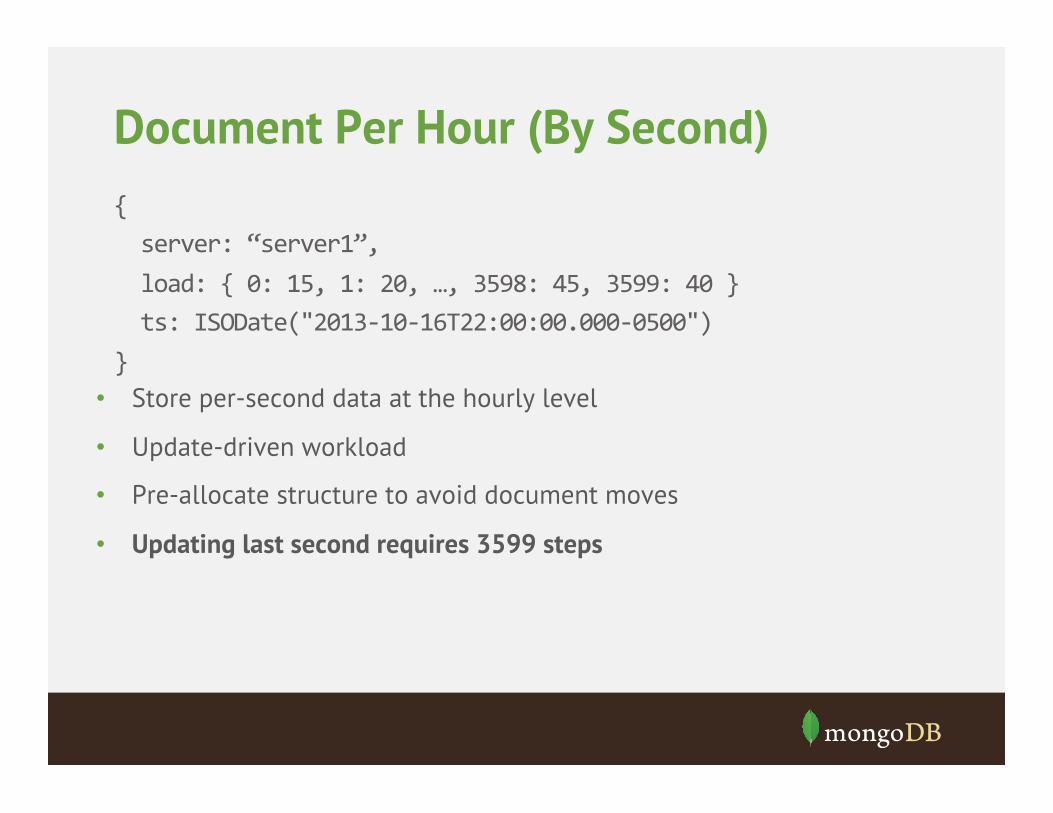
Document Per Hour (By Second) { server: “server1”, load: { 0: 15, 1: 20, …, 3598: 45, 3599: 40 } ts: ISODate("2013-‐10-‐16T22:00:00.000-‐0500") } • Store per-second data at the hourly level
• Update-driven workload
• Pre-allocate structure to avoid document moves
• Updating last second requires 3599 steps
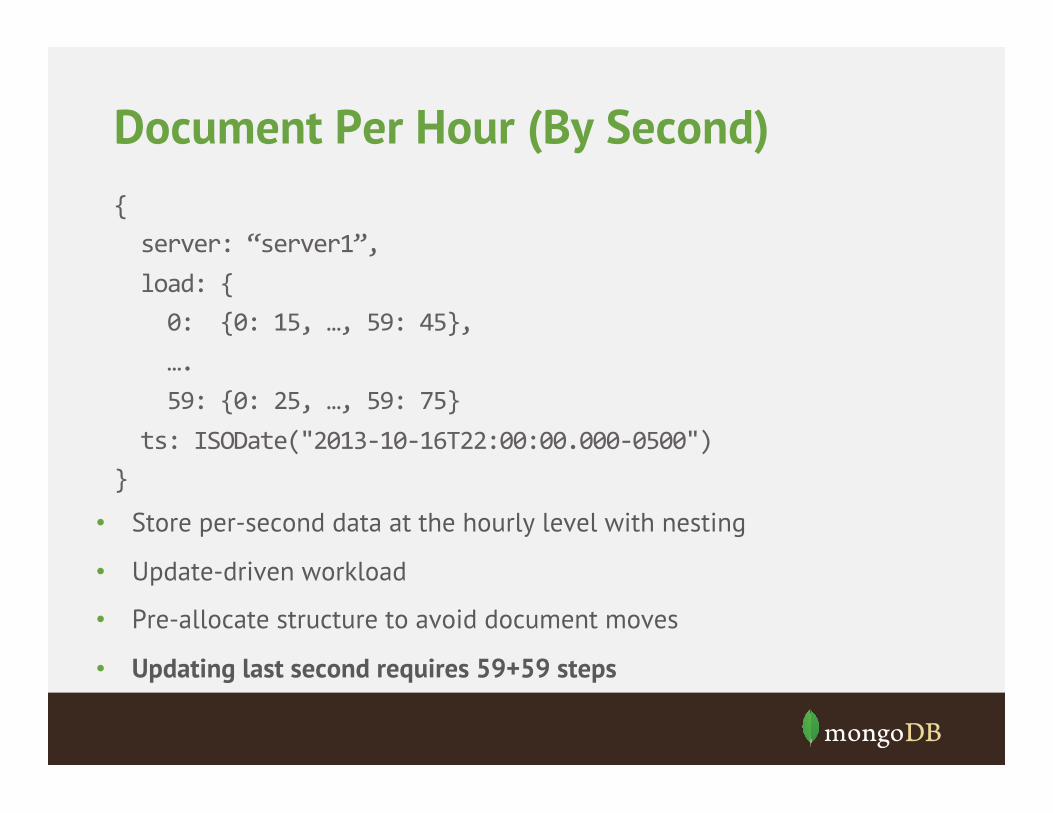
Document Per Hour (By Second) { server: “server1”, load: { 0: {0: 15, …, 59: 45}, …. 59: {0: 25, …, 59: 75} ts: ISODate("2013-‐10-‐16T22:00:00.000-‐0500") } • Store per-second data at the hourly level with nesting
• Update-driven workload
• Pre-allocate structure to avoid document moves
• Updating last second requires 59+59 steps
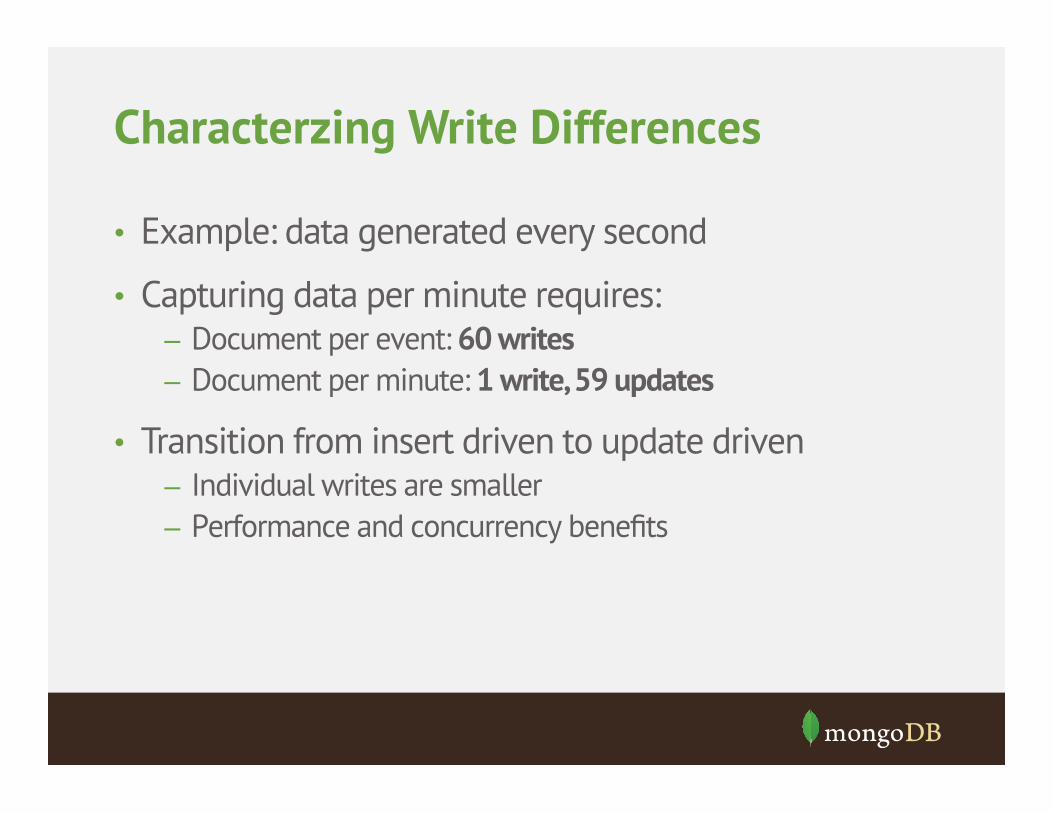
Characterzing Write Differences
• Example: data generated every second
• Capturing data per minute requires: – Document per event: 60 writes – Document per minute: 1 write, 59 updates
• Transition from insert driven to update driven – Individual writes are smaller – Performance and concurrency benefits
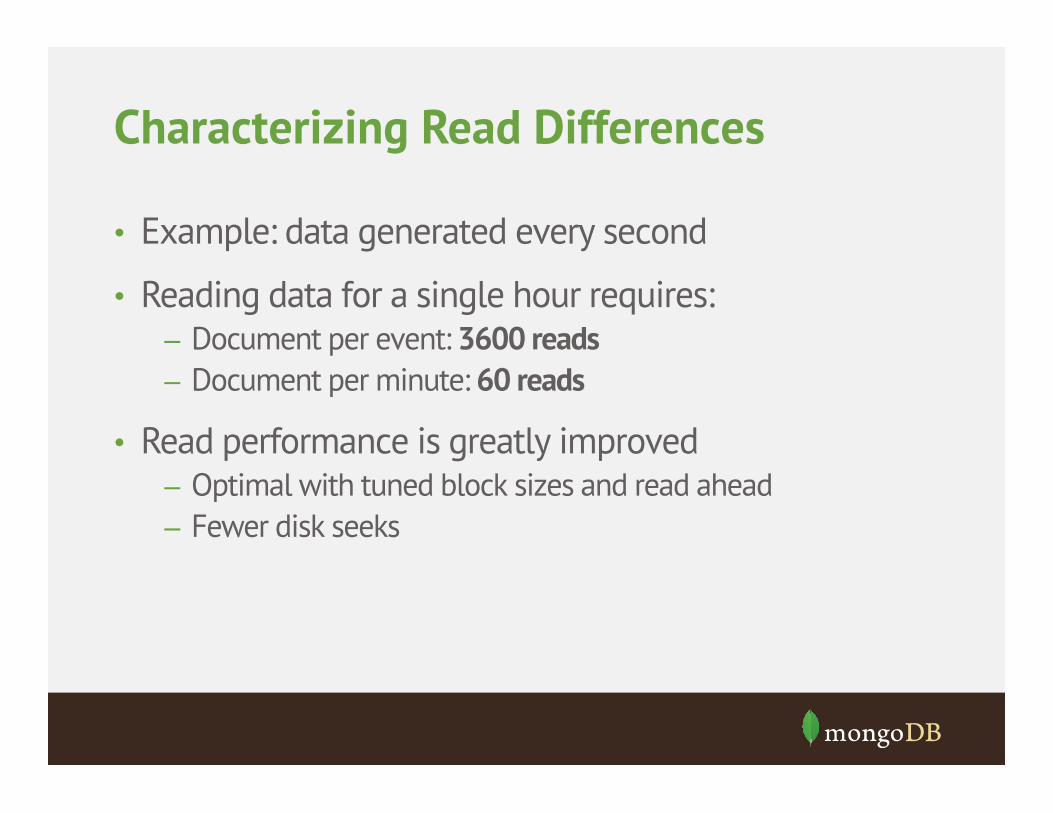
Characterizing Read Differences
• Example: data generated every second
• Reading data for a single hour requires: – Document per event: 3600 reads – Document per minute: 60 reads
• Read performance is greatly improved – Optimal with tuned block sizes and read ahead – Fewer disk seeks

MMS Monitoring Schema Design
MMS Monitoring
• MongoDB Management System Monitoring
• Available in two flavors – Free cloud-hosted monitoring – On-premise with MongoDB Enterprise
• Monitor single node, replica set, or sharded cluster deployments
• Metric dashboards and custom alert triggers

MMS Monitoring

MMS Monitoring
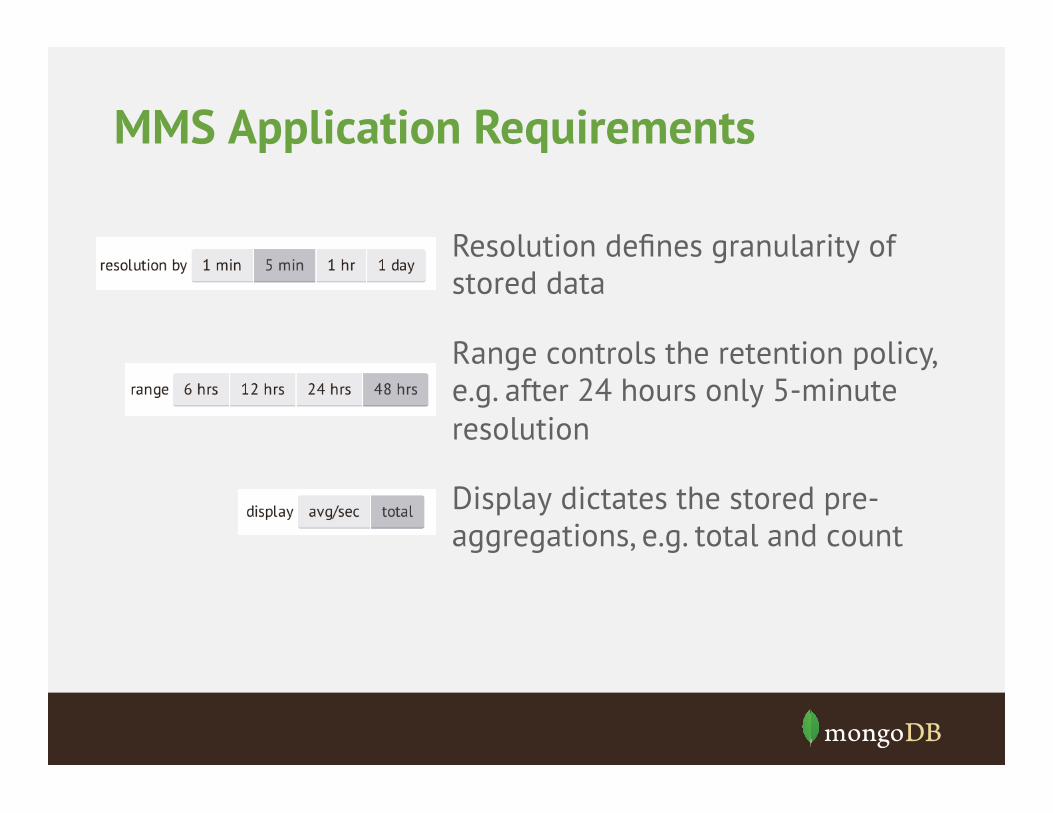
MMS Application Requirements
Resolution defines granularity of stored data
Range controls the retention policy, e.g. after 24 hours only 5-minute resolution
Display dictates the stored pre-aggregations, e.g. total and count

Monitoring Schema Design
• Per-minute document model
• Documents store individual metrics and counts
• Supports “total” and “avg/sec” display
{ timestamp_minute: ISODate(“2013-‐10-‐10T23:06:00.000Z”), num_samples: 58, total_samples: 108000000, type: “memory_used”, values: { 0: 999999, … 59: 1800000 } }

Monitoring Data Updates
• Single update required to add new data and increment associated counts
db.metrics.update( { timestamp_minute: ISODate("2013-‐10-‐10T23:06:00.000Z"), type: “memory_used” }, { {$set: {“values.59”: 2000000 }}, {$inc: {num_samples: 1, total_samples: 2000000 }} } )
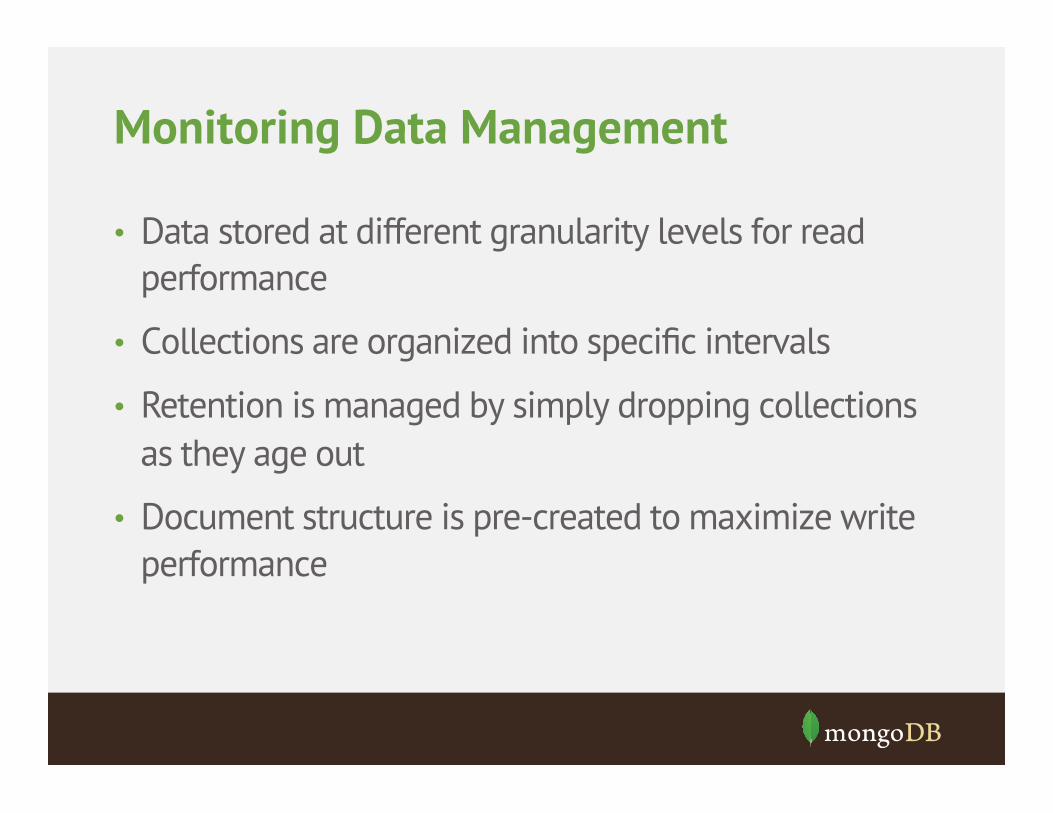
Monitoring Data Management
• Data stored at different granularity levels for read performance
• Collections are organized into specific intervals
• Retention is managed by simply dropping collections as they age out
• Document structure is pre-created to maximize write performance
Use Case: Operational Intelligence

What is Operational Intelligence
• Storing log data – Capturing application and/or server generated events
• Hierarchical aggregation – Rolling approach to generate rollups – e.g. hourly > daily > weekly > monthly
• Pre-aggregated reports – Processing data to generate reporting from raw events
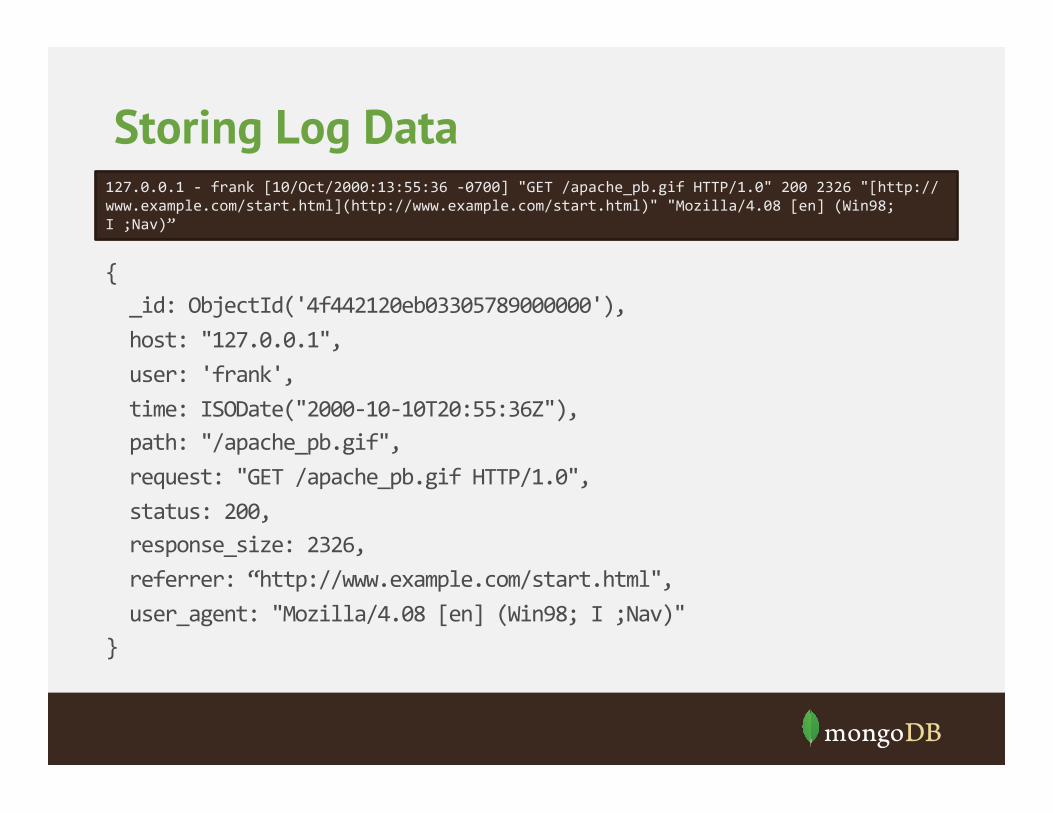
Storing Log Data
{ _id: ObjectId('4f442120eb03305789000000'), host: "127.0.0.1", user: 'frank', time: ISODate("2000-‐10-‐10T20:55:36Z"), path: "/apache_pb.gif", request: "GET /apache_pb.gif HTTP/1.0", status: 200, response_size: 2326, referrer: “http://www.example.com/start.html", user_agent: "Mozilla/4.08 [en] (Win98; I ;Nav)" }
127.0.0.1 -‐ frank [10/Oct/2000:13:55:36 -‐0700] "GET /apache_pb.gif HTTP/1.0" 200 2326 "[http://www.example.com/start.html](http://www.example.com/start.html)" "Mozilla/4.08 [en] (Win98; I ;Nav)”

Pre-Aggregation
• Analytics across raw events can involve many reads
• Alternative schemas can improve read and write performance
• Data can be organized into more coarse buckets
• Transition from insert-driven to update-driven workloads
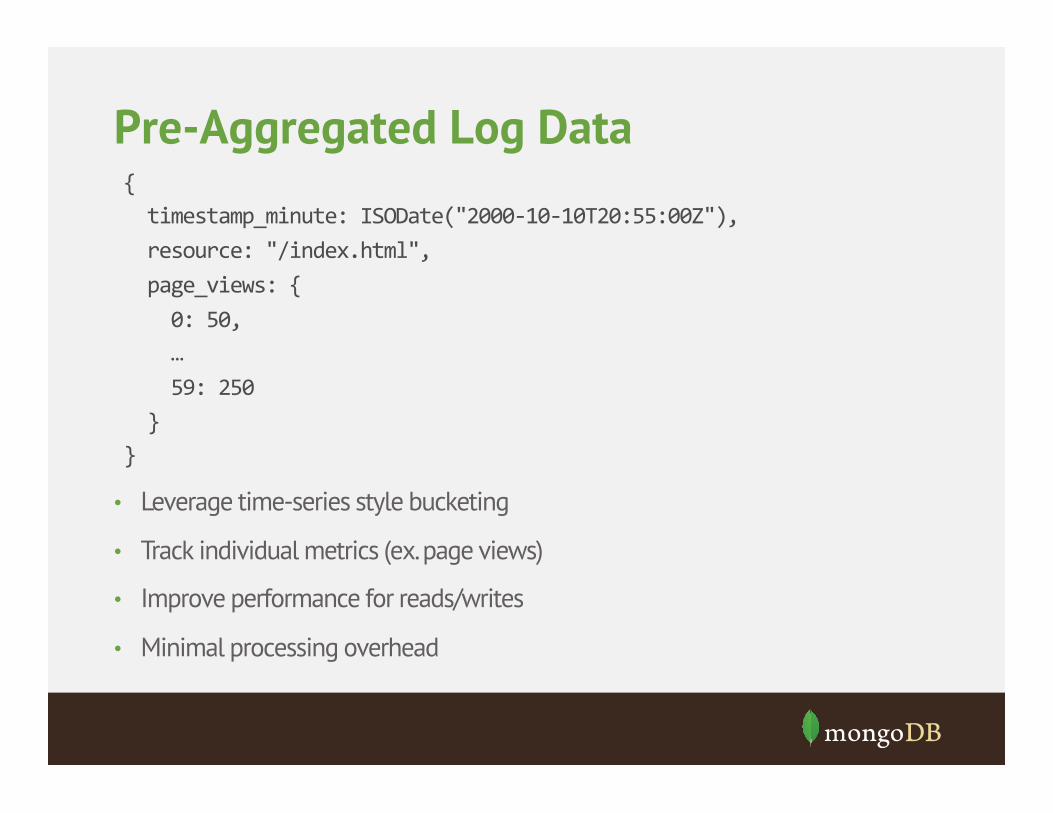
Pre-Aggregated Log Data { timestamp_minute: ISODate("2000-‐10-‐10T20:55:00Z"), resource: "/index.html", page_views: { 0: 50, … 59: 250 } }
• Leverage time-series style bucketing
• Track individual metrics (ex. page views)
• Improve performance for reads/writes
• Minimal processing overhead
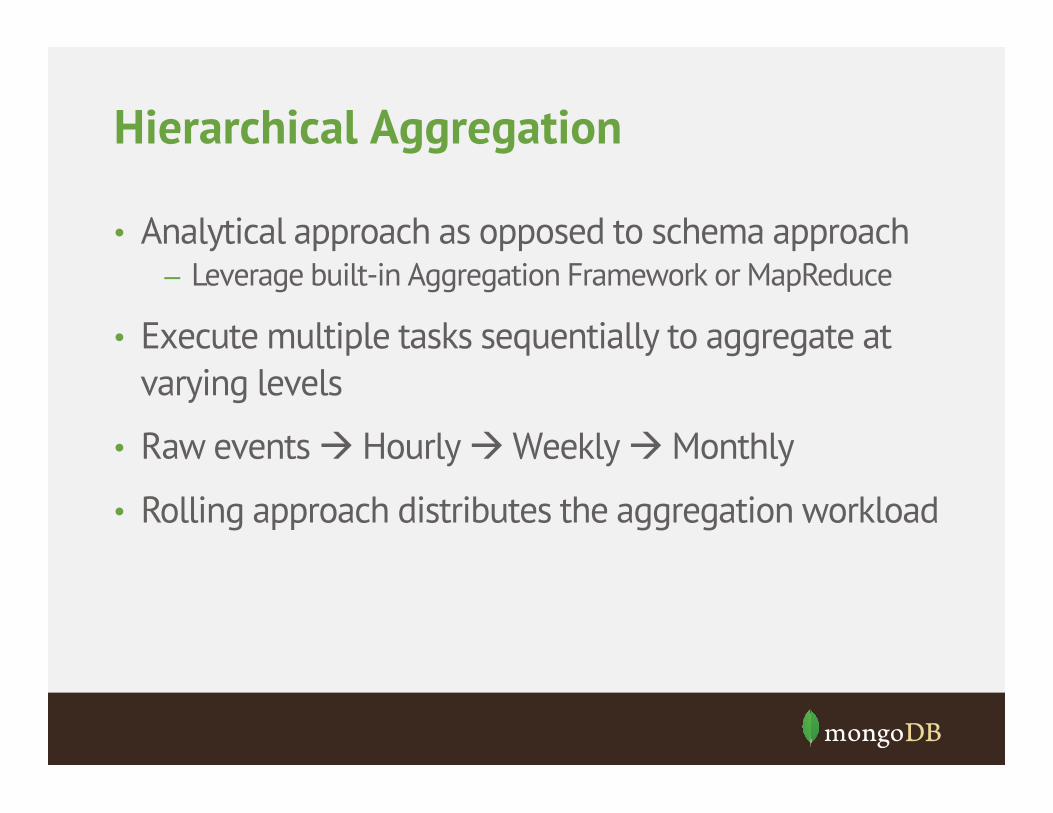
Hierarchical Aggregation
• Analytical approach as opposed to schema approach – Leverage built-in Aggregation Framework or MapReduce
• Execute multiple tasks sequentially to aggregate at varying levels
• Raw events à Hourly à Weekly à Monthly
• Rolling approach distributes the aggregation workload

Thinking Ahead
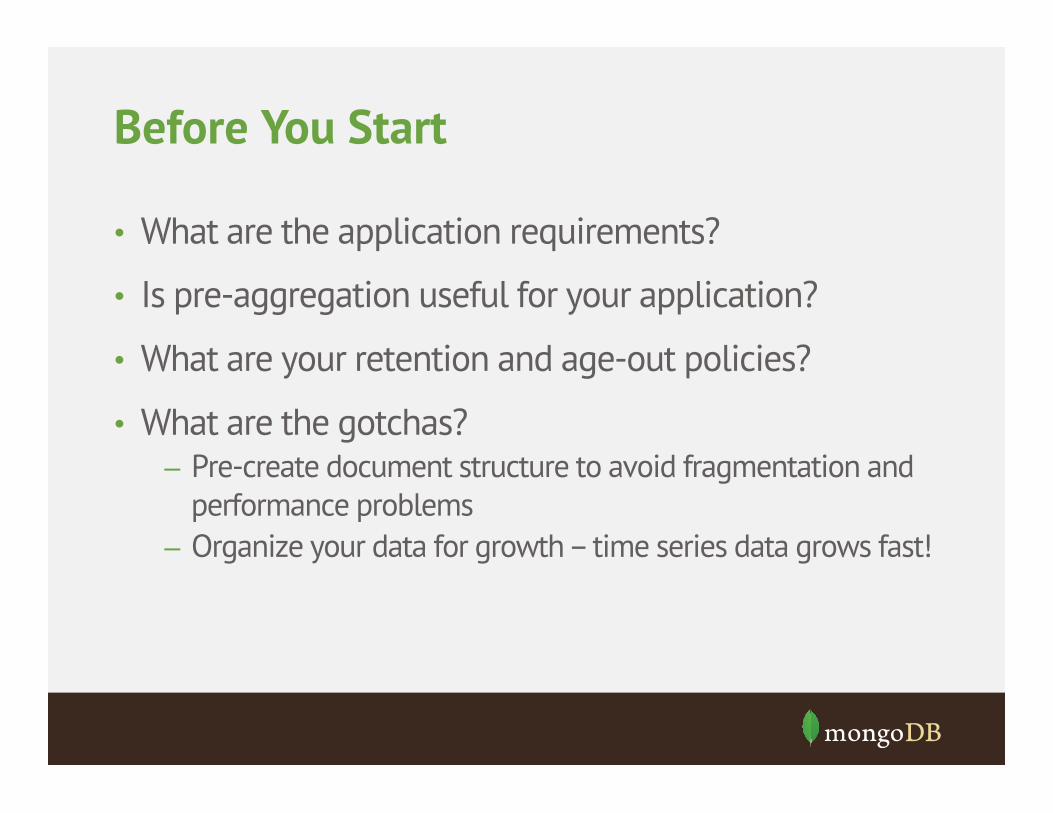
Before You Start
• What are the application requirements?
• Is pre-aggregation useful for your application?
• What are your retention and age-out policies?
• What are the gotchas? – Pre-create document structure to avoid fragmentation and
performance problems – Organize your data for growth – time series data grows fast!

Down The Road
• Scale-out considerations – Vertical vs. horizontal (with sharding)
• Understanding the data – Aggregation – Analytics – Reporting
• Deeper data analysis – Patterns – Predictions

Scaling Time Series Data in MongoDB
• Vertical growth – Larger instances with more CPU and memory – Increased storage capacity
• Horizontal growth – Partitioning data across many machines – Dividing and distributing the workload
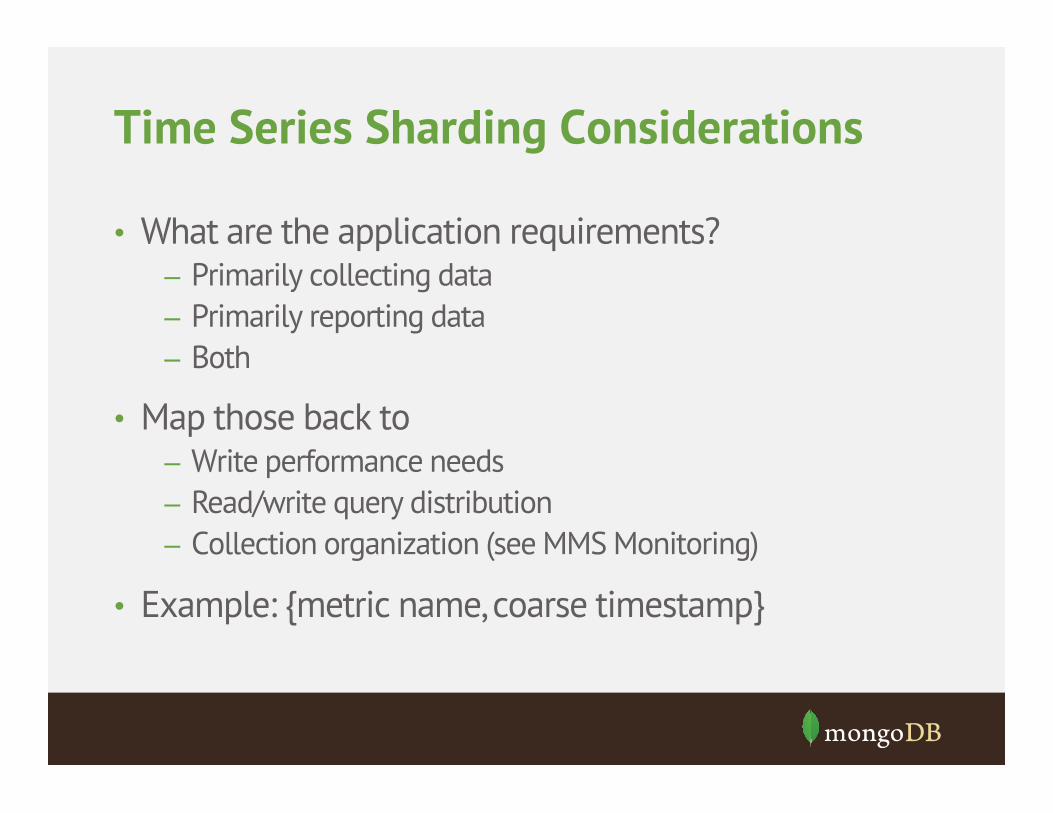
Time Series Sharding Considerations
• What are the application requirements? – Primarily collecting data – Primarily reporting data – Both
• Map those back to – Write performance needs – Read/write query distribution – Collection organization (see MMS Monitoring)
• Example: {metric name, coarse timestamp}
Aggregates, Analytics, Reporting
• Aggregation Framework can be used for analysis – Does it work with the chosen schema design? – What sorts of aggregations are needed?
• Reporting can be done on predictable, rolling basis – See “Hierarchical Aggregation”
• Consider secondary reads for analytical operations – Minimize load on production primaries

Deeper Data Analysis
• Leverage MongoDB-Hadoop connector – Bi-directional support for reading/writing – Works with online and offline data (e.g. backup files)
• Compute using MapReduce – Patterns – Recommendations – Etc.
• Explore data – Pig – Hive

Questions?
Resources
• Schema Design for Time Series Data in MongoDB http://blog.mongodb.org/post/65517193370/schema-design-for-time-series-data-in-mongodb
• Operational Intelligence Use Case http://docs.mongodb.org/ecosystem/use-cases/#operational-intelligence
• Data Modeling in MongoDB http://docs.mongodb.org/manual/data-modeling/
• Schema Design (webinar) http://www.mongodb.com/events/webinar/schema-design-oct2013


