Time flows, on Gr aph Managing event sequences and me series with a Document- Graph Database FOSDEM 2015 Enrico Risa Orient Technologies LTD Twier: @wolf4ood Emanuele Tagliaferri Orient Technologies LTD Twier: @tglman
Transcript
Time flows, on Graph
Managing event sequences and time series with a Document-Graph Database
FOSDEM 2015
Enrico Risa
Orient Technologies LTD
Twitter: @wolf4ood
Emanuele Tagliaferri
Orient Technologies LTD
Twitter: @tglman
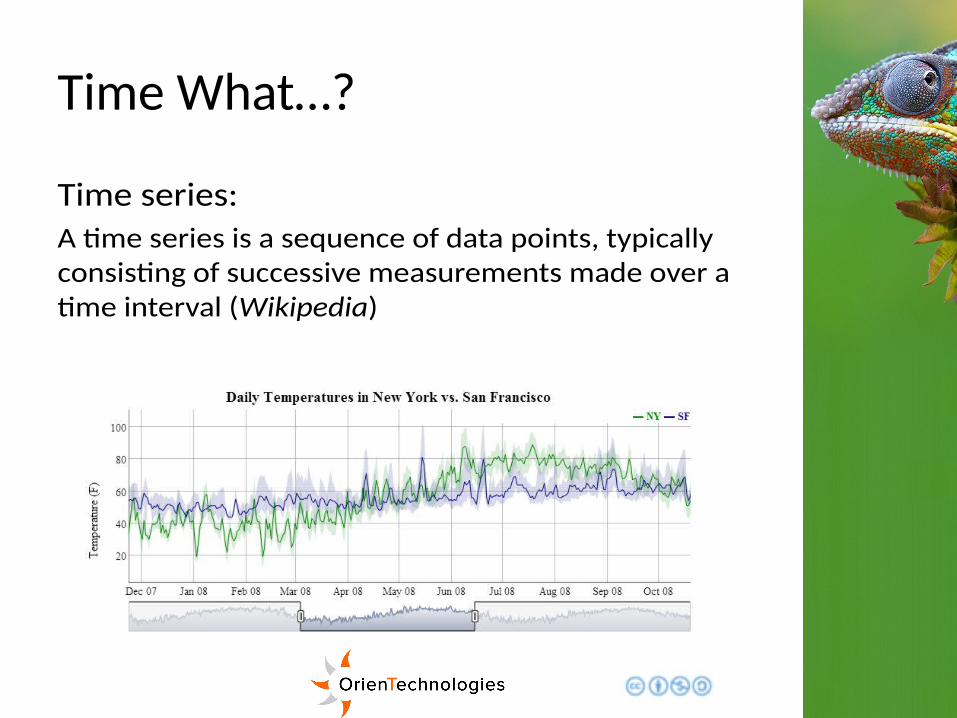
Time What…?
Time series: A time series is a sequence of data points, typicallyconsisting of successive measurements made over atime interval (Wikipedia)
Time What…?
Event sequences:
• A set of events with a timestamp
• A set of relationships “happenedbefore/after”
• Cause and effect relationships
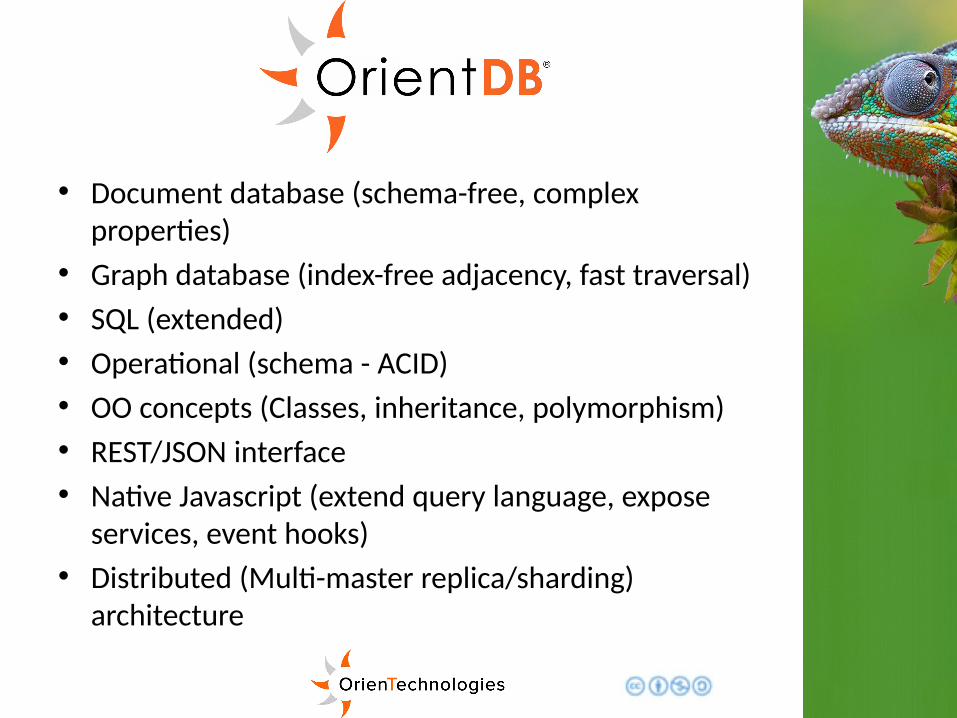
Graph approaches
•. Nodes/Edges
•. Index free adjacency
•. Fast traversal
•. Dynamic structure
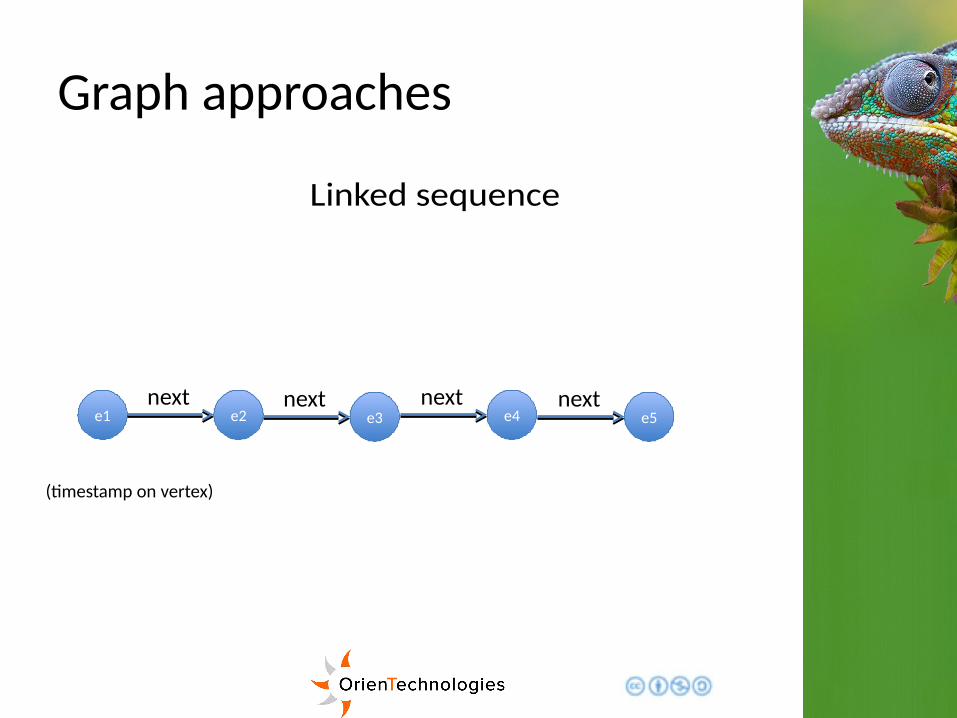
Graph approaches
Linked sequence
e1e1 e2e2next
e3e3next
e4e4next
e5e5next
(timestamp on vertex)
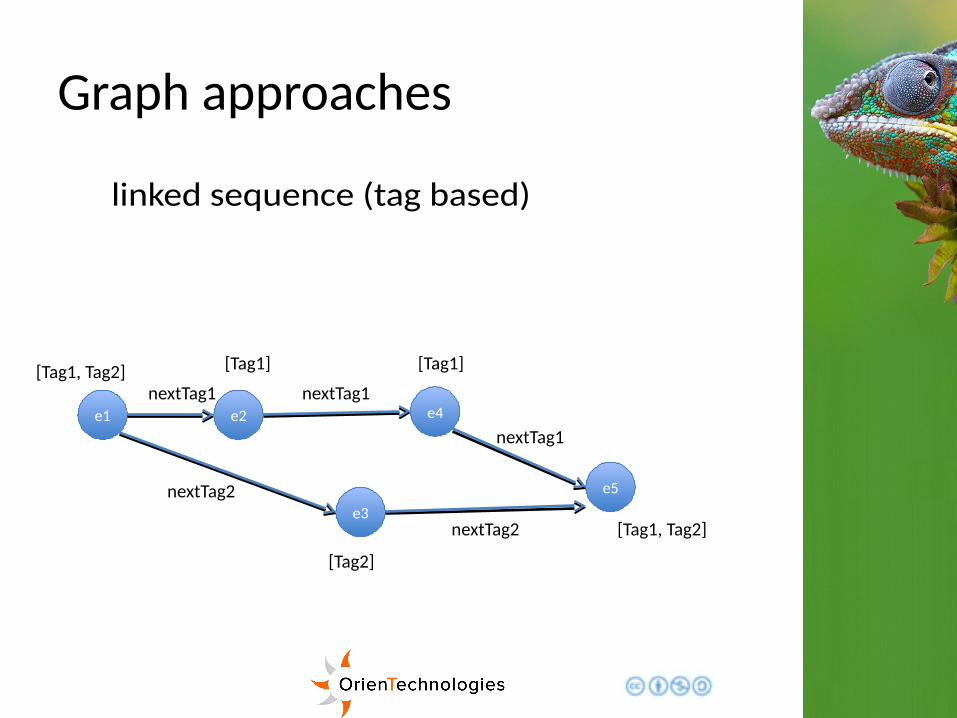
Graph approaches
linked sequence (tag based)
e1e1 e2e2
nextTag1
e3e3
nextTag2
e4e4nextTag1
e5e5
nextTag1
nextTag2
[Tag1, Tag2] [Tag1]
[Tag1, Tag2]
[Tag1]
[Tag2]
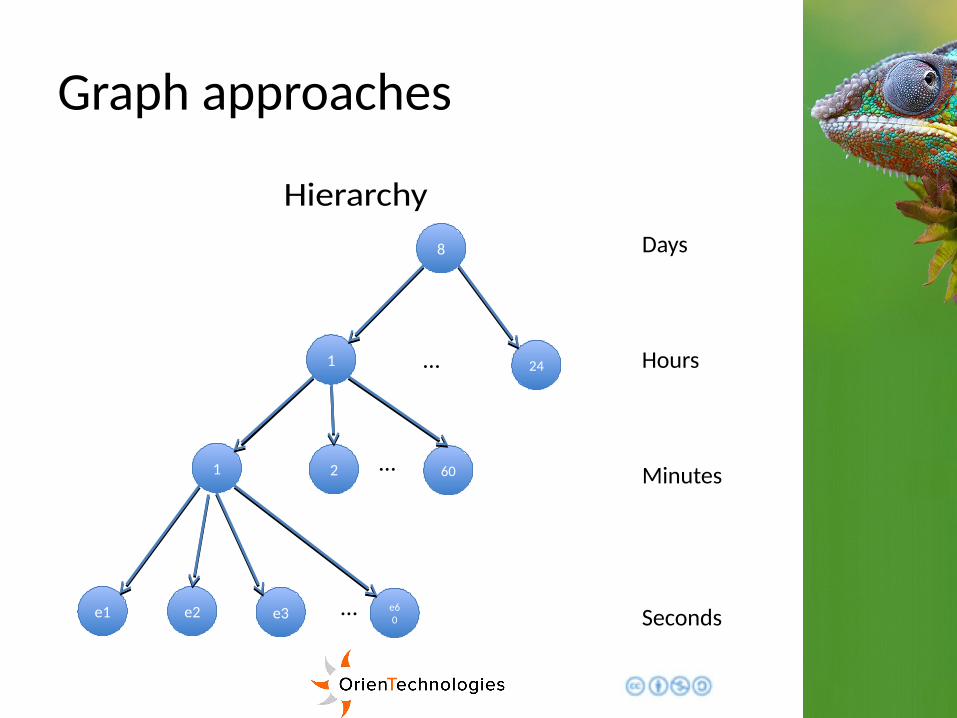
Graph approaches
Hierarchy
e1e1 e2e2 e60
e60
11
11
88
2424
22 6060…
…
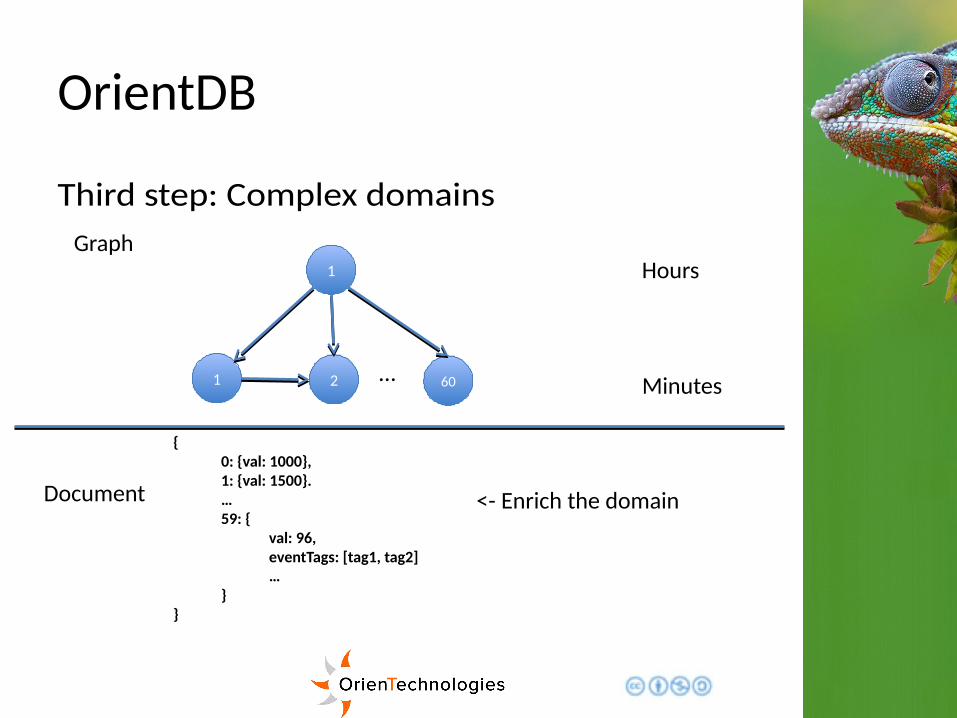
Days
Hours
Minutes
Seconds
…
e3e3
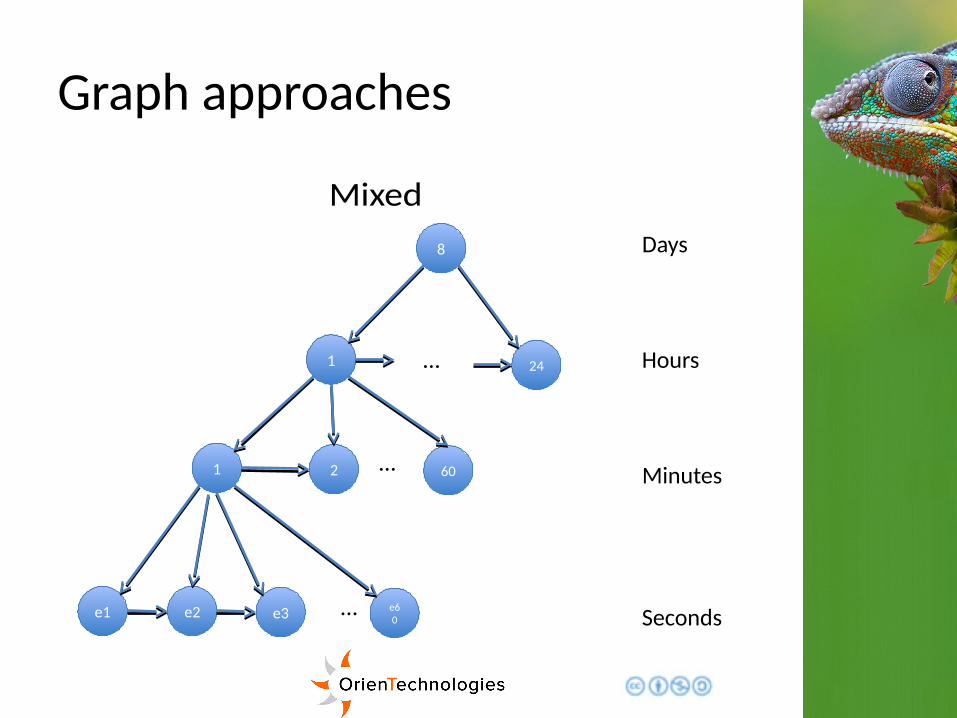
Graph approaches
Mixed
e1e1 e2e2 e60
e60
11
11
88
2424
22 6060…
…
Days
Hours
Minutes
Seconds
…
e3e3
Current approaches
Advantages
•. Flexible
•. Events can be connected together in different ways
•. You can navigate events following a path by time ortag.
Current approaches
Disadvantages
•. Slow query for a high number of event
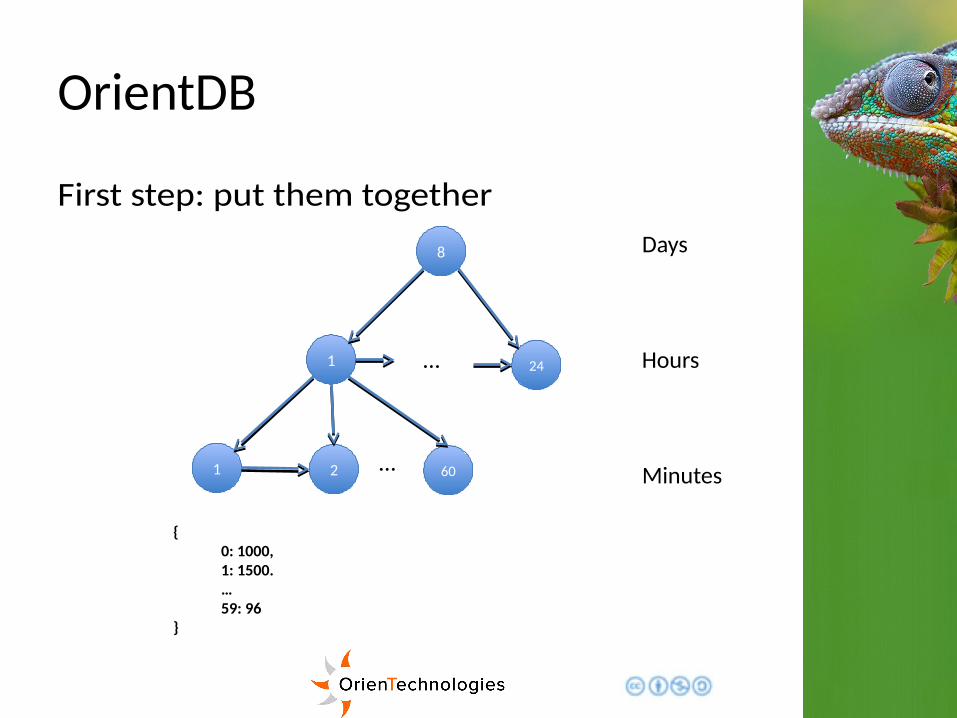
Optimization
● Data Pre-Aggregation
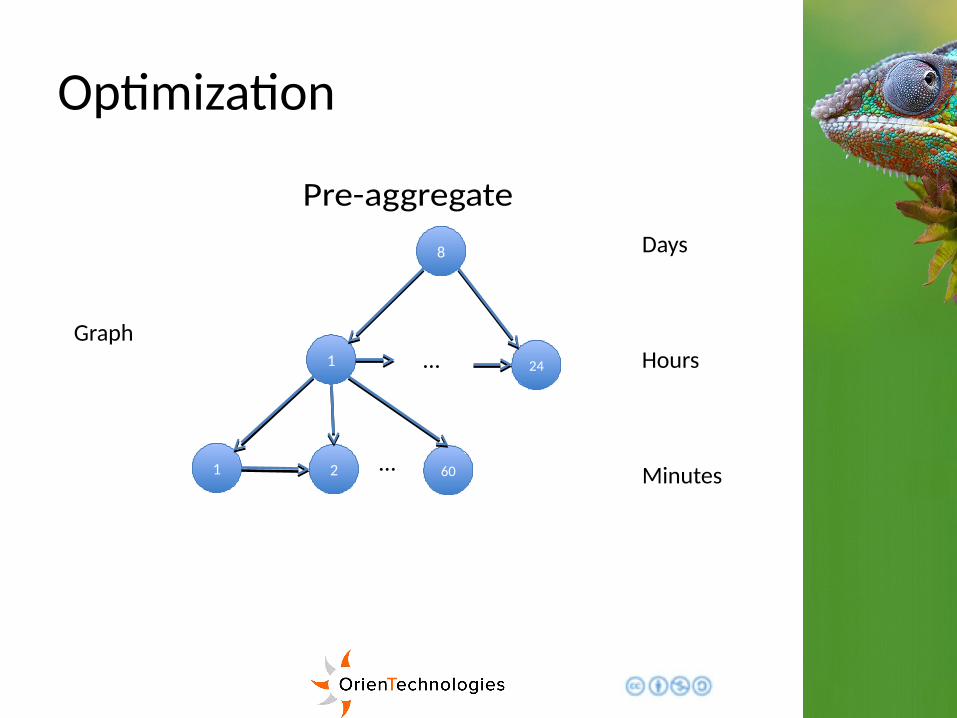
Optimization
Pre-aggregate
11
11
88
2424
22 6060…
Days
Hours
Minutes
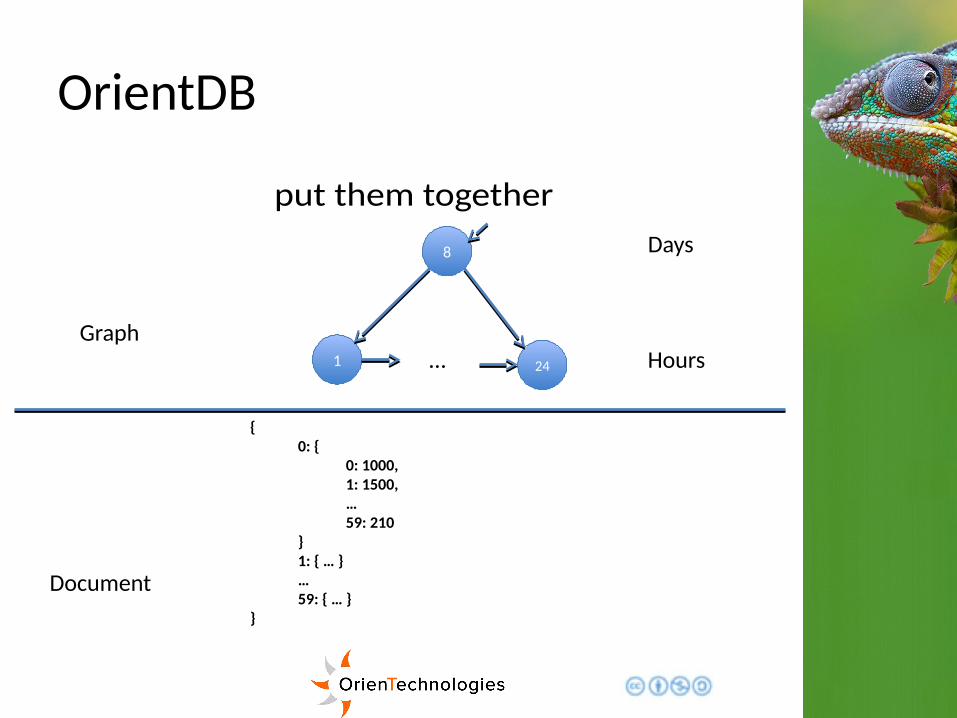
…Graph
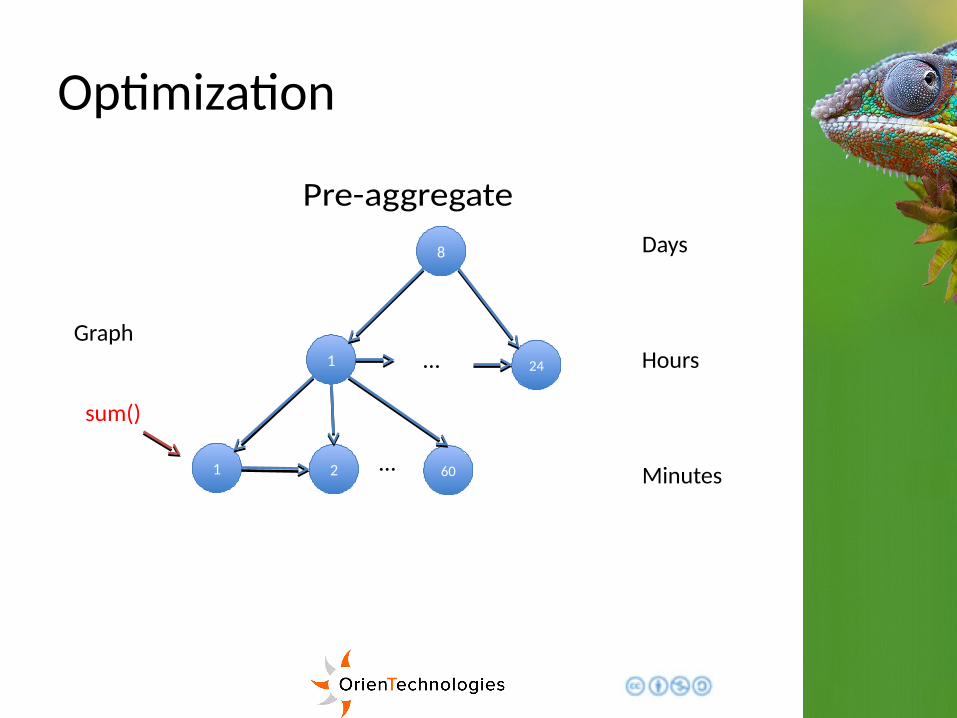
Optimization
Pre-aggregate
11
11
88
2424
22 6060…
Days
Hours
Minutes
…Graph
sum()
Optimization
Pre-aggregate
11
11
88
2424
22 6060…
Days
Hours
Minutes
…Graph
sum()
sum()
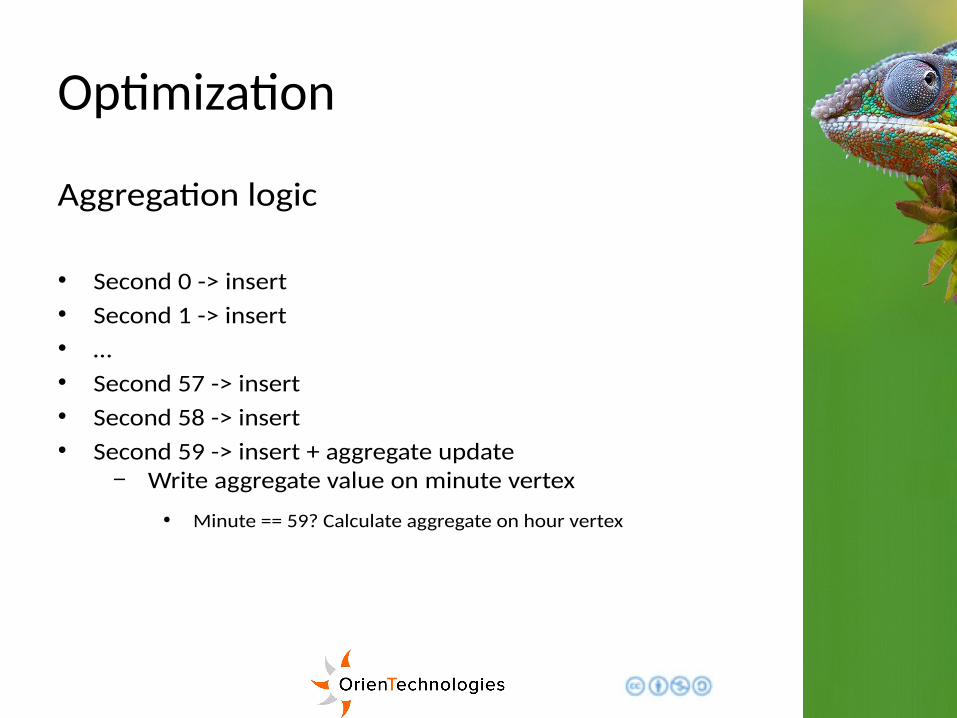
Optimization
Aggregation logic
• Second 0 -> insert
• Second 1 -> insert
• …
• Second 57 -> insert
• Second 58 -> insert
• Second 59 -> insert + aggregate update– Write aggregate value on minute vertex
● Minute == 59? Calculate aggregate on hour vertex
OrientDB
How to aggregate
Hooks: Server side triggers (Java or Javascript),executed when DB operations happen (eg. Insert orupdate)
Java interface:
Public RESULT onBeforeInsert(…);
public void onAfterInsert(…);public RESULT onBeforeUpdate(…);
public void onAfterUpdate(…);
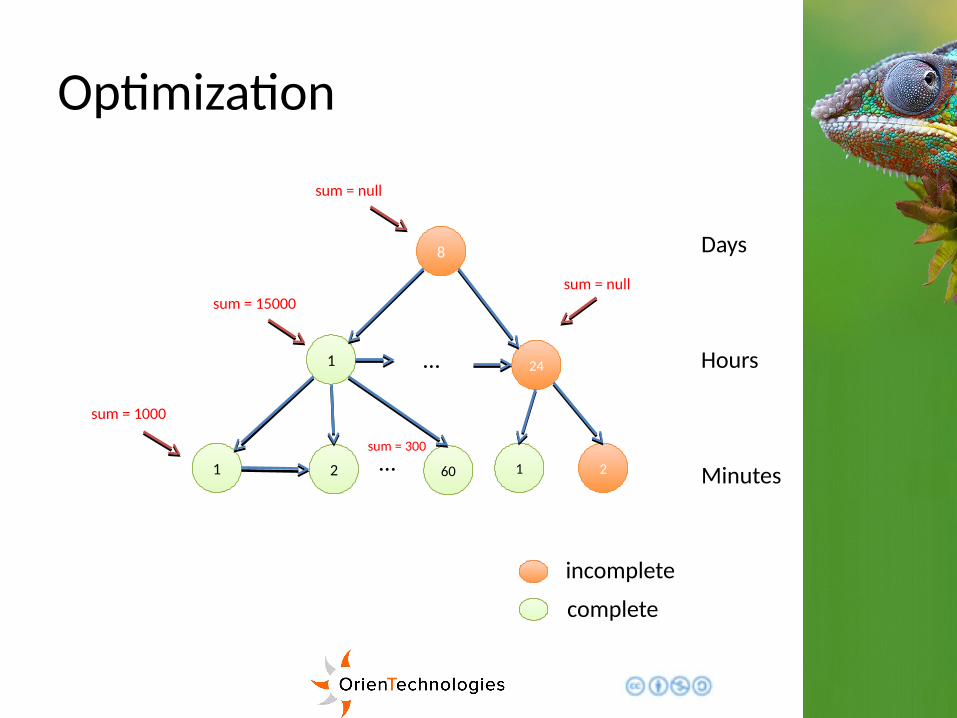
Optimization
11
11
88
2424
22 6060…
Days
Hours
Minutes
…
sum = 1000
sum = 15000
sum = 300
incomplete
complete
11 22
sum = null
sum = null
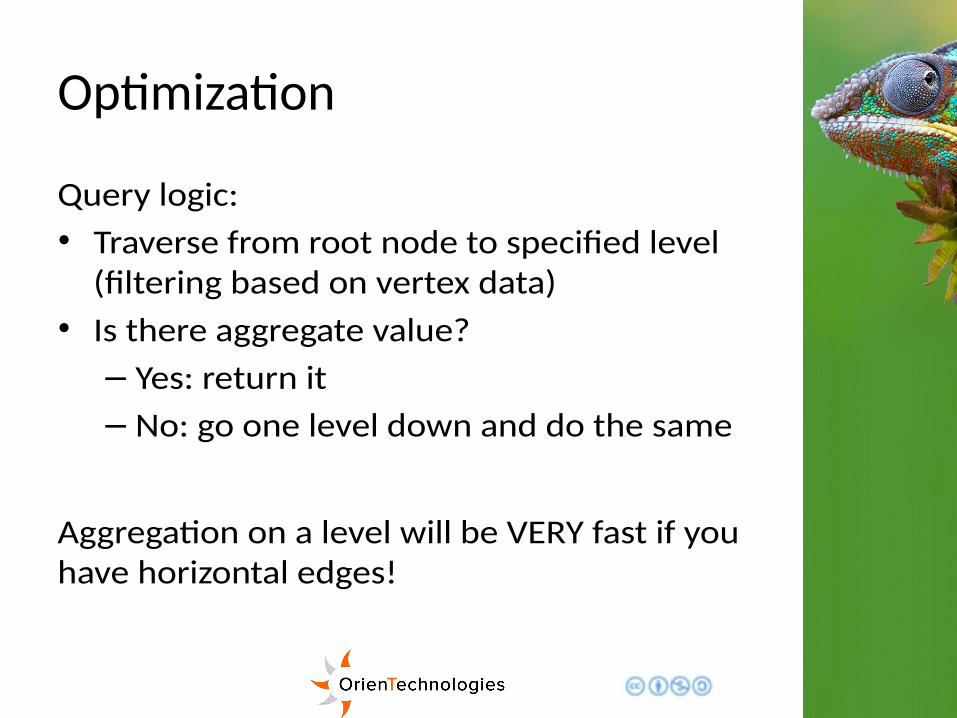
Optimization
Query logic:
• Traverse from root node to specified level(filtering based on vertex data)
• Is there aggregate value?
– Yes: return it
– No: go one level down and do the same
Aggregation on a level will be VERY fast if youhave horizontal edges!
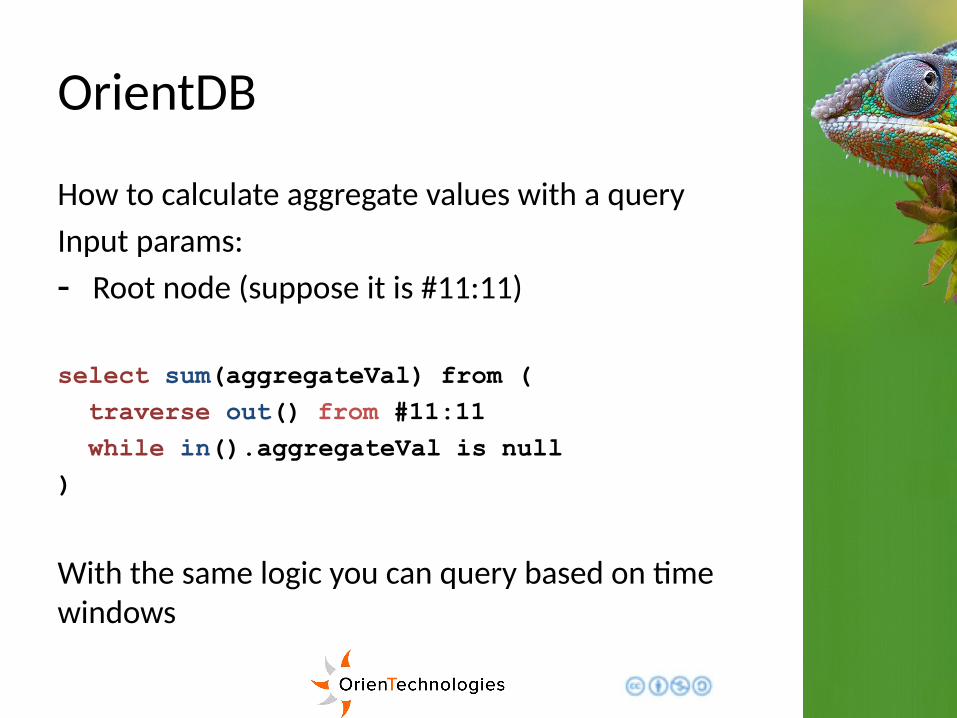
OrientDB
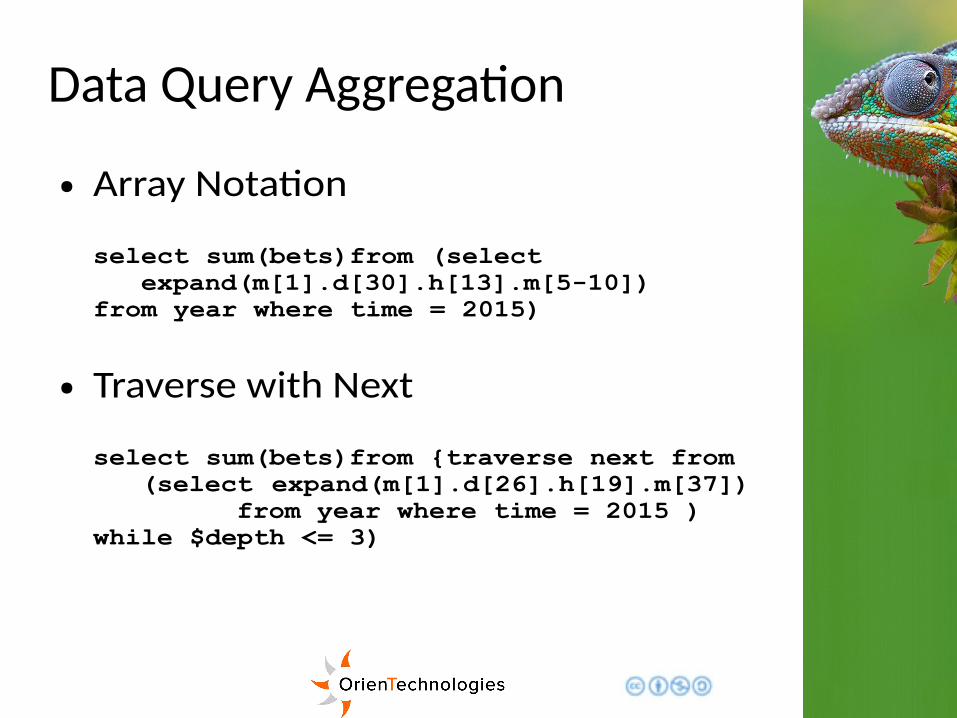
How to calculate aggregate values with a query
Input params:
- Root node (suppose it is #11:11)
select sum(aggregateVal) from (
traverse out() from #11:11
while in().aggregateVal is null
)
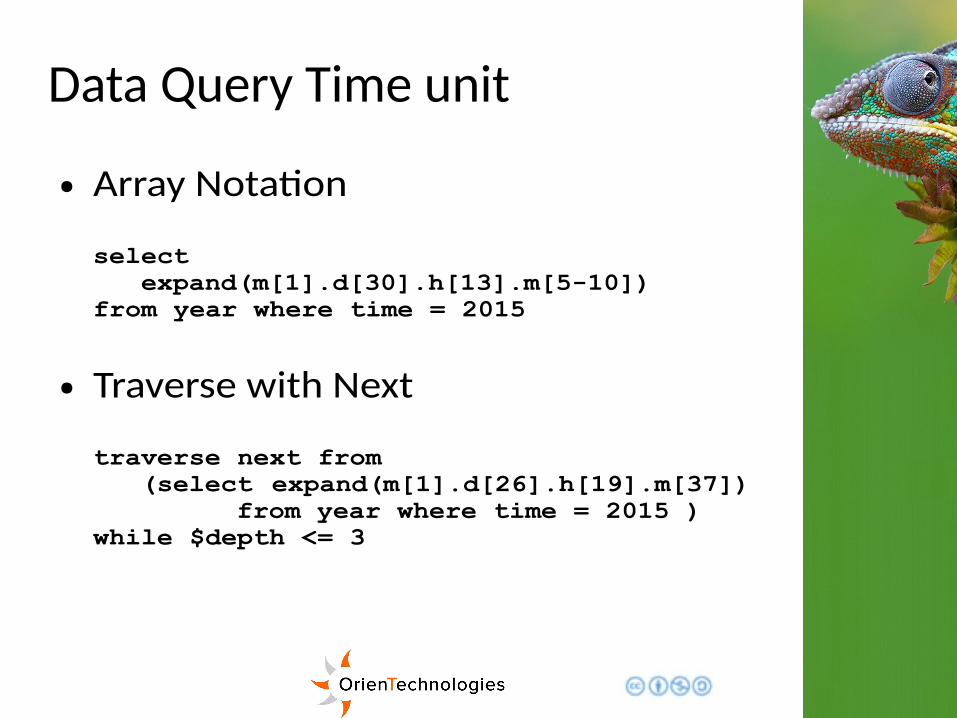
With the same logic you can query based on timewindows
Time Series Proof of Concept
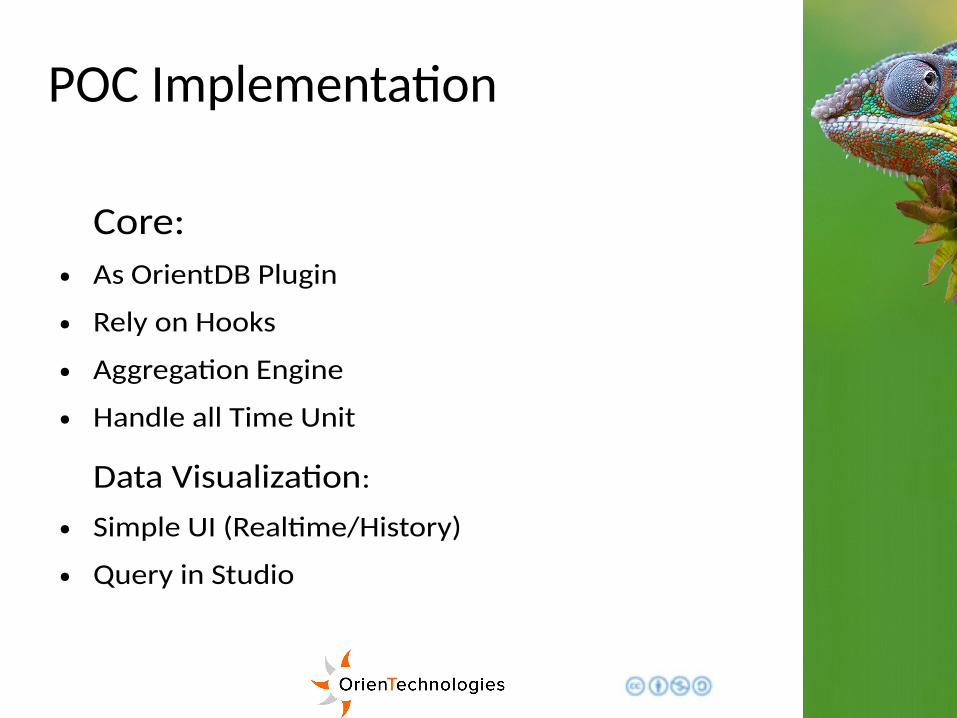
POC Implementation
Core:● As OrientDB Plugin
● Rely on Hooks
● Aggregation Engine
● Handle all Time Unit
Data Visualization:
● Simple UI (Realtime/History)
● Query in Studio
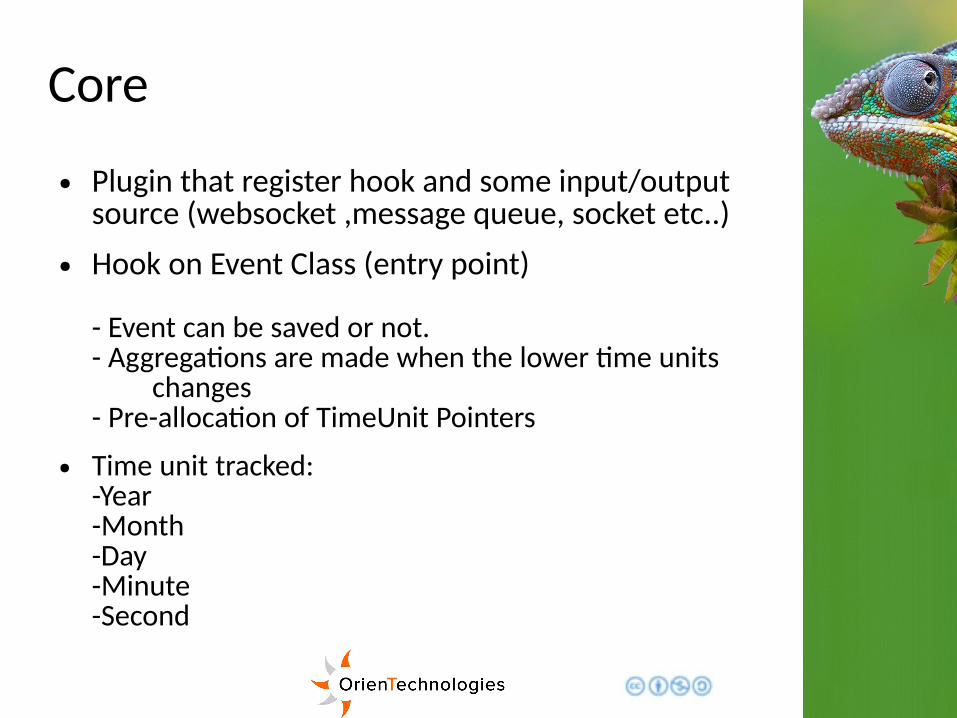
Core
● Plugin that register hook and some input/outputsource (websocket ,message queue, socket etc..)
● Hook on Event Class (entry point)
- Event can be saved or not.- Aggregations are made when the lower time units changes- Pre-allocation of TimeUnit Pointers
● Time unit tracked:-Year-Month-Day-Minute-Second
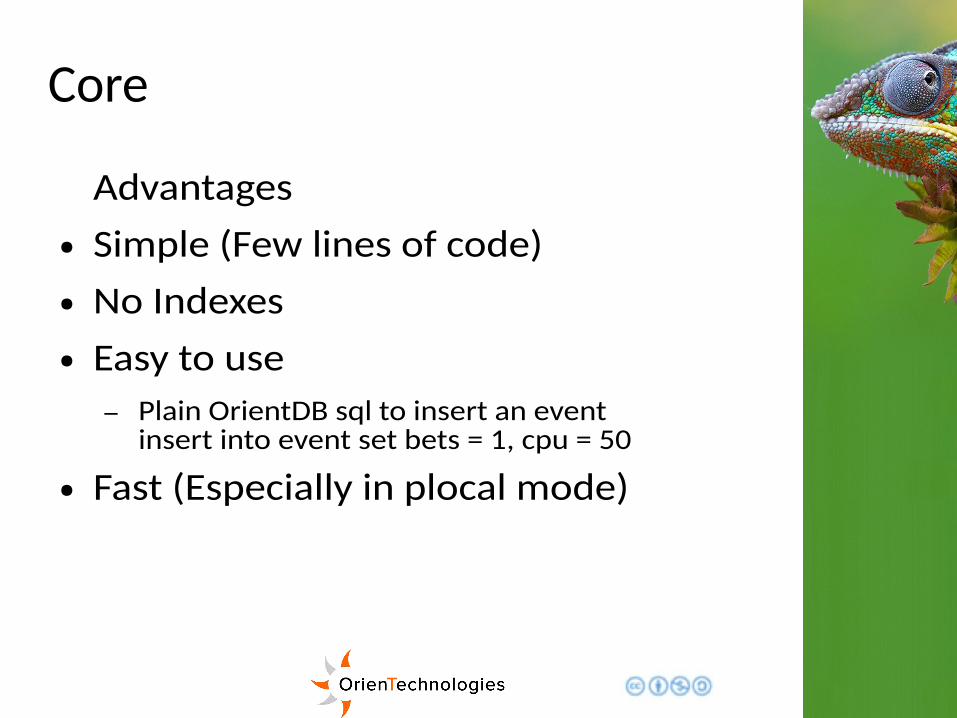
Core
Advantages
● Simple (Few lines of code)
● No Indexes
● Easy to use
– Plain OrientDB sql to insert an eventinsert into event set bets = 1, cpu = 50