87
Time Synchronization in ANT Wireless Low Power Sensor Network Nathirulla Sheriff THESIS WORK 2010 Electrical Engineering

Time Synchronization in ANT Wireless Low Power
Sensor Network
Nathirulla Sheriff
THESIS WORK 2010
Electrical Engineering

Time Synchronization in ANT Wireless Low Power
Sensor Network
Nathirulla Sheriff
This thesis work is performed at Jönköping University within the subject
area of Electrical Engineering. The work is part of the Master’s Degree
Program with the Specialization in Embedded Systems.
The authors are responsible for the given opinions, conclusions and results.
Supervisor : Alf Johannson
Examiner : Prof. Youzhi Xu
Credit points: 30 points (D-level)
Date
Abstract
i
Abstract
Short range wireless data communication networks that are used for sport and health care
are sometimes called Wireless Body Area Networks (WBANs) and they are located more
or less on a person. Sole Integrated Gait Sensor (SIGS) is a research project in WBAN,
where wireless pressure sensors are placed like soles in the shoes of persons with
different kinds of deceases. The sensors can measure the pressure of the foot relative to
the shoe i.e. the load of the two legs is measured. This information can be useful e.g. to
not over or under load a leg after joint replacement or as a bio feedback system to help
e.g. post stroke patients to avoid falling. The SIGS uses the ANT Protocol and radio
specification. ANT uses the 2.4 GHz ISM band and TDMA is used to share a single
frequency. The scheduling of time slots is adaptive isochronous co-existence i.e. the
scheduling is not static and each transmitter sends periodically but checks for interference
with other traffic on the radio channel. In this unidirectional system sole sensors are
masters (transmitters) and the WBAN server is the slave in ANT sense. The message rate
is chosen as 8 Hz which is suitable for low power consumption. Hence in the SIGS
system, it is necessary to synchronize the left and the right foot sensors because of low
message rate.
In our thesis, we found a method and developed a prototype to receive the time
synchronized data in WBAN server from ANT wireless sensor nodes in SIGS system.
For this thesis work, a hardware prototype design was developed. The USB and USART
communication protocols were also implemented in the hardware prototype. The suitable
method for time synchronization was implemented on the hardware prototype. The
implemented method receives the sensor data, checks for the correct stream of data; add
timestamp to the sensor data and transmit the data to the Linux WBAN server. The time
slots allocation in the ANT protocol was found. Alternative solution for the time
synchronization in ANT protocol was also provided. The whole SIGS system was tested
for its full functionality. The experiments and analysis which we performed were
successful and the results obtained provided good time synchronization protocol for ANT
low power wireless sensor network and for Wireless Bio-feedback system.

Sammanfattning
ii
Sammanfattning
Trådlös korthållskommunikation, som används inom sport och hälsovård, kallas ofta
”Wireless Body Area Networks” (WBAN) och dessa placeras mer eller mindre på en
person eller i dess omedelbara närhet. ”Sole Integrated Gait Sensor” (SIGS) är ett
WBAN-forskningsprojekt där trådlösa tryckgivare placeras likt skosulor (invändiga) hos
personer med olika typer av fysiska gångrelaterade problem. Sensorerna kan mäta trycket
mellan fot och sko i ett antal punkter och därmed bestämma belastningen (kraften) för ett
eller båda benen. Denna information kan användas i ett ”bio feedback system” för att
hjälpa patienten att inte under- eller överbelasta ett ben tex. efter att en höftled bytts ut.
Post-stroke-patienter kan ha försämrad förmåga att känna att de är nära att falla. Bio-
feedback-systemet kan då användas för att jämföra belastningen på de båda benen och
därifrån förutsäga om patienten är nära att falla och i så fall via t.ex. ljudsignal eller ett
taktilt system göra patienten uppmärksam på vad som är på väg att hända. I SIGS-
systemet är det nödvändigt att tidssynkronisera mätningarna från höger och vänster
sensor (fot-sensor). SIGS använder ANT-protokollet för den trådlösa kommunikationen.
Radiofrekvensbandet som används är ISM (2.4 Ghz). För att rymma flera kanaler på
samma frekvensband används TDMA. ANT-sändarna sänder periodiskt i ”sin tidslucka”
men om annan radiotrafik (ANT eller annan) upptäcks så provas med en annan tidslucka
(”adaptive isochronous co-existance”). Systemet är konfigurerat för att vara enkelriktat
och ”fotsensorerna” är sändare (”masters”) och WBAN-servern är mottagare (”slave”).
I detta examensarbete fann vi en metod och utvecklade en prototyp för att ta emot
tidssynkroniserade data från ANT-sensor-noder i ett SIGS-system. I den använda
metoden tas sensor-data emot av ANT-mottagaren i WBAN-servern. Mellan
ANTmottagaren och WBAN-servern (Linux) finns en mikrokontroll-krets som
tidsstämplar erhållna datapaket innan de skickas vidare till applikationsprogrammet i
WBAN-servern. Alternativa metoder till tidsstämpling i mottagaren har också studerats.
Tester och analyser visar att tidsstämpling i mottagaren ger god uppskattning av
samplingstidpunkten i sensorerna (”sole sensors”) i ett ANT-baserat trådlöst ”Bio Feed
Back System”.

Acknowledgement
iii
Acknowledgement
First and foremost I would like to express my gratitude to my supervisor Alf Johansson
for his continuous supervision and suggestions throughout this thesis. As a master
program coordinator, his long-term guidance and dedicated demanding time was very
helpful in boosting our knowledge towards the electronics world.
I also extend my gratitude to Prof. Youzhi Xu for introducing us towards the platform of
wireless sensor networks and his guidance during my Master’s study has always been
invaluable.
My special thanks to Prof. Shashi Kumar for his encouragement and support throughout
my Master's study, which are always remembered.
I would like to thank all my teachers for their full time support and providing invaluable
knowledge during my Master’s study. Thanks to JTH and Sweden for providing a
beautiful environment and a realistic study atmosphere during my thesis work.
My eternal gratitude which cannot be expressed in simple words goes to my parents and
my elder brother for their encouragement and unconditioned support to me. Their prayers
and love provided me an everlasting support at every foot step during my difficult hours
from birth.
Last but not least, my thanks and love to all my friends for their discussions, friendship,
and all kinds of help. It’s my pleasure to work with all of them.

Keywords
iv
Keywords
Wireless Sensor Networks
Wireless Body Area Networks
Time Synchronization
Time Stamp Protocol
Global Clock Synchronization
ANT Protocol
Sole Integrated Gate Sensor
Health Care Systems

List of Abbreviations
v
List of Abbreviations
SIGS Sole Integrated Gait Sensor
WBAN Wireless Body Area Network
TDMA Time Division Multiple Access
USB Universal Serial Bus
USART Universal Asynchronous Receiver Transmitter
PCB Printed Circuit Board
JTAG Joint Test Access Group
WBSBN Wireless Body Sensor Biofeedback Network
GSM Global System for Mobile Communication
GPRS General Packet Radio Service
FTDI Future Technology Devices International
MCU Micro-Controller Unit
MAC Medium Access Control
RF Radio Frequency
Table of Contents
vi
Table of Contents 1 Introduction ......................................................................................... 1
1.1 Wireless Body Area Network .......................................................................................... 1
1.1.1 Health care Applications ...................................................................................................... 1
1.2 SIGS ................................................................................................................................. 2
1.2.1 ANT Protocol ........................................................................................................................ 2
1.2.2 Time Synchronization ............................................................................................................ 2
1.3 Thesis Objectives and Tasks ............................................................................................ 3
1.4 Thesis Layout ................................................................................................................... 3
2 Theoretical background ..................................................................... 5
2.1 ANT Protocol ................................................................................................................... 5
2.1.1 Introduction to ANT protocol ................................................................................................ 5
2.2 ANT topology .................................................................................................................. 6
2.2.1 ANT Node .............................................................................................................................. 6
2.2.2 ANT Channel ......................................................................................................................... 7
2.3 Why ANT Protocol ........................................................................................................ 11
2.4 Time synchronization ..................................................................................................... 12
2.4.1 Time synchronization in wireless sensor networks ............................................................. 12
2.5 Time synchronization protocols ..................................................................................... 12
2.5.1 Time synchronization in ANT wireless sensor networks ..................................................... 13
3 Wireless Body Sensor Biofeedback Network .................................. 18
3.1 Introduction to gait analysis ........................................................................................... 18
3.2 Feedback Systems for Health Care ................................................................................ 18
3.3 Sole Integrated Gait Sensor Analysis ............................................................................. 19
3.3.1 What is SIGS ....................................................................................................................... 19
3.4 System Architecture ....................................................................................................... 20
3.4.1 Central Node or Personal Server ........................................................................................ 21
3.4.2 Leaf Nodes or SIGS ............................................................................................................. 23
3.5 System Design and parameters ...................................................................................... 24
3.5.1 Time synchronization .......................................................................................................... 25
3.6 Reason for the extended research ................................................................................... 26
4 Implementation ................................................................................. 28
4.1 Research method ............................................................................................................ 28
4.2 Power Estimator ............................................................................................................. 29
4.2.1 Power Estimation with only Forward data ......................................................................... 30
4.2.2 Power Estimation with Forward data and reverse data ..................................................... 30
4.3 Assumptions and Design Decisions ............................................................................... 31
4.3.1 Time stamping at transmitter .............................................................................................. 31
Table of Contents
vii
4.3.2 Global clock ........................................................................................................................ 31
4.3.3 Time stamping at receiver ................................................................................................... 32
4.4 Implementation methods ................................................................................................ 32
4.4.1 Time stamping in SIGS ........................................................................................................ 32
4.4.2 Global clock ........................................................................................................................ 36
4.5 Hardware setup ............................................................................................................... 41
4.6 PCB design board ........................................................................................................... 42
4.6.1 Olimex Board ...................................................................................................................... 43
4.6.2 JTAG port and Debugger .................................................................................................... 44
4.6.3 Transceiver nRF24AP1 with Trace Antenna ...................................................................... 45
4.7 Sole Integrated Gait Sensor (SIGS) ............................................................................... 46
4.8 Server ............................................................................................................................. 46
4.9 Software setup ................................................................................................................ 48
4.9.1 Atollic True Studio .............................................................................................................. 48
4.9.2 QtiPlot ................................................................................................................................. 48
4.10 Development phase ........................................................................................................ 49
4.10.1 Software algorithm .............................................................................................................. 49
4.10.2 Configuration of the OLIMEX Board ................................................................................. 50
4.10.3 Timer Configuration for Time Stamp Protocol ................................................................... 51
4.10.4 Implementation of Time Stamp Protocol............................................................................. 53
5 Analysis and Performance results.................................................... 56
5.1 Experimental Setup ........................................................................................................ 56
5.2 Testing phases ................................................................................................................ 57
5.2.1 Functional tests ................................................................................................................... 57
5.2.2 Performance tests ................................................................................................................ 58
5.2.3 Robustness tests................................................................................................................... 64
5.2.4 Final test results with overall observation for protocol ...................................................... 65
6 Conclusions ....................................................................................... 68
6.1 Summary and Discussions ............................................................................................. 68
6.2 Future work .................................................................................................................... 69
7 References ......................................................................................... 70
8 APPENDIX ........................................................................................... 72
8.1 Schematic of SIGS system ............................................................................................. 72
8.2 Schematic of the ANT-ARM-USB Hardware Prototype ............................................... 74
8.3 Schematic of OLIMEX STM32 H103 Development Board .......................................... 75

List of Figures
viii
LIST OF FIGURES
FIGURE 2-1 OSI LAYER MODEL OF ANT PROTOCOL .............................................................. 5
FIGURE 2-2 ANT NETWORK TOPOLOGY ................................................................................ 6
FIGURE 2-3. CHANNEL COMMUNICATION BETWEEN TWO NODES ............................................ 7
FIGURE 2-4. CHANNEL TYPE DESCRIPTION ........................................................................... 9
FIGURE 2-5. COMPARISON BETWEEN DIFFERENT PROTOCOLS ............................................. 11
FIGURE 2-6. TDMA TECHNIQUE IN ANT PROTOCOL ........................................................... 14
FIGURE 2-7. TIME SLOTS ALLOCATION IN ANT PROTOCOL ................................................... 14
FIGURE 2-8 GLOBAL CLOCK SYNCHRONIZATION .................................................................. 17
FIGURE 3-1 SOLE INTEGRATED GAIT SENSOR ...................................................................... 21
FIGURE 3-2 LEAF NODES OR SIGS ...................................................................................... 23
FIGURE 3-3 ANT PROTOCOL PARAMETERS .......................................................................... 25
FIGURE 3-4 ANT MESSAGE STRUCTURE OF THE DATA PACKET ............................................. 26
FIGURE 4-1 SYSTEM DEVELOPMENT RESEARCH METHOD .................................................... 28
FIGURE 4-3 COMMUNICATION PROTOCOL DESIGN IN SIGS ................................................. 34
FIGURE 4-4 ANT TRANSCEIVER PROTOCOL ......................................................................... 35
FIGURE-4-5 TRANSMITTER PROTOCOL WITH GLOBAL CLOCK SYNCHRONIZATION ................ 37
FIGURE 4-6 COMMUNICATION PROCESS WITH GLOBAL CLOCK SYNCHRONIZATION .............. 38
FIGURE 4-7 ANT-ARM-USB HARDWARE PROTOTYPE ......................................................... 41
FIGURE 4-8 PCB DESIGN BOARD ........................................................................................ 42
FIGURE 4-9 OLIMEX PROTOTYPE BOARD .......................................................................... 43
FIGURE 4-10. ST-LINK DEBUGGER .................................................................................... 45
FIGURE 4-11 TRANSCEIVER NRF24AP1WITH TRACE ANTENNA ............................................ 45
FIGURE 4-12. SOLE INTEGRATED GATE SENSOR .................................................................. 46
FIGURE 4-13. NEOFREERUNNER SMARTPHONE ................................................................... 47
FIGURE 4-14. SOFTWARE ALGORITHM ................................................................................. 49
FIGURE 4-15. ANT MESSAGE STRUCTURE ON NETWORK LAYER ........................................... 53
FIGURE 4-16. FSM FOR SOFTWARE STRUCTURE .................................................................. 54
FIGURE 5-1 PRESSURE SENSOR VALUES OF TWO SOLES ARE PLOTTED AGAINST TIME TO CHECK
THE FUNCTIONALITY OF THE SIGS SYSTEM .................................................................... 57
FIGURE 5-2 PRESSURE SENSOR VALUES OF TWO SOLES ARE PLOTTED AGAINST TIME TO CHECK
THE PERFORMANCE OF THE SIGS SYSTEM WHILE WALKING ........................................... 59
FIGURE 5-3 PRESSURE SENSOR VALUES ARE PLOTTED AGAINST TIME TO CHECK THE
PERFORMANCE OF TIME STAMPING AT THE RECEIVER .................................................... 62

List of Figures
ix
FIGURE 5-4 PRESSURE SENSOR VALUES OF TWO SOLES ARE PLOTTED AGAINST TIME TO CHECK
THE ROBUSTNESS OF THE SIGS SYSTEM WITH DISTURBANCES ........................................ 64
FIGURE 5-5 NO. OF OBSERVATIONS ARE PLOTTED AGAINST TIME TO CHECK THE ALLOCATION
OF TIME SLOTS AND THE TIME SYNCHRONIZATION IN PROTOCOL.................................... 66
FIGURE 8-1 SCHEMATIC OF THE SIGS SOLE SYSTEM ............................................................ 72
FIGURE 8-2 SCHEMATIC OF THE SOLE SIGS SYSTEM ........................................................... 73
FIGURE 8-3 PCB SCHEMATIC OF ANT-ARM-USB .............................................................. 74
FIGURE 8-4 PIN CONFIGURATIONS BETWEEN OLIMEX BOARD AND ANT TRANSCEIVER ........ 74
FIGURE 8-5 SCHEMATIC OLIMEX STM32-H103 DEVELOPMENT BOARD ........................... 75

Introduction
1
1 Introduction
1.1 Wireless Body Area Network
In many developed countries, the aging population and rise in the costs of health care
have stepped forward to introduce the novel technology-driven enhancements into the
current health care practices. Recent advancements in the field of electronics have
enabled the automation world to develop tiny and intelligent bio-medical sensors. The
sensors can be worn on or implanted in the human body for different purposes. These
bio-medical sensors shall send their data to an external server or PC, where the received
data can be analyzed and stored for future purposes. For this purpose, using a wired
connection seems too burdensome and it involves a very high cost for deployment and
maintenance [17].
The use of wireless technology in the field of health care plays an important role and
could be a possible solution to solve the wired connection problem. The use of a wireless
interface for health care enables an easier application and is more cost efficient. The
wireless technology could help the patient to experience a greater physical mobility and
they are no longer compelled to stay in a hospital. This present trend could replace the
bottlenecks in the past and could provide a greater enhancement for personal health care
with low costs of the health care system.
In order to utilize the benefits of wireless technologies in telemedicine and for mobile
Health care services in an efficient way, a new type of wireless network emerges: a
wireless on-body network or a Wireless Body Area Network (WBAN) [17]. Short range
wireless data communication networks that are used for sport and health care are
sometimes called Wireless Body Area Networks (WBANs) and they are located more or
less on a person. In WBAN, various sensors are attached on clothing or on the body or
even implanted under the skin. The wireless nature of the network and the usage of wide
variety of sensors in WBAN provide an environment to develop many new, practical and
innovative applications to improve the health care.
1.1.1 Health care Applications
WBAN technology could provide a platform to support the elderly in managing their
daily life and medical conditions. The main cause for the sudden death in the world is

Introduction
2
Cardio Vascular Disease (CVD), representing 30% of all global deaths. An estimated
world-wide population of about 17.5 million people dies of heart attacks or strokes each
year [18]. These deaths could be prevented by continuous monitoring the patients and
through proper health care with the help of WBAN technology.
Similarly, WBAN allows continuous monitoring of physiological parameters. To monitor
patient’s health, it is not possible to monitor the patients with a shorter stay in the
hospital. The use WBAN could help the patient to move freely whether in hospital or at
home and it will be easier to monitor and collect the data of the patient for Doctors
analysis. WBAN can also be used to offer assistance to the disabled and in treatment of
many diseases.
1.2 SIGS
Sole Integrated Gait Sensor (SIGS) is a research project to develop a foot pressure
activated feedback system for enhancing static and dynamic balance in elderly subjects
who have suffered from a stroke. In this project, wireless pressure sensors are placed like
soles in the shoes of persons with different kinds of deceases. The sensors can measure
the pressure of the foot relative the shoe i.e. the load of the two legs is measured. This
information can be useful e.g. to not over or under load a leg after joint replacement or as
a bio feedback system to help e.g. post stroke patients to avoid falling.
1.2.1 ANT Protocol
In SIGS system, the protocol used for communication between two nodes is the ANT
Protocol. ANT [8] is a practical and a proprietary wireless sensor network protocol. Its
protocol stack enables the semiconductor radios to operate in 2.4 GHz ISM band. It is
best suited for low power and low data rate sensor network topologies for Wireless Body
Area Network (WBAN). It supports different data types in which the Broadcast data is
the most basic and system default data type.
1.2.2 Time Synchronization
Time synchronization deals to provide a solution where the internal clocks of several
systems may differ. Even if the clocks are initially set accurately, the real clocks will
differ after some amount of time because of the clock drift in the systems which are
caused by the clocks counting time, operating at slightly different rates.
Time synchronization protocols try to keep the nodes synchronized all the time
irrespective of the energy constraints. By keeping synchronized all the time, the system
Introduction
3
could consume more energy. But for several wireless sensor applications, there is of no
need for continuous synchronization. It could be of event-based. Depending on the
requirements, the protocols could be chosen for the best efficient output.
1.3 Thesis Objectives and Tasks
The aim of this thesis is to find a method and develop a prototype to receive the time
synchronized data in WBAN server from ANT wireless sensor nodes in SIGS system.
The message rate used in SIGS is very low with 8 Hz, to consume less power. Hence it is
essential to synchronize the system at low message rate. Whenever a data is received at
WBAN / Linux server through ANT protocol, the received data is difficult to handle
because of unknown sampling time. To overcome this problem, the new prototype was
designed. The SIGS system shall also be tested in different environments for time
synchronization and a detailed analysis will be made with suggestions for further
improvements in time synchronization for ANT low power wireless sensor network.
In order to achieve this goal, a detailed study on ANT protocol and time synchronization
protocols was made followed by SIGS system. With respect to the study, few decisions
were considered such as suitable method for time synchronization, selection of processor
for the prototype design and the software development environment. As part of the next
step, hardware prototype design was developed. The developed prototype should be
feasible for USB and USART communication. The suitable method for time
synchronization shall be developed on the hardware prototype. The implemented method
shall receive the sensor data, checks for the correct stream of data, add the timestamp
value to the sensor data and transmit the data to the Linux WBAN server.
In SIGS, the sampled data need to be synchronized because of low message rate. The
developed method shall provide time synchronization data for ANT wireless sensor
network. But however, through this time stamp method, we shall measure as when the
sensor data are sampled. The allocation of time slots in ANT protocol were also found
and better solution for time synchronization is suggested. The developed system should
be tested in different environments for analysis.
1.4 Thesis Layout
In this chapter, a brief introduction about this thesis is explained. We introduce with the
discussion about WBAN and its application. We also discussed about the SIGS system,
ANT protocol and Time synchronization. Finally, objectives and the tasks of the thesis
were discussed.
Introduction
4
In chapter 2, we describe about the theoretical background to understand the concepts of
ANT Protocol and Time Synchronization Protocols. This chapter also describes about the
reasons for choosing the protocol in our research.
In chapter 3, details about the WBSBN system and the reason for using this system for
our thesis work shall be discussed. We will also describe about the research problem and
it’s provided solution.
In chapter 4, the design algorithm for the proposed solution to the research problem was
discussed. The new design prototype for our research work was also described with its
hardware setup, software setup and the software implementation.
In chapter 5, performance analysis of the SIGS system and ANT protocol was focused.
Different testing phases and its obtained results were discussed with different graphs and
tables.
In chapter 6, the summary of the contributions and the conclusion of the thesis work with
plans for the future work were discussed.

Theoretical Background
5
2 Theoretical background
This chapter describes the theoretical background to understand the concepts of ANT
Protocol and Time Synchronization Protocols. This chapter also describes about the
reasons for choosing the protocol in the SIGS system.
2.1 ANT Protocol
2.1.1 Introduction to ANT protocol
ANT is a practical and a proprietary wireless sensor network protocol. Its protocol stack
enables the semiconductor radios to operate in 2.4 GHz ISM band. The protocol is
designed and marketed by Dynastream Innovations Inc., Canada. Its design is suited for
any kind of low data rate sensor network topologies in practical wireless sensor networks
(WSN), Wireless Body Area Networks (WBAN) and Personal Area Networks (PAN).
All ANT powered network nodes can operate for years as compared to months for other
technologies because of its energy efficient protocol.
In the OSI layer model of ANT shown in the figure 2-1, the protocol provides efficient
handling of the Datalink, Network and Transport layer along with the physical layer
provided by the Nordic 2.4 GHz radio. The top level Session, Presentation and
Application layers are user-defined. The interface design between the ANT and Host
application are made simpler for quick and easy implementation of ANT with new
devices and applications.
PRESENTATION
APPLICATION
SESSION
TRANSPORT
NETWORK
DATALINK
PHYSICAL
USER DEFINED
IMPLEMENTED BY ANT
NORDIC 2.4 GHz
Figure 2-1 OSI layer model of ANT Protocol
Theoretical Background
6
ANT features,
i. It is highly resource optimized wireless protocol.
ii. Easy to use because of its maximum flexibility and scalability in its design.
iii. The protocol is fully integrated network and channel management
iv. Useful for sensor and control applications because of its low power and low cost.
v. Provides reliable data communications, flexible and adaptive network operation
and cross-talk immunity.
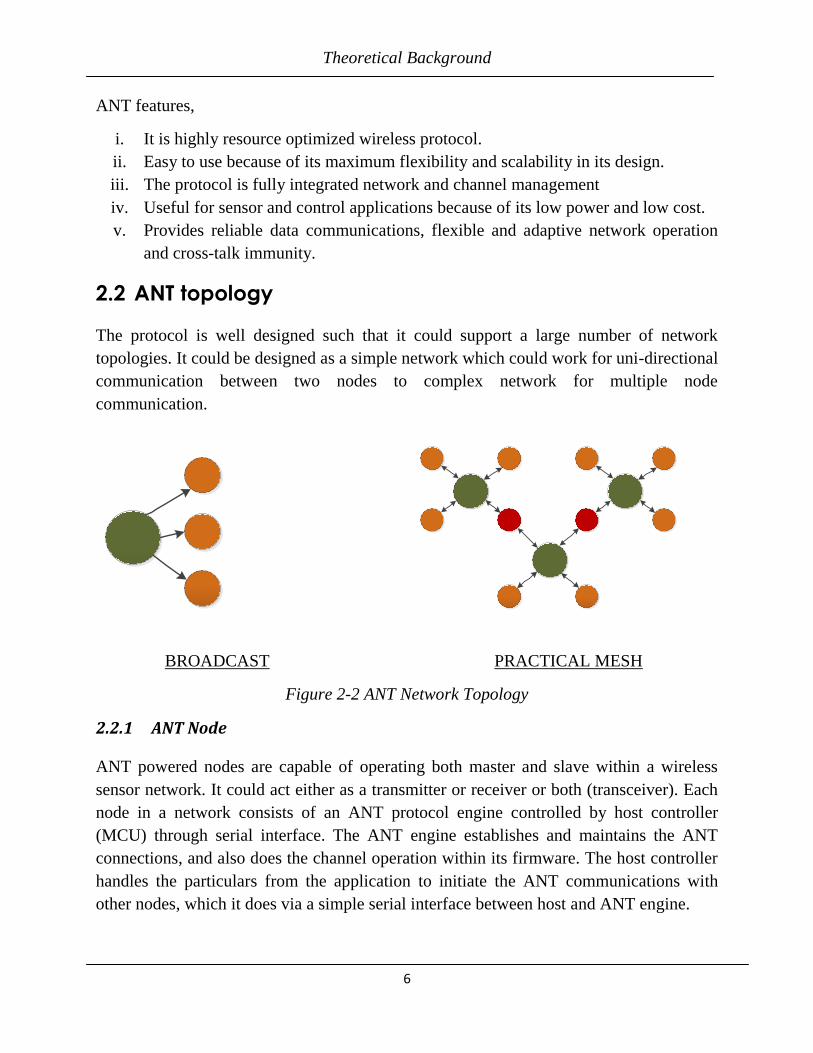
2.2 ANT topology
The protocol is well designed such that it could support a large number of network
topologies. It could be designed as a simple network which could work for uni-directional
communication between two nodes to complex network for multiple node
communication.
BROADCAST PRACTICAL MESH
Figure 2-2 ANT Network Topology
2.2.1 ANT Node
ANT powered nodes are capable of operating both master and slave within a wireless
sensor network. It could act either as a transmitter or receiver or both (transceiver). Each
node in a network consists of an ANT protocol engine controlled by host controller
(MCU) through serial interface. The ANT engine establishes and maintains the ANT
connections, and also does the channel operation within its firmware. The host controller
handles the particulars from the application to initiate the ANT communications with
other nodes, which it does via a simple serial interface between host and ANT engine.

Theoretical Background
7
2.2.2 ANT Channel
In wireless communication, a connection between two nodes is established through
channels. For a channel establishment between two nodes, one node should be a master
and the other should be a slave.
SERIAL INTERFACE
HOST MCU
ANT ENGINE
SERIAL INTERFACE
HOST MCU
ANT ENGINECHANNEL
Node 1: MASTER Node 2: SLAVE
Figure 2-3. Channel communication between two nodes
The type of communication between nodes in ANT channel is determined by ANT data
types such as Broadcast, Acknowledgement and Burst transfers. Whenever the Host
application sends a data message to ANT engine for transmission, it specifies the data
type along with the each data message it transmits.
The data messages between nodes are transferred in Forward (Master to Slave) or
Reverse (Slave to Master) direction. Once the channel is opened for communication, a
master device will transmit a message on each channel in their allocated time slot. The
slave sends back the data to master optionally in reverse direction.
1. ANT data types
The ANT supports three types of data type. Each data type is sent in 8 byte packets over
the RF channel [8]. The three data types can be sent in either the forward or reverse
direction, at the channel’s designated timeslot. But in case of uni-directional channels, it
can only send broadcast data in the forward direction.
a. Broadcast Data
Broadcast data is the most basic and system default data type. On every timeslot, the
broadcast data is always sent from Master node to Slave and vice versa only when there
is a request from the slave’s host MCU. When no new data is received from the host, the

Theoretical Background
8
message will be re-transmitted as broadcast message even if the previous message sent is
broadcast data or other data type.
Broadcast data is never acknowledged without any awareness of data loss. It consumes
very less power and least amount of RF bandwidth because of one way transmission. It
could be used at a place where occasional data loss could be tolerated such as
temperature logging system etc.
b. Acknowledged Data
In bi-directional connection either of forward or reverse direction, an acknowledged data
packet is sent back at the next time slot. Whenever a node sends an acknowledged data
packet, the receiver responds with an acknowledgment message back to the sender. The
host controller at the originating will get notified about the success or failure of the
received packet from the receiver.
Acknowledged data packets consume more power and use more RF bandwidth because
of bi-directional transmission, which should be taken into consideration when designing
power-sensitive applications. It is ideally suited for the transmission of control data,
ensuring that both nodes are aware of each other’s state [8]. For every new data
transmission from master, the data types need to be specified. If no new data is provided
at the next time slot, the message will be sent as Broadcast data as system default on the
next channel time slot.
c. Burst Data
For large amounts of data transmission to be sent between devices, Burst data
transmission is the preferred choice. It consists of a rapid series of continuous
acknowledged data messages. Similar to acknowledged messages, the receiver MCU will
be notified about the burst transfer’s success or failure.
In the burst data transmission the acknowledged success or failure notification will be for
the entire burst transfer rather than for each packet. Any lost data packets in the burst
transfer will be retried automatically and after five retries, the ANT will cancel the burst
transfer and notify the host MCU with a failure message. If there are other channels in the
system, care should be taken to service them with reasonable frequency.
The ANT protocol is robust and can handle the loss caused by burst transfers due to
external interference. However excessive channel starvation because of channel traffic,
Theoretical Background
9
may lead to loss of synchronization or data. Burst data transfer can create interference for
other devices that are operating at the same RF frequency.
2. Channel configuration
For communication between two ANT nodes, channel need to be configured commonly
in both the nodes. It needs some parameters that need to be commonly assigned in both
the ANT nodes. These parameters once assigned, remains constant throughout its
connection. But few parameters may be changed while the channel is open. For channel
configuration, the following parameters are required.
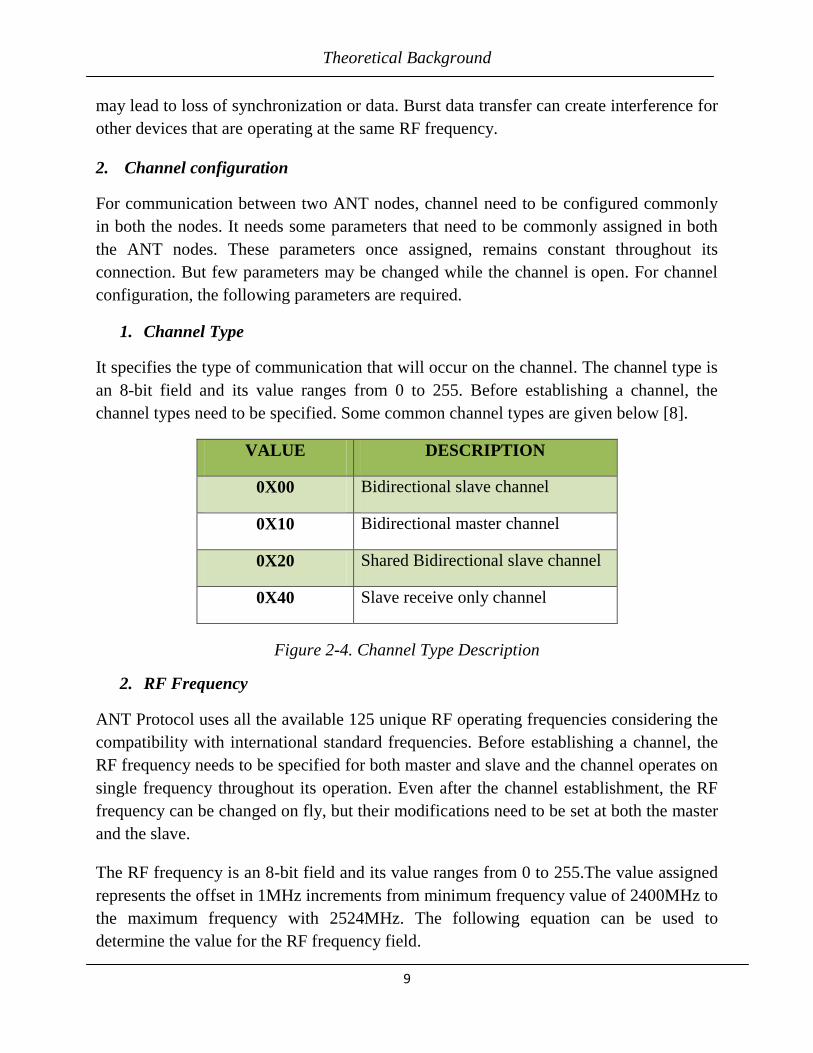
1. Channel Type
It specifies the type of communication that will occur on the channel. The channel type is
an 8-bit field and its value ranges from 0 to 255. Before establishing a channel, the
channel types need to be specified. Some common channel types are given below [8].
VALUE DESCRIPTION
0X00 Bidirectional slave channel
0X10 Bidirectional master channel
0X20 Shared Bidirectional slave channel
0X40 Slave receive only channel
Figure 2-4. Channel Type Description
2. RF Frequency
ANT Protocol uses all the available 125 unique RF operating frequencies considering the
compatibility with international standard frequencies. Before establishing a channel, the
RF frequency needs to be specified for both master and slave and the channel operates on
single frequency throughout its operation. Even after the channel establishment, the RF
frequency can be changed on fly, but their modifications need to be set at both the master
and the slave.
The RF frequency is an 8-bit field and its value ranges from 0 to 255.The value assigned
represents the offset in 1MHz increments from minimum frequency value of 2400MHz to
the maximum frequency with 2524MHz. The following equation can be used to
determine the value for the RF frequency field.

Theoretical Background
10
3. Channel ID
To establish an ANT channel, the host must specify its channel ID (for master) and the
channel ID it wishes to search (for slave). The devices with matching channel IDs can
communicate with each other. The channel ID is a 4-byte value which contains 3 fields.
Transmission Type
It is an 8-bit field used to define certain transmission characteristics of a device.
Device Type
It is an 8-bit field used to denote the class of each participating network device.
Device Number
It is a 16-bit field with unique number for a given device type.
The channel ID in the ANT protocol contains the device type, device number and
transmission type of the master device and must be specified on the master device. On a
slave device, these fields are set to determine which master device will communicate with
the slave.
4. Channel Period
The channel period represents the basic channel message rate of data packets sent by the
master. By default, a broadcast data packet will be sent and received. The channel
message rate ranges from 0.5Hz to above 200Hz.
The channel period is a 16-bit field with its value determined by the following equation.
The default message rate is 4Hz, which is chosen to provide good and robust
performance. The maximum message rate (or the minimum channel period) depends on
the computational capacity of the system.
5. Network
To communicate between two ANT nodes, they need to be members of the same
network. The ANT Network has two components.

Theoretical Background
11
Network number:
It is an 8-bit field that identifies the available networks on an ANT device, with
acceptable values ranging from 0 to the maximum number defined by the ANT
implementation.
Network key:
It is an 8-byte number that uniquely identifies a network and can provide a measure of
security and access control.
2.3 Why ANT Protocol
For a practical wireless network, the batteries powering nodes need to last for months (or
even years) to minimize maintenance. For this purpose, Low power consumption is very
essential. Most of the protocols are built to provide utmost its best solution.
ZigBee Alliance describes ZigBee to be a "low power" alternative. This is obviously true
when it is compared with Bluetooth. However, Bluetooth is designed for rapid transfer of
large amounts of data from devices and it uses relatively large batteries. But, when
compared with ANT, 4 times lower power and 60 % BOM cost of a ZigBee node. It
provides a much simpler sensor with coin celled battery for ultra low power and much
simpler network development environment. The figure 2-5 below shows few technical
comparisons between the 3 protocols.
Market name
ANT ZigBee Bluetooth
Standard Proprietary IEEE802.15.4 IEEE802.15.1
Battery life (with
coin-cell battery)
3+ years 4 to 6
months*
1 to 7 days*
Max. network size
(nodes)
2^32 2^64 7
Over the air
transmission rate
(kbit/s)
1000 250 1000
Range (metres) 1 to 30 1 to 100+ 1 to 100+
Success metrics Ultra-low
power, cost
Power, cost Cost,
convenience
Min. node
configuration
Transmit only
or transceiver
Transceiver Transceiver
Figure 2-5. Comparison between different Protocols

Theoretical Background
12
2.4 Time synchronization
2.4.1 Time synchronization in wireless sensor networks
For any distributed system, Time synchronization plays a key role in the system. Even in
distributed wireless networks, synchronized time are used extensively. For example,
operations in a distributed control system includes the monitoring of real time sensor
values from different sensors, detection of alarm signals and the execution of control
algorithms relevant to sensor values. Different processes are executed at different nodes
need to be time synchronized for a better performance of the system.
Time synchronization deals to provide a solution where the internal clocks of several
systems may differ. Even if the clocks are initially set accurately, the real clocks will
differ after some amount of time because of the clock drift in the systems which are
caused by the clocks counting time operating at slightly different rates. We will discuss
about few protocols used for time synchronization in wireless sensor networks.
2.5 Time synchronization protocols
Time synchronization protocols try to keep the nodes synchronized all the time
irrespective of the energy constraints. By keeping synchronized all the time, the system
could consume more energy. But for several wireless sensor applications, there is of no
need for continuous synchronization. It could be of event-based. Depending on the
requirements, the protocols could be chosen for the best efficient output.
1. Network Time protocol
The Network Time protocol is used most widely and is a classical protocol in the internet
domain devised by David L.Mills [21]. It is used to synchronize computer clock times
within the computer network .The NTP clients synchronize the system clocks with the
NTP time servers with accuracy in the order of milliseconds. The time servers are
synchronized by external time sources, typically using GPS. The NTP proved to be
effective, fault tolerant, secure and are highly scalable protocol.
However in WSN, non-determinism in transmission time caused by the Media Access
Channel (MAC) layer of the radio stack can introduce several hundreds of milliseconds
delay at each hop. Therefore, without further adaptation, NTP is suitable only for WSN
applications with low precision demands [21].

Theoretical Background
13
2. Reference Broadcast Synchronization
It is one of the prominent examples of existing time synchronization protocols. In the
RBS, a reference message is broadcasted. This protocol is based on receiver/receiver
synchronization. When the reference message is broadcasted, the receiver’s record their
local time and exchange their recorded local time-stamps with each other. The main
advantage of Reference Broadcast Synchronization protocol is that it eliminates
transmitter-side non-determinism [21].
The disadvantage of this type of protocol is an additional message exchange is necessary
to communicate the local time-stamps between the nodes. The Reference Broadcast
synchronization becomes expensive in terms of additional message transfer and
computation which could be a good choice for low power wireless networks.
3. Timing-Sync Protocol for Sensor Networks
The Timing-Sync Protocol for Sensor Networks is based on sender/ receiver
synchronization protocol. The TPSN protocol creates a spanning tree of the network and
performs pair wise synchronization on both the sides. Each node gets synchronized by
exchanging two synchronization messages by time-stamping at the sender side as late as
possible and time-stamping at the receiver side as earlier as possible.
The TPSN achieves two times better performance than RBS by time-stamping the radio
messages in the Medium Access Control (MAC) layer of the radio stack and by relying
on a two-way message exchange. The shortcoming of TPSN is that it does not estimate
the clock drift of nodes, which limits its accuracy, and does not handle dynamic topology
changes [21].
2.5.1 Time synchronization in ANT wireless sensor networks
For synchronization between two nodes, the ANT protocol uses TDMA techniques for its
communication channels. TDMA techniques combined with the ANT multiple access
channel technology plays a major role for the users to use two to thousands of nodes to be
connected to an ANT network. In communication between two nodes, the messages are
transmitted in forward direction at designated channel period. Once the channel is
opened, the master will send the message in its allocated time slot and wait for the next
allocated time slot to sent as shown in figure 2-6.

Theoretical Background
14
Channel timeslot
Channel period Channel period Channel period
Channel timeslot Channel timeslot Channel timeslot
Figure 2-6. TDMA technique in ANT protocol
If two nodes try to transmit the messages to receiver, both the nodes sent the messages at
their allocated time slots. As the protocol is proprietary and the scheduling of time slots is
adaptive isochronous co-existence i.e. the scheduling is dynamic. However they seem
synchronized, but it is unknown about how they are synchronized. So in this research, a
method to know about how the timeslots are allocated and to improve the
synchronization was found. The Figure 2-7 below shows about how the two nodes adjust
themselves to communicate with the receiver.
Tx Tx Tx
Tx Tx Tx
Node 1
Node 2
Figure 2-7. Time slots allocation in ANT Protocol

Theoretical Background
15
1. Time stamping
A timestamp is the recorded time of a current event in the system. The timestamp
protocol is one of the protocols that are used for different synchronization purposes, such
as to assign a sequence order for a multi-event transaction through which if a failure
occurs, the transaction can be voided. A timestamp is used to record time in relation to a
particular starting point.
For example, in IP Telephony, the Real-time Transport Protocol (RTP) assigns sequential
timestamps to voice packets. Through the timestamps the receiver can check the packets
in sequential order, reassemble it, and deliver it with no errors. In video processing, if
there is a time stamp for each video frame and there is a reference clock, then the video
player just needs to read the time stamps and wait until the right time to put each frame
on the display.
In wireless sensor networks, the timestamp are very essential for each packet transfer
through whom we could detect as when the packet is sent or received. It is a well known
method for obtaining the estimates of clock differences between pair of nodes which can
directly communicate. It is based on exchange of time-stamped packets. In this research
work, timestamps are used to find exactly how the timeslots are assigned. By this
method, message shall be received with timestamp data through which when the
messages are created at the sender side and received at the receiver shall be known.
2. Global clock synchronization
Time-stamping could provide the information about when the messages are sent and
received. We could also suggest some improvements for the better performance of
synchronization. Using global time for synchronization could be of possible way for
global synchronization.
For measuring the progression of time or to measure the time duration between the
events, the physical clocks are used. The physical clock contains a counter, and a physical
oscillation mechanism that periodically generates an event to increase the counter. This
periodic event is called the micro-tick (i) of the clock. The duration between two
consecutive micro-ticks is the granularity of the clock [22]. If two clocks are working
concurrently, each clock oscillation might vary with a clock drift. A reference clock is
possessed by the external observer who can observe all the events. It is used as reference
time to measure and to check for the accurate time as per the international standard time.

Theoretical Background
16
a) Clock drift (ρ)
In real time applications, clocks used might vary in their oscillations. The clocks speed
might vary such that the clock does not run at the exact speed as compared to other clock
depending on different conditions. This phenomenon is known as clock drift. Assume that
there are two clocks, physical clock (k) and the reference clock (r). The drift of a physical
clock k between micro-tick i and micro-tick i+1 is the frequency ratio between this clock
k and the reference clock, at the instant of micro-tick i.
Real clocks might have varying drift rates which are influenced by different
environmental conditions such as, a change in the ambient temperature, a change in the
voltage level that is applied to a crystal resonator, or aging of the crystal. Within specified
environmental parameters, the drift rate of a resonator is bounded by the maximum drift
rate ρ max which is documented in the data sheet of the resonator. Typical maximum drift
rates ρ max are in the range of 10-2
to 10-7
sec/sec, or better, depending on the quality
(and price) of the resonator. A good clock shall have a drift rate very close to 1. Because
every clock has a non-zero drift rate, free-running clocks, i.e., clocks that are never
resynchronized, leave any bounded relative time interval after a finite time, even if they
are fully synchronized at startup.
b) Global time
“A global time is an abstract notion that is approximated by properly selected micro-ticks
from the synchronized local physical clocks of an ensemble”[22]. For the clocks to get
synchronized, the use of global clock will be a perfect possible solution. As the clocks
drift with each other, the global time could provide synchronized time to adjust the clocks
with respect to it.
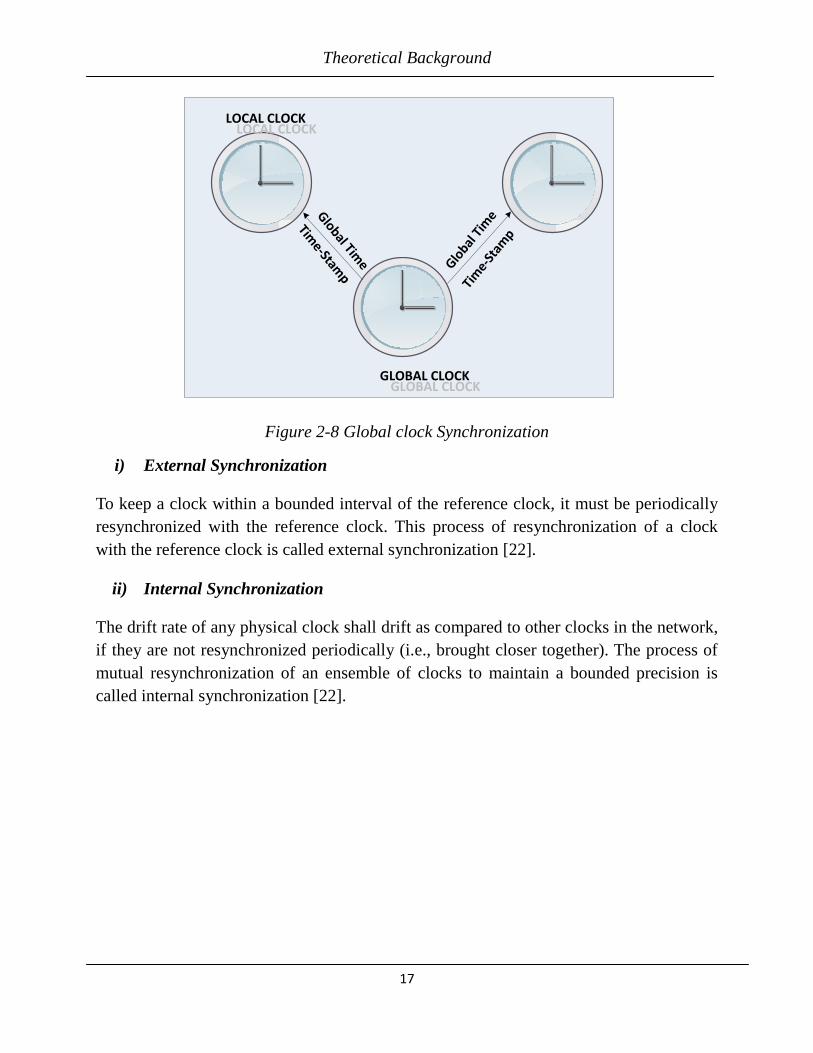
c) Global clock synchronization
Assume that there are different nodes with clocks and a global clock in the network as
shown in the Figure 2-8. The clocks drift with each other at different environmental
conditions. In order to get synchronized, the clocks need to adjust themselves equally in
order to continue their communication process. The local clocks needs to be periodically
synchronized with global clock in the network in order to establish a global
synchronization within the network. The global clock will generate its clock value with
its time stamp and transmit periodically to the local clocks. The local clocks adjust their
time with respect to the global clock. There are two types of synchronization.
Theoretical Background
17
Global
Tim
e Global Time
LOCAL CLOCKLOCAL CLOCK
GLOBAL CLOCKGLOBAL CLOCK
Tim
e-St
amp
Time-Stam
p
Figure 2-8 Global clock Synchronization
i) External Synchronization
To keep a clock within a bounded interval of the reference clock, it must be periodically
resynchronized with the reference clock. This process of resynchronization of a clock
with the reference clock is called external synchronization [22].
ii) Internal Synchronization
The drift rate of any physical clock shall drift as compared to other clocks in the network,
if they are not resynchronized periodically (i.e., brought closer together). The process of
mutual resynchronization of an ensemble of clocks to maintain a bounded precision is
called internal synchronization [22].

Wireless Body Sensor Biofeedback Network
18
3 Wireless Body Sensor Biofeedback Network
Wireless Body Sensor Biofeedback Network (WBSBN) is a research project for gait
analysis and feedback. The purpose of this research project is to analyze, plan and treat
the individuals who are affected with some inabilities in their foot motion while walking
and to avoid the individuals from falling down who affected with stroke. In this chapter,
we will discuss about the WBSBN system and the reason for using this system for our
thesis work. We will also describe about the research problem and it’s provided solution.
3.1 Introduction to gait analysis
Gait is defined as a manner of walking in which we move our whole body from one point
to another. Gait analysis is a method used to assess the way we walk or run to highlight
biomechanical abnormalities. From the earliest days, the gait analysis and its
measurements are found useful in the management of patients with walking disorders [1].
At present time, patient’s falls are one of the most frequent complications leading to
injury and death among the elderly and disabled community [2]. Typically falls occur in
the home, particularly when descending stairs or negotiating objects. The patients who
are affected by brain strokes, falls into this category, which leads them to severe injury.
To avoid the injuries and to reduce the incidence of falls among the patients are
considered as a key priority by national and international policy makers.
To achieve with a best solution, a device need to be built with good feedback. Hence
biofeedback part is proposed for this research, to investigate its effects as a balance
training tool. It would be particularly interesting to integrate this phase of the study with
Wireless Sensor Networks in the home. This would allow the investigators to determine
the types of activities that subjects are performing when their gait deteriorates.
3.2 Feedback Systems for Health Care
Patients suffering from Cerebro Vascular Accident (CVA) have been demonstrated and it
was found that there are at an increased risk of falls and fall related injuries. It was
investigated that patients who had strokes and were living at home, their falls are more
than twice than the rest of the elderly community [2].The falling could create a greater
risk of hip fractures, orthopedic injuries and loss of independence.

Wireless Body Sensor Biofeedback Network
19
In order to avoid these falls, a solution should be found to save the patients from injuries.
There are numerous foot pressure measurement devices currently available on the market.
Commercialy available systems include the F-Scan (Tekscan, Inc) and Pedar systems
(Novel Inc), which are designed to provide precise information regarding the distribution
of pressure under the foot. These devices are used particularly in laboratory settings for
diagnosing the areas of high pressure under the foot. Because of wired system, usage
limits the user’s activity range and they are of high cost.
Most of the feedback systems have one common feature, namely that they all focus on
the sensor, i.e. the input, but not so much on the feedback, i.e. the output. The feedback
element offers a substantial technical challenge in developing the tool, which in turn also
requires insight in Human Machine interaction (HMI) aspects, especially when if comes
to designing it for people with sustained brain injuries such as clients with stroke.
3.3 Sole Integrated Gait Sensor Analysis
In this section, we discuss briefly about the WBSBN system and how it is efficient as
compare to the existing systems.
3.3.1 What is SIGS
Sole Integrated Gait Sensor Analysis (SIGS) is a research project to develop a foot
pressure activated feedback system for enhancing static and dynamic balance in elderly
subjects who have suffered from a stroke. In this project, wireless pressure sensors are
placed like soles in the shoes of persons with different kinds of deceases. The sensors can
measure the pressure of the foot relative the shoe i.e. the load of the two legs is measured.
This information can be useful e.g. to not over or under load a leg after joint replacement
or as a bio feedback system to help e.g. post stroke patients to avoid falling.
The research was started, to design and built a system which has the ability to measure
and provide immediate feedback to patients regarding the distribution of weight through
their feet. It has enormous potential for the rehabilitation industry and prevention injuries.
Hence the main goal of SIGS system is to develop a tool that can be used while
performing activities of daily living and need to be able to warn the individuals when the
load through the feet is not optimal and to encourage them to alter their loading in
response to the feedback.
The SIGS system can be used to provide a real-time biofeedback of pressure distribution
on plantar surface during stance phases of gait. This could be helpful to diagnose and

Wireless Body Sensor Biofeedback Network
20
treat patients, especially the elderly, suffer from walking disease everyday. The proposed
system will also be possible to use as a biofeedback system for motion limitation after hip
surgery and for balance control for post stroke patients.
3.4 System Architecture
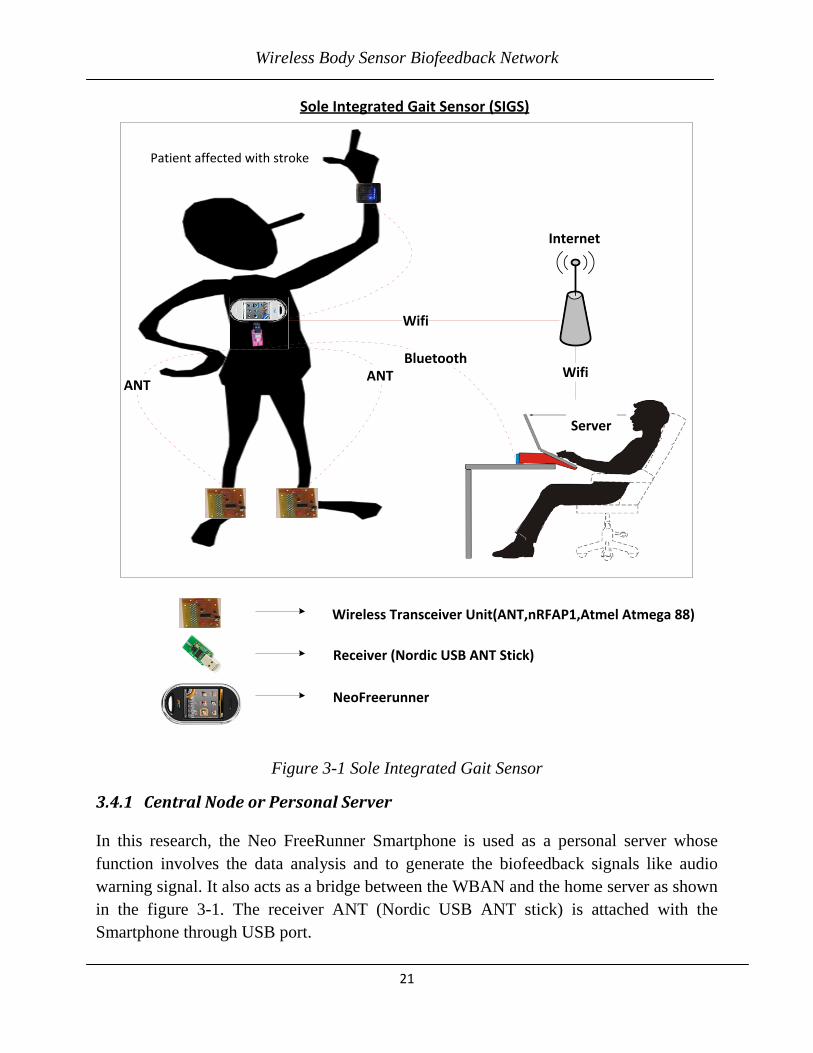
The system was built in a star topology WBAN fashion which includes a central node
and two leaf nodes as shown in Figure 3-1. The central node is a personal server which is
NeoFreeRunner Smartphone along with an ANT USB stick transceiver unit. The central
node could be attached to the user’s belt or it can be hanged on the user’s neck. On the
other side, the leaf nodes or SIGS consist of a foot pressure sensor and an ANT
transceiver unit. The leaf node will continuously transmit data to the central node
whenever they are active ie., triggered by the movement sensors.
Wireless Body Sensor Biofeedback Network
21
Wifi
Wifi ANT
ANT
Internet
Patient affected with stroke
Server
Receiver (Nordic USB ANT Stick)
Wireless Transceiver Unit(ANT,nRFAP1,Atmel Atmega 88)
NeoFreerunner
Sole Integrated Gait Sensor (SIGS)
Bluetooth
Figure 3-1 Sole Integrated Gait Sensor
3.4.1 Central Node or Personal Server
In this research, the Neo FreeRunner Smartphone is used as a personal server whose
function involves the data analysis and to generate the biofeedback signals like audio
warning signal. It also acts as a bridge between the WBAN and the home server as shown
in the figure 3-1. The receiver ANT (Nordic USB ANT stick) is attached with the
Smartphone through USB port.

Wireless Body Sensor Biofeedback Network
22
1. Neo Freerunner
The Neo FreeRunner is a Linux-based touch screen smart phone developed to run
Openmoko software. It was manufactured by First International Company, Inc. and was
aimed at general consumer. They are even used by Linux desktop users and software
developers. The Smartphone is built on ARM 920T core controller from Samsung
(S3C2442B). It is a multichip module which includes processor, memories and IO and it
is clocked at 400 MHz [7].
Some of the features include,
VGA touch screen
Wi-Fi
GPRS 2.5G
Bluetooth 2.0
GNU/Linux
USB
The application built software was developed on Linux platform to run on Neo
FreeRunner. The software is responsible to receive the sensor data from ANT USB stick,
which is attached to the USB port of the Smartphone. On receiving the data, the Neo
FreeRunner acts as a server by alerting the patient with biofeedback, records the data if
desired or forward the data to the home server or health center by Wifi, Bluetooth or
GPRS/GSM.
2. ANT USB stick
The ANT USB stick makes it possible to communicate easily between the Nordic
nRF24AP1 transceiver and Neo FreeRunner Smartphone. The ANT USB stick is greatly
helpful in the development of hardware using the ANT protocol [8] and it is very easy to
use because of its USB connection. The details about the ANT protocol are described
briefly in our previous chapter of this document.
The Nordic nRF24AP1 transceiver used in the hardware is an ultra-low power single-chip
radio transceiver with embedded ANT protocol for personal area networks [9]. The
transceiver’s RF operating frequency ranges within the 2.4 - 2.5 GHz RF ISM band.
Whenever the data is been transmit from the leaf nodes , the ANT USB stick receives the
data through nRF24AP1 transceiver and sends it to the Smartphone using FTDI COM
port drivers by just connecting the hardware via USB with the Neo FreeRunner
Smartphone.

Wireless Body Sensor Biofeedback Network
23
3.4.2 Leaf Nodes or SIGS
The SIGS system as shown in the figure 3-2 acts as a leaf node which consists of a
wireless transceiver unit and the foot pressure sensor from Tekscan. In this system, the
Tekscan sensor is used together with the wireless sensor node to transmit the sensor data
to the personal server.
Sole integrated Gate Sensor(SIGS)
Tekscan, resistive pressure sensitive sensor
Control Board (Nordic nRF24AP1; Atmel ATMega88)
Figure 3-2 Leaf Nodes or SIGS
1. Wireless transceiver unit
The wireless transceiver was designed in such a way, that it shall get the sensor values
from the foot pressure and sent it to the personal server through a transceiver. For this
unit, a board was designed and implemented with different components on PCB.
1. Transceiver nRF24AP1 with Trace Antenna
This is a small breakout board with circuit for the Nordic nRF24AP1 transceiver [10].
The transceiver IC is capable of talking with other wireless products which is built on
ANT protocol. In this unit, it sends the foot pressure sensor value to ANT USB Stick
attached to the Neo FreeRunner Smartphone.
2. Atmel Atmega88 microcontroller
The ATmega88 [11] is a low-power CMOS 8-bit microcontroller based on the AVR
enhanced RISC architecture. Its powerful execution of instructions in a single clock
cycle, the ATmega88 achieves throughputs approaching 1 MIPS per MHz which allows
the system designer to optimize power consumption versus processing speed. Its feature
Wireless Body Sensor Biofeedback Network
24
with high performance and lower power consumption helps the system designer in
providing a best solution for low power wireless applications. The microcontroller could
communicate with the ANT transceiver through synchronous serial interface.
2. F-Scan sensor
F-scan sensor [12] is extremely thin with high resolution provides the most accurate data
to the user. F-scan is a system manufactured by the Tekscan Company. The pressure
sensor used is F-Scan 3000 which is used for foot pressure measurements. It consists of
two polyester films coated with printed conductive silver wires in a matrix. They are
widely used in both clinical and biomedical studies because of its dynamic response
towards pressure loading.
3.5 System Design and parameters
The F-scan foot pressure sensor has hundreds of sensor pressure sensitive resistor
elements. The pressure sensors are arranged in a matrix. The sensor elements are
arranged in a matrix with six columns and four rows. Twenty four values are captured
from the sensors. The twelve values from the toe part and twelve values from the heal
part are added and scaled to form a two words of data. These are sent to the personal
server via ANT network.
In order to send the data to the personal server, it is necessary to synchronize the left and
the right foot sensors. The ANT network uses the 2.4 GHz ISM band and TDMA is used
to share a single frequency. The sampling rate is 8 samples/sec and the message rate is 8
messages/sec (bit rate is 1 Mbit/sec). In this unidirectional system, sole sensors are
masters (transmitters) and the ANT USB stick connected to the personal server is the
slave (receiver). The parameters assigned for the ANT network are shown in the Figure
3-3 below.
The data type used in this system for communication is Broadcast [8] data type.
Independent ANT logic channels (timeslots) are assigned for both the sole sensor, such
that one time slot for each sole sensor. The two ANT logic channels share the TDMA
cycle. Different channel ID’s need to be assigned for the transmitters such that the
receiver could identify the exact data from the transmitter i.e., from right sole or left sole.

Wireless Body Sensor Biofeedback Network
25
Figure 3-3 ANT Protocol parameters
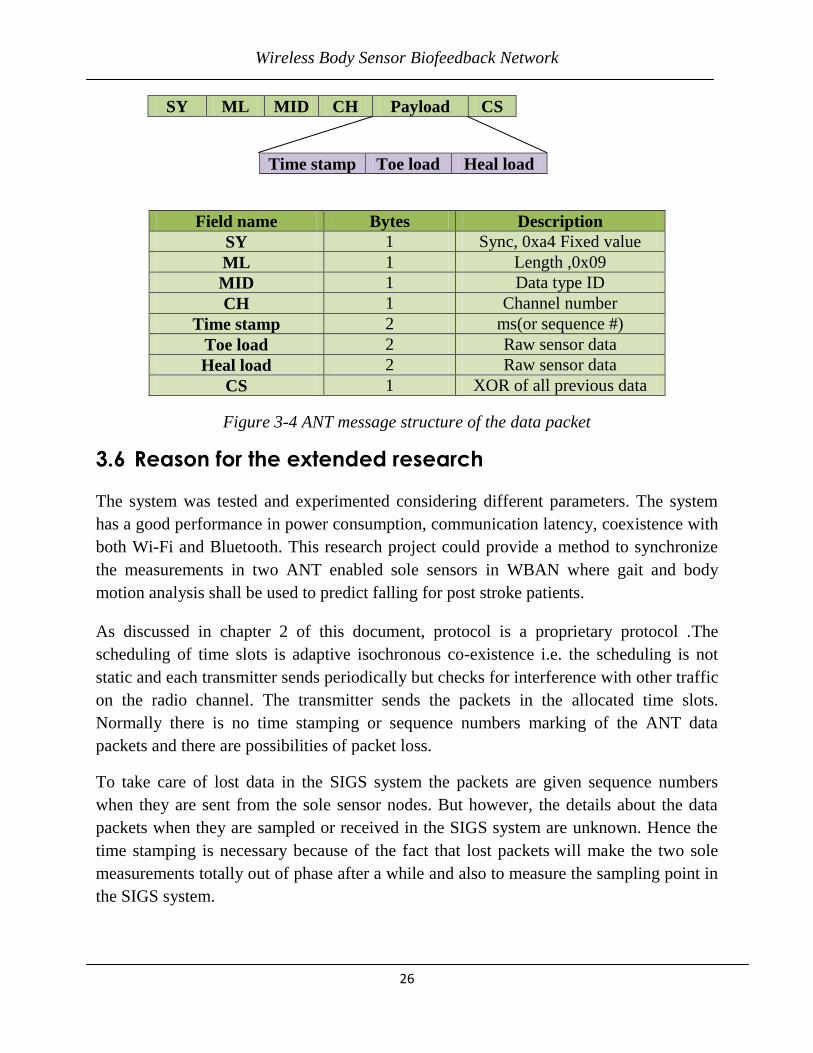
3.5.1 Time synchronization
Whenever the ANT transceiver receives the pressure sensor value from the corresponding
sole pressure sensors, it checks for the free time slots in ANT channel. If the channel is
free, the ANT sends the message packet to the server. Similarly, the other sole does the
check for channel timeslots and sends the packet. As the message rate is 8 messages/sec,
the ANT node checks for the time slot after every 125 ms and if the channel is free, it
sends the data to the receiver node. The message structure of the data packet is given
below as shown in Figure 3-4.
Once the packet is received by the ANT USB stick (receiver), it forwards the data to the
Neo FreeRunner Smartphone (server). The transmission speed of the ANT transceiver is
high and is considered to be few microseconds. The software developed at Linux
platform for the WBAN server shall receive the data packet and stores in its buffer for the
future reference. On receiving the data, Neo FreeRunner Smartphone acts as a server by
alerting the patient with biofeedback records the data if desired or forwards the data to
the home server or health center by Wi-Fi, Bluetooth or GPRS/GSM.
Radio channel 66 (2466 GHz)
Network 0 (Default public)
Network key Public for network 0
Channel ID
Transmission
Type
0x01
Device Type
Device Number Individual Serial #
Channel Type Bidirectional TX (0x10)
Message Rate 8 Messages/s
Data type Broadcast
Wireless Body Sensor Biofeedback Network
26
SY ML MID CH Payload CS
Time stamp Toe load Heal load
Field name Bytes Description
SY 1 Sync, 0xa4 Fixed value
ML 1 Length ,0x09
MID 1 Data type ID
CH 1 Channel number
Time stamp 2 ms(or sequence #)
Toe load 2 Raw sensor data
Heal load 2 Raw sensor data
CS 1 XOR of all previous data
Figure 3-4 ANT message structure of the data packet
3.6 Reason for the extended research
The system was tested and experimented considering different parameters. The system
has a good performance in power consumption, communication latency, coexistence with
both Wi-Fi and Bluetooth. This research project could provide a method to synchronize
the measurements in two ANT enabled sole sensors in WBAN where gait and body
motion analysis shall be used to predict falling for post stroke patients.
As discussed in chapter 2 of this document, protocol is a proprietary protocol .The
scheduling of time slots is adaptive isochronous co-existence i.e. the scheduling is not
static and each transmitter sends periodically but checks for interference with other traffic
on the radio channel. The transmitter sends the packets in the allocated time slots.
Normally there is no time stamping or sequence numbers marking of the ANT data
packets and there are possibilities of packet loss.
To take care of lost data in the SIGS system the packets are given sequence numbers
when they are sent from the sole sensor nodes. But however, the details about the data
packets when they are sampled or received in the SIGS system are unknown. Hence the
time stamping is necessary because of the fact that lost packets will make the two sole
measurements totally out of phase after a while and also to measure the sampling point in
the SIGS system.

Wireless Body Sensor Biofeedback Network
27
In order to find out a way to synchronize the sample data from the two soles and to
measure the actual sampling point in the SIGS system, few questions came across in our
thesis research work.
1. How good is the time synchronization in SIGS?
2. What happens when there are any external disturbances?
3. How the time synchronization in ANT protocol works?
4. Possible way to measure the time at which the data is received at WBAN server or
transmitted from the sole pressure sensors.
5. Alternative option to improve the better time synchronization for SIGS?
The systematic approach to solve the research problems and to provide the best possible
solution will be discussed in the chapter 4 of this document.
Implementation
28
4 Implementation
In the previous chapter of this document, the research problems in the SIGS system were
discussed and came out with few research questions. In this chapter, the design algorithm
for the proposed solution to the research problem will be discussed. The new design
prototype for our research work, its hardware setup, software setup and the software
implementation shall also be discussed.
4.1 Research method
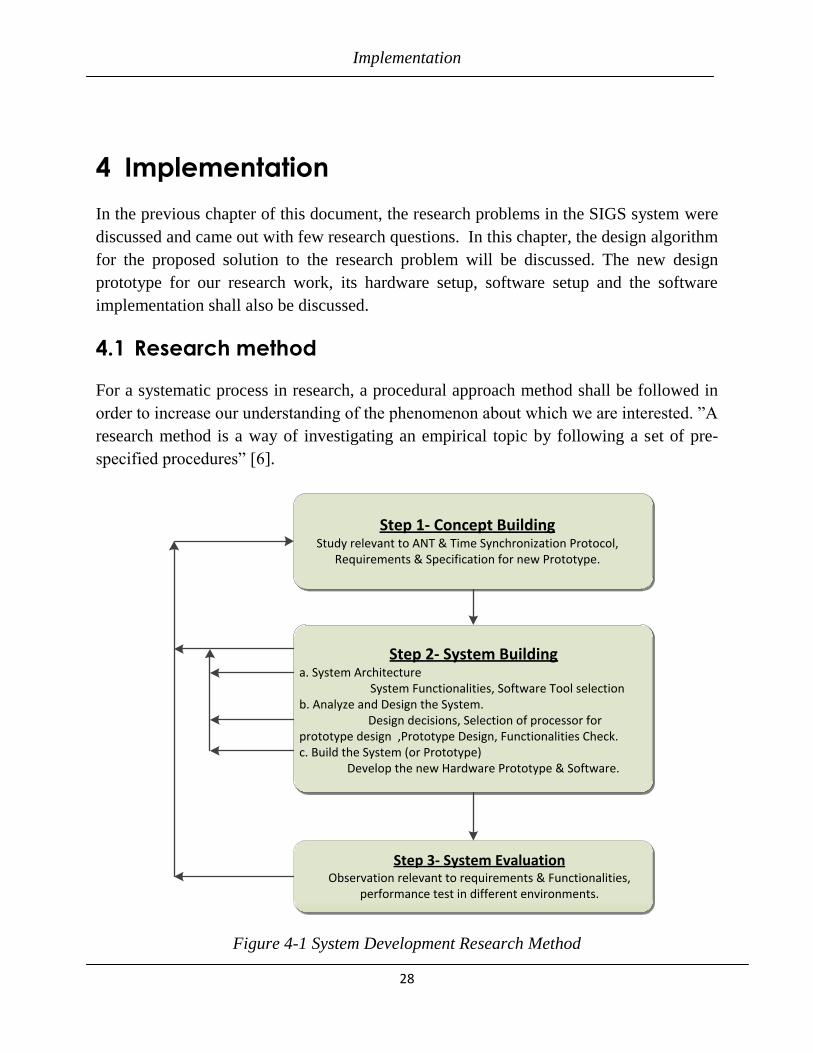
For a systematic process in research, a procedural approach method shall be followed in
order to increase our understanding of the phenomenon about which we are interested. ”A
research method is a way of investigating an empirical topic by following a set of pre-
specified procedures” [6].
Step 1- Concept BuildingStudy relevant to ANT & Time Synchronization Protocol,
Requirements & Specification for new Prototype.
Step 2- System Building a. System Architecture
System Functionalities, Software Tool selectionb. Analyze and Design the System.
Design decisions, Selection of processor for prototype design ,Prototype Design, Functionalities Check.c. Build the System (or Prototype)
Develop the new Hardware Prototype & Software.
Step 3- System Evaluation Observation relevant to requirements & Functionalities,
performance test in different environments.
Figure 4-1 System Development Research Method

Implementation
29
In our master thesis research work, we have followed System Development Research
Method as shown in Figure 4-1. “The system development research approach denotes a
way to perform research through exploration and integration of available technologies to
produce an artifact, system or system prototype” [7]
i. Concept Building
In our research, we started with pre-study phase, in which study relevant to ANT protocol
and Time synchronization was made. The reason for the research was clearly understood
and relevant to that few research questions were created. The research questions were
discussed in chapter 3 of this document.
ii. System Building
The reason for the research and the research questions are understood and a procedural
plan was made to achieve the time synchronization. An architectural design was created
for the prototype system and few design decisions were considered. The hardware design
prototype was implemented and the software was developed for the system. The
developed system shall receive the ANT data packet from the sole pressure sensor and
should transmit to WBAN server via USB.
iii. System Evaluation
The system need to be observed with functionalities check and different tests were made
in different environments. Different tests include the functionality tests, performance
tests, Robustness tests. The build system provided a possible solution with respect to the
research questions. A report which clearly explains the work flow, its requirements and
specifications, functionalities and testing phases were documented with standard format.
4.2 Power Estimator
The power estimator is a tool provided by ANT to estimate the power consumption. It
estimates the average power consumption for the selected ANT device and the expected
battery life per the input usage scenario. The calculation is based on the
specification documented in ANT product datasheet and only covers ANT operation.
This tool provides the details about power consumption which shall be used for
budgeting purpose of any system design.
In this thesis, the power estimator tool is used to estimate the power consumption of ANT
product, nRF24AP1chip. The power estimation of the ANT chip shall be done and
compared in two different scenarios.
Implementation
30
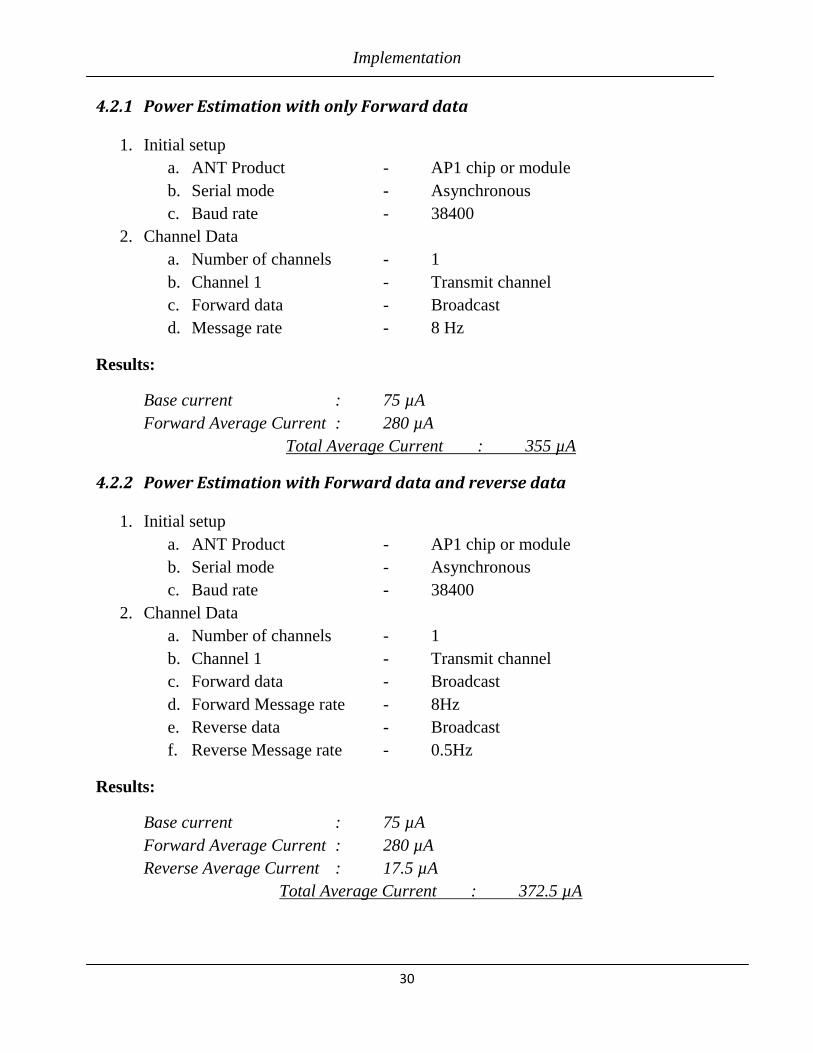
4.2.1 Power Estimation with only Forward data
1. Initial setup
a. ANT Product - AP1 chip or module
b. Serial mode - Asynchronous
c. Baud rate - 38400
2. Channel Data
a. Number of channels - 1
b. Channel 1 - Transmit channel
c. Forward data - Broadcast
d. Message rate - 8 Hz
Results:
Base current : 75 µA
Forward Average Current : 280 µA
Total Average Current : 355 µA
4.2.2 Power Estimation with Forward data and reverse data
1. Initial setup
a. ANT Product - AP1 chip or module
b. Serial mode - Asynchronous
c. Baud rate - 38400
2. Channel Data
a. Number of channels - 1
b. Channel 1 - Transmit channel
c. Forward data - Broadcast
d. Forward Message rate - 8Hz
e. Reverse data - Broadcast
f. Reverse Message rate - 0.5Hz
Results:
Base current : 75 µA
Forward Average Current : 280 µA
Reverse Average Current : 17.5 µA
Total Average Current : 372.5 µA

Implementation
31
Through this power estimation, it shall be noted that there is an increase in power
consumption but relatively low, while using ANT reverse channel.
4.3 Assumptions and Design Decisions
4.3.1 Time stamping at transmitter
In the SIGS system, the packet data shall be transmitted from the two soles (transmitter)
through ANT transceiver attached to the soles. The transmitted packet will be received by
WBAN server (receiver) through ANT transceiver attached to the WBAN server. As
soon as the ANT transceiver at the transmitter side, receives the pressure sensor values
from the sole pressure sensors, the time stamping shall be done on the two bytes allocated
for time stamping before it is been transmitted further to the WBAN server.
During pre-study, we come across with some issues. The clocks used to time stamp in the
two soles, might vary at the time of initiation. Even both the clocks are started at the
same time; there might be clock drift in the timers because of the oscillators. To make the
clocks start at the same time, the clocks need to share their clock value with the Global
clock for synchronization which could consume more power.
After detailed pre-study and thorough investigation, implementation of time stamp
protocol at transmitter side will be a possible option, if global clock is used for
synchronization.
4.3.2 Global clock
In any distributed system, the implementation of global clock synchronization could
provide a possible solution for efficient synchronization. In our SIGS system, the ANT
protocol is used which is a proprietary protocol whose scheduling of time slots is
adaptive isochronous co-existence i.e. the scheduling is dynamic. This might cause a
critical problem in real time implementation for global clock synchronization. The
importance of using the ANT protocol in our SIGS system is its low power consumption
and the message rate. For the implementation of Global clock, ANT reverse channel shall
be used to synchronize the local clocks. It will increase the power consumption but
relatively little. But however, the Global clock implementation could be possible, once
the time stamp protocol is implemented in the system in order to adjust their local clocks
with respect to the Global clock.
After detailed pre-study and investigation, the implementation of the Global clock for
synchronization shall be a better option for SIGS system but because of power
Implementation
32
consumption and complexity in implementation, it shall not be implemented. But its
research solution for ANT protocol shall be considered for the implementation in the
future work.
4.3.3 Time stamping at receiver
In the SIGS system, the packet data shall be transmitted from the two soles (transmitter)
through ANT transceiver attached to the soles. The transmitted packet will be received by
WBAN server (receiver) through ANT transceiver attached to the WBAN server. As
soon as the packet is received at the ANT transceiver at the receiver side, the time
stamping shall be done on the two bytes allocated on the received packet.
With time stamping it is not possible to synchronize the measurements but it is
possible to estimate the actual sampling point. After detailed pre-study and
investigation, time stamping at receiver side could be a better solution to implement in
SIGS system and it consumes less power.
4.4 Implementation methods
The objective for this thesis proposal is to find a method (methods) to make it possible
for the application software in the WBAN server to get time stamped and time
synchronized data from the two sole sensors (and other sensors) in the system. The
suggested method shall also be demonstrated in the SIGS system. The controller used in
the SIGS system is Atmel ATmega88 and in the new ANT-ARM-USB hardware
prototype connected to WBAN server is ARM controller.
As per our design decisions, we opt to proceed further with the implementation of the
time stamp protocol and to provide a possible research solution for global clock
synchronization in the ANT protocol.
4.4.1 Time stamping in SIGS
In wireless sensor networks, the timestamps are very essential for each packet transfer
through whom we could detect as when the packet is sent or received. It is a well known
method for obtaining the estimates of clock differences between pair of nodes which can
directly communicate. It is based on exchange of time-stamped packets. In our thesis
work, we had used timestamp to find exactly how the timeslots are assigned.

Implementation
33
1) Protocol design for the Transmitter Communication in SIGS
The protocol design for the transmitters attached to the soles are developed and
implemented at Atmel AtMega88 microcontroller. The developed protocol shall receive
the pressure sensor data from the soles and transmit to the ANT transceiver via USART.
Its detailed description is described in the Chapter 3 of this document.
The entire communication process is shown in the Figure 4-3. The designed protocol
shall work as shown in the figure 4-2.
A CB
Sole 1
D A B C D
120 ms
125 ms
120 ms5 ms
125 ms
5 ms
Figure 4-2 Transmitter protocol in SIGS
a) The protocol is designed in such a way; the transmitter shall send the pressure
sensor data to the receiver after every 125 ms.
b) The microcontroller is programmed in such a way, that it receives the pressure
sensor data after 120 ms. During this time duration A (A= 120 ms), the
microcontroller goes to sleep mode.
c) After 120 ms, the controller scans for the pressure sensor data during the scanning
period, B. The scanning period B shall be equal to few milliseconds.
d) Once the controller completes its scanning with the received pressure sensor data,
it transmits further to the ANT transceiver at time period, C. During this time
period, the ANT transceiver receives the pressure sensor via USART. The time
period C shall be equal to few milliseconds.
e) The time period, D will be of very shorter time and this time period is reserved to
complete the transmission process before its dedicated time. The transmitter
protocol is same for the two soles.

Implementation
34
A CB
Sole 1
D A B C
120 ms120 ms
125 ms
120 ms5 ms
A CB
Sole 2
D A B C D
120 ms
125 ms
120 ms
125 ms
5 ms 5 ms
ANT SERVER(RECEIVER)
ANT TRANSMITTER (SOLE 1)
ANT TRANSMITTER (SOLE 2)
Tch=125 ms
Tch=125 ms
Ts11
Ts21
Ts12
Ts22
Communication process in SIGS
ANT Tranciever
ANT Tranciever
ANT Tranciever
125 ms
5 ms
A Sleep modeB Scanning period for the pressure sensor dataC Transmits the pressure sensor data to the ANT TransceiverD A small time gap allotted before the start of the next transmission.Tch Designated Channel Period
D
Figure 4-3 Communication Protocol Design in SIGS

Implementation
35
2) Protocol design for the ANT Transceiver communication in SIGS
ANT SERVER(RECEIVER)
ANT TRANSMITTER (SOLE 1)
ANT TRANSMITTER (SOLE 2)
Tch=125 ms
Tch=125 ms
Ts11
Ts21
Ts12
Ts22
ANT Tranciever
ANT Tranciever
ANT Tranciever
Figure 4-4 ANT Transceiver Protocol
The entire communication process is shown in the Figure 4-3. The two ANT transmitters
from the two soles try to communicate with the ANT receiver as shown in the Figure 4-4.
Whenever the ANT transceiver receives the pressure sensor data, it scans for the free
channel time slot. As soon as the sole systems receives the data, it goes for the arbitration
and whichever the sole wins the arbitration, they try to transmit the packet data at the first
available time slot. As the message rate is 8messages/sec (bit rate is 1 Mbit/sec), the next
data packet will be sent after 125 ms. The oscillators will not function similarly in both
the sole sensor nodes and there are possibilities of clock drift between the two nodes.
Hence the transmitted time varies between the two nodes as shown in the Figure 4-4. The
time difference between Ts11 and Ts21 from two different soles provides the time
synchronization error.
Time synchronization error, ∆T = min (|Ts1n – Ts2n|,|Ts1n-Ts2n-1|) where n= 1, 2…..n.
The value of Ts1n and Ts2n is not known and hence the Time synchronization error
could not be calculated. In order to find the value of Ts1n and Ts2n, time stamp protocol
shall be implemented.

Implementation
36
3. Design for Time stamp protocol
Exactly how the time slots are used is not known by the WBAN server as the system is
implemented and therefore it is necessary to time stamp the messages when they are
created or when they are received. The ANT data type used in SIGS system is Broadcast
data type. It is an one way communication ie., there is no acknowledgement packet send
back to sender. By time stamping method, a message with timestamp data shall be
received. Through this method, time at which the messages are created at the sender side
and are received at the receiver shall be identified.
The entire communication process is shown in the Figure 4-3. The new time stamp
protocol is designed in such a way, that whenever the ANT transceiver receives the sole
pressure sensor data from the ANT transmitter, it checks for the correct packet byte of the
data. When the received data is verified for the exact byte of data, it does the time stamp
to the data packet with present time stamp value as shown in Figure 4-3. Ts11, Ts12 and
Ts21, Ts22 are the time stamp values of the message packets from the sole 1 and sole 2
respectively. Through this timestamp value, we could know as when the messages are
created at the sender side and received at the receiver.
4.4.2 Global clock
Time-stamping could provide us when the messages are sent and received. We could also
suggest some improvements for the better performance of synchronization. Using global
time for synchronization is the only way for global synchronization.
As the ANT protocol uses TDMA technique and the time-slots are allocated for each
node. The nodes could send packets at the dedicated time slots. At one stage, the
oscillators will not work as it needs to be. So there are possibilities of data losses from the
nodes because of the collision between the two nodes. So, in order to avoid losses, the
use of global clock for synchronization could be a possible solution.
The main goal of the thesis is to synchronize the samples from the pressure sensors of
two soles. The implementation of global clock could provide a possible solution for
synchronization. The local clocks of the two sole sensors could adjust themselves with
respect to the global clock. Hence the local clocks of the two sole sensors shall work
identically and could sample their pressure sensor values at the same time.
For global clock, bi-direction transmission is required which consumes more power. In
our SIGS system, it is possible to synchronize the local clocks of the sole sensors by
implementing the Global clock with the help from ANT reverse channel. It will
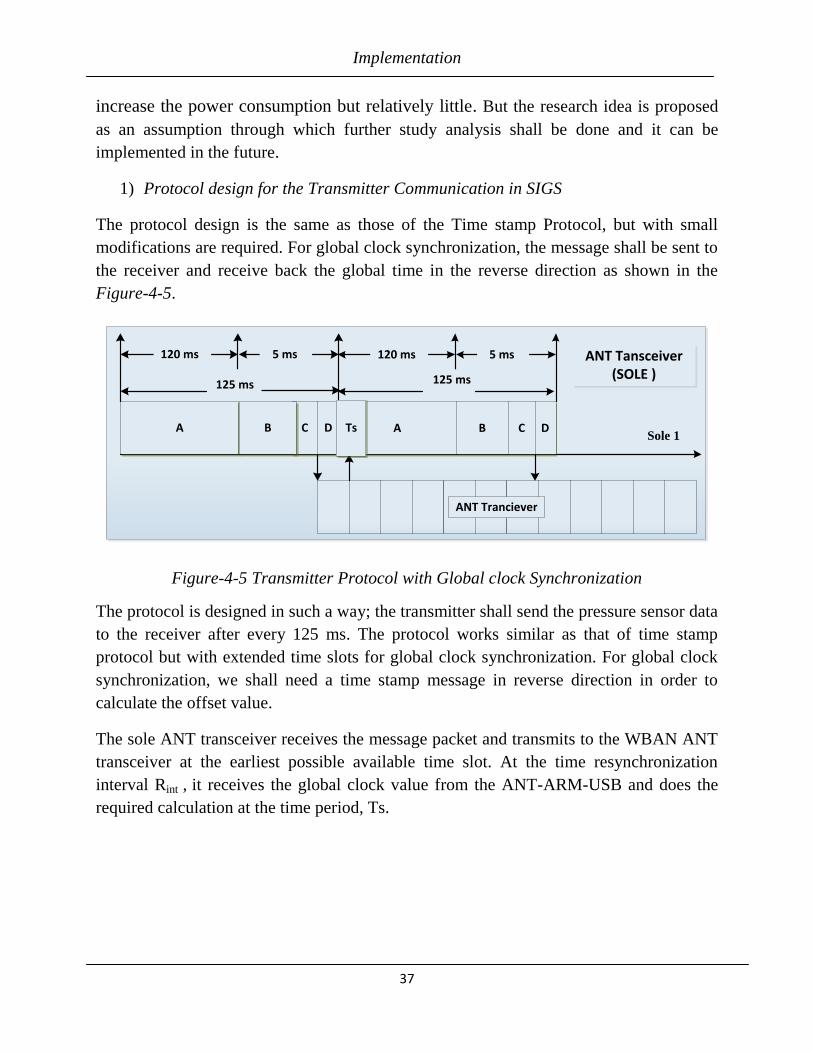
Implementation
37
increase the power consumption but relatively little. But the research idea is proposed
as an assumption through which further study analysis shall be done and it can be
implemented in the future.
1) Protocol design for the Transmitter Communication in SIGS
The protocol design is the same as those of the Time stamp Protocol, but with small
modifications are required. For global clock synchronization, the message shall be sent to
the receiver and receive back the global time in the reverse direction as shown in the
Figure-4-5.
A CBSole 1
D A B C D
120 ms
125 ms
120 ms
125 ms
5 ms 5 ms ANT Tansceiver (SOLE )
ANT Tranciever
Ts
Figure-4-5 Transmitter Protocol with Global clock Synchronization
The protocol is designed in such a way; the transmitter shall send the pressure sensor data
to the receiver after every 125 ms. The protocol works similar as that of time stamp
protocol but with extended time slots for global clock synchronization. For global clock
synchronization, we shall need a time stamp message in reverse direction in order to
calculate the offset value.
The sole ANT transceiver receives the message packet and transmits to the WBAN ANT
transceiver at the earliest possible available time slot. At the time resynchronization
interval Rint , it receives the global clock value from the ANT-ARM-USB and does the
required calculation at the time period, Ts.

Implementation
38
2) Design for Global clock synchronization Protocol
The entire communication process for Global clock synchronization is shown in the
Figure 4-6. In our research, the controller used in the SIGS system is Atmel ATmega88
and in the new ANT-ARM-USB hardware prototype connected to WBAN server is ARM
controller. The clocks used in both the controllers differ from each other with varying
drift rate and clock skew.
A Sleep modeB Scanning period for the pressure sensor dataC Transmits the pressure sensor data to the ANT TransceiverD A small time gap allotted before the start of the next transmission.Tch Designated Channel PeriodTs1n Time Stamp at ANT-ARM-USBTs Global clock synchronization
Tsrn Time Stamp at SIGS
A CBSole 1
D A B C D
120 ms
125 ms
120 ms
125 ms
5 ms 5 ms
ANT WBAN SERVER(RECEIVER)
ANT Transceiver (SOLE )
Tch=125 ms
Ts11 Ts12
ANT Tranciever
ANT Tranciever
Ts
Tsr1
Figure 4-6 Communication Process with Global clock Synchronization
The ANT WBAN server receives the message packet from the Sole ANT transceiver
after every 125 ms. The clock at the soles needs to be synchronized with respect to the
global clock at the WBAN server. In order to get synchronized, the WBAN server

Implementation
39
receives the message packet at time, Ts11. The ARM controller in the ANT-ARM-USB
hardware prototype stores the message packet in its buffer. As soon as the message is
received at the ANT-ARM-USB, the received message is time stamped with the global
clock value, Ts11 using the timer in the ARM controller.
The time stamp value of the message at the ANT-ARM-USB is sent back in the reverse
direction to the Sole ANT transceiver as shown in the figure 4-6. For transmission in the
reverse direction, the ANT transceiver uses the same channel time slot in which the
message was received. The timeslots used for the reverse direction in the ANT are longer
as compared to the time slots used for uni-direction [8].
Whenever the SIGS system receives the time stamp value from the ANT-ARM-USB
clock, it stores the time stamp value in its buffer in Atmel ATmega88 controller. The
received message packet is time stamp at time Tsrn , using the clock at the SIGS system.
The controller in the SIGS system compares its own clock value (Tsrn) with the ANT-
ARM-USB clock value (Ts1n).
The difference between both the time stamp values provides the time offset for the
synchronization as shown in the formula below.
Time Offset, ΔT= Ts1n-Tsrnwhere n=1,2,...n
Ts1n, Time stamp at ANT-ARM-USBTsrn , Time stamp at SIGS
The difference between the two clock values provides the time offset for the
synchronization. At time period Ts, the Sole system receives the packet and does the
required calculations. The Atmel ATmega88 controller in the sole system receives the
time stamp value, generates the offset and adjusts its clock skew with respect to the offset
value. As the controller is in idle state for 120 ms, the controller shall receive the packet
value at this time duration, does the required changes and then goes back to sleep mode.
The local clock in the transmitter node is now adjusted with respect to the global clock
from the receiver. Both the sole transmitters shall be programmed and developed in a
similar fashion.
However the adjustment in the transmitter clocks with respect to global clock doesn’t
provide much improvement in synchronization. But the synchronization of measurements
shall provide a good improvement in synchronization. For this improvement, a specific
method shall be required to implement in the system. The server shall decide the sample
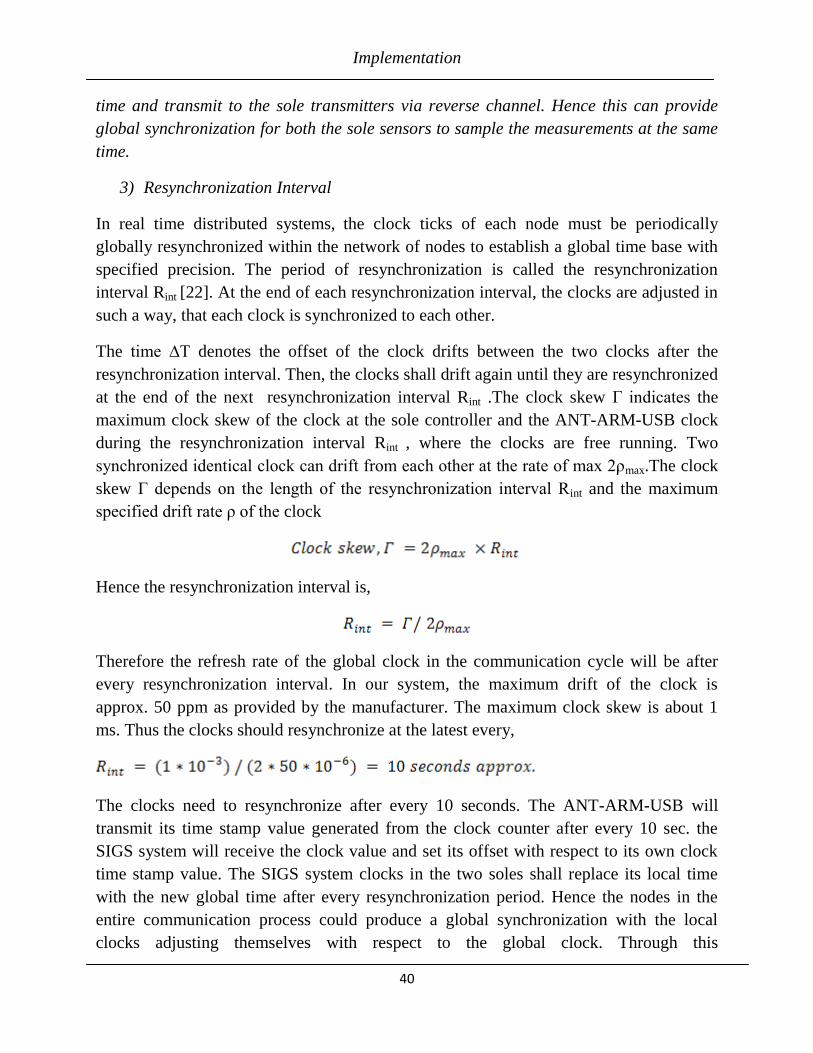
Implementation
40
time and transmit to the sole transmitters via reverse channel. Hence this can provide
global synchronization for both the sole sensors to sample the measurements at the same
time.
3) Resynchronization Interval
In real time distributed systems, the clock ticks of each node must be periodically
globally resynchronized within the network of nodes to establish a global time base with
specified precision. The period of resynchronization is called the resynchronization
interval Rint [22]. At the end of each resynchronization interval, the clocks are adjusted in
such a way, that each clock is synchronized to each other.
The time ∆T denotes the offset of the clock drifts between the two clocks after the
resynchronization interval. Then, the clocks shall drift again until they are resynchronized
at the end of the next resynchronization interval Rint .The clock skew Γ indicates the
maximum clock skew of the clock at the sole controller and the ANT-ARM-USB clock
during the resynchronization interval Rint , where the clocks are free running. Two
synchronized identical clock can drift from each other at the rate of max 2ρmax.The clock
skew Γ depends on the length of the resynchronization interval Rint and the maximum
specified drift rate ρ of the clock
Hence the resynchronization interval is,
Therefore the refresh rate of the global clock in the communication cycle will be after
every resynchronization interval. In our system, the maximum drift of the clock is
approx. 50 ppm as provided by the manufacturer. The maximum clock skew is about 1
ms. Thus the clocks should resynchronize at the latest every,
The clocks need to resynchronize after every 10 seconds. The ANT-ARM-USB will
transmit its time stamp value generated from the clock counter after every 10 sec. the
SIGS system will receive the clock value and set its offset with respect to its own clock
time stamp value. The SIGS system clocks in the two soles shall replace its local time
with the new global time after every resynchronization period. Hence the nodes in the
entire communication process could produce a global synchronization with the local
clocks adjusting themselves with respect to the global clock. Through this

Implementation
41
implementation method, we could achieve good global clock synchronization in the ANT
communication protocol.
4.5 Hardware setup
A hardware prototype was designed considering different specifications to obtain the
final task of the thesis work. The prototype should act as an interface between the
transmitter and receiver which should be compatible to WBAN server (receiver). Its
systematic operations and the functionality are shown in figure 4-7.
ANT transceiver (receives the sensor
value)
ARM cortex M3( Packet received &
Time stamp)
PCB
OLIMEX BOARD
USART
SIGS (Sole pressure sensors+ANT transceiver)
SIGS (Sole pressure sensors+ANT transceiver) ANT(2.4GHz)ANT(2.4GHz)
SERVER
USB
HARDWARE DESIGN PROTOTYPE
Figure 4-7 ANT-ARM-USB Hardware Prototype
The design prototype includes,
1) PCB design board
2) SIGS
3) Server
4) Communication protocols
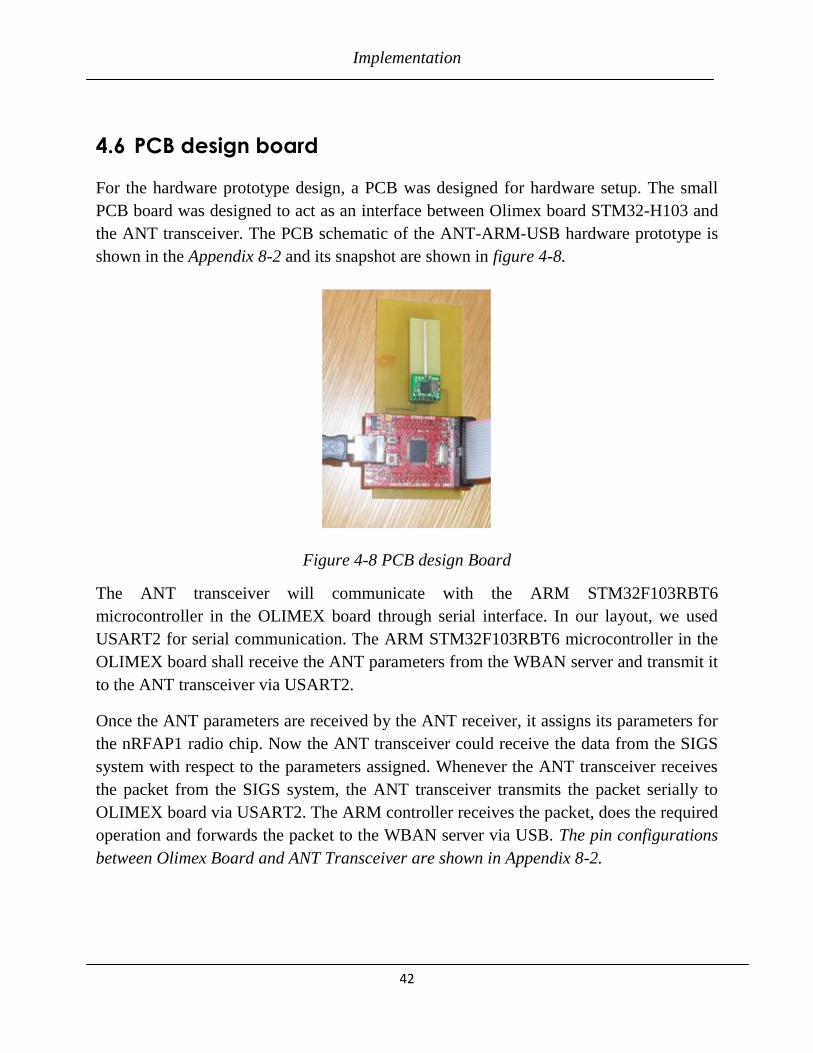
Implementation
42
4.6 PCB design board
For the hardware prototype design, a PCB was designed for hardware setup. The small
PCB board was designed to act as an interface between Olimex board STM32-H103 and
the ANT transceiver. The PCB schematic of the ANT-ARM-USB hardware prototype is
shown in the Appendix 8-2 and its snapshot are shown in figure 4-8.
Figure 4-8 PCB design Board
The ANT transceiver will communicate with the ARM STM32F103RBT6
microcontroller in the OLIMEX board through serial interface. In our layout, we used
USART2 for serial communication. The ARM STM32F103RBT6 microcontroller in the
OLIMEX board shall receive the ANT parameters from the WBAN server and transmit it
to the ANT transceiver via USART2.
Once the ANT parameters are received by the ANT receiver, it assigns its parameters for
the nRFAP1 radio chip. Now the ANT transceiver could receive the data from the SIGS
system with respect to the parameters assigned. Whenever the ANT transceiver receives
the packet from the SIGS system, the ANT transceiver transmits the packet serially to
OLIMEX board via USART2. The ARM controller receives the packet, does the required
operation and forwards the packet to the WBAN server via USB. The pin configurations
between Olimex Board and ANT Transceiver are shown in Appendix 8-2.

Implementation
43
4.6.1 Olimex Board
The board used for the design prototype is STM32-H103 [13] board provided by the
Olimex. It is a development board designed for the new ARM Cortex M3 family of
devices produced by ST Microelectronics Inc. By using this board, we can explore the
features of STM32 family and the board has many features to build simple applications.
The STM32-H103board provides the perfect solution for USB peripherals development.
The schematic of the Olimex board STM32-H103 is shown in the Appendix 8-4.The
snapshot of the board is shown in the figure 4-9.
OLIMEX BOARD STM32-H103
Figure 4-9 OLIMEX Prototype Board
1. Microcontroller Unit
The STM32F103RBT6 microcontroller belongs to a STM32F103RBxx medium-density
performance line family which incorporates the high-performance ARM Cortex™-M3
32-bit RISC core. The core operates at a frequency range of 72 MHz. It consists of high-
speed embedded memories with flash memory up to 128 Kbytes and SRAM up to 20
Kbytes. An extensive range of enhanced I/Os and peripherals are connected to the APB
buses. The microcontroller operates at a range of 2.0 to 3.6 V power supply [14].
a) USART(universal synchronous/asynchronous receiver/transmitter)
The controller has 3 USART’s for flexible duplex and asynchronous serial
communications. Using fractional baud rate generator, it provides a wide range of baud
rates. They provide hardware management of the CTS and RTS signals[14].
Implementation
44
b) USB (Universal Serial Bus)
The STM32F103RBT6 supports USB specification version 2.0 full-speed compliant. The
USB interface supports to implement a full speed (12 Mbit/s) function interface. It has
software configurable Double buffered bulk/isochronous endpoint setting support. The
dedicated 48 MHz clock source is generated from the internal main PLL. The USB
peripheral implements an interface between a full-speed USB 2.0 bus and the APB1 bus.
The USB suspend/resume are software configurable provides the device clocks to stop
for low-power consumption [14].
2. Features include
iv. USB port where power is taken and power supply circuit.
v. Reset and oscillator circuits.
vi. JTAG port for programming and debugging.
vii. Two status LEDs and user button.
viii. Microcontroller unit: STM32F103RBT6.
3. Applications
a) For USB application like PC mouse, USB mass storage device, USB Audio
class device, USB to Virtual RS232 port.
b) As the board consists of many GPIOs on the extension headers, it could be
useful for different applications by connecting additional circuits.
4.6.2 JTAG port and Debugger
The JTAG (Joint Test Action Group) was formed to test the circuit boards and for
debugging purposes. The JTAG connector allows the software debugger to talk via a
JTAG port directly to the core. The software code developed could be programmed into
the STM32F103RBT6 memory through Debugger via JTAG. The host software could
execute the instructions step by step and the debugger used for debugging is ST-LINK
manufactured by the ST microelectronics as shown in figure 4-10.

Implementation
45
Figure 4-10. ST-LINK Debugger
The ST-LINK [15] is an in-circuit debugger was provided by the ST microelectronics. It
is a programmer and debugger for STM8 and STM32 microcontroller families. The
STM32F103RBT6 microcontroller uses full speed USB interface to communicate with
the Integrated Development Environment.
4.6.3 Transceiver nRF24AP1 with Trace Antenna
This is a small breakout board with circuit for the Nordic nRF24AP1 transceiver [10].
The transceiver IC is capable of talking with other wireless products which is built on
ANT protocol. In our PCB design prototype, the transceiver unit could communicate
serially with the OLIMEX board through USART.
The wireless transceiver unit as shown in the Figure 4-11 receives the message packet
from SIGS (Sole Integrated Gait Sensor) through ANT communication protocol and
transmits the received message packet serially through USART to the OLIMEX board.
Figure 4-11 Transceiver nRF24AP1with Trace Antenna
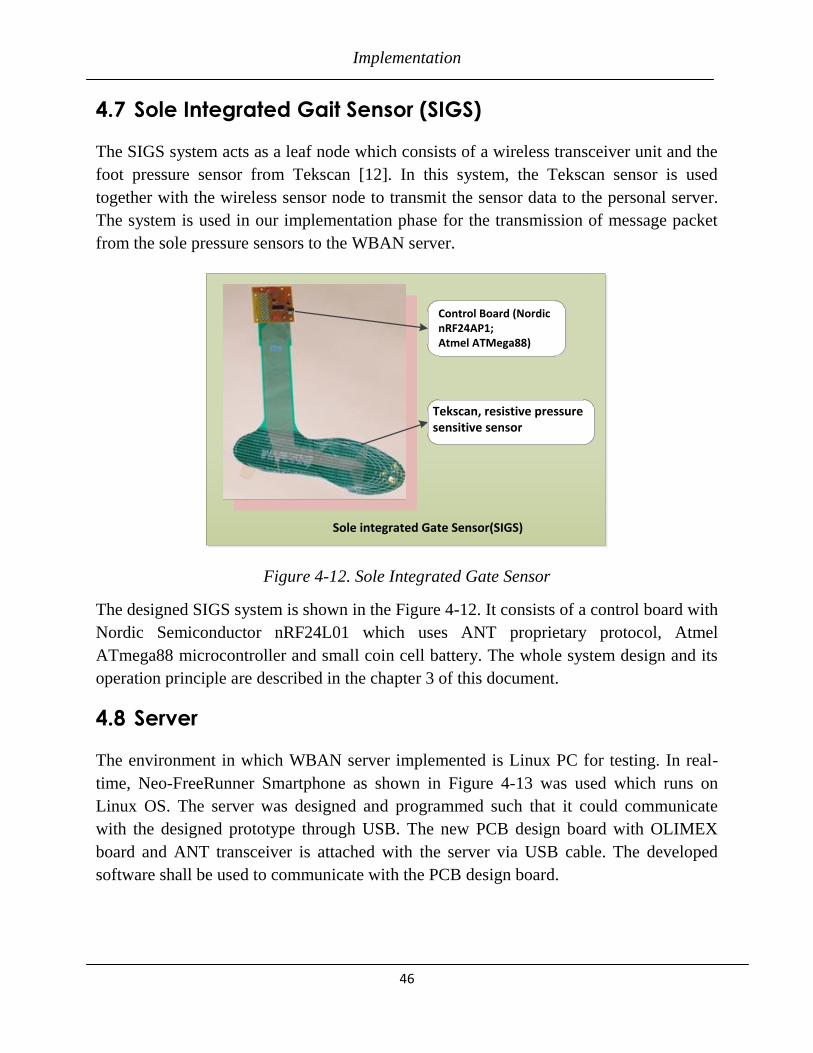
Implementation
46
4.7 Sole Integrated Gait Sensor (SIGS)
The SIGS system acts as a leaf node which consists of a wireless transceiver unit and the
foot pressure sensor from Tekscan [12]. In this system, the Tekscan sensor is used
together with the wireless sensor node to transmit the sensor data to the personal server.
The system is used in our implementation phase for the transmission of message packet
from the sole pressure sensors to the WBAN server.
Sole integrated Gate Sensor(SIGS)
Tekscan, resistive pressure sensitive sensor
Control Board (Nordic nRF24AP1; Atmel ATMega88)
Figure 4-12. Sole Integrated Gate Sensor
The designed SIGS system is shown in the Figure 4-12. It consists of a control board with
Nordic Semiconductor nRF24L01 which uses ANT proprietary protocol, Atmel
ATmega88 microcontroller and small coin cell battery. The whole system design and its
operation principle are described in the chapter 3 of this document.
4.8 Server
The environment in which WBAN server implemented is Linux PC for testing. In real-
time, Neo-FreeRunner Smartphone as shown in Figure 4-13 was used which runs on
Linux OS. The server was designed and programmed such that it could communicate
with the designed prototype through USB. The new PCB design board with OLIMEX
board and ANT transceiver is attached with the server via USB cable. The developed
software shall be used to communicate with the PCB design board.
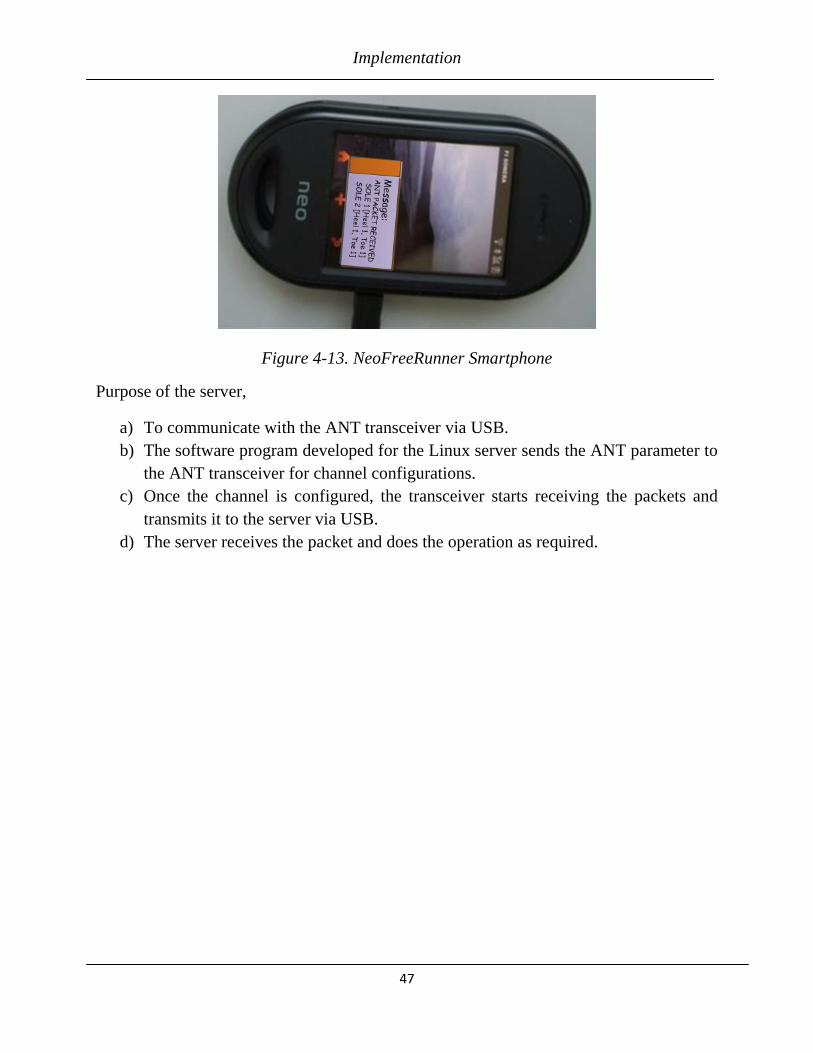
Implementation
47
Figure 4-13. NeoFreeRunner Smartphone
Purpose of the server,
a) To communicate with the ANT transceiver via USB.
b) The software program developed for the Linux server sends the ANT parameter to
the ANT transceiver for channel configurations.
c) Once the channel is configured, the transceiver starts receiving the packets and
transmits it to the server via USB.
d) The server receives the packet and does the operation as required.

Implementation
48
4.9 Software setup
The software setup was created in order to build an environment for software
development of the hardware design prototype. The developed software shall be
implemented on the hardware, to fulfill the requirements and with the specifications
provided.
Tools used,
1) Atollic True Studio– Integrated Development Environment.
2) QtiPlot – For Analysis
4.9.1 Atollic True Studio
Atollic TrueSTUDIO® [16] is an Integrated Development Environment (IDE) tool for
embedded systems development which uses the Eclipse IDE framework. It provides
C/C++ development tool for embedded developers, with increasing efficiency for the
embedded systems project. It creates a standard shift in the embedded industry with its
wide feature-set and unique integration, in combination with excellent target support.
Atollic TrueSTUDIO/STM32 features a GNU compiler/debugger for ARM processors
providing a high end support for STM32 (Cortex-M3) devices from STMicroelectronics.
Its PC compiler & debugger support enables the developer to attain an early development
before the hardware is available. Atollic TrueSTUDIO/STM32 has excellent target
support, which makes easier and feasible development of embedded systems using the
STM32 microcontroller devices from STMicroelectronics.
In our thesis work, the Atollic TrueSTUDIO®/STM32 Lite v1.4.0 were used in our
implementation phase to develop a software program for STM32F103RBT6
microcontroller in the OLIMEX board. It has no code-size or usage-time limitations, and
is an excellent entry-level compiler and debugger IDE.
4.9.2 QtiPlot
QtiPlot [17] is a computer program used to analyze and visualize scientific data. It can be
used to present 2D and 3D data and provides an environment for various data analysis
functions. In our thesis work, the data received at the WBAN server, shall be used for
performance analysis through Qtiplot.
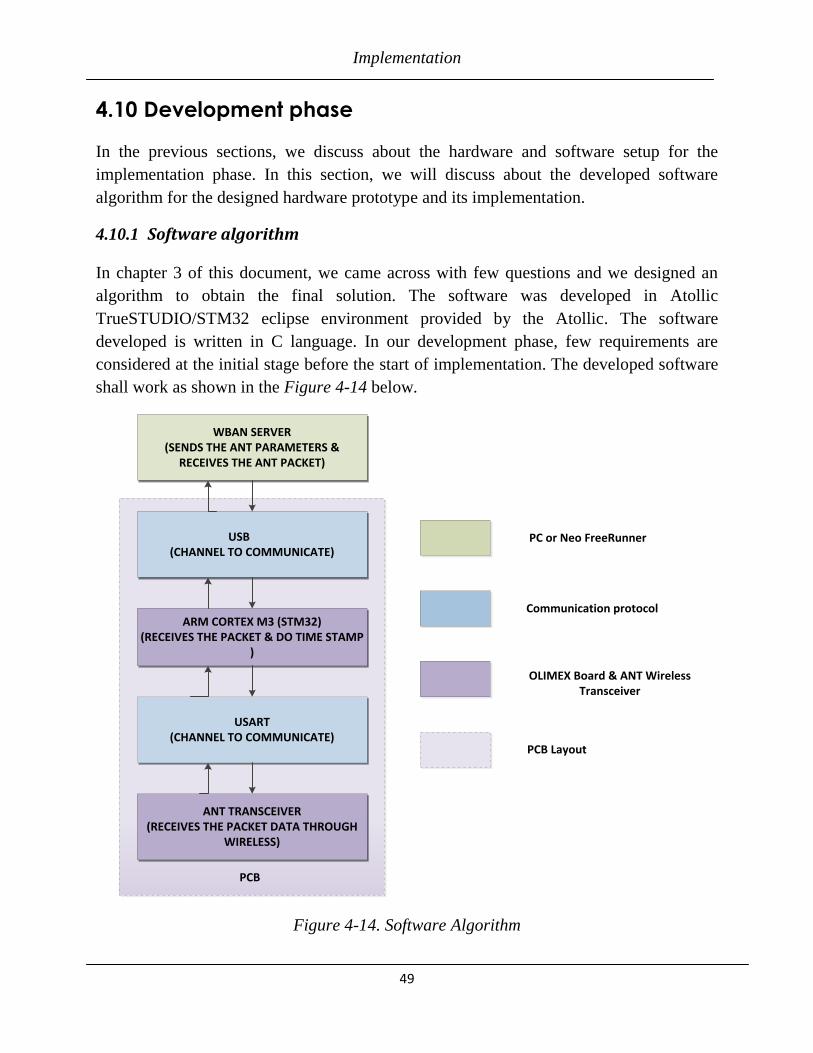
Implementation
49
4.10 Development phase
In the previous sections, we discuss about the hardware and software setup for the
implementation phase. In this section, we will discuss about the developed software
algorithm for the designed hardware prototype and its implementation.
4.10.1 Software algorithm
In chapter 3 of this document, we came across with few questions and we designed an
algorithm to obtain the final solution. The software was developed in Atollic
TrueSTUDIO/STM32 eclipse environment provided by the Atollic. The software
developed is written in C language. In our development phase, few requirements are
considered at the initial stage before the start of implementation. The developed software
shall work as shown in the Figure 4-14 below.
WBAN SERVER (SENDS THE ANT PARAMETERS &
RECEIVES THE ANT PACKET)
USB (CHANNEL TO COMMUNICATE)
ARM CORTEX M3 (STM32) (RECEIVES THE PACKET & DO TIME STAMP
)
USART (CHANNEL TO COMMUNICATE)
ANT TRANSCEIVER (RECEIVES THE PACKET DATA THROUGH
WIRELESS)
PCB
PC or Neo FreeRunner
Communication protocol
OLIMEX Board & ANT Wireless Transceiver
PCB Layout
Figure 4-14. Software Algorithm
Implementation
50
4.10.2 Configuration of the OLIMEX Board
As an initial step, relevant study was started to get familiar with the STM32
microcontroller and the OLIMEX STM32-H103 board. A simple program was created in
Atollic TrueSTUDIO/STM32 development tool, and it was debugged using ST-LINK
debugger. The pin configurations for the OLIMEX board were configured and the
software was developed such that the software program could receive and sent data via
USB. It is been tested through Hyper terminal in Windows application. The software
developed will consider the OLIMEX board as a Virtual COMport when connected the
PC.
The designed PCB prototype acts as a serial communication between the OLIMEX board
and the ANT transceiver. As part of the next stage, the software was developed such that
the OLIMEX board could communicate with the ANT transceiver through USART. The
relevant pin configurations and USART settings are made for the communication in the
software program.
The developed software could be able to conveniently send and receive data in both USB
and USART ports. In this phase, the software in the Linux Computer shall initialize the
communication between the ANT transceiver and the Linux Computer.
A software program was developed in the Linux environment. When the Linux software
is run through the terminal, the software could send the ANT parameters to the ANT
transceiver whose parameters resembles the same parameters as that of the ANT
transceiver (Transmitter) from the SIGS. The ANT parameters assigned for this network
is discussed in the chapter 3 of this document.

Implementation
51
4.10.3 Timer Configuration for Time Stamp Protocol
1) System Clock
There are three available clock sources, which can be selected via multiplexers:
1. Internal High Speed Clock (HSI)
2. External High Speed Clock (HSE)
3. Phase locked Loop (PLL)
a) Internal High Speed Clock(HSI)
By default, the HSI is used. It has a typical frequency of 8 MHz. It can be used to as PLL
input (with clock divider 2 from HSI), to generate higher clock frequencies and has a
calibration register, but is not as exact as an external crystal oscillator.
b) External High Speed Clock (HSE)
If a more precise clock is needed, external clock source shall be used. This can either be a
crystal/ceramic oscillator or a real external clock source. The crystal oscillator has the
frequency of 4-16MHz. For our implementation, 8 MHz crystal oscillator was used.
c) PLL
The Phase locked Loop is used for multiplying its input frequency by a given factor of
two to sixteen. Through the RCC_CFGR register, we can select following entry clocks:
1) 1/2 * HSI oscillator clock
2) HSE oscillator clock
The HSE oscillator clock has a clock divider which can be enabled to supply 1/2* HSE
frequency for the PLL, too.
Using the PLL, you can generate clocks up to 72 MHz, depending on the device, but we
shall not exceed the maximum frequency as specified in the datasheet []. The value of the
PLL multiplier (PLLMUL) shall have a maximum frequency of 8 MHz * 9 = 72 MHz.

Implementation
52
2) Bus Clock Setup
After setting up the system clock, the speeds of the internal bus must be adjusted. There
are three of them to be named:
a) Advanced High Performance Bus (AHB)
b) Low speed Advanced Peripheral Bus (APB1)
c) High speed Advanced Peripheral Bus (APB2)
All three can be configured by prescaler. The APB’s are subordinated to the AHB whose
frequency is specified by the symbol HCLK in the Reference Manual provided by the
manufacturer [14]. HCLK is controlled by the AHB prescaler whose clock is SYSCLK
(system clock). It is easier to explain in equations:
i) f_ahb = SYSCLK / presc_ahb = HCLK
ii) f_apb1,2 = HCLK / presc_apb1,2
In our implementation phase, bus clock setup is assigned as below.
i) AHB= f_ahb = SYSCLK = HCLK= 72 MHz
ii) APB1= f_apb1 = HCLK / presc_apb1= HCLK/2=36 MHz
iii) APB2= f_apb2 = HCLK / presc_apb2= HCLK=72 MHz
While the AHB and APB2 frequency can be up to maximum system clock frequency (72
MHz), the low speed APB1 frequency must not exceed 36 MHz.
3) Timer configuration
In our implementation, TIM3 timer was used for time-stamping. Its general-purpose
timers consist of a 16-bit auto-reload counter driven by a programmable pre-scaler.
Its configuration is assigned as below,
TIM3 clock = 36 MHz
Prescalar value is set as 35999.
Hence the,

Implementation
53
4.10.4 Implementation of Time Stamp Protocol
The developed software shall receive the message packet and transmit it to the OLIMEX
board via USART. The message structure of the ANT transmitter was discussed in the
chapter 3 of this document and it is shown in the Figure 4-15 below.
SY ML MID CH Payload CS
Time stamp Toe load Heal load
Field name Bytes Description
SY 1 Sync, 0xa4 Fixed value
ML 1 Length ,0x09
MID 1 Data type ID, 0x4e
CH 1 Channel number
Time stamp 2 ms(or sequence #)
Toe load 2 Raw sensor data
Heal load 2 Raw sensor data
CS 1 XOR of all previous data
Figure 4-15. ANT message structure on Network Layer
The software was developed in such a way, that it shall receive the message packet from
the ANT transceiver. The USART buffer in the STM32F103RBT6 microcontroller
receives the message packet from the ANT transceiver byte-by-byte at the OLIMEX
Board via USART. The baud rate at the ANT receiver is selected as 38400 bits/seconds.
The software receives the message packet and check for each byte of the packet data.
At each byte received via USART, the controller stores the one byte data and checks for
the correct data. If the received data is correct, stores the present time stamp value and
transmit the data to the USB buffer. Then, it receives the next byte of data from the ANT
transceiver. If the received data is not correct, then it waits until it receives correct data at
the buffer. The state diagram is shown in the FSM diagram at Figure 4-16.

Implementation
54
S0
S1Buffer=Buff
S2Buffer=Buff
S3Buffer=Buff
S4Buffer=Time
S5Buffer=Time
S6Buffer=Buff
S0
S0
Buff==0xa4
Buff==9
Buff==0x4e
Buff !=9Buff != 0xa4
Buff !=0x4e
Timer ON;Time=Timer
LSB
Int i=0;Time=Timer
MSB
i<6
i>6
SOFTWARE STRUCTURE FOR HARDWARE DESIGN PROTOTYPE
Figure 4-16. FSM for Software structure
Finite states:
1. SO
USART receives and checks for the first byte of the message packet. The first byte is
synchronous (SY) byte with fixed value, 0xa4.
2. S1
USART receives and checks for the second byte of the message packet. The second byte
is message length (ML) byte with Length, 9.
Implementation
55
3. S2
USART receives and check for the third byte of the message packet. The third byte is
Data type ID (MID) byte with ID, 9.
4. S3
USART receives the fourth byte of the message packet. The fourth byte contains the
channel number value.
5. S4
USART receives the fifth byte of the message packet. The fifth byte contains the payload
value which is allocated for the timestamp value. The Timer is initialized and the LSB of
the counter value is used for the timestamp.
6. S5
USART receives the sixth byte of the message packet. The sixth byte contains the
payload value which is allocated for the timestamp value. The MSB of the counter value
is used for the timestamp.
7. S6
USART receives the remaining bytes of the message packet.
After receiving all the bytes of the message packet, it checks for the checksum at the last
byte. The USB receives the message packet and stores at its buffer. The stored data at the
USB buffer are transmitted to the WBAN server via USB. At the WBAN server, the USB
is identified as virtual COM port.
The WBAN server in our thesis work is LINUX server. The LINUX server receives the
message packet from the sole sensor via the newly designed hardware prototype. The
received data by the LINUX server shall be useful for the biofeedback, which could be
transmitted to the health service or act as an alarm indicator for the user.
The design and implementation work flow structure is discussed in this chapter. The
designed working model fulfills the requirements or not and the different testing phases
for the system will be discussed in the chapter 5 of this document.
Analysis and Performance Results
56
5 Analysis and Performance results
In chapter 3, we discuss about the research problems and the relevant questions. In
chapter 4, the proposed implemented solutions for the questions were described and the
systematic approach to achieve the task were also explained. In this chapter, we will
discuss about the performance analysis of the proposed solution and the relevant results
will be shown for the proposed solutions.
5.1 Experimental Setup
For a system to get validated, different testing shall be undertaken and experimental setup
need to be created. The hardware prototype and software developed shall be tested in the
laboratory environment. The SIGS system with sole pressure sensors at the transmitter
side is assembled and the software program developed for the system is installed. In real
time two soles of the SIGS system will be used which will be embedded into two soles of
the patient’s shoes.
A software program is developed at the receiver side for the new prototype design is
programmed into the ARM micro-controller through ST-LINK Debugger. The USB
protocol implemented in software program for the new hardware prototype is the Virtual
COM-port. The software program developed for ANT receiver side shall be able to
communicate with ANT receiver at SIGS system in air with 2.4 GHz band. The size of
the packet transmitted from the SIGS system will be equal to 11 bytes and its message
structure is discussed in chapter 3 of this document. The program developed shall receive
message packet at ANT receiver, transmit to the OLIMEX board via USART. The ARM
controller will receive the message packet byte by byte from the USART buffer and
stores in the USB buffer.
In order to test this system, the program developed for Linux computer is used. The
hardware prototype will be connected to Linux computer via USB. The program
developed at Linux computer shall be run through Linux terminal using the Linux
commands. The steps used to run the Linux program are given in Appendix 1. The Linux
program receives the message packet from the USB and the received data are stored in
the buffer which could be useful for further analysis. Through the software developed in
the Linux computer, we could define the number of samples needed for the analysis.

Analysis and Performance Results
57
5.2 Testing phases
The hardware prototype and software developed are tested in laboratory environment.
Different tests analyses were created to check the functionality, performance and
robustness of the system.
5.2.1 Functional tests
In this test, the SIGS system is tested with the new prototype for its full functionality. The
experimental setup for the testing is implemented in a laboratory with the required
equipments. The two assembled SIGS system on the transmitter side is placed on the
floor. They are placed one above the other such that both the sole’s diagonal matches
each other. The hardware prototype at the transmitter side will be connected to Linux
computer via USB.
The sampling rate is 8 samples/sec and the message rate is 8 messages/sec (bit rate is 1
Mbit/sec) is set to both the transmitter and receiver. Each message contains 2 raw sensor
data ie, one for the heel part and the other for toe.
Figure 5-1 Pressure sensor values of two soles are plotted against time to check the
functionality of the SIGS system

Analysis and Performance Results
58
The Linux server starts receiving the pressure sensor data with time stamping values via
hardware prototype. The received sensor values from the two soles of the SIGS system is
shown in Figure 5-1. The two curves in the graph indicate the pressure sensor values of
the two soles of the SIGS system received at the receiver.
Through this test we can conclude that,
1. The new prototype designed has the ability to receive the message packets from
the SIGS system which is shown in Figure 5.1 with two curves black and red
indicating two soles.
2. The ANT receiver can receive the message packets from the ANT transmitter of
the SIGS system.
3. The received message packet can be transmitted to the OLIMEX board in the new
hardware prototype via USART. It clearly states that USART communication
works fine.
4. The OLIMEX board communicates with the LINUX computer via USB and
transmits the message packet. It means that USB communication works fine.
5. At what time the message packet is received at the kernel of the LINUX computer,
is found through time stamp value in the message packet.
6. The two soles try to send their pressure sensor values within the designated
channel period, Tch (in our experiment, Tch = 125 ms). The two soles adjust
themselves with respect to each other to transmit within their time slots.
5.2.2 Performance tests
In this test, the performance of the system will be analyzed and the time synchronization
in ANT protocol will be investigated. The experimental setup for the testing is
implemented in a laboratory with the required equipments. To perform this test, two
different experiments were selected.
1. While walking – No disturbance
In this experiment, the pressure is applied to the soles of the SIGS system while walking
with two foots on the two soles of the SIGS and the LINUX Computer is placed nearer to
the heart to collect the pressure sensor data from the SIGS system. The sampling rate is 8
samples/sec and the message rate is 8 messages/sec (bit rate is 1 Mbit/sec) is set to both
the transmitter and receiver. The SIGS system is attached to the legs with the soles at the
foot part and tried to walk on the floor with the SIGS system attached to the legs. The
received pressure sensor values from the two soles of the SIGS system is shown in
Figure 5-2.

Analysis and Performance Results
59
Figure 5-2 Pressure sensor values of two soles are plotted against time to check the
performance of the SIGS system while walking
Test Time taken
(msec)
No. of Packets
Expected
No. of Packets with
respect to time
Missed
Packets
Sample test 6625 100 106 6
No. of Packets request from the Linux Server = 100 Packets.
Time required to receive 100 packets = 6250 ms.
Total Time taken = 6625 ms.
Results from the experiments
The experiments were made in order to analyze the performance of the system and to
investigate the time synchronization in ANT protocol. In chapter 3 of this document,
reason for this extended research and the research questions were clearly stated. We will
discuss few of the solutions for the research questions obtained through these
experiments.

Analysis and Performance Results
60
1. If sole 1 sensor wins the arbitration, it starts to transmit at once at the earliest
available time slot. Sole 2 waits for a random time and starts transmission in the
available time slot within the designated channel period. Sole 1 starts transmission
in its allocated time slot exactly after 125 ms. It doesn’t concern about the Sole 2
transmission. Through our experiments, we concluded that the time difference
between the time slots of two soles were approximately around 10- 60 msec.
2. With the time stamp protocol, it is not possible to synchronize measurements from
both the soles, but it is possible to estimate the actual sampling point. The
measurements from the pressure sensors are sampled every 125ms. From figure 5-
2 , Sole 1 transmits the sampled data to WBAN server continuously after every
125ms. Similarly the Sole 2 transmits in the same fashion.
As shown in figure 5-3,
a) Calculation 1:
Sole 1 receives its 4th
packet, Ts14 = 29488 &
Sole 1 receives its 5th
packet, Ts15 = 29613
Time difference = 125 ms
Similarly,
Sole 2 receives its 4th
packet, Ts24 = 29543 &
Sole 2 receives its 5th
packet, Ts25 = 29668
Time difference = 125 ms
b) Calculation 2:
Time synchronization error, ∆T = min (|Ts1n – Ts2n|,|Ts1n-Ts2n-1|) where n= 1, 2…..n.
Time Synchronization error, ∆T = Ts14-Ts24 =29543-29488
∆T = 55 ms
c) Calculation 3:
Baud rate at ANT transceiver = 38400 bits/sec
No of bytes transmitted from ANT Transceiver = 11 bytes
Hence for 11 bytes of transmission of data from ANT transceiver to ANT-ARM-
USB prototype board is,
Time taken = 11 bytes * (1sec/38400)
Delay = 2.291 ms

Analysis and Performance Results
61
Through these experiments and calculations, the implementation of time stamp is
good enough to measure the sampling data. The soles are synchronized such that,
both the soles could transmit the sampled data after every 125 ms as shown in the
figure 5-3 and 5-4. The sampled data are received continuously after every 125 ms
and the time stamping to all the received data is done accurately after 125 ms,
which is shown clearly in figure 5-2. Hence we could conclude that, the timestamp
protocol implemented in our system is good with varying delay of 2.291 msec.
3. Without Time stamping protocol, the data received at the Linux kernel is of
useless. By implementing the Time stamping protocol, we could receive a time
synchronized data from the transmitter and received time stamped data could be
useful for future analysis.
2. Sequence numbers and Time stamping performance
The experimental setup is the same as compared to previous experiment. The soles are
placed one above the other and a varying load shall be applied as shown in the figure 5-3.
Through the time stamp protocol, the delay between the right and left sole sensor shall be
calculated. Through this delay it is possible to estimate the new signals of the soles with
zero delay.
In order to estimate the new signal values with zero delay, linear interpolation shall be
used. The signal from the two sole sensors shall be considered, with one as the reference
signal and the other signal shall interpolate to match the sampling points.
Consider two sampled signals from the samples of two soles as Left sole [X (n)] and
Right sole [Y (n)]. The time synchronization error between the sampled signals shall be
considered as ∆t. The time difference between the two samples in the SIGS system is
T=125 ms. The new corrected signal shall be calculated from the below equation,
…………………. (1)

Analysis and Performance Results
62
Figure 5-3 Pressure sensor values are plotted against time to check the performance of
time stamping at the receiver
In this experiment, the time synchronization error between the two samples soles is 55
ms; such that the right sole is sampled 55 ms before the left sole. The sampled signal
from left sole is considered as the reference signal and the sampled signal from the right
sole shall interpolate to match sampling points. In figure 5-3, the sampled signal from the
right sole is moved 55 ms; such that both the soles are sampled at the same time. The new
corrected signal is estimated using the above mentioned equation (1).
Calculation 1:
At sampled time 250 ms,
The pressure sensor value of right sensor , X (n) = 728
The pressure sensor value of left sensor , Y (n) = 854
Time synchronization error , ∆t = 55
Using the equation (1),
New corrected sampling point of right sensor , C (n) = 840
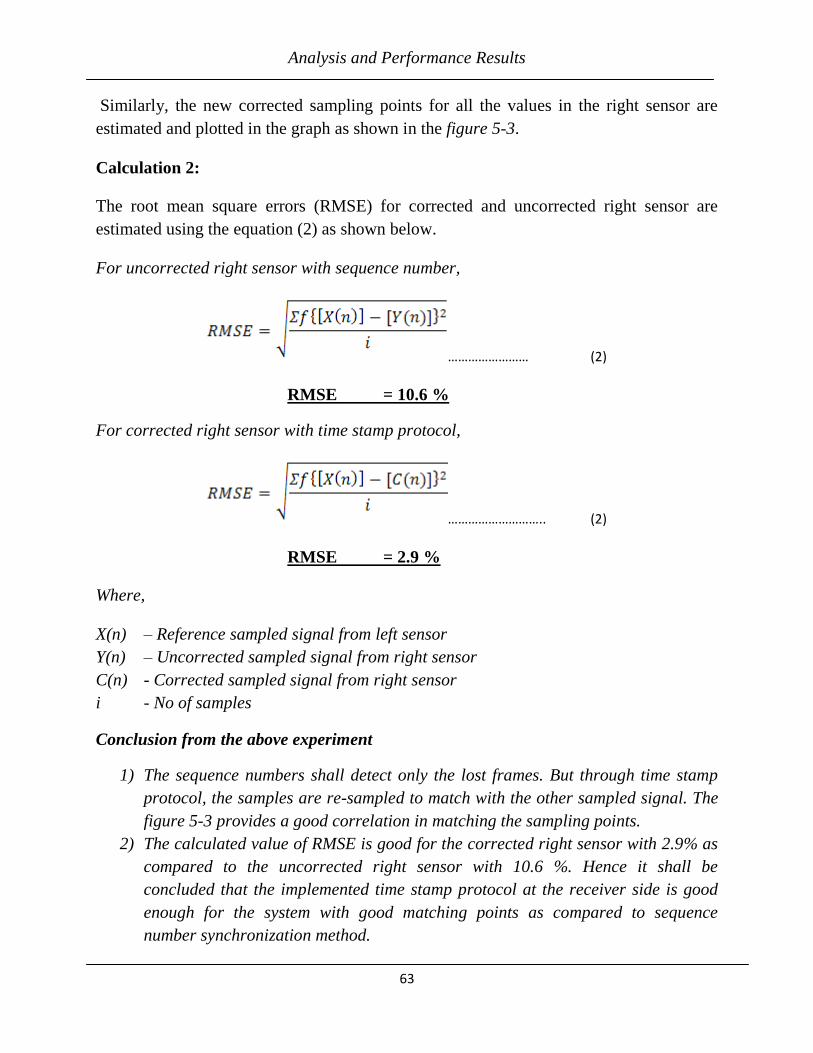
Analysis and Performance Results
63
Similarly, the new corrected sampling points for all the values in the right sensor are
estimated and plotted in the graph as shown in the figure 5-3.
Calculation 2:
The root mean square errors (RMSE) for corrected and uncorrected right sensor are
estimated using the equation (2) as shown below.
For uncorrected right sensor with sequence number,
…………………… (2)
RMSE = 10.6 %
For corrected right sensor with time stamp protocol,
……………………….. (2)
RMSE = 2.9 %
Where,
X(n) – Reference sampled signal from left sensor
Y(n) – Uncorrected sampled signal from right sensor
C(n) - Corrected sampled signal from right sensor
i - No of samples
Conclusion from the above experiment
1) The sequence numbers shall detect only the lost frames. But through time stamp
protocol, the samples are re-sampled to match with the other sampled signal. The
figure 5-3 provides a good correlation in matching the sampling points.
2) The calculated value of RMSE is good for the corrected right sensor with 2.9% as
compared to the uncorrected right sensor with 10.6 %. Hence it shall be
concluded that the implemented time stamp protocol at the receiver side is good
enough for the system with good matching points as compared to sequence
number synchronization method.
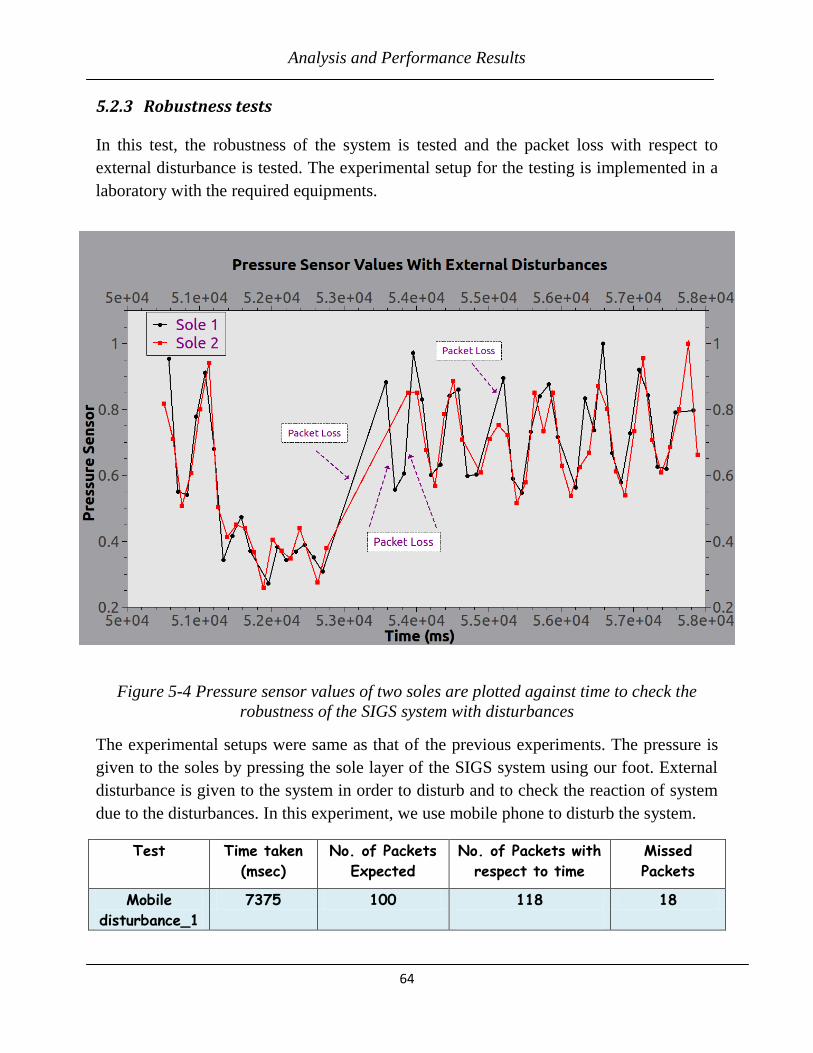
Analysis and Performance Results
64
5.2.3 Robustness tests
In this test, the robustness of the system is tested and the packet loss with respect to
external disturbance is tested. The experimental setup for the testing is implemented in a
laboratory with the required equipments.
Figure 5-4 Pressure sensor values of two soles are plotted against time to check the
robustness of the SIGS system with disturbances
The experimental setups were same as that of the previous experiments. The pressure is
given to the soles by pressing the sole layer of the SIGS system using our foot. External
disturbance is given to the system in order to disturb and to check the reaction of system
due to the disturbances. In this experiment, we use mobile phone to disturb the system.
Test Time taken
(msec)
No. of Packets
Expected
No. of Packets with
respect to time
Missed
Packets
Mobile
disturbance_1
7375 100 118
18
Analysis and Performance Results
65
No. of Packets request from the Linux Server = 100 Packets.
Time required to receive 100 packets = 6250 ms.
Packet loss = 18 Packets.
Total Time taken = 7375 ms.
The mobile phone is used to make a call to other mobile and the disturbance is created by
keeping the mobile phone near to the receiver of the SIGS system. The disturbances were
continuous and the testing was considered in worst case scenario. The received pressure
sensor values from the two soles of the SIGS system is shown in Figure 5-4. The table
shows the packet loss and the time taken to receive the total packets.
Through this test, the robustness of the system is analyzed. The external interference
could not be avoided. There might be possibility of external disturbance to the system.
From figure 5-4, few packet losses in the system shall be verified. As the system was run
for a shorter time and the disturbance was continuous (in worst case scenario)
throughout the communication process, there were few packet losses. Whenever any
disturbance occurs, there are few packet losses. But however the system gets stable and
receives the message packet without any packet loss within a shorter time.
5.2.4 Final test results with overall observation for protocol
In this test, overall observations from all the tests were considered. The observed values
from different environmental setups were taken. The graph is plotted between the time
interval and the number of observations as shown in the Figure 5-5. The time interval is
the time difference between the two soles in the time slots of ANT communication
protocol. The number of observations is the observations done through the number of
tests. Whenever the channel is free, each sole transmitter tries to communicate with the
ANT receiver in their dedicated time slot. If the channel is busy, the ANT transmitter
tries to transmit in the next time slots.
In our SIGS system, the channel period is 125 ms. The center value of the channel period
is approx. 62 ms. In our graph, the time intervals are considered in such a way that,
nearest time difference value to the transmission are chosen. For example,
Transmission time of sole 1, T11= 1250 ms
Transmission time of sole 2, T21= 1306 ms
Time interval, ∆T = T11-T21= 56 ms

Analysis and Performance Results
66
Similarly if,
Transmission time of sole 1, T11= 1250 ms
Transmission time of sole 2, T21= 1325 ms
Transmission time of sole 1, T12= 1375 ms
Time Interval, ∆T= T12-T21=50 ms
Figure 5-5 No. of observations are plotted against time to check the allocation of time
slots and the time synchronization in Protocol
Through our time stamp protocol, we could observe that most of the observations
obtained are randomly generated throughout the channel period. In the figure 5-5, overall
maximum observations fall between 10-60 ms, such that the approximate time difference
between the two soles were around 10-60 ms. Through our detailed study and
experimental observations, we could assume that the protocol tries to accommodate the
time slot for the second transceiver as soon as possible after the first transceiver.
Whenever the ANT channel is busy, the ANT transceiver could communicate in the next
available time slot which is approximately nearer to the time slot allocated for the first
transceiver. Hence the transceiver could transmit before the start of the next channel
Analysis and Performance Results
67
period and thus the protocol could produce a better synchronization. Through the
observations, it shall also be concluded that, once the time slot is allocated for the
channel at the start of the synchronization, it utilizes approximately the same allocated
time slot at the time of re-synchronization after every packet loss.

Conclusions
68
6 Conclusions
6.1 Summary and Discussions
In our thesis, we proposed solutions for time synchronization between ANT sensor nodes
and new hardware design prototype for ANT low power wireless sensor networks. As the
ANT protocol is a proprietary protocol, the scheduling of time slots is adaptive
isochronous co-existence i.e. the scheduling is dynamic and unpredictable. With this
thesis work, the designed method was implemented to know about the time
synchronization in ANT protocol and to provide a time synchronized data to the ANT
receiver. The designed synchronization method implemented was Time stamp protocol
for Broadcast data-type. The implemented protocol provides us the packet data with time
stamp through which we could know when the data is measured. Moreover the data with
time stamp helped the receiver to store the data in its buffer and made easier for future
reference.
The implemented hardware design prototype with its built-in processor could help the
developer to include additional features in future for different applications. In this
prototype, the tasks include USART communication protocol, USB communication
protocol, time stamp protocol, send and receive sensor data via ANT protocol were
implemented in both software and hardware phase with full functionality. Its
functionality and performances were tested and the results obtained were successful. The
designed method also provided us a way to know clearly about the time slots and time
synchronization in ANT protocol which will help the new ANT users in choosing the
ANT protocol for different application. The SIGS system was tested with the new
hardware design prototype and the Linux WBAN server. The experimental results show
that this new designed system is feasible and reliable for Wireless health care bio
feedback systems.
The number of experimental test and observations provided a solution to know about the
allocation of time slots in ANT protocol. The new research proposed solution for global
clock synchronization in ANT protocol shall provide a better time synchronization in the
system but time stamping at receiver with re-sampling of one of the sensors also provided
a good result.

Conclusions
69
6.2 Future work
Through series of experiments and results, we could improve the research work with
additional features. The time stamp protocol could not be implemented directly on the
user space of Linux WBAN server but it is possible to implement on the Linux kernel and
drivers, which might be more complex and could provide a better alternative solution.
While designing the hardware prototype, the cost was not considered. As the prototype is
built for testing purpose, we shall build a new hardware prototype board with fewer
features with low cost processor like ATMEL which could provide required features for
the specific applications in future.
The implementation of Global clock could provide a good synchronization. The time
stamp protocol implemented is for Broadcast data-type which is uni-directional with low
power consumption. So the Global clock can be implemented but with small increase
in power consumption with much better synchronization of measurements in our SIGS
system. The research solution for the global clock synchronization for ANT was provided
with better time synchronization in the reverse direction. The implementation of this
synchronization protocol for ANT protocol in the future could provide efficient global
clock synchronization.
References
70
7 References
[1] Whittle, Michael W. Gait Analysis: An Introduction. 4th
Edition.
Edinburgh: Elsevier Butterworth-Heinemann, 2007.
[2] Forster and J. Young, Incidence and consequences of falls due to stroke: a
systematic inquiry. Department of Health Care for the Elderly, Saint
Luke's Hospital, Bradford. Available online at
http://www.ncbi.nlm.nih.gov/pmc/articles/PMC2550147/
[3] V. Femery, P. Moretto, JM. Hespel, G. Lensel. Plantar Pressure
BioFeedback Device for Foot Unloading Proc. of the 5th Symp. On
Footwear Biomechanics, 2001, Zuerich / Switzerland, (Eds. E. Hennig, A.
Stacoff).Available online at http://www.uni-
due.de/~qpd800/FW2001/LITPDF/Femery17%20doc.pdf
[4] Available online at
http://www.patentstorm.us/patents/6087926/description.html
[5] Kristy Williamson. Research Methods for Students, Academics and
Professionals. New South Wales. Charles Sturt University, 2002. pp 305-
320.
[6] Kristy Williamson. Research Methods for Students, Academics and
Professionals. New South Wales. Charles Sturt University, 2002. pp 150-
155.
[7] Neo FreeRunner Smartphone, Features and Specifications. Available online
at http://wiki.openmoko.org/wiki/Neo_FreeRunner#Specifications
[8] ANT Message Protocol and Usage. Available online at
http://www.thisisant.com/images/Resources/PDF/1204662412_ant%20mes
sage%20protocol%20and%20usage.pdf
[9] nRF24AP1 Nordic Semiconductor, Product Specification. Available online
at http://www.sparkfun.com/datasheets/Wireless/Nordic/nRF24AP1.pdf
[10] Transceiver nRF24AP1 with Trace Antenna, Product Specification.
Available online at http://www.sparkfun.com/products/8565
[11] ATMEL ATmega 88 Microcontroller, Data Sheet. Available online at
http://www.atmel.com/dyn/resources/prod_documents/doc2545.pdf
[12] F-SCAN Foot Pressure Sensor, Data Sheet.Available online at
http://www.tekscan.com/medical/system-fscan1.html
References
71
[13] OLIMEX STM32-H103 Development Board, User Manual. Available
online at http://www.olimex.com/dev/pdf/ARM/ST/STM32-H103.pdf
[14] STM32F103xb Microcontroller, Data Sheet. Available online at
http://www.st.com/internet/com/TECHNICAL_RESOURCES/TECHNICAL
_LITERATURE/DATASHEET/CD00161566.pdf
[15] In-circuit Debugger for STM32, User Manual. Available online at
http://www.st.com/stonline/products/literature/um/15285/st-link.pdf
[16] Atollic TrueSudio STM32 Lite. Available online at
http://www.atollic.com/index.php/truestudio
[17] Benoit Latre, Bart Braem, Ingrid Moerman, Chris Blondia,Piet
Demeester. A Survey on Wireless Body Area Networks. Available online at
http://www.pats.ua.ac.be/content/publications/2010/bbraem10wbansurvey.
[18] Cardio Vascular Diseases (CVDs). Available online at
http://www.who.int/mediacentre/factsheets/fs317/en/index.html
[19] Miklas Maroti, Branislav Kusy, Gyula Simon, Akos Ledeczi. The Flooding
Time Synchronization Protocol, Institute for Software Integrated Systems,
Vandebilt University, USA.
[20] Kopetz, Hermann. Real-Time Systems: Design Principles for Distributed
Embedded Applications. Pp 45-68.

Appendix
72
8 APPENDIX
8.1 Schematic of SIGS system In this section, we present the PCB schematic of the SIGS system designed for the soles with Atmel
ATmega 88 microcontroller with ANT Transceiver and the pressure sole sensors.
Figure 8-1 Schematic of the SIGS Sole system
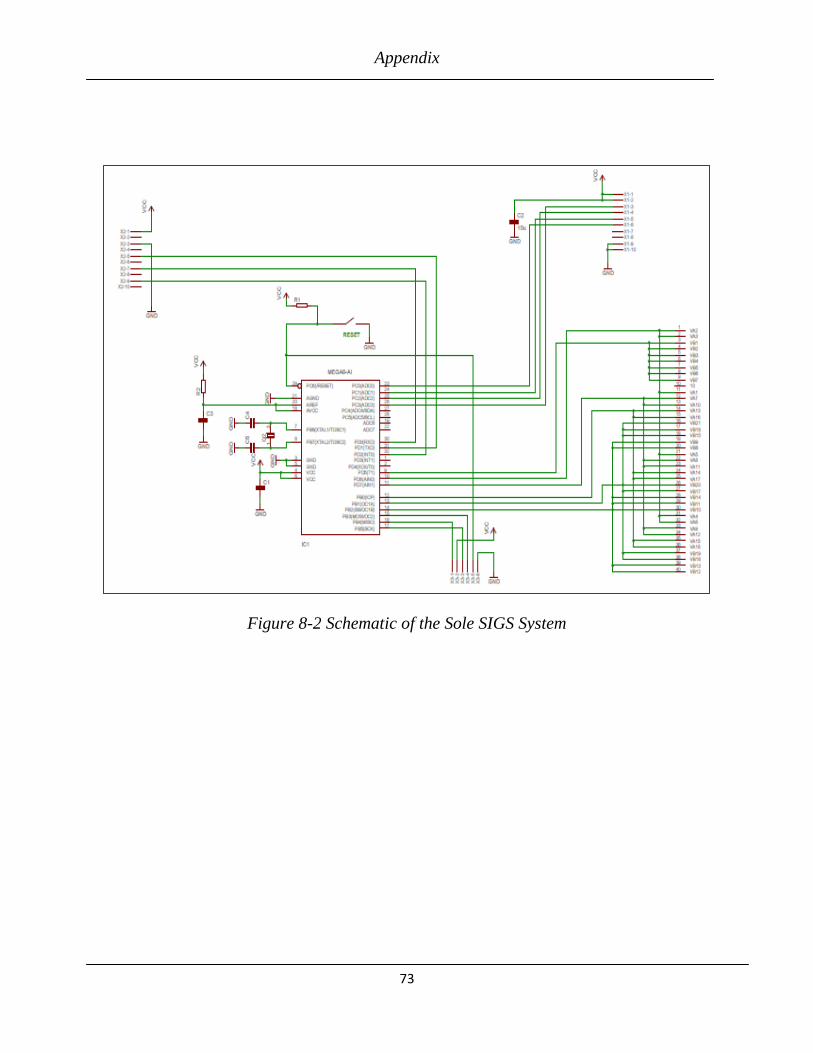
Appendix
73
Figure 8-2 Schematic of the Sole SIGS System
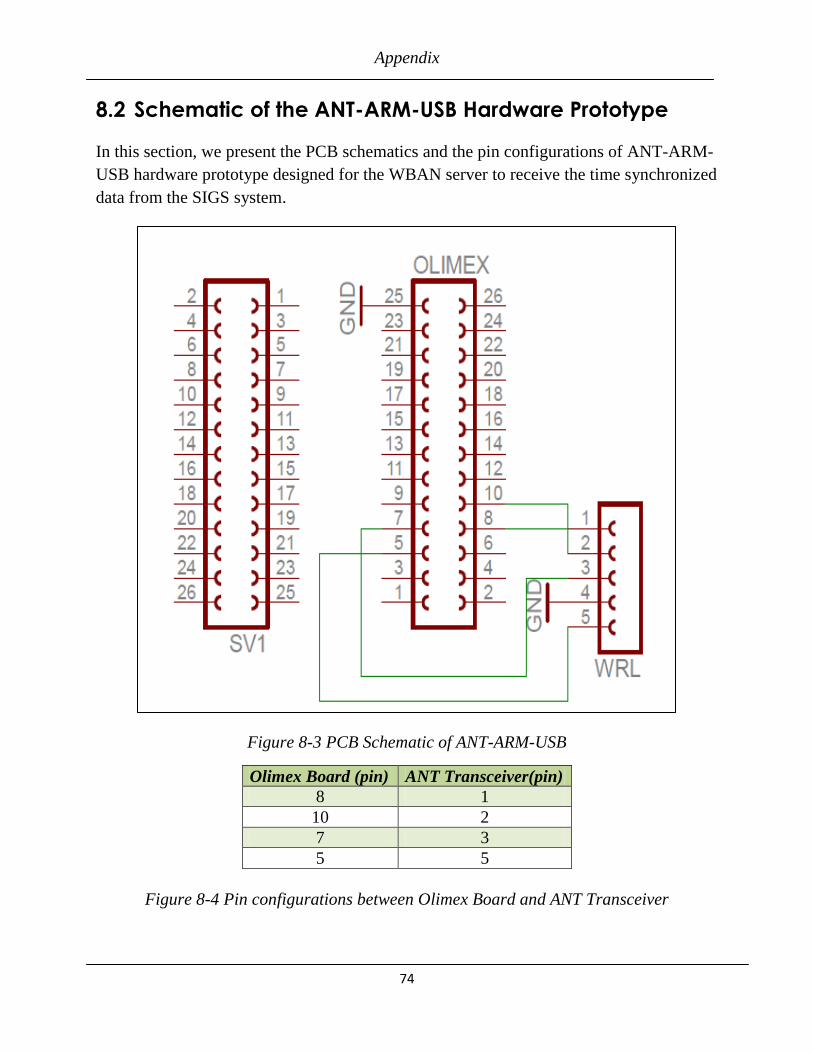
Appendix
74
8.2 Schematic of the ANT-ARM-USB Hardware Prototype
In this section, we present the PCB schematics and the pin configurations of ANT-ARM-
USB hardware prototype designed for the WBAN server to receive the time synchronized
data from the SIGS system.
Figure 8-3 PCB Schematic of ANT-ARM-USB
Olimex Board (pin) ANT Transceiver(pin)
8 1
10 2
7 3
5 5
Figure 8-4 Pin configurations between Olimex Board and ANT Transceiver

Appendix
75
8.3 Schematic of OLIMEX STM32 H103 Development Board
Figure 8-5 Schematic OLIMEX STM32-H103 Development Board


