1 Ecobuild, 5 March 2013 Mind the Gap: Why does energy use fall so short of predictions? Time to get real about building energy performance Bill Bordass the USABLE BUILDINGS TRUST www.usablebuildings.co.uk
Transcript
1
Ecobuild, 5 March 2013
Mind the Gap: Why does energy use fall so short of predictions?
Time to get real about building energy performance
Bill Bordass
the USABLE BUILDINGS TRUST
www.usablebuildings.co.uk
2
1
THE PEFORMANCE GAP:
SOME FUNDAMENTAL REASONS and
AN EXAMPLE
3
The Design-Performance Gap: Identified in the 1990s
<< What the designers predicted
<< Actual outcome
SOURCE: see discussion in S Curwell et al, Green Building Challenge in the UK, Building Research+Information 27(4/5) 286 (1999).
<< “Good” benchmark
Data from the winner of the Green Building of the Year Award 1996
4
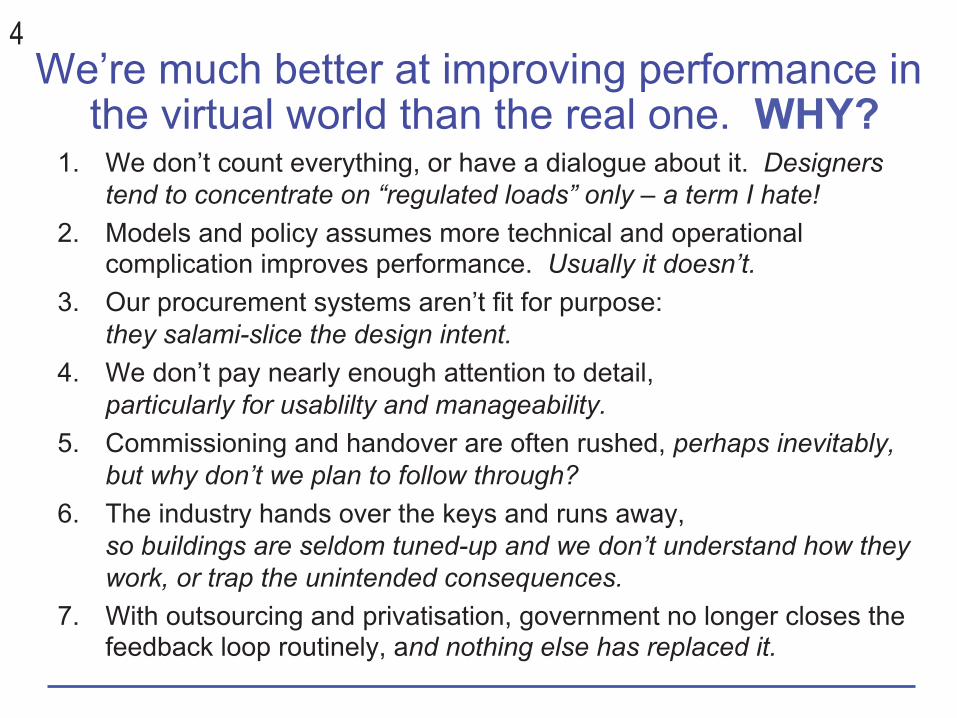
We’re much better at improving performance in the virtual world than the real one. WHY?
1. We don’t count everything, or have a dialogue about it. Designers tend to concentrate on “regulated loads” only – a term I hate!
2. Models and policy assumes more technical and operational complication improves performance. Usually it doesn’t.
3. Our procurement systems aren’t fit for purpose: they salami-slice the design intent.
4. We don’t pay nearly enough attention to detail, particularly for usablilty and manageability.
5. Commissioning and handover are often rushed, perhaps inevitably, but why don’t we plan to follow through?
6. The industry hands over the keys and runs away, so buildings are seldom tuned-up and we don’t understand how they work, or trap the unintended consequences.
7. With outsourcing and privatisation, government no longer closes the feedback loop routinely, and nothing else has replaced it.
5
For most of the construction and property industry, building performance in use has been another country …
designers seldom get feedback,
and only notice problems when asked to investigate a failure. ALASTAIR BLYTH CRISP Commission 00/02 I ve seen many low-carbon
designs, but hardly any low-carbon buildings ANDY SHEPPARD Arup, 2009 We need to take much more account of the evidence under our noses.
SOURCE: Hellman cartoon for W Bordass, Flying Blind, Association for the Conservation of Energy & OXEAS (2001)
6
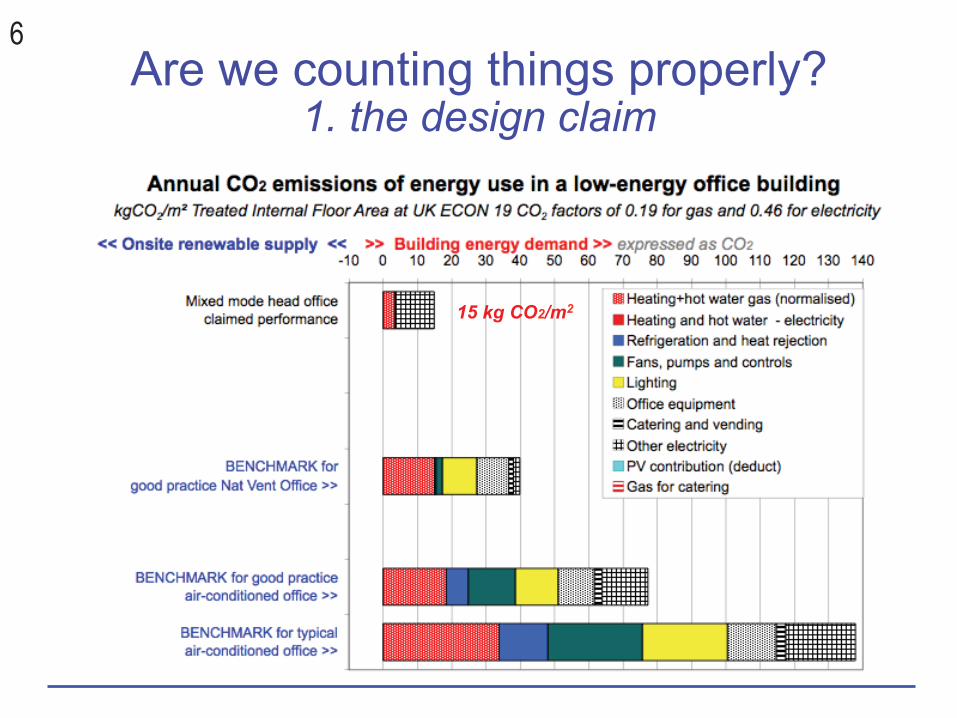
Are we counting things properly? 1. the design claim
15 kg CO2/m2
7
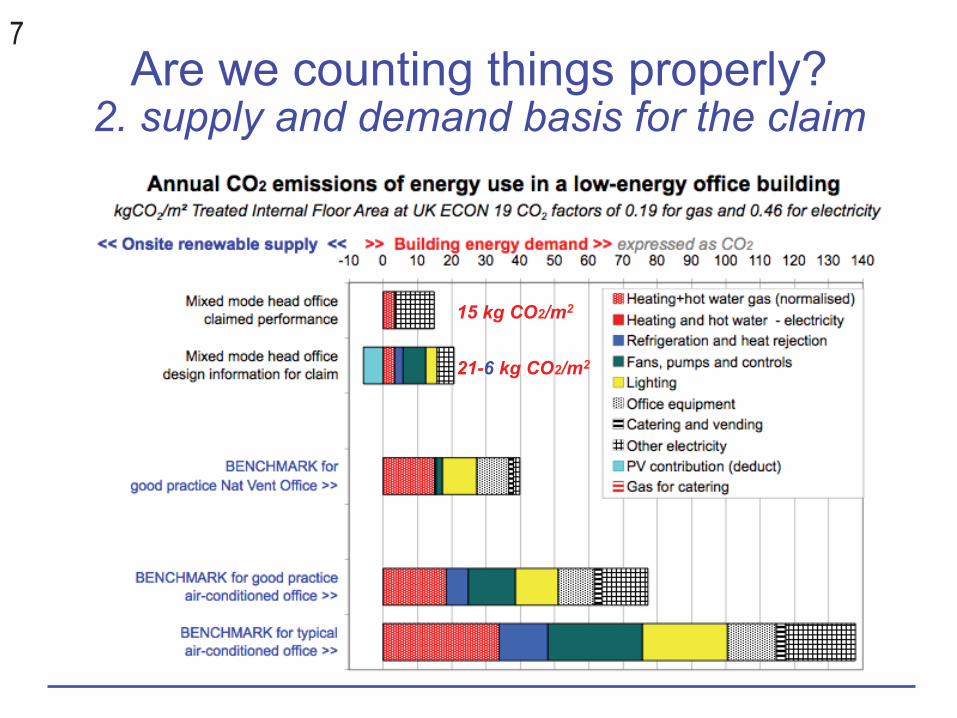
Are we counting things properly? 2. supply and demand basis for the claim
15 kg CO2/m2
21-6 kg CO2/m2
8
Are we counting things properly? 3. From the log book: 2.5 x the claim.
9
Is it working as anticipated? In use, regulated CO2 was twice the prediction, and …
… over half the CO2 came from the server room and the kitchen
10
Some underlying reasons for this particular gap
• PROCUREMENT: Transferred to developer at Stage E. Some continuity of design intent lost.
• HEATING: Issues with fabric integrity, controls and less sophisticated plant than the designers had anticipated.
• HOT WATER: Better separate from the heating? • LIGHTING: Predictions optimistic owing to control issues
and insufficient daylight on some walls and ceilings. • SERVER ROOM: Efficient air-conditioning provided, but
independent specialist advice on the energy performance of the servers themselves would have been helpful.
• CATERING KITCHEN: Some items overspecified. • CONTROLS and METERING: Need for better
integration, commissioning and fine tuning.
11
2
GETTING REAL: IMPROVING
NEW CONSTRUCTION AND REFURBISHMENT
Make things simpler and smaller if you
can, and do them better!
12
Fabric First: Efficient services need to be able to rely on it
Air pressure test of the Maths Building Cambridge as part of a Probe POE
13
37 times less air permeabilty than the Part L maximum permissible.
14
Gentle engineering Not over-engineering
“Evening out fluctuations has become an egalitarian enterprise which it is heresy to question.” MICHAEL YOUNG, The Metronomic Society (1988).
“There is something inelegant in the mass of energy-consuming machinery needed at present to maintain constant RH …
something inappropriate in an expense which is beyond most of the world's museums.”
GARRY THOMSON, The Museum Environment (1978).
“What we’ve got used to, we’re not entitled to” … R BUNN (2008)
15
In 1994, two of these boilers heated a 3200 m2
university building – E Fry (@ 15 W/m2).
So why does a recently-completed UK “zero-carbon” school have 60 W/m2 of biomass boiler power with gas backup?
16
And what about this? In a new “low energy” building’s kitchen OVER-PROVISION IS WIDESPREAD
17
And this? A UPS a client never knew he was getting, with an overhead of 300,000 kWh/year
18
Controls, manageability and usability need to receive much more attention
“An intelligent building is one that doesn’t make its occupants feel stupid”… ADRIAN LEAMAN
“We sell dreams and install nightmares”…BMS SUPPLIER
? !
19
f
all important and worthwhile processes … but how about turning off the
perimeter lights in sunshine? >>>
20
Don’t add “green bling” unless you’ve got the fundamentals right
Prevention is better than cure
21
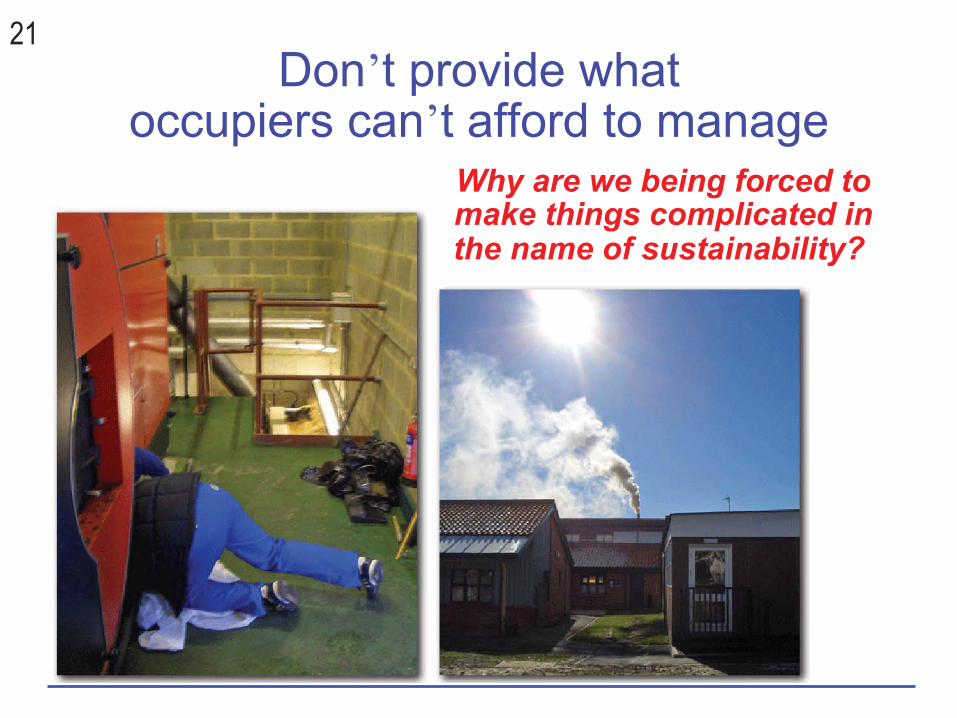
Don’t provide what occupiers can’t afford to manage
Why are we being forced to make things complicated in the name of sustainability?
22
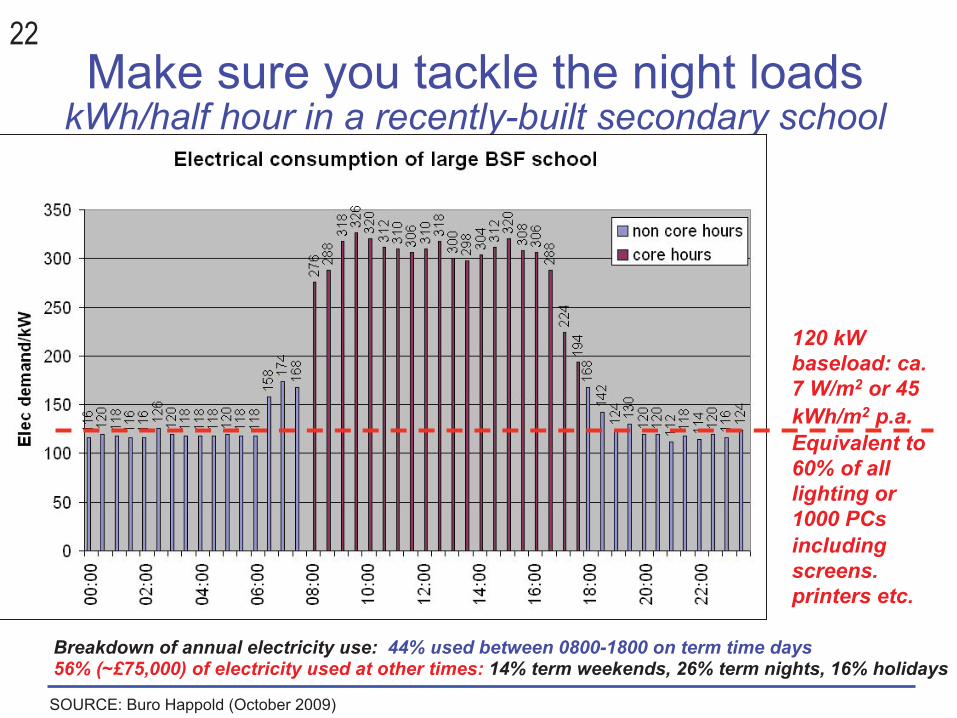
Make sure you tackle the night loads kWh/half hour in a recently-built secondary school
SOURCE: Buro Happold (October 2009)
Breakdown of annual electricity use: 44% used between 0800-1800 on term time days 56% (~£75,000) of electricity used at other times: 14% term weekends, 26% term nights, 16% holidays
120 kW baseload: ca. 7 W/m2 or 45 kWh/m2 p.a. Equivalent to 60% of all lighting or 1000 PCs including screens. printers etc.
23
3
GETTING REAL: IMPROVING COMMUNICATION
OF BUILDING ENERGY AND CARBON PERFORMANCE
24
We need a strong focus on in-use performance, with transparent communication
We need proper resources to pull together procedures and provide good quality information and publications.
ACTIVITY TECHNICAL ROUTE REPORTING ROUTEDesign and building team: Architect, design and building team, client:
Briefing, designand alteration
1. BRIEFING DESIGN & MODEL DATAthat counts everything, not just
regulated loads (e.g. CIBSE TM 22)
2. CLEAR SIMPLE OUTPUTSto communicate with client, within team and
to others, e.g. for regulatory purposesServices engineer: EPC statutory compliance, DEC general information
Completion and commissioning
3. BUILDING LOG BOOK (TM 31+O&Ms)consistent reporting: services, energy use details (TM 22), metering (TM39)
4. ENERGY PERFORMANCE CERTIFICATE(first in draft, finalised at completion) andEstimated draft Display Energy Certificate
Handover Facilities manager: Supply utility: electricity, gas, district heat/cool/CHP:6. ENERGY DATA FROM METERS AND
FUEL SUPPLIERS including demand profiles Landlord or agent multi-tenant buildings
7. LANDLORD'S ENERGY STATEMENTSProperty manager: DEC compliance or voluntary disclosure
TRA
NS
PAR
EN
T TE
CH
NIC
AL
CO
MM
UN
ICA
TIO
N
8. ENERGY and TECHNICALDATA MANAGEMENT
in house and/or outsourced
9. DISPLAY ENERGY CERTIFICATES, ideally with energy data updated automatically, as
happens for government buildings in California
BU
ILD
ING
IN U
SE
Technical dataand portfolio management
Operation andfine tuning
5. BUILDING LOG BOOK(TM 31)(in use, with O&Ms and asset register) electronic, with annual updates of energy, usage and services data
BU
ILD
and
ALT
ER
25
Carbon Buzz is helping to do this but we also need consistent underpinnings that can bring
together statutory, professional and industry measures
26
A independent Technical Platform could help to support many interests, e.g.
Supply side Influencers
Demand side
Property industry Government Building occupiers
Building industry Government agencies
Building managers
Developer clients Government clients End-use clients
Building professions (as businesses)
Building professions (ideally)
Agents, advisers and consultants
Product and equipment suppliers for buildings
Voluntary bodies and independent advisers
Product and equipment suppliers for occupiers
Energy suppliers Teaching and research Energy support services
INDEPENDENT PUBLIC INTEREST PLATFORM
27
4
GETTING REAL: IMPROVING PROCUREMENT
28
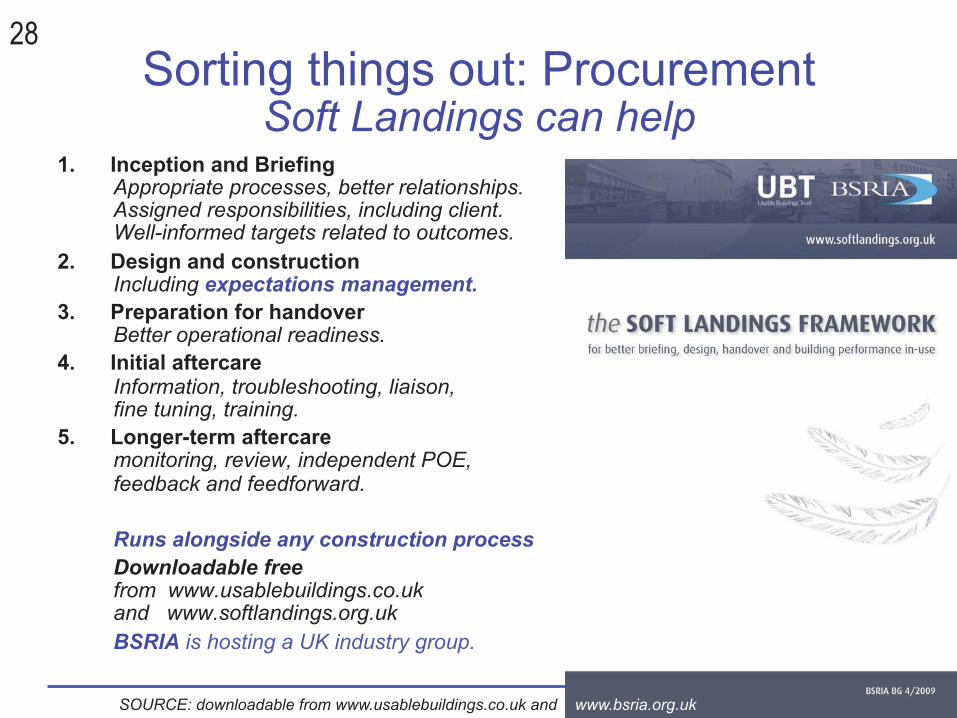
Sorting things out: Procurement Soft Landings can help
1. Inception and Briefing Appropriate processes, better relationships. Assigned responsibilities, including client. Well-informed targets related to outcomes.
2. Design and construction Including expectations management.
3. Preparation for handover Better operational readiness.
4. Initial aftercare Information, troubleshooting, liaison, fine tuning, training.
5. Longer-term aftercare monitoring, review, independent POE, feedback and feedforward.
Runs alongside any construction process Downloadable free from www.usablebuildings.co.uk and www.softlandings.org.uk BSRIA is hosting a UK industry group.
SOURCE: downloadable from www.usablebuildings.co.uk and www.bsria.org.uk
29
Soft Landings and the performance gap • STAGE 1
Better briefing and initial estimation. • STAGE 2
Expectations management and reality-checks during design and construction. Needs a champion to progress.
• STAGE 3 More thorough preparation for handover, with better commissioning, more dialogue with users and operators.
• STAGE 4 Follow-through and tuning-up after practical completion.
• STAGE 5 Longer term monitoring, review and feedback.
30
CIBSE TM22 provides a way to keep tabs Actual versus predicted in a low-energy office design
The process is described in CIBSE TM22: Energy Assessment and Reporting Method, London: CIBSE (1999 and 2006)
31
Why buildings need tuning up: Chilled water 2012 vs 2011 in a new building
SOURCE: Current project on a university teaching/office building completed in 2010. Unpublished.
32
Why buildings need tuning up: Continuous commissioning in a government office
Source: EMOTR project by ABS at St Philips Place, Birmingham.
33
Visible performance can mobilise management without spending vast amounts of money
2009 2012
Source: work by Bordass Associates, Power Efficiency, and ABS Consultancy for Climate Change Capital (landlord) and DCLG
34
But some buildings just can’t be tuned: the fabric, systems and controls aren’t up to it
SOURCE: Ecolibrium, the Journal of the Australian Institute of Refrigeration, AC and Heating, 24-32 (February 2009)
35
We need to save real energy and carbon not virtual energy and carbon! NATURE CAN’T BE FOOLED … Richard Feynman