Perception & Psychophysics 1986, 40 (5), 331-343 Timecourse of coactivation in bimodal divided attention JEFF MILLER University of California, San Diego, California Reaction time distributions were obtained from practiced subjects in a go/no-go detection task with attention divided across the visual and auditory modalities. Redundant signals were some- times presented asynchronously on the two modalities, with the time between signals varying from 0 to 167 msec. An extension of the inequality derived by Miller (1982) was used to test be- tween separate-decisions models, in which the response is initiated solely by whichever signal is detected first, and coactivation models, in which both signals contribute to the activation of a single response. As in previous studies with bimodal detection tasks, the results contradicted separate-decisions models and favored coactivation models. The largest violations of separate- decisions models were observed when the visual signal was presented 67-100 msec before the auditory signal. A new inequality was also derived to discriminate between two classes of coacti- vation models that differ about whether responses are generated by processes combining activa- tion across time as well as across signals. Violations of this inequality ruled out exponential coac- tivation models, in which activation processes are sensitive only to the instantaneous properties of the signalfs), Instead, the results require an accumulation model of coactivation, in which both signals provide input to a process that accumulates activation over a considerable period oftime, even if signal conditions change during that time. In divided-attention tasks, people are often asked to monitor two different information channels and make a speeded response as soon as a signal is presented on either channel. To understand the division of attention, it is par- ticularly important to determine what happens when sub- jects must process two signals presented simultaneously on different channels. Intuitively, it seems that the con- sequences of dividing attention should be most pronounced when both channels require action at the same time, so the characteristics of the underlying division should be particularly apparent under such circumstances. Empirically, it is almost always the case that a response is made faster when it is indicated by two simultaneously presented signals, one on each channel, than when a sin- gle signal is presented on either channel alone (e.g., Raab, 1962). This paper is concerned with the explanation of this advantage, often called the redundant signals effect (RSE), in bimodal detection tasks with visual and audi- tory signals. The RSE has consistently been obtained in such tasks (e.g.; Miller, 1982), but explanations of the effect vary widely. The simplest explanation of the RSE is embodied in a class of models commonly called separate-decisions or This research was supported by Grant PHS MH40733 from the Na- tionallnstitute of Mental Health. I would like to thank G. R. Grice, Rolf Ulrich, Patricia Haden, and two anonymous reviewers for helpful comments on earlier versions of the paper, and the two volunteer sub- jects for their assistance in collecting the data. A preliminary report of this research was presented at a symposium entitled "Action, Atten- tion and Automaticity, " held at the Center for Interdisciplinary Research, Bielefeld, Germany, in December 1984. Requests for reprints should be addressed to the author at Department of Psychology, C.{)(J9, UCSD, La Jolla, CA 92093. race models (Raab, 1962). In these models, separate processes respond to signals on different channels. When one signal is presented, the response is activated solely by the process that monitors that signal's channel. The process associated with each channel is stochastic, so the response time (RT) to a given signal varies randomly from trial to trial. When both signals are presented simulta- neously, each process proceeds as if only its own signal had been presented. If the two processes compete for resources (e.g., attention), their finishing times may be negatively correlated; if they are influenced in the same way by an internal state (e.g., alertness), their finishing times may be positively correlated; or, of course, the finishing times may be independent. In any case, the response is caused by the first of the two separate processes to finish (hence the name "race models"). As- suming that there is some overlap in the distributions of the finishing times for the two response-activation processes so that each wins the race on some of the trials with redundant signals, responses to redundant signals will be faster, on average, than responses to either of the sig- nals presented alone. In this model, the RSE reflects facili- tation of a purely statistical variety (Raab, 1962), since the process that activates any given response is influenced by the presence of only one of the two signals. Models that embody the assumption of separate deci- sions are plausible candidates to explain the RSE, because they have had considerable success in predicting detec- tion accuracy in bimodal divided attention tasks (e.g., Cor- coran & Weening, 1969; Mulligan & Shaw, 1980; Shaw, 1982). A variety of evidence contradicts these models, however, by showing interactions among stimuli on differ- 331 Copyright 1986 Psychonomic Society, Inc.
Transcript
Perception & Psychophysics1986, 40 (5), 331-343
Timecourse of coactivation inbimodal divided attention
JEFF MILLERUniversity of California, San Diego, California
Reaction time distributions were obtained from practiced subjects in a go/no-go detection taskwith attention divided across the visual and auditory modalities. Redundant signals were sometimes presented asynchronously on the two modalities, with the time between signals varyingfrom 0 to 167 msec. An extension of the inequality derived by Miller (1982) was used to test between separate-decisions models, in which the response is initiated solely by whichever signalis detected first, and coactivation models, in which both signals contribute to the activation ofa single response. As in previous studies with bimodal detection tasks, the results contradictedseparate-decisions models and favored coactivation models. The largest violations of separatedecisions models were observed when the visual signal was presented 67-100 msec before theauditory signal. A new inequality was also derived to discriminate between two classes of coactivation models that differ about whether responses are generated by processes combining activation across time as well as across signals. Violations of this inequality ruled out exponential coactivation models, in which activation processes are sensitive only to the instantaneous propertiesof the signalfs), Instead, the results require an accumulation model of coactivation, in which bothsignals provide input to a process that accumulates activation over a considerable period oftime,even if signal conditions change during that time.
In divided-attention tasks, people are often asked tomonitor two different information channels and make aspeeded response as soon as a signal is presented on eitherchannel. To understand the division of attention, it is particularly important to determine what happens when subjects must process two signals presented simultaneouslyon different channels. Intuitively, it seems that the consequences ofdividing attention should bemost pronouncedwhen both channels require action at the same time, sothe characteristics of the underlying division should beparticularly apparent under such circumstances.
Empirically, it is almost always the case that a responseis made faster when it is indicated by two simultaneouslypresented signals, one on each channel, than when a single signal is presented on either channel alone (e.g., Raab,1962). This paper is concerned with the explanation ofthis advantage, often called the redundant signals effect(RSE), in bimodal detection tasks with visual and auditory signals. The RSE has consistently been obtained insuch tasks (e.g.; Miller, 1982), but explanations of theeffect vary widely.
The simplest explanation of the RSE is embodied in aclass of models commonly called separate-decisions or
This research was supported by Grant PHS MH40733 from the Nationallnstitute of Mental Health. I would like to thank G. R. Grice,Rolf Ulrich, Patricia Haden, and two anonymous reviewers for helpfulcomments on earlier versions of the paper, and the two volunteer subjects for their assistance in collecting the data. A preliminary report ofthis research was presented at a symposium entitled "Action, Attention and Automaticity, " held at the Center for Interdisciplinary Research,Bielefeld, Germany, in December 1984. Requests for reprints shouldbe addressed to the author at Department of Psychology, C.{)(J9, UCSD,La Jolla, CA 92093.
race models (Raab, 1962). In these models, separateprocesses respond to signals on different channels. Whenone signal is presented, the response is activated solelyby the process that monitors that signal's channel. Theprocess associated with each channel is stochastic, so theresponse time (RT) to a given signal varies randomly fromtrial to trial. When both signals are presented simultaneously, each process proceeds as if only its own signalhad been presented. If the two processes compete forresources (e.g., attention), their finishing times may benegatively correlated; if they are influenced in the sameway by an internal state (e.g., alertness), their finishingtimes may be positively correlated; or, of course, thefinishing times may be independent. In any case, theresponse is caused by the first of the two separateprocesses to finish (hence the name "race models"). Assuming that there is some overlap in the distributions ofthe finishing times for the two response-activationprocesses so that each wins the race on some of the trialswith redundant signals, responses to redundant signals willbe faster, on average, than responses to either of the signals presented alone. In this model, the RSE reflects facilitation of a purely statistical variety (Raab, 1962), sincethe process that activates any given response is influencedby the presence of only one of the two signals.
Models that embody the assumption of separate decisions are plausible candidates to explain the RSE, becausethey have had considerable success in predicting detection accuracy in bimodal divided attention tasks (e.g., Corcoran & Weening, 1969; Mulligan & Shaw, 1980; Shaw,1982). A variety of evidence contradicts these models,however, by showing interactions among stimuli on differ-
331 Copyright 1986 Psychonomic Society, Inc.
332 MILLER
ent sensory channels (e.g., Bernstein, 1970; Colavita,1974; Gielen, Schmidt, & Van den Heuvel, 1983; Long,1976; Nickerson, 1973). This paper focuses on one particular source of evidence against these models, obtainedby examining RT distributions within bimodal dividedattention tasks.
Miller (1982) noted that all race models must make anexplicit prediction regarding the distributions of RTs thatshould be observed in response to redundant signals. LetRTy, RTA , and RTRbe random variables correspondingto the RTs observed on trials with visual signals, auditory signals, and redundant signals, respectively. RTy andRTA might have any bivariate probability distribution, but,according to race models, RTRis constrained by the relation:
RTR = min(RT y, RTA ) .
This relation follows directly from the assumption thatthe response on a redundant-signals trial is determinedby whichever of the separate processes finishes first.Given this constraint, it is easy to prove (see Miller, 1982)that the following inequality must be satisfied by Fy(t),FA(t), and FR(t), the cumulative probability density functions (CDFs) of RTs in the three conditions:
FR(t) ~ Fv(t) + FA(t) for all t. (1)
That is, for any time, t, the proportion of redundant-signalresponses faster than t should be less than or equal to thesum of the proportion of visual-signal responses faster thant and the proportion of auditory-signal responses fasterthan t.
Miller (1982) tested and found violations of Inequality 1 in a bimodal detection task with easily detectablevisual and/or auditory stimuli. Subjects were required topress a response key as quickly as possible on trials witheither the visual signal or the auditory signal, or with both,and to withhold the response on trials without any signal.The observed RTs on trials with visual signals, auditorysignals, and redundant signals were used to estimate therespective CDFs Fy(t), FA(t), and FR(t), and the estimatedvalues significantly violated Inequality 1. In particular,the inequality was violated for relatively small values oft, suggesting that there were more fast responses to redundant signals than could be explained in terms of a racebetween separate responses to visual and auditory signals.Thus, race models cannot account for the RSE.
The observed violations ofInequality 1 support modelsin which the RSE reflects more than just statistical facilitation of average RT. In these models, simultaneous signals on different channels activate the response jointlyrather than separately, so the system must combine response activations contributed by processes that monitordifferent channels. Such models have been referred to ascoactivation models (e.g., Grice, Canham, & Boroughs,1984; Miller, 1982).
The experiment reported in this paper was designed tostudy the timecourse of response coactivation in bimodaldetection tasks. Redundant visual and auditory signals
were presented with signal onset asynchronies (SOAs) upto 167 msec, and the resulting data were used to addresstwo major issues about the timecourse of response coactivation.
One issue was whether RTs to asynchronous redundantsignals would reveal violations of race models analogousto those observed with simultaneous redundant signals,and, if they did, how the size of the violations would depend on SOA. 1 To evaluate race models with asynchronous signals, Inequality 1 must be generalizedslightly. According to race models, a response to redundant signals is caused by the first to finish of the twoseparate processes responding to each signal. Obviously,the two processes will not start at the same time if signalpresentation is asynchronous, and finishing times mustbe adjusted to take that fact into account. If RT is measured from the onset of the first signal, the SOA betweensignals must be added to the latency of responses to thesecond signal. Let SOAy and SOAA denote the SOAs fromthe onset of the first signal to the onset of the visual andauditory signals, respectively. This notation is very convenient when measuring RT from the onset of the firstsignal, although it is admittedly peculiar in that one ofthe two SOAs must equal zero on any trial (i.e., the SOAfor the first signal). Given this notation, the race modelasserts that:
RTR,sOA = min(RT y+SOAy, RTA + SOAA) ,
where RTR,sOA is the obtained RT on a redundant signalstrial with the indicated SOA, and RTy and RTA are stillthe finishing times for the separate processes respondingto visual and auditory signals. The addition of the SOAis the appropriate correction for asynchronous signals; ifthe start of one racer is delayed by an amount SOA, thatracer's completion time will increase by the same amount.This constraint imposed by race models is exactly analogous to the one with simultaneous redundant signals, andan inequality analogous to Inequality 1 follows immediately:
FR,sOA(t) ~ Fy(t-SOAy)+FAt-SOAA) for all t. (2)
Thus, one purpose of the present research was to seewhether Inequality 2 was violated-and race models further contradicted-with asynchronous redundant signals.
The second issue addressed by the present research involved a comparison between two classes ofcoactivationmodels using a new inequality related to Inequalities 1and 2. Although those inequalities can be used to seewhether response processes combine activation across signals, the second main objective of this study was to investigate the question of whether response processes couldcombine activation across time. Two classes of coactivation models were considered-referred to here as "accumulation" and "exponential" models-both of themgeneralizations of standard RT models developed for taskswith single stimuli and no attentional manipulations. Bothclasses of models are consistent with violations of Inequality 1, but only the former allows for a combination
of activation across time. In brief, accumulation modelsassume that coactivation occurs in a process that buildsup response activation gradually over time, whereas exponential models assume that coactivation occurs in aprocess that changes states in an instantaneous, all-or-nonefashion to generate a response.
Accumulation models are based on a mechanism thatsums small activations gradually over time, stopping whena criterion is reached. This class of coactivation modelsis a natural extension of RT models-often based onstatistical decision theory (e.g., Audley, 1973)-in whicha decision process accumulates evidence that a signal hasbeen presented (i.e., "response activation"), emitting theresponse when the amount of activation reaches a certaincriterion level (e.g., Green & Smith, 1982; Link, 1975).To account for divided-attention tasks, accumulationmodels can be generalized to allow activation from morethan one channel to contribute to the process accumulating activation. Such a model can easily explain the RSE,because summing of activations produced by two signalson different channels would allow the stopping criterionto be satisfied before either signal had produced enoughactivation to satisfy the criterion by itself. In essence, theinequality predicted by race models is violated becauseof a change in the rule for stopping the race. In an accumulation model the race stops when the total distancecovered by the two runners is equal to the criterion distance, whereas in a race model it stops as soon as oneof the runners covers the criterion distance. 2
In coactivation models of the exponential class, redundant signals combine in their influence on the instantaneous state of the process generating the response, butthere is no accumulation of activation or evidence overtime. This class of coactivation models is an extensionof RT models with exponentially distributed decision times(e.g., Ashby, 1982; Ashby & Townsend, 1980; Christie& Luce, 1956; Green & Smith, 1982; Hockley, 1984;Hohle, 1965; Luce & Green, 1970; Ratcliff, 1978; Ratcliff & Murdock, 1976; Townsend & Ashby, 1983), because in these models the decision to respond is made bya mechanism that has a constant instantaneous probability (i.e., rate) of terminating at each moment after it begins (see McGill, 1963). It is usually assumed that totalRT is the sum of an exponentially distributed decisionmaking time and a normally distributed residual time thatreflects sensory and motor processes.
To extend exponential models to divided attention tasks,one can allow the rate of the decision process to dependon the signal configuration, with one rate for a visual signal, a second rate for an auditory signal, and a third ratefor redundant signals. More specific exponential modelscould attempt to specify the rate for redundant signals asa function of the rates for the two individual signals. Ingeneral, though, exponential models are consistent withthe RSE as long as the rate for redundant signals is higherthan the rate for either of the individual signals. Furthermore, they are consistent with violations of Inequality 1
TIMECOURSE OF COACTIVATION 333
if the rate for redundant signals is sufficiently greater thanthe sum of the rates for the two individual signals.
To sharpen the contrast between accumulation and exponential models and hint at a way of deciding betweenthem, note that an exponential process can be consideredhistory-free, because the probability of finishing in thenext instant of time does not depend on how long theprocess has been active (i.e., its history). Accumulationmodels, on the other hand, are history-dependent in thesense that the probability of finishing in the next instantincreases with the time since the process began.
The SOA manipulation can be used to discriminate between accumulation and exponential models by revealing whether responses are jointly activated by both thesingle signal present initially and the redundant signalspresent after the end of the SOA. Such an effect is required by history-dependent accumulation models, but isinconsistent with history-free exponential models. According to accumulation models, the first signal must start contributing increments of activation that move the accumulator some of the way toward the criterion. Once thesecond signal is presented, both signals contribute additional increments toward the criterion. This means thatthe criterion is satisfied partly by activation from the firstsignal alone and partly by activation from the two signalsacting together. In the present analysis, the incrementsprovided by the first signal can be regarded as the history of the accumulation process, and the amount of activation that must be accumulated from the two signals acting together (i.e., starting at the end of the SOA) isinfluenced by this history.
In contrast, exponential models require the response tobe produced entirely by one of the instantaneous statesof the system. This could be the state produced by thefirst signal, present until the end of the SOA, or the stateproduced by the redundant signals, present after the endof the SOA. Since there is no accumulation across timein history-free exponential models, however, the responsecannot be influenced both by the presence of the first signal and by the presence of the redundant signals.
In essence, then, the distinction between accumulationand exponential models is that the former allow theresponse to be influenced by two different signal configurations that occur sequentially on a single trial, whereasthe latter allow the response to be influenced by only oneof them.? This distinction in the time domain is analogous to the distinction in the signal domain between racemodels and coactivation models: coactivation models allow combination of activation across signals, whereas racemodels do not; analogously, accumulation models allowcombination ofactivation across time, whereas exponential models do not. This analogy suggests that exponential models must make a prediction similar to Inequalities 1 and 2.
Consider a trial on which a visual signal is presentedfirst and an auditory signal is presented after some nonzero SOAA. According to exponential models, a response
334 MILLER
observed on this trial will have been activated either bythe visual signal present before the end of the SOAA orby the redundant signals present after the end of the SOAA,but not by both." This situation is almost analogous to arace between two response processes, with the processresponding to the visual signal getting a head start equalto the SOAA' If the race analogy held exactly, then exponential models would assert that
RTR,sOA = min(RTv, RTR,o+SOAA),
where RTR,o is the RT to simultaneous redundant signals.The race analogy does not hold exactly, however, since
the racer for the visual signal is replacedby the racer forthe redundant signal if the former has not finished whenthe redundant signal starts. Forcing the visual racer to dropout when the redundant racer starts can only slow downthe winning time, relative to what would be observed ifthe visual racer continued in the race. Thus, exponentialmodels actually assert that
RTR,sOA ~ min(RTv , RTR,o+SOAA).
This constraint leads immediately to Inequality 3, bydirect analogy to Inequalities 1 and 2:
FR,sOA(t) :s Fv(t) + FR,o(t-SOAA) for all t. (3)
The interpretation of Inequality 3 is that the responseon a trial with a visual signal followed after SOAA msecby an auditory one should take long enough for it to beattributable either to the visual signal state present at thestart of the trial or to the redundant signal state appearing SOAA msec later. An analogous inequality can be constructed for trials on which the auditory signal is presentedfirst.
To summarize, the second purpose of this experimentwas to obtain data that could be used to test Inequality 3.This inequality can be used to test exponential coactivation models, all of which assert that it should be satisfied. Because it is an inequality, the test is rather conservative; however, if any data are found to be inconsistentwith the inequality, the entire class of models can be rejected.
METHOD
The apparatus and signals were the same as those used by Miller(1982, Experiments 1 and 2): visual signals were responseterminated plus signs appearing in the center of a computer display screen, and auditory signals were 780-Hz tones of 150-msecduration. Responses were made by pressing the / (slash) key onthe computer keyboard with the right index finger. Two naive volunteer subjects, a 35-year-old male (B.D.) and a 21-year-old female(K.Y.), were tested over a period of about 1 month. Both were righthanded. Each was tested in 4O-min sessions during which two blockswere completed, with one session per day and four to six sessionsper week. Subject B.D. eventually completed 42 blocks, and Subject K.Y. completed 43. Only the last 40 blocks completed by eachsubject were included in the analysis.
Each bimodal detection trial began when the subject pressed akey to indicate readiness. Then a fixation point was presented for250 msec and there was a random foreperiod lasting from 250 to
2,250 msec (uniformly distributed). At that point, the first signalwas presented, and after an appropriate SOA, the second signal (ifany) was presented unless the subject had already responded. Oncatch trials, there was a 2-sec blank interval at the end of the random foreperiod, during which false alarms were recorded. No feedback was given after responses. After each response there was anenforced delay of 500 msec, after which the subject was given theopportunity to initiate the next trial by pressing a key. Any trialon which an error (false alarm or miss) occurred was rerun laterin the block.
Each block started with 4 warm-up trials, followed by 170 testtrials. There were 40 catch trials, on which no signal was presentedand no response was to be made, and 130 signal trials. The latter130 trials were equally divided among 13 conditions: (1) visual signal alone, (2) auditory signal alone, (3) both signals simultaneously,(4-8) visual signal presented first, then auditory signal presented33,67, 100, 133, or 167 rnsec later (SOAA), and (9-13) auditorysignal presented first, then visual signal presented 33, 67,100,133,or 167 rnsec later (SOA v) . The subjects were instructed to respondas quickly as possible if either the visual or auditory signal waspresented, or both, but to withhold the response if no signal waspresented.
RESULTS AND DISCUSSION
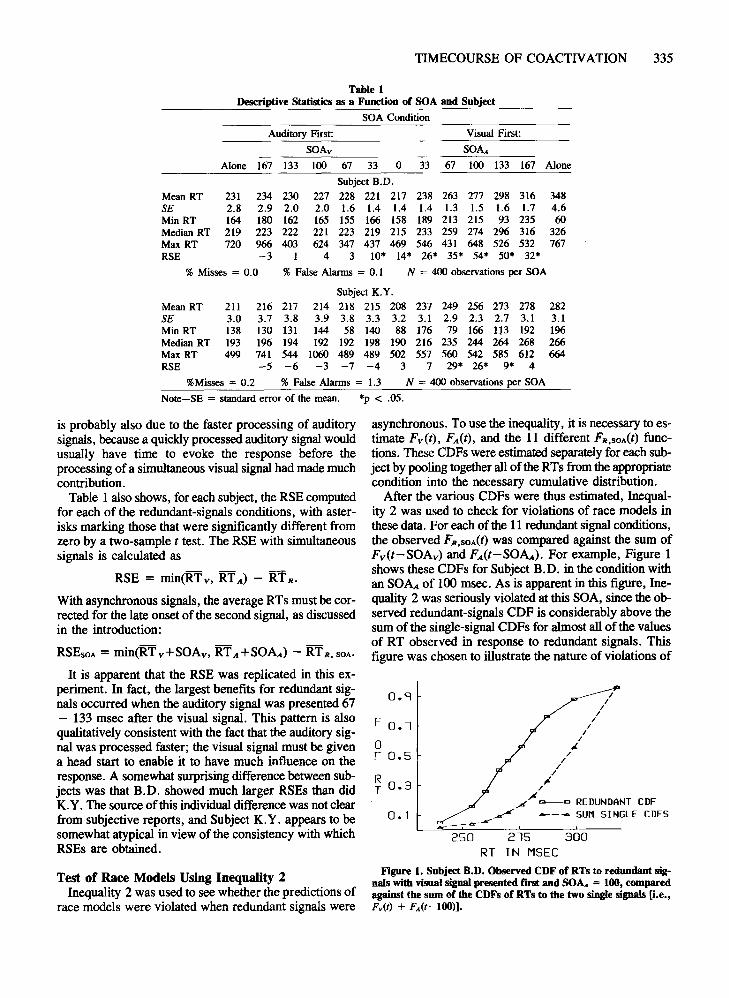
Before proceeding with the analysis of models usingInequalities 2 and 3, it is worthwhile to examine severalfeatures of the basic results. Table 1 shows descriptivestatistics for RT as a function of SOA, with SOAs orderedsymmetrically around the condition of simultaneous signals. One of the most clear-cut results was that responsesto single auditory signals were much faster than those tosingle visual signals [B.D., t(798) = 21,p < .01; K.Y.,t(798) = 16.2, P < .01]. Faster responding to auditorysignals also appears to have influenced the results obtainedwith redundant signals in three respects. First, there wasvery little effect of a redundant visual signal presentedafter the auditory signal, since responses to an auditorysignal presented alone were as fast as responses to an auditory signal followed by a visual signal in all but onecomparison [B.D., SOA v = 33, t(798) = 3.27,p < .01].This probably results from faster responding to auditorythan to visual signals, because delaying the more slowlyprocessed visual signal would make it arrive too late tohave any impact on the response to the more quicklyprocessed auditory signal.
Second, auditory signals influenced responses evenwhen they were presented long after visual signals. MeanRT increased systematically with SOAA, the time fromthe visual to the auditory signal. For Subject B.D.,responses were faster when the auditory signal waspresented 167 msec after the visual signal than when thevisual signal was presented alone, a particularly surprising result because of the speed of responses in a simpleRT task. This effect is probably also related to the singlesignal advantage for auditory signals, since a more quicklyprocessed auditory signal could often overtake a moreslowly processed visual one, even when the latter had ahead start.
Third, a relatively small RSE was obtained when visualand auditory signals were presented simultaneously. This
TIMECOURSE OF COACTIVATION 335
Table 1Descriptive Statistics as a Function of SOA and Subject
%Misses = 0.2 % False Alarms = 1.3 N = 400 observations per SOA
Note-SE = standard error of the mean. *p < .05.
250 215 300RT IN MSEC
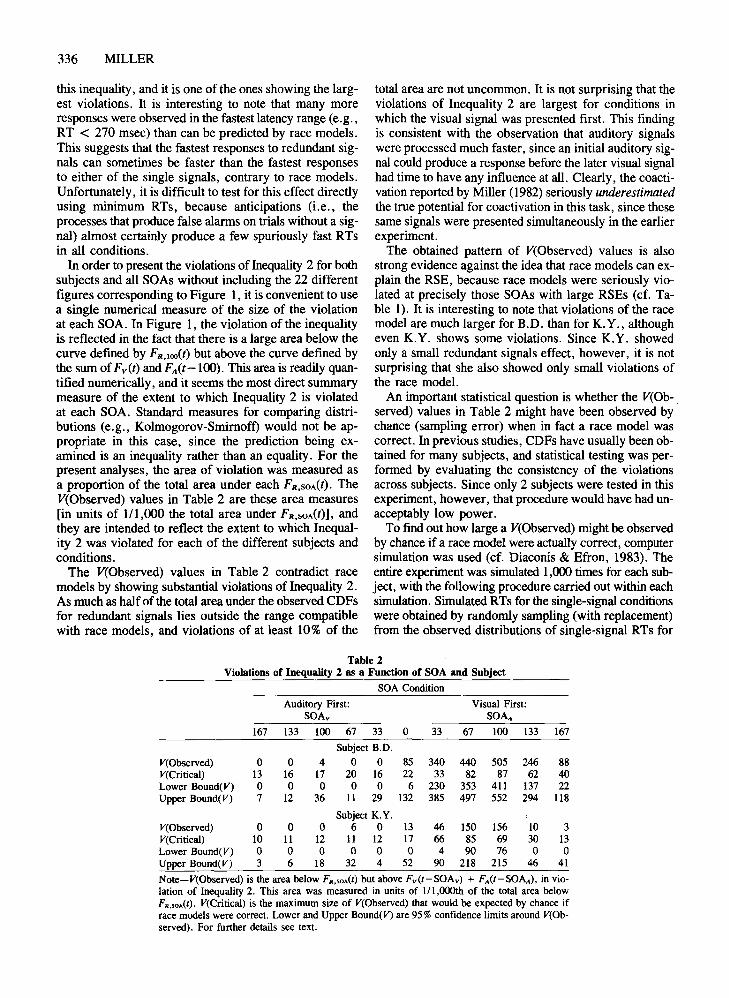
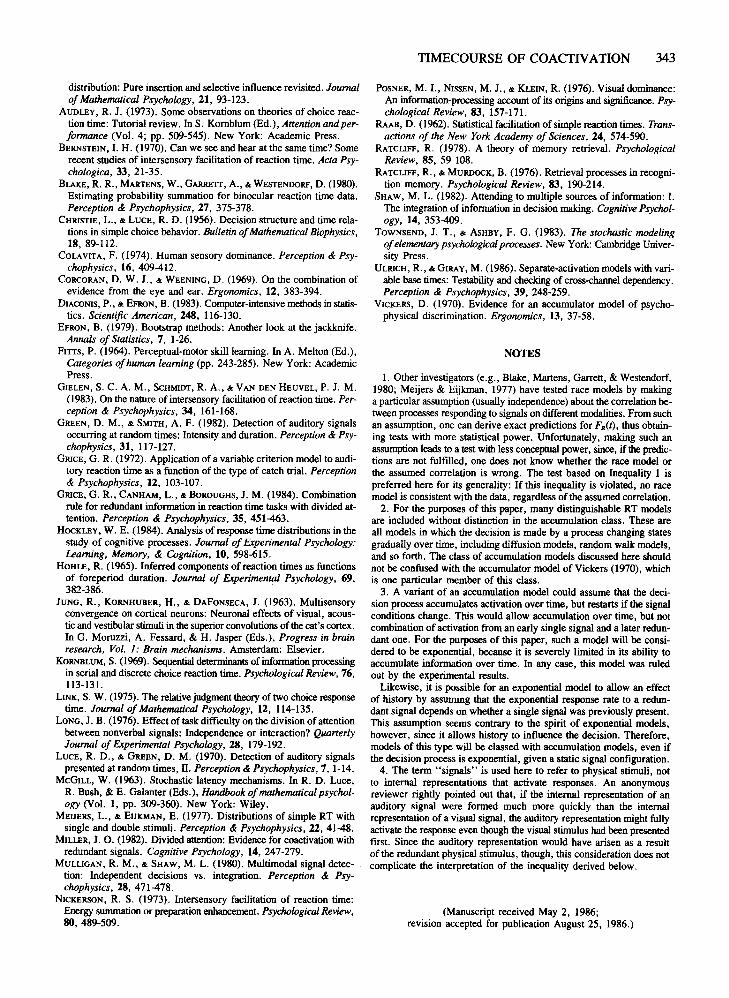
Figure 1. Subject B.D. Observed CDF of RTs to redundant signals with visual signal presented f'1l"St and SOA.. = 100, comparedagainst the sum of the CDFs of RTs to the two single signals [i.e.,Fv(t) + F..(t-lOO»).
asynchronous. To use the inequality, it is necessary to estimate Fv(t), FA(t), and the 11 different FR.SOA(t) functions. These CDFs were estimated separately for each subject by pooling together all of the RTs from the appropriatecondition into the necessary cumulative distribution.
After the various CDFs were thus estimated, Inequality 2 was used to check for violations of race models inthese data. For each of the 11 redundant signal conditions,the observed FR.SOA(t) was compared against the sum ofFv(t-SOAv) and FA(t-SOAA). For example, Figure 1shows these CDFs for Subject B.D. in the condition withan SOAA of 100 msec. As is apparent in this figure, Inequality 2 was seriously violated at this SOA, since the observed redundant-signals CDF is considerably above thesum of the single-signal CDFs for almost all of the valuesof RT observed in response to redundant signals. Thisfigure was chosen to illustrate the nature of violations of
is probably also due to the faster processing of auditorysignals, because a quickly processed auditory signal wouldusually have time to evoke the response before theprocessing of a simultaneous visual signal had made muchcontribution.
Table 1 also shows, for each subject, the RSE computedfor each of the redundant-signals conditions, with asterisks marking those that were significantly different fromzero by a two-sample t test. The RSE with simultaneoussignals is calculated as
RSE = min(RT v, RT A) - RT R.
With asynchronous signals, the average RTs must becorrected for the late onset of the second signal, as discussedin the introduction:
RSEsOA= min(RT v+ SOAv, RTA+SOAA) - RT R. SOA.
It is apparent that the RSE was replicated in this experiment. In fact, the largest benefits for redundant signals occurred when the auditory signal was presented 67- 133 msec after the visual signal. This pattern is alsoqualitatively consistent with the fact that the auditory signal was processed faster; the visual signal must be givena head start to enable it to have much influence on theresponse. A somewhat surprising difference between subjects was that B.D. showed much larger RSEs than didK.Y. The source of thisindividual difference was not clearfrom subjective reports, and Subject K.Y. appears to besomewhat atypical in view of the consistency with whichRSEs are obtained.
Test of Race Models Using Inequality 2Inequality 2 was used to see whether the predictions of
race models were violated when redundant signals were
0.9
F O.l
oF 0.5
RT 0.3
0.1
//
//
//
//
~/
//
/
"/
--«""~ REDUNDANT CDF~ .-..- .... SUM SINGLE CDFS
~--~~
336 MILLER
this inequality, and it is one of the ones showing the largest violations. It is interesting to note that many moreresponses were observed in the fastest latency range (e.g.,RT < 270 msec) than can be predicted by race models.This suggests that the fastest responses to redundant signals can sometimes be faster than the fastest responsesto either of the single signals, contrary to race models.Unfortunately, it is difficult to test for this effect directlyusing minimum RTs, because anticipations (i.e., theprocesses that produce false alarms on trials without a signal) almost certainly produce a few spuriously fast RTsin all conditions.
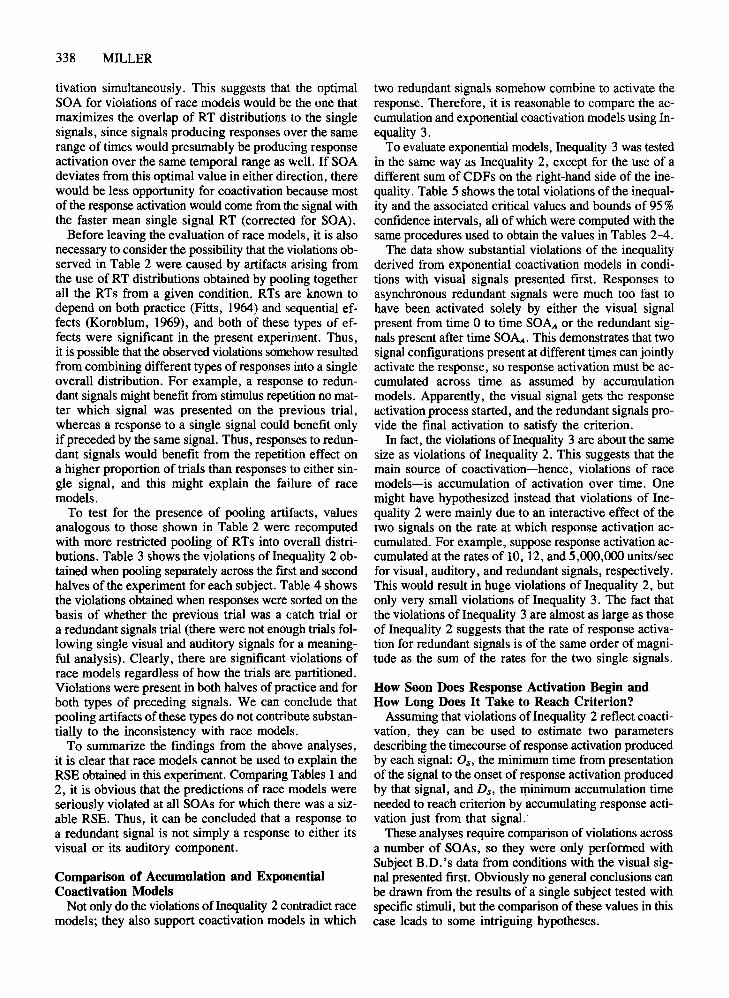
In order to present the violations of Inequality 2 for bothsubjects and all SOAs without including the 22 differentfigures corresponding to Figure 1, it is convenient to usea single numerical measure of the size of the violationat each SOA. In Figure 1, the violation of the inequalityis reflected in the fact that there is a large area below thecurve defined by FR,IOO(t) but above the curve defined bythe sum of Fv(t) and FA(t-100). This area is readily quantified numerically, and it seems the most direct summarymeasure of the extent to which Inequality 2 is violatedat each SOA. Standard measures for comparing distributions (e.g., Kolmogorov-Smirnoft) would not be appropriate in this case, since the prediction being examined is an inequality rather than an equality. For thepresent analyses, the area of violation was measured asa proportion of the total area under each FR,sOA(t). TheV(Observed) values in Table 2 are these area measures[in units of 1/1,000 the total area under FR,sOA(t)], andthey are intended to reflect the extent to which Inequality 2 was violated for each of the different subjects andconditions.
The V(Observed) values in Table 2 contradict racemodels by showing substantial violations of Inequality 2.As much as half of the total area under the observed CDFsfor redundant signals lies outside the range compatiblewith race models, and violations of at least 10% of the
total area are not uncommon. It is not surprising that theviolations of Inequality 2 are largest for conditions inwhich the visual signal was presented first. This findingis consistent with the observation that auditory signalswere processed much faster, since an initial auditory signal could produce a response before the later visual signalhad time to have any influence at all. Clearly, the coactivation reported by Miller (1982) seriously underestimatedthe true potential for coactivation in this task, since thesesame signals were presented simultaneously in the earlierexperiment.
The obtained pattern of V(Observed) values is alsostrong evidence against the idea that race models can explain the RSE, because race models were seriously violated at precisely those SOAs with large RSEs (cf. Table 1). It is interesting to note that violations of the racemodel are much larger for B.D. than for K. Y., althougheven K.Y. shows some violations. Since K.Y. showedonly a small redundant signals effect, however, it is notsurprising that she also showed only small violations ofthe race model.
An important statistical question is whether the V(Observed) values in Table 2 might have been observed bychance (sampling error) when in fact a race model wascorrect. In previous studies, CDFs have usually been obtained for many subjects, and statistical testing was performed by evaluating the consistency of the violationsacross subjects. Since only 2 subjects were tested in thisexperiment, however, that procedure would have had unacceptably low power.
To find out how large a V(Observed) might be observedby chance if a race model were actually correct, computersimulation was used (cf. Diaconis & Efron, 1983). Theentire experiment was simulated 1,000 times for each subject, with the following procedure carried out within eachsimulation. Simulated RTs for the single-signal conditionswere obtained by randomly sampling (with replacement)from the observed distributions of single-signal RTs for
Table 2Violations of Inequality 2 as a Function of SOA and Subject
Note-V(Observed) is the area below FR,SOA(t) but above Fv(t-SOAv) + F,,(t-SOAA), in violation of Inequality 2. This area was measured in units of 1/1,000th of the total area belowFR.SOA(t). V(Critical) is the maximum size of V(Observed) that would be expected by chance ifrace models were correct. Lower and Upper Bound(V) are 95 % confidence limits around V(Observed). For further details see text.
that subject. In accordance with race models, simulatedRTs for the redundant-signal conditions were obtained bysampling two RTs (one from each single-signal distribution), adjusting them appropriately for SOA and selecting the minimum adjusted RT. These two single-signaltimes were not sampled independently, however. As notedin Inequality 1, race models predict FR(t) to be at mostthe sum of Fv(t) and FA(t) , and this maximum is attainedonly when the times for racers on the two channels havea strong negative correlation (see Miller, 1982, p. 253;Ulrich & Giray, 1986, Table 1). Thus, sampling erroris most likely to produce violations of Inequality 2 in arace model with a strong negative correlation. To provide a conservative test, making it difficult to reject racemodels, a strong negative correlation was therefore introduced into the simulation. This was accomplished byrandomly selecting an RT from the distribution of visualsignal RTs, computing its percentile, P, and then sampling the auditory-signal RT with percentile lOO-P.Thus, relatively fast responses to visual signals werepaired with relatively slow responses to auditory signals,and vice versa, producing a strong negative correlationbetween racers. After sampling the appropriate numberof trials for each condition in the simulated experiment,the CDFs for the various conditions and the size of theviolation of Inequality 2 were computed from the simulated RTs just as they had been computed from the observed RTs.
To summarize the results of the 1,000 simulated experiments, a critical violation, V(Critical), was obtainedfor each subject and condition. This value was the largest number such that, across the 1,000 simulations, violations larger than that number were obtained only 5 %of the time. This procedure provides a V(Critical) corresponding to the traditional notion of a critical value forany hypothesis-testing statistic, in the sense that an observed violation greater than the critical value will be observed by chance only 5%of the time if the null hypothesis(i.e., a race model) is correct. Thus, race models can berejected for any SOA at which V(Observed) is greater thanV(Critical), with 95% confidence that the race model isinappropriate for that subject and SOA. The summaryvalues of V(Critical) are shown in Table 2.
On the basis of the results of the computer simulations,it is clear that the observed violations of race models aremuch larger than would beexpected by chance in the conditions with visual signals preceding auditory signalsprecisely those conditions in which RSEs were obtained.Thus, race models can be confidently rejected as an explanation of the RSE with asynchronous as well as simultaneous (Miller, 1982) redundant signals.
Having ruled out race models, it is of interest to consider which SOAs produced the most coactivation (i.e.,greatest violation ofrace models). The V(Observed) valuesin Table 2 also suggest that the size of the violation variessystematically with SOAA when the visual signal ispresented first. For both subjects, total violation increaseswith SOAAS from 0 to 100 msec and then falls off for
TIMECOURSE OF COACTIVATION 337
SOAAS of 133 and 167 msec. Unfortunately, there is alsoa statistical problem with the comparison of these observedviolations: Since we do not know how far each V(Observed) might be from the true value of the violation forthat condition (due to sampling error), we do not knowhow far apart two values must be before we conclude thatthe two conditions really have significantly differentamounts of violation. To answer this question, a bootstrapping procedure (e.g., Efron, 1979) was used to compute 95 % confidence intervals for the true value of theviolation in each condition. Once these confidence intervals were obtained, conditions could be compared by seeing whether their confidence intervals overlapped.
In essence, the bootstrapping procedure takes the observed data as the underlying probability distribution, anddetermines how much variation in the computed statistic[here, V(Observed)] will be produced by random sampling from that distribution. To carry out the bootstrapping process, the experiment was again simulated 1,000times for each subject. In these simulations, the RTs foreach condition were obtained by randomly sampling (withreplacement) from the observed distribution of RTs fromthat condition. After sampling the appropriate number ofRTs from each condition, the CDFs and violations of Inequality 2 for that simulated experiment were computedwith the same procedures used to compute these statistics from the observed data. To summarize this set of1,000 simulations of the experiment, estimates of the upper and lower confidence bounds were chosen. Withina condition, the estimate of the upper bound was the sizeof violation such that only 2.5% of the simulated experiments produced violations larger than that. Similarly, theestimate of the lower bound was the size of violation suchthat only 2.5 % of the simulations produced smaller violations. Together, these two bounds define the middle 95 %of all violations that would be expected if the observeddata were, in fact, the true underlying distributions, andit is reasonable to use these values to estimate the 95 %confidence interval for the true V(Observed).
The upper and lower confidence bounds obtained bybootstrapping are also shown in Table 2. Since the confidence intervals around some of the observed violationsdo not overlap, we can conclude that some of the differences in observed violations are too large to have beenobtained by chance, and that some SOAs really producelarger violations of race models than others. It appearsthat race models are most seriously violated in the conditions with auditory signals presented 67 -100 msec aftervisual signals, for both subjects.
It is interesting to observe that the SOAs producing thelargest violations of race models are approximately thoseSOAs that equalize mean RTs to single signals (correctedfor SOA), with violations decreasing somewhat symmetrically for SOAs larger and smaller than the one yieldingthe maximum. This observation is quite consistent withcoactivation models. If signals coactivated the response,one would expect maximal coactivation to be found withan SOA for which the two signals produced response ac-
338 MILLER
tivation simultaneously. This suggests that the optimalSOA for violations of race models would be the one thatmaximizes the overlap of RT distributions to the singlesignals, since signals producing responses over the samerange of times would presumably be producing responseactivation over the same temporal range as well. If SOAdeviates from this optimal value in either direction, therewould be less opportunity for coactivation because mostof the response activation would come from the signal withthe faster mean single signal RT (corrected for SOA).
Before leaving the evaluation of race models, it is alsonecessary to consider the possibility that the violations observed in Table 2 were caused by artifacts arising fromthe use of RT distributions obtained by pooling togetherall the RTs from a given condition. RTs are known todepend on both practice (Fitts, 1964) and sequential effects (Kornblum, 1969), and both of these types of effects were significant in the present experiment. Thus,it is possible that the observed violations somehow resultedfrom combining different types of responses into a singleoverall distribution. For example, a response to redundant signals might benefit from stimulus repetition no matter which signal was presented on the previous trial,whereas a response to a single signal could benefit onlyif preceded by the same signal. Thus, responses to redundant signals would benefit from the repetition effect ona higher proportion of trials than responses to either single signal, and this might explain the failure of racemodels.
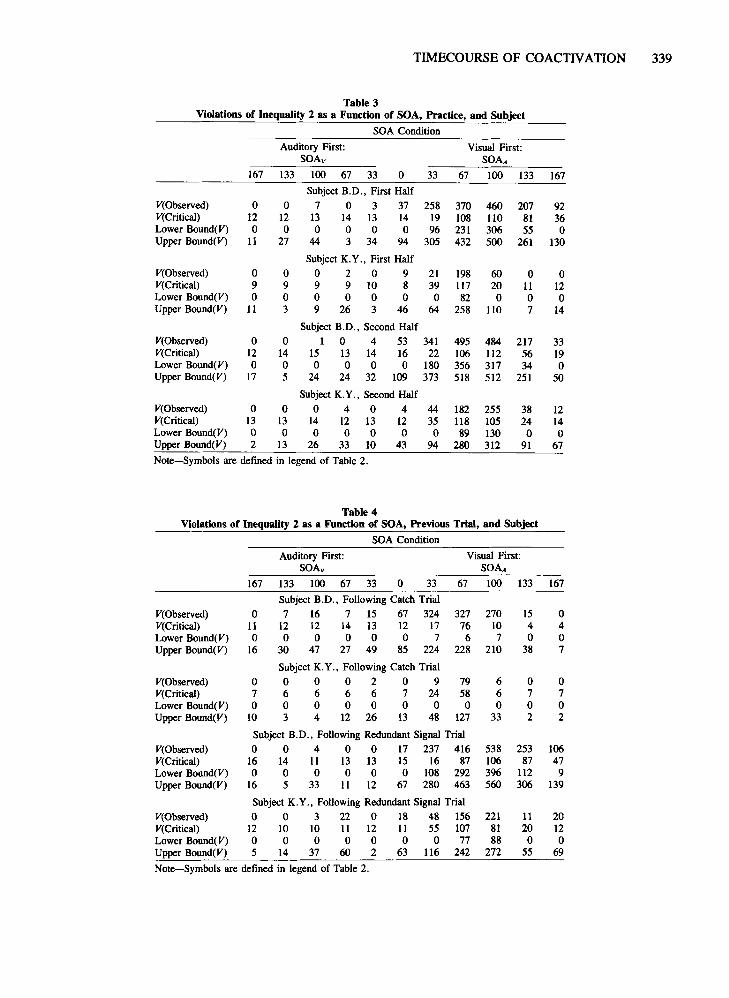
To test for the presence of pooling artifacts, valuesanalogous to those shown in Table 2 were recomputedwith more restricted pooling of RTs into overall distributions. Table 3 shows the violations of Inequality 2 obtained when pooling separately across the first and secondhalves of the experiment for each subject. Table 4 showsthe violations obtained when responses were sorted on thebasis of whether the previous trial was a catch trial ora redundant signals trial (there were not enough trials following single visual and auditory signals for a meaningful analysis). Clearly, there are significant violations ofrace models regardless of how the trials are partitioned.Violations were present in both halves of practice and forboth types of preceding signals. We can conclude thatpooling artifacts of these types do not contribute substantially to the inconsistency with race models.
To summarize the findings from the above analyses,it is clear that race models cannot be used to explain theRSE obtained in this experiment. Comparing Tables 1 and2, it is obvious that the predictions of race models wereseriously violated at all SOAs for which there was a sizable RSE. Thus, it can be concluded that a response toa redundant signal is not simply a response to either itsvisual or its auditory component.
Comparison of Accumulation and ExponentialCoactivation Models
Not only do the violations of Inequality 2 contradict racemodels; they also support coactivation models in which
two redundant signals somehow combine to activate theresponse. Therefore, it is reasonable to compare the accumulation and exponential coactivation models using Inequality 3.
To evaluate exponential models, Inequality 3 was testedin the same way as Inequality 2, except for the use of adifferent sum of CDFs on the right-hand side of the inequality. Table 5 shows the total violations of the inequality and the associated critical values and bounds of 95 %confidence intervals, all of which were computed with thesame procedures used to obtain the values in Tables 2-4.
The data show substantial violations of the inequalityderived from exponential coactivation models in conditions with visual signals presented first. Responses toasynchronous redundant signals were much too fast tohave been activated solely by either the visual signalpresent from time 0 to time SOAA or the redundant signals present after time SOAA. This demonstrates that twosignal configurations present at different times can jointlyactivate the response, so response activation must be accumulated across time as assumed by accumulationmodels. Apparently, the visual signal gets the responseactivation process started, and the redundant signals provide the final activation to satisfy the criterion.
In fact, the violations of Inequality 3 are about the samesize as violations of Inequality 2. This suggests that themain source of coactivation-hence, violations of racemodels-is accumulation of activation over time. Onemight have hypothesized instead that violations of Inequality 2 were mainly due to an interactive effect of thetwo signals on the rate at which response activation accumulated. For example, suppose response activation accumulated at the rates of 10, 12, and 5,000,000 units/secfor visual, auditory, and redundant signals, respectively.This would result in huge violations of Inequality 2, butonly very small violations of Inequality 3. The fact thatthe violations of Inequality 3 are almost as large as thoseof Inequality 2 suggests that the rate of response activation for redundant signals is of the same order of magnitude as the sum of the rates for the two single signals.
How Soon Does Response Activation Begin andHow Long Does It Take to Reach Criterion?
Assuming that violations of Inequality 2 reflect coactivation, they can be used to estimate two parametersdescribing the timecourse of response activation producedby each signal: Os, the minimum time from presentationof the signal to the onset of response activation producedby that signal, and Ds , the minimum accumulation timeneeded to reach criterion by 'accumulating response activation just from that signal.
These analyses require comparison of violations acrossa number of SOAs, so they were only performed withSubject B.D. 's data from conditions with the visual signal presented first. Obviously no general conclusions canbe drawn from the results of a single subject tested withspecific stimuli, but the comparison of these values in thiscase leads to some intriguing hypotheses.
TIMECOURSE OF COACTIVATION 339
Table 3Violations of Inequality 2 as a Function of SOA, Practice, and Subject
Note-V(Observed) is the area below FR,sOA(t) but above Fv(t) + FR••(t-SOAA) or FA(t) +FR,.(t-SOAv), as appropriate, in violation of Inequality 3. This area was measured in units of1/1,000tb of the total area below FR , SOA(t). V(Critical) is the maximum size of V(Observed) thatwould be expected by chance if exponential models were correct. Lower and Upper Bound(V)are 95% confidence limits around V(Observed). For further details see text.
O, indicates how soon after its onset each signal begins to produce response activation. To estimate the relative values of Ov and OA, it is reasonable to use thesmallest values of t for which Inequality 2 is violated. Ifthe inequality is violated at time t, then both signals musthave contributed some activation to responses made attime t. Allowing for the necessary motor delay (M), thisimplies that both signals must have produced some activation by time t-M. By finding the smallest value of tproducing coactivation, we can find smallest t-M atwhich activation has been produced by the signal (i.e.,the onset of activation).
The middle column of Table 6 shows, for each condition in which the visual signal was presented first, thesmallest value of t for which Inequality 2 was violated.In each condition, this was defined as the smallest t forwhich FR,sOA(t) was at least .01 greater than the sum ofFv(t) and FA(t-SOAA). The smallest value across all conditions was obtained in the conditions with SOAs of 0 and33 msec. In these conditions, the earliest sign of coactivation was in responses with latencies of about196-197 msec. Thus it appears that a visual signal didnot influence a response that occurred less than about196 msec after it, so it is reasonable to concludethat visualsignals did not start to produce any response activationin the first 196-M msec. The true value of O; is probably slightly less than 196-M, however, because the signal might produce a little response activationwithout causing a violation of Inequality 2.
The rightmost column of Table 6 shows the analogousvalues for the auditory signal, measured from the onsetof the auditory signal to the point of coactivation (i.e.,t-SOAA). In the condition with an SOA.. of 33 msec, forexample, the same responses demonstrating coactivation197 msec after the visual signal also demonstrated coactivation only 164 msec after the auditory signal, since thelatter signal had been delayed by 33 msec. This value in-
dicates that an auditory signal can influence a responsethat occurs within 164 msec after it. Values obtained for·the other SOAs indicate that an auditory signal can influence a response that occurs as little as 105 msec afterit is presented. This implies that the auditory signal musthave produced some response activation within the first105-M msec after its onset, since its activation contributed to a violation of race models within that time.
Comparing the relative values of O; and 0 A just estimated, the conclusion is that an auditory signal can startproducing response activation about 91 msec (196 - M- 105 + M) faster than a visual one. That is, the conclusion is that the minimum time needed for a visual signal to influence a response is much more than that neededfor an auditory one. This conclusion is consistent withthe faster overall RTs to single auditory signals, and maybe one of the reasons why auditory signals are more effective alerting stimuli than visual signals (Posner, Nis-
Table 6Estimates of Minimum Onset and Duration of
Response Activation for B.D.
Smallest t Violating Inequality 3*
Measured From Measured FromSOA Onset of Onset of
(Visual First) Visual Signal Auditory Signal
o ~6 1%33 197 16467 225 158
100 233 133133 238 105167 319 152
Estimated Minimum Onset 196 105Minimum RTt to Single Signal 247 176Estimated Minimum Duration 51 71
*Smallestt for which FR,sOA(t) > FA(t-SOAA) +Fv(t) + 0.01. tRTat 2.5 percentile was used rather than minimum, to avoid contamination from anticipation responses.
sen, & Klein, 1976). It is also interesting to note that thisanalysis requires M to be smaller than 105 msec.
By extending the above argument, it is possible to estimate D; and DA , the minimum times needed for each signal to produce enough activation to reach criterion. Theminimum duration of response activation can be estimatedby the difference between the minimum single-signal RTand the minimum time needed for the onset of activation,estimated above. For example, an auditory signal couldinfluence a response that occurred as little as 105 msecafter it, but could never cause a response all by itself inless than 176 msec (minimum RT for trials with a singleauditory signal). From this comparison, it appears thatauditory signals required at least 71 msec (176-105) toproduce enough activation to reach criterion.
Comparable values for the visual signal were, surprisingly, somewhat shorter. The fastest responses to a visualsignal (247 msec) were only 51 msec slower than thefastest responses that could be influenced by a visual signal (196 msec). Thus, it appears that the visual signal canproduce enough activation to reach criterion in less time(measured from the onset of activation) than the auditorysignal, even though the onset of activation is earlier forthe auditory signal. It should be emphasized that thesecomparisons are between minimum times, and the sameconclusions may not apply to average time needed for activation to begin and to reach criterion. However, if theassumptions of the analysis are correct, the values of 71and 51 msec are estimates of the minimum absolute duration of response activation, not just relative values.
The Combination Rule of Grice, Canham, andBoroughs (1984)
Grice et al. (1984) have proposed a form ofaccumulation model that incorporates the qualitative features implied by the above analyses of RT distributions. Theirmodel gave a very good account of results obtained inletter-detection tasks, accounting for over 99% of the variance. Thus, it seemed reasonable to fit the model to thepresent data. The model is described briefly below, andthen the results of the fit to the present data are reported.
In Grice et al. 's (1984) model, response activation E(t)grows deterministically as a function of time since onsetof the signal, without random trial-to-trial variation. Whenresponse activation reaches a criterion, the response isinitiated. Variation in RT is caused by the fluctuation ofthis response criterion, which is assumed to have a normal distribution with unknown mean and variance.
In a divided-attention task, it is natural to assume thatsignals on both channels produce response activation, andthat the total activation produced by redundant signals issome function of the activations produced by the two single signals. Grice et al. (1984) used the observed cumulative density functions of RT to estimate E1(t ) , E2(t), andER(t) , the functions describing the timecourse of theresponse activation produced by a signal on channell,a signal on channel 2, and redundant signals, respectively(see Grice et al., 1984, for a fuller description). They thenused linear regression to look for a combination rule that
TIMECOURSE OF COACTIVATION 341
would predict ER(t) from E 1(t) and E2(t). In Grice et al. 's(1984) data, a linear averaging function accounted forabout 99 % of the variance in each of several experiments:
ER(t) = C+AX[E1(t)+E2(t)]. (4)
In several experiments, the values of A were consistentlyabout 0.5, and C ranged from about .3 to .6.
Grice et al. 's (1984) model was fit separately for eachsubject and redundant-signal condition of the present experiment. First, ER,sOA(t) was estimated for each of the11 redundant-signal conditions, using Grice et al. 's Equation 4. Twenty values of t were identified in each condition, corresponding to F(t) values ranging from 0.025 to0.975 in steps of 0.05. Following Grice et al., 3.5 wasadded to each E(t) to adjust the origins of these activation functions to O. Next, using the distributions of RTobtained in each of the two single-signal conditions,EA(t-SOAA) and Ev(t-SOAv) were computed for eachof the 20 values oft from each of the 11 redundant-signalconditions. Then linear regression was used to estimate,for each condition, the values ofA and C that best predictthe 20 values of ER,sOA(t) from the sum of the corresponding EA(t-SOAA) and Ev(t-SOAv).
Table 7 summarizes the fits for both subjects across allconditions. These fits are reasonably good for SubjectB.D., accounting for a total of 96.6% of the varianceacross all conditions, although these fits are not nearlyas precise as those obtained by Grice et al. (1984). Inspection of the 11 fits indicated that ER(t) is consistentlyoverpredicted for values of t corresponding to cumulative percentages of2.5, 7.5, 12.5, and 97.5, and consistently underpredicted at values of t corresponding to percentages from 42.5 to 57.5. Across the 11 regressionanalyses, the prediction errors at all of these values oft were consistently different from zero by Student's t tests(df = 10, p < .05).
The fits are much poorer for K. Y., accounting for only81.7% of the total variance across conditions. For thissubject, too, the model significantly overpredicted ER(t)at the lower values of t, corresponding to cumulative percentages of 2.5 to 22.5, and underpredicted for valuesoft from 37.5 to 87.5. Inspection of the percent varianceaccounted for by the model in each condition (Table 7)shows that the model fits especially poorly for K. Y. inthe conditions in which no redundant signals effect wasfound (cf. Table 1).
A more stringent test of the model is to see how wellER,sOA(t) can be predicted from EA(t-SOA) +Ev(T-SOAv) using a single set of estimates for A andC across all SOA conditions. Since the different conditions were mixed together within blocks of trials, it is hardto see how the parameter estimates could vary across theseconditions. When all 220 points for B.D. were pooled intoa single regression equation, the estimates of C and A were0.83 and 0.66, respectively, and the model accounted foronly 89.7 % of the variance. For K.Y., the estimates were1.89 and 0.38, with 76.9% of the variance accounted for.The reduction in prediction accuracy, compared with theset of models using different values of C and A for the
342 MILLER
Table 7Estimates of A and C and Percentage of Variance Accounted
Total variance accounted for across all 1l conditions = 81.7%
different SOA conditions, was significant for both subjects [B.D., F(20,198) = 20, p < .01, MS. = 0.0354;K.Y., F(20,198) = 2.57, p < .01, MS. = 0.4845].
CONCLUSIONS
The results of this experiment provide further evidenceagainst race models of bimodal detection tasks, extending previous work with simultaneous redundant signals(Miller, 1982). RT distributions obtained from two highlypracticed subjects indicate that their responses to sequentially presented redundant signals were too fast to be explained in terms of the winner of a race between twoprocesses responding separately to the two single signals.Violations of race models tended to be larger in conditions in which the RSE was larger, so it is clear that racemodels cannot account for that effect.
Tests of Inequality 3 showed that, for both subjects,responses to sequentially presented redundant signals werealso too fast to have been produced by a race betweenone process responding to the single signal and a separateprocess, starting SOA msec later, responding to theredundant signals. Activation appears to have been accumulated over time as well as over signals, so an individual response can sometimes be activated both by thesingle signal present at the beginning of the trial and bythe redundant signals present after the end of the SOA.This finding supports accumulation models of coactivation and of RT processes in general, and it is evidenceagainst exponential models in which the response is generated by history-free processes.
It is perhaps surprising that response processes accumulate activation over a significant period of time, even insimple signal detection tasks with superthreshold signals.The requirement of a long accumulation interval may bea necessary corollary of the need to maintain a fairly highresponse criterion to avoid making false alarms on catchtrials (cf. Grice, 1972).
The results of the present paper, although strongly supporting accumulation models of coactivation, unfortunately give no indication of the level of processing thatis responsible for coactivation, and it will be importantto try to identify this level in future research. For example, one possible coactivation model would localize theinteraction within a central decision process that accumulates evidence of signals until it has enough to satisfy aninternal response criterion (Miller, 1982). If each signalcauses evidence to accumulate in this decision makercoactivation could arise because the decision proces~would pool evidence coming from different signals, allowing both to contribute toward satisfying the responsecriterion. Naturally, this would produce faster responseson redundant-signal trials than on single-signal trials.Miller (1982) argued for decision-level coactivation onseveral grounds.
Other possible coactivation models might localize theinteraction between signals within the sensory or motorsystems, and these models are closely related to the energysummation and preparation enhancement models of theintersensory facilitation observed in focused-attentiontasks (e.g., Nickerson, 1973). Energy summation modelsare based on the idea that energy from different signalssums within the perceptual system, as might be the caseif neurons responding to signals on different modalitiesconverged on a common sensory area (cf. lung, Kornhuber, & DaFonseca, 1963). Such convergence wouldproduce a stronger perceptual.signal on redundant-signalstrials than on single-signal trials. Preparation-enhancementmodels assume that redundant signals combine in activating the motor system, so that motor responding is fasterto redundant than to single signals.
REFERENCES
ASHBY, F. G. (1982). Testing the assumptions ofexponential, additivereaction time models. Memory & Cognition, 10, 125-134.
ASHBY, F. G., & TOWNSEND, J. (1980). Decomposing the reaction time
distribution: Pure insertion and selective influence revisited. Journalof Mathematical Psychology, 21, 93-123.
AUDLEY, R. J. (1973). Some observations on theories of choice reaction time: Tutorial review. In S. Kornblum (Ed.), Attention and performance (Vol. 4; pp. 509-545). New York: Academic Press.
BERNSTEIN, I. H. (1970). Can we see and hear at the same time? Somerecent studies of intersensory facilitation of reaction time. Acta Psychologica, 33, 21-35.
BLAKE, R. R., MARTENS, W., GARRETT, A., &; WESTENDORF, D. (1980).Estimating probability summation for binocular reaction time data.Perception & Psychophysics, 27, 375-378.
CHRISTIE, L., '" LUCE, R. D. (1956). Decision structure and time relations in simple choice behavior. Bulletin ofMathematical Biophysics,18, 89-112.
COLAVITA, F. (1974). Human sensory dominance. Perception & Psychophysics, 16, 409-412.
CORCORAN, D. W. J., '" WEENING, D. (1969). On the combination ofevidence from the eye and ear. Ergonomics, 12, 383-394.
DIACONIS, P., &; EFRON, B. (1983). Computer-intensive methods in statistics. Scientific American, 248, 116-130.
EFRON, B. (1979). Bootstrap methods: Another look at the jackknife.Annals of Statistics, 7, 1-26.
FITTS, P. (1964). Perceptual-motor skill learning. In A. Melton (Ed.),Categories ofhuman learning (pp. 243-285). New York: AcademicPress.
GIELEN, S. C. A. M., SCHMIDT, R. A., &; VAN DEN HEUVEL, P. J. M.(1983). On the nature of intersensory facilitation of reaction time. Perception & Psychophysics, 34, 161-168.
GREEN, D. M., '" SMITH, A. F. (1982). Detection of auditory signalsoccurring at random times: Intensity and duration. Perception & Psychophysics, 31, 117-127.
GRICE, G. R. (1972). Application of a variable criterion model to auditory reaction time as a function of the type of catch trial. Perception& Psychophysics, 12, 103-107.
GRICE, G. R., CANHAM, L., ",BOROUGHS, J. M. (1984). Combinationrule for redundant information in reaction time tasks with divided attention. Perception & Psychophysics, 35, 451-463.
HOCKLEY, W. E. (1984). Analysis of response time distributions in thestudy of cognitive processes. Journal of Experimental Psychology:Learning, Memory, & Cognition, 10,598-615.
HOHLE, R. (1965). Inferred components of reaction times as functionsof foreperiod duration. Journal of Experimental Psychology, 69,382-386.
JUNG, R., KORNHUBER, H., '" DAFoNSECA, J. (1963). Multisensoryconvergence on cortical neurons: Neuronal effects of visual, acoustic and vestibular stimuli in the superior convolutions of the eat's cortex.In G. Moruzzi, A. Fessard, & H. Jasper (Eds.), Progress in brainresearch, Vol. 1: Brain mechanisms. Amsterdam: Elsevier.
KORNBLUM, S. (1969). Sequential determinants of information processingin serial and discrete choice reaction time. Psychological Review, 76,113-131.
LINK, S. W. (1975). The relative judgment theory of two choice responsetime. Journal of Mathematical Psychology, 12, 114-135.
LONG, J. B. (1976). Effect of task difficulty on the division of attentionbetween nonverbal signals: Independence or interaction? QuarterlyJournal of Experimental Psychology, 28, 179-192.
LUCE, R. D., '" GREEN, D. M. (1970). Detection of auditory signalspresented at random times, II. Perception & Psychophysics, 7, 1-14.
MCGILL, W. (1963). Stochastic latency mechanisms. In R. D. Luce,R. Bush, & E. Galanter (Eds.), Handbook ofmathematical psychology (Vol. 1, pp. 309-360). New York: Wiley.
MEIJERS, L., '" EIJKMAN, E. (1977). Distributions of simple RT withsingle and double stimuli. Perception & Psychophysics, 22, 41-48.
MILLER, J. O. (1982). Divided attention: Evidence for coactivation withredundant signals. Cognitive Psychology, 14, 247-279.
MULLIGAN, R. M., '" SHAW, M. L. (1980). Multimodal signal detection: Independent decisions vs. integration. Perception & Psychophysics, 28, 471-478.
NICKERSON, R. S. (1973). Intersensory facilitation of reaction time:Energy summation or preparation enhancement. Psychological Review,SO, 489-509.
TIMECOURSE OF COACTIVATION 343
POSNER, M. I., NISSEN, M. J., '" KLEIN, R. (1976). Visual dominance:An information-processing account of its origins and significance. Psychological Review, 83, 157-171.
RAAB, D. (1962). Statistical facilitation of simple reaction times. Transactions of the New York Academy of Sciences, 24, 574-590.
RATCLIFF, R. (1978). A theory of memory retrieval. PsychologicalReview, 85, 59-108.
RATCLIFF, R., '" MURDOCK, B. (1976). Retrieval processes in recognition memory. Psychological Review, 83, 190-214.
SHAW, M. L. (1982). Attending to multiple sources of information: I.The integration of information in decision making. Cognitive Psychology, 14, 353-409.
TOWNSEND, J. T., &; ASHBY, F. G. (1983). The stochastic modelingofelementary psychologicalprocesses. New York: Cambridge University Press.
ULRICH, R., '" GIRAY, M. (1986). Separate-activation models with variable base times: Testability and checking of cross-ehannel dependency.Perception & Psychophysics, 39, 248-259.
VICKERS, D. (1970). Evidence for an accumulator model of psychophysical discrimination. Ergonomics, 13, 37-58.
NOTES
1. Other investigators (e.g., Blake, Martens, Garrett, & Westendorf,1980; Meijers & Eijkman, 1977) have tested race models by makinga particular assumption (usually independence) about the correlation between processes responding to signals on different modalities. From suchan assumption, one can derive exact predictions for FR(t), thus obtaining tests with more statistical power. Unfortunately, making such anassumption leads to a test with less conceptual power, since, if the predictions are not fulfilled, one does not know whether the race model orthe assumed correlation is wrong. The test based on Inequality 1 ispreferred here for its generality: If this inequality is violated, no racemodel is consistent with the data, regardless of the assumed correlation.
2. For the purposes of this paper, many distinguishable RT modelsare included without distinction in the accumulation class. These areall models in which the decision is made by a process changing statesgradually over time, including diffusion models, random walk models,and so forth. The class of accumulation models discussed here shouldnot be confused with the accumulator model of Vickers (1970), whichis one particular member of this class.
3. A variant of an accumulation model could assume that the decision process accumulates activation over time, but restarts if the signalconditions change. This would allow accumulation over time, but notcombination of activation from an early single signal and a later redundant one. For the purposes of this paper, such a model will be considered to be exponential, because it is severely limited in its ability toaccumulate information over time. In any case, this model was ruledout by the experimental results.
Likewise, it is possible for an exponential model to allow an effectof history by assuming that the exponential response rate to a redundant signal depends on whether a single signal was previously present.This assumption seems contrary to the spirit of exponential models,however, since it allows history to influence the decision. Therefore,models of this type will be classed with accumulation models, even ifthe decision process is exponential, given a static signal configuration.
4. The term "signals" is used here to refer to physical stimuli, notto internal representations that activate responses. An anonymousreviewer rightly pointed out that, if the internal representation of anauditory signal were formed much more quickly than the internalrepresentation of a visual signal, the auditory representation might fullyactivate the response even though the visual stimulus had been presentedfirst. Since the auditory representation would have arisen as a resultof the redundant physical stimulus, though, this consideration does notcomplicate the interpretation of the inequality derived below.
(Manuscript received May 2, 1986;revision accepted for publication August 25, 1986.)