Issue No. 1 July-September 2012 Page 1 Content Food security Situation Summary ............................1 Overall production and food availability ..................2 Crop production Agro-meteorology Goverment support programs Food balance and National Food Security Food prices and market supply .................................5 Household food security ..........................................7 Vulnerability, coping mechanisms and government response Nutrition and health................................................8 FOOD SECURITY SITUATION SUMMARY The Timor Leste Food Security Bulletin (FSB) is a product of the EU and FAO supported project on establishing a sustainable National Information and Early Warning System (NIEWS) on Food Security in Timor Leste. The FSB aims of reporting and providing information on national and household food security situation in a quarterly basis. This is a MAF led innovation of ensuring the timely delivery of information to decision makers and wider stakeholders on the general overview of the food security situation of the country as an early warning to mitigate the serious impact of food shortages and hunger. This third quarter issue provides the final production estimate of the main season harvest for maize and rice as well as an early estimate of the second season production. It also includes market information and price data for the main food products. This product is funded by the European Union. The views expressed in this publication do not necessarily reflect the views of the European Commission. ereal production, consisting mainly of rice and maize, this year projected at 265, 481 tonnes, 140 Cpercent higher than the poor harvest of the previous cropping year and 43 percent higher than an average of the past three years. This high estimate attributed to the increase in the cultivated area for the paddy rice of 20,029 hectares and some increase in yield from 3.25 to 3.4 tonnes per hectare. Use of improved seeds and fertilizers from the government's Fila Rai Gratuitu program and from Non Governmental Organizations, favourable weather during the entire main season as well as emphasis on seed transplanting and weeding have significantly contributed for the improved yield of the main season harvest.. However, for the current marketing year (April 2012/March 2013) 26, 341 tonnes deficit of rice and 33,609 tonnes maize surplus are estimated. The rice deficit could be covered by other crops/food or by imports. Across the country food supply was reported normal during the past lean season (November-February) and during the second quarter. The average price of rice (70 cents) is showing a normal seasonal behaviour at local level, with an increase in January/February (the highest seasonal peak) and a slight decline during the following months. Maize prices dipped in March (during the harvest time) but rose towards the end of the maize harvest period (April) and the succeeding months reflecting the relative food insufficiency in some districts following the low performance in 2011, unsatisfied demand and a need to restore stocks. In spite of the national level favourable production situation described above, there have been some areas where the attack of pests has caused considerable damage to the crops with the total damage area estimated at 5,612.02 hectares. The districts that are mostly affected are Ainaro, Bobonaro, Manatuto and Oecusse. There are also districts that have higher structural food deficit that could be the most vulnerable districts in the event of environmental or economic crisis. These districts are: Liquisa, Ermera, Aileu, Ainaro, Manufahi and off-grid areas of Dili. The nutritional status of children under five years of age reveals some improvement. The Health Monitoring and Information System (H-MIS) revealed the reduction of prevalence of underweight condition (children with low weight for their age) during the second quarter. To receive copies of this bulletin, please contact: MAF Information department or Food Security department (Tel: +670 77238095 / 77323003 or visit www.maf.gov.tl) Timor Leste Food Security Bulletin Timor Leste Crop Calendar In normal years, coinciding with the rainy season, the agricultural cycle in Timor Leste begins in November with land preparation and planting of maize, followed by nursery preparation and transplanting of rice in December/January. Maize is harvested in Ap ril and wet season rice around May/June. In southern areas, where there is a second rainy season and in areas with some supplementary irrigation it is possible to grow a second crop of maize or rice. Crops J F M A M J J A S O N D Rice (main season) Maize (main season) Rice (second season) Maize (second season) lean period lean period Sowing Growing Harvest Source: MAF
government responseNutrition and health................................................8
FOOD SECURITY SITUATION SUMMARY
The Timor Leste Food Security Bulletin (FSB) is a product of the EU and FAO supported project on establishing a sustainable National Information and Early Warning System (NIEWS) on Food Security in Timor Leste. The FSB aims of reporting and providing information on national and household food security situation in a quarterly basis. This is a MAF led innovation of ensuring the timely delivery of information to decision makers and wider stakeholders on the general overview of the food security situation of the country as an early warning to mitigate the serious impact of food shortages and hunger. This third quarter issue provides the final production estimate of the main season harvest for maize and rice as well
as an early estimate of the second season production. It also includes market information and price data for the main food products. This product is funded by the European Union. The views expressed in this publication do not necessarily reflect the views of the European Commission.
ereal production, consisting mainly of rice and
maize, this year projected at 265, 481 tonnes, 140 Cpercent higher than the poor harvest of the previous
cropping year and 43 percent higher than an average of the
past three years. This high estimate attributed to the increase
in the cultivated area for the paddy rice of 20,029 hectares
and some increase in yield from 3.25 to 3.4 tonnes per
hectare. Use of improved seeds and fertilizers from the
government's Fila Rai Gratuitu program and from Non
Governmental Organizations, favourable weather during
the entire main season as well as emphasis on seed
transplanting and weeding have significantly contributed
for the improved yield of the main season harvest..
However, for the current marketing year (April 2012/March
2013) 26, 341 tonnes deficit of rice and 33,609 tonnes maize
surplus are estimated. The rice deficit could be covered by
other crops/food or by imports.
Across the country food supply was reported normal during the past lean season (November-February) and during the second quarter. The average price of rice (70 cents) is showing a normal seasonal behaviour at local level, with an
increase in January/February (the highest seasonal peak) and a slight decline during the following months. Maize prices dipped in March (during the harvest time) but rose towards the end of the maize harvest period (April) and the succeeding months reflecting the relative food insufficiency in some districts following the low performance in 2011, unsatisfied demand and a need to restore stocks.
In spite of the national level favourable production situation described above, there have been some areas where the attack of pests has caused considerable damage to the crops with the total damage area estimated at 5,612.02 hectares.
The districts that are mostly affected are Ainaro, Bobonaro, Manatuto and Oecusse. There are also districts that have higher structural food deficit that could be the most vulnerable districts in the event of environmental or economic crisis. These districts are: Liquisa, Ermera, Aileu, Ainaro, Manufahi and off-grid areas of Dili.
The nutritional status of children under five years of age reveals some improvement. The Health Monitoring and Information System (H-MIS) revealed the reduction of prevalence of underweight condition (children with low weight for their age) during the second quarter.
To receive copies of this bulletin, please contact: MAF Information department or Food Security department (Tel: +670 77238095 / 77323003 or visit www.maf.gov.tl)
Timor LesteFood Security Bulletin
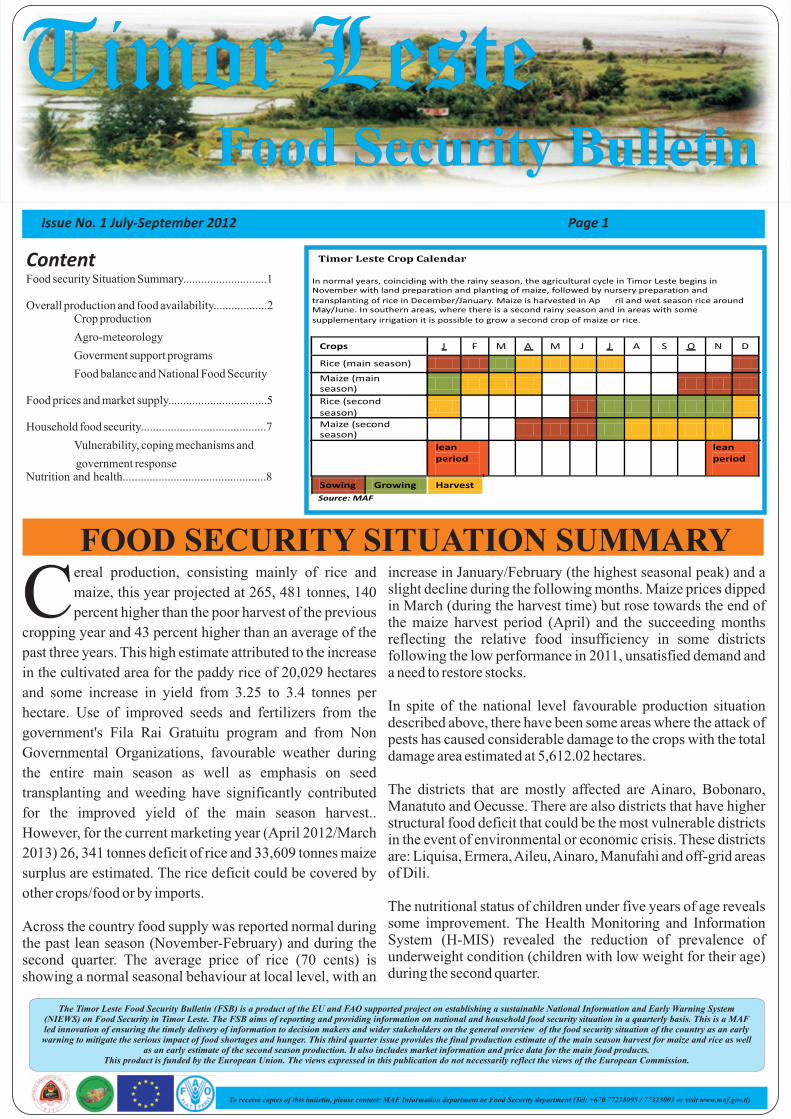
Timor Leste Crop Calendar
In normal years, coinciding with the rainy season, the agricultural cycle in Timor Leste begins in November with land preparation and planting of maize, followed by nursery preparation and
transplanting of rice in December/January. Maize is harvested in Ap ril and wet season rice around May/June. In southern areas, where there is a second rainy season and in areas with some
supplementary irrigation it is possible to grow a second crop of maize or rice.
Crops
J
F
M
A
M
J
J
A
S
O
N
D
Rice (main season)
Maize (main season)
Rice (second
season)
Maize (second season)
lean
period
lean
period
Sowing
Growing
Harvest
Source: MAF
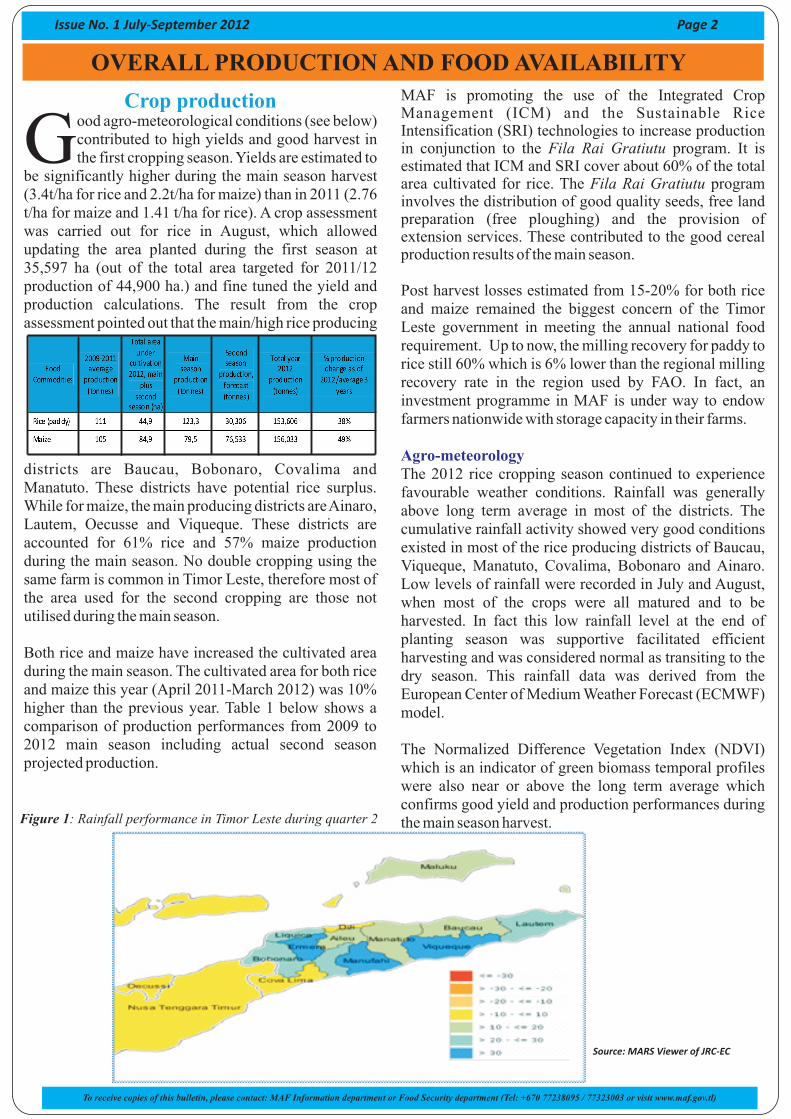
Crop productionood agro-meteorological conditions (see below) contributed to high yields and good harvest in Gthe first cropping season. Yields are estimated to
be significantly higher during the main season harvest (3.4t/ha for rice and 2.2t/ha for maize) than in 2011 (2.76 t/ha for maize and 1.41 t/ha for rice). A crop assessment was carried out for rice in August, which allowed updating the area planted during the first season at 35,597 ha (out of the total area targeted for 2011/12 production of 44,900 ha.) and fine tuned the yield and production calculations. The result from the crop assessment pointed out that the main/high rice producing
districts are Baucau, Bobonaro, Covalima and Manatuto. These districts have potential rice surplus. While for maize, the main producing districts are Ainaro, Lautem, Oecusse and Viqueque. These districts are accounted for 61% rice and 57% maize production during the main season. No double cropping using the same farm is common in Timor Leste, therefore most of the area used for the second cropping are those not utilised during the main season.
Both rice and maize have increased the cultivated area during the main season. The cultivated area for both rice and maize this year (April 2011-March 2012) was 10% higher than the previous year. Table 1 below shows a comparison of production performances from 2009 to 2012 main season including actual second season projected production.
MAF is promoting the use of the Integrated Crop Management (ICM) and the Sustainable Rice Intensification (SRI) technologies to increase production in conjunction to the Fila Rai Gratiutu program. It is estimated that ICM and SRI cover about 60% of the total area cultivated for rice. The Fila Rai Gratiutu program involves the distribution of good quality seeds, free land preparation (free ploughing) and the provision of extension services. These contributed to the good cereal production results of the main season.
Post harvest losses estimated from 15-20% for both rice and maize remained the biggest concern of the Timor Leste government in meeting the annual national food requirement. Up to now, the milling recovery for paddy to rice still 60% which is 6% lower than the regional milling recovery rate in the region used by FAO. In fact, an investment programme in MAF is under way to endow farmers nationwide with storage capacity in their farms.
The 2012 rice cropping season continued to experience favourable weather conditions. Rainfall was generally above long term average in most of the districts. The cumulative rainfall activity showed very good conditions existed in most of the rice producing districts of Baucau, Viqueque, Manatuto, Covalima, Bobonaro and Ainaro. Low levels of rainfall were recorded in July and August, when most of the crops were all matured and to be harvested. In fact this low rainfall level at the end of planting season was supportive facilitated efficient harvesting and was considered normal as transiting to the dry season. This rainfall data was derived from the European Center of Medium Weather Forecast (ECMWF) model.
The Normalized Difference Vegetation Index (NDVI) which is an indicator of green biomass temporal profiles were also near or above the long term average which confirms good yield and production performances during the main season harvest.
Agro-meteorology
OVERALL PRODUCTION AND FOOD AVAILABILITY
Issue No. 1 July-September 2012 Page 2
Source: MARS Viewer of JRC-EC
Figure 1: Rainfall performance in Timor Leste during quarter 2
To receive copies of this bulletin, please contact: MAF Information department or Food Security department (Tel: +670 77238095 / 77323003 or visit www.maf.gov.tl)
Source: MARS Viewer of JRC-EC
Figure 6: NDVI performance during the main season of Baucau District one of the major rice producing districts
Figure 7: NDVI performance during the main season of Viqueque District one of the major rice producing districts
Figure 8: NDVI performance during the main season of Manatuto District one of the major rice producing districts
Figure 9: NDVI performance during the main season of Bobonaro District one of the major rice producing districts
Source: MARS Viewer of JRC-EC
Source: MARS Viewer of JRC-EC
Figure 5: Rainfall performance of Bobonaro District one of the major rice producing districts
To receive copies of this bulletin, please contact: MAF Information department or Food Security department (Tel: +670 77238095 / 77323003 or visit www.maf.gov.tl)
Issue No. 1 July-September 2012 Page 3
Figure 4: Rainfall performance of Viqueque District, one of the major rice producing districts
Figure 2: Rainfall performance of Baucau District,one of the major rice producing districts
Figure 3: Rainfall performance of Manatuto District one of the major rice producing districts
S o u r c e : M A R S Vi e w e r o f J R C - E C
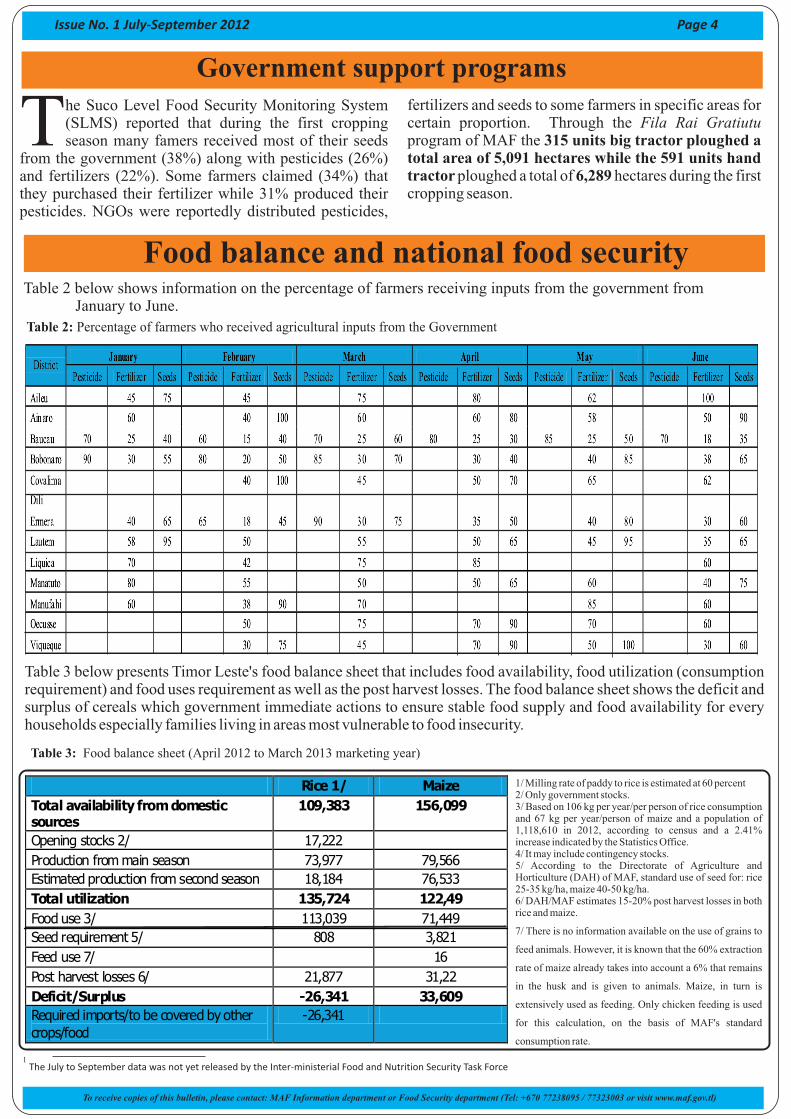
Table 3: Food balance sheet (April 2012 to March 2013 marketing year)
1/ Milling rate of paddy to rice is estimated at 60 percent2/ Only government stocks.3/ Based on 106 kg per year/per person of rice consumption and 67 kg per year/person of maize and a population of 1,118,610 in 2012, according to census and a 2.41% increase indicated by the Statistics Office.4/ It may include contingency stocks.5/ According to the Directorate of Agriculture and Horticulture (DAH) of MAF, standard use of seed for: rice 25-35 kg/ha, maize 40-50 kg/ha.6/ DAH/MAF estimates 15-20% post harvest losses in both rice and maize.
7/ There is no information available on the use of grains to
feed animals. However, it is known that the 60% extraction
rate of maize already takes into account a 6% that remains
in the husk and is given to animals. Maize, in turn is
extensively used as feeding. Only chicken feeding is used
for this calculation, on the basis of MAF's standard
consumption rate.
Issue No. 1 July-September 2012 Page 4
1 The July to September data was not yet released by the Inter-ministerial Food and Nutrition Security Task Force
To receive copies of this bulletin, please contact: MAF Information department or Food Security department (Tel: +670 77238095 / 77323003 or visit www.maf.gov.tl)
Rice 1/ Maize
Total availability from domestic sources
109,383 156,099
Opening stocks 2/ 17,222 XX
Production from main season 73,977 79,566
Estimated production from second season 18,184 76,533
Total utilization 135,724 122,49
Food use 3/ 113,039 71,449
Seed requirement 5/ 808 3,821
Feed use 7/ 16
Post harvest losses 6/ 21,877 31,22
Deficit/Surplus -26,341 33,609
Required imports/to be covered by other crops/food
-26,341
Table 2: Percentage of farmers who received agricultural inputs from the Government
Table 3 below presents Timor Leste's food balance sheet that includes food availability, food utilization (consumption requirement) and food uses requirement as well as the post harvest losses. The food balance sheet shows the deficit and surplus of cereals which government immediate actions to ensure stable food supply and food availability for every households especially families living in areas most vulnerable to food insecurity.
Food balance and national food security
he Suco Level Food Security Monitoring System (SLMS) reported that during the first cropping Tseason many famers received most of their seeds
from the government (38%) along with pesticides (26%) and fertilizers (22%). Some farmers claimed (34%) that they purchased their fertilizer while 31% produced their pesticides. NGOs were reportedly distributed pesticides,
fertilizers and seeds to some farmers in specific areas for certain proportion. Through the Fila Rai Gratiutu program of MAF the 315 units big tractor ploughed a total area of 5,091 hectares while the 591 units hand tractor ploughed a total of 6,289 hectares during the first cropping season.
Government support programs
Table 2 below shows information on the percentage of farmers receiving inputs from the government from January to June.
he scenario presented above suggests that for 2012 Timor Leste is in deficit of rice (26,341 Ttonnes). This can be covered by other crops/food
such as cassava, taro and sweet potato or through imports. On the other hand, the maize surplus is quite high (35,609 tonnes) which will cover the rice deficits and allow for stocks.
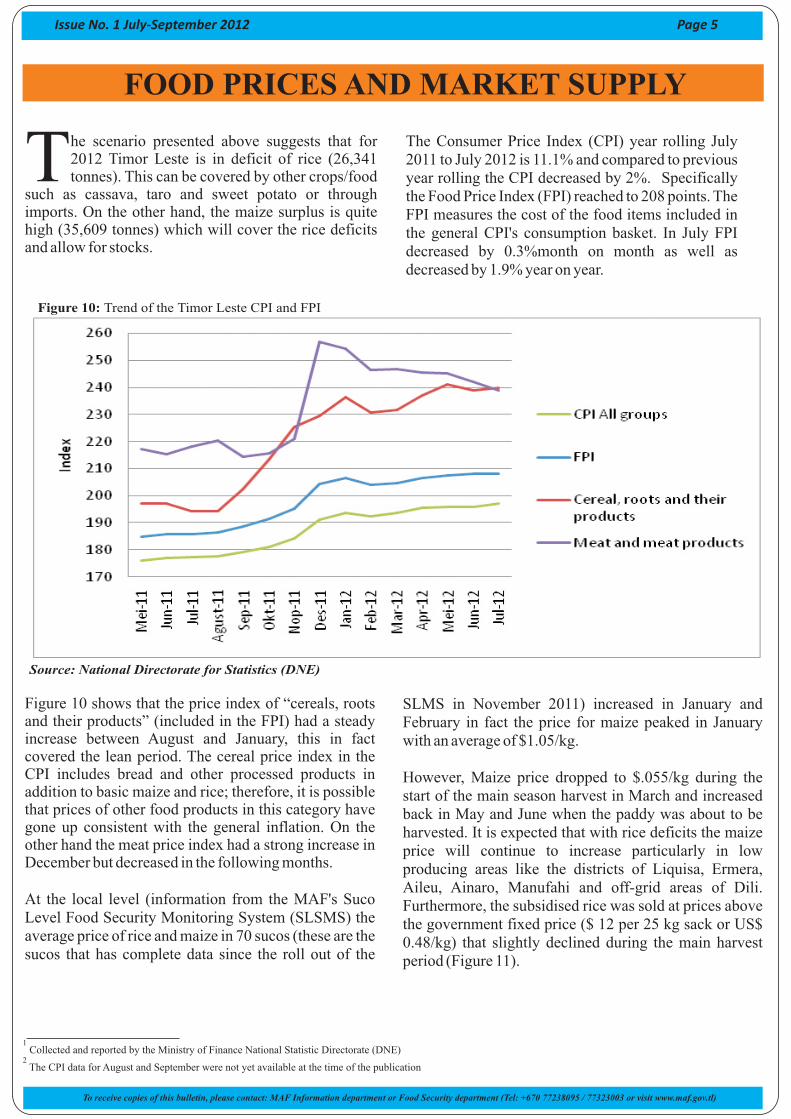
Figure 10 shows that the price index of “cereals, roots and their products” (included in the FPI) had a steady increase between August and January, this in fact covered the lean period. The cereal price index in the CPI includes bread and other processed products in addition to basic maize and rice; therefore, it is possible that prices of other food products in this category have gone up consistent with the general inflation. On the other hand the meat price index had a strong increase in December but decreased in the following months.
At the local level (information from the MAF's Suco Level Food Security Monitoring System (SLSMS) the average price of rice and maize in 70 sucos (these are the sucos that has complete data since the roll out of the
The Consumer Price Index (CPI) year rolling July 2011 to July 2012 is 11.1% and compared to previous year rolling the CPI decreased by 2%. Specifically the Food Price Index (FPI) reached to 208 points. The FPI measures the cost of the food items included in the general CPI's consumption basket. In July FPI decreased by 0.3%month on month as well as decreased by 1.9% year on year.
SLMS in November 2011) increased in January and February in fact the price for maize peaked in January with an average of $1.05/kg.
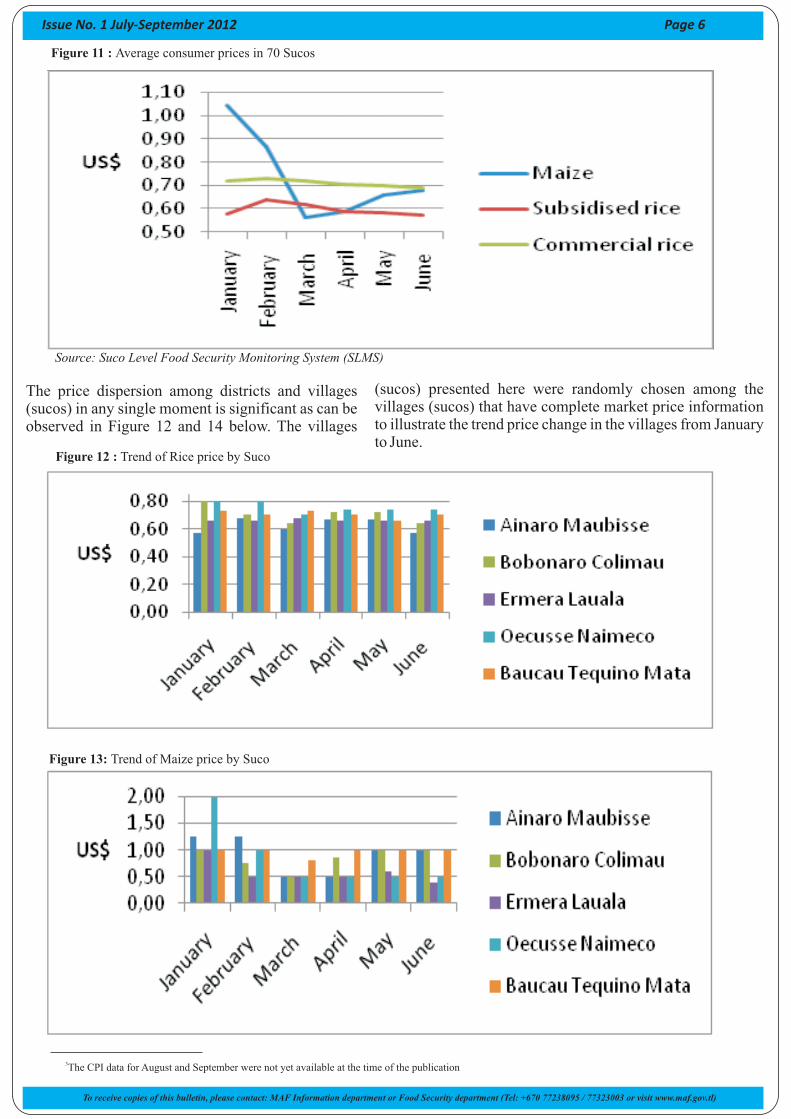
However, Maize price dropped to $.055/kg during the start of the main season harvest in March and increased back in May and June when the paddy was about to be harvested. It is expected that with rice deficits the maize price will continue to increase particularly in low producing areas like the districts of Liquisa, Ermera, Aileu, Ainaro, Manufahi and off-grid areas of Dili. Furthermore, the subsidised rice was sold at prices above the government fixed price ($ 12 per 25 kg sack or US$ 0.48/kg) that slightly declined during the main harvest period (Figure 11).
Issue No. 1 July-September 2012 Page 5
Figure 10: Trend of the Timor Leste CPI and FPI
Source: National Directorate for Statistics (DNE)
1 Collected and reported by the Ministry of Finance National Statistic Directorate (DNE)
2 The CPI data for August and September were not yet available at the time of the publication
To receive copies of this bulletin, please contact: MAF Information department or Food Security department (Tel: +670 77238095 / 77323003 or visit www.maf.gov.tl)
FOOD PRICES AND MARKET SUPPLY
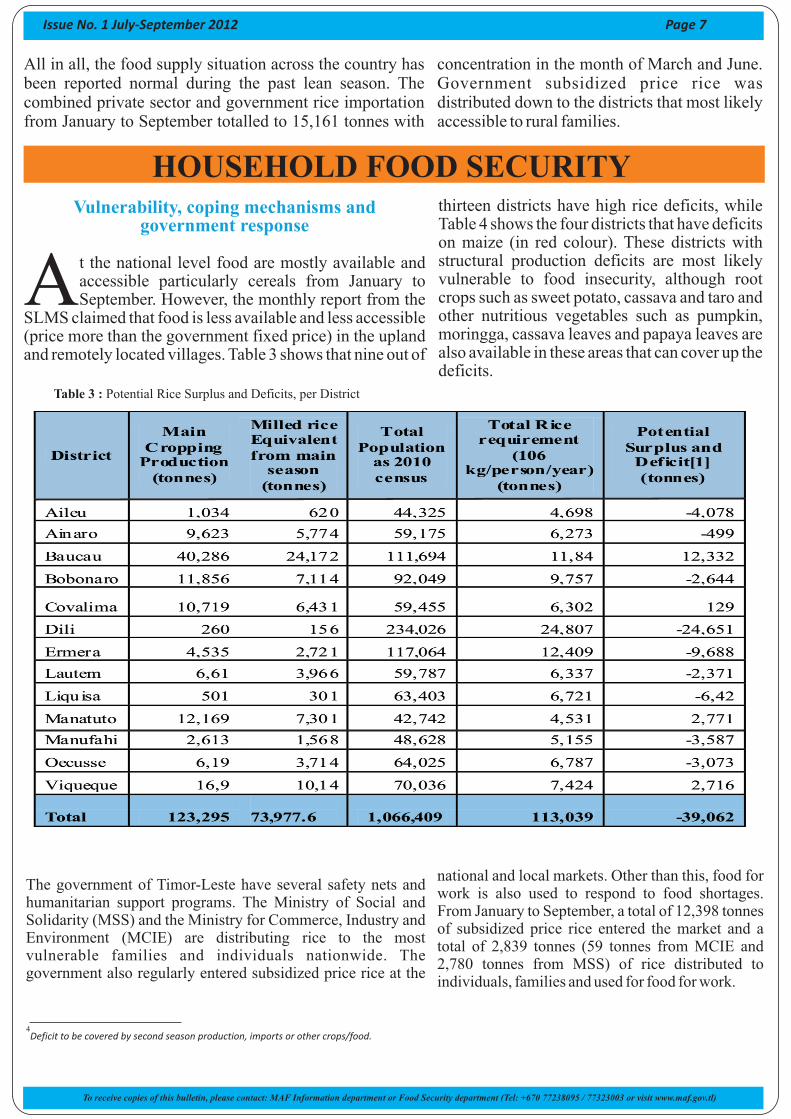
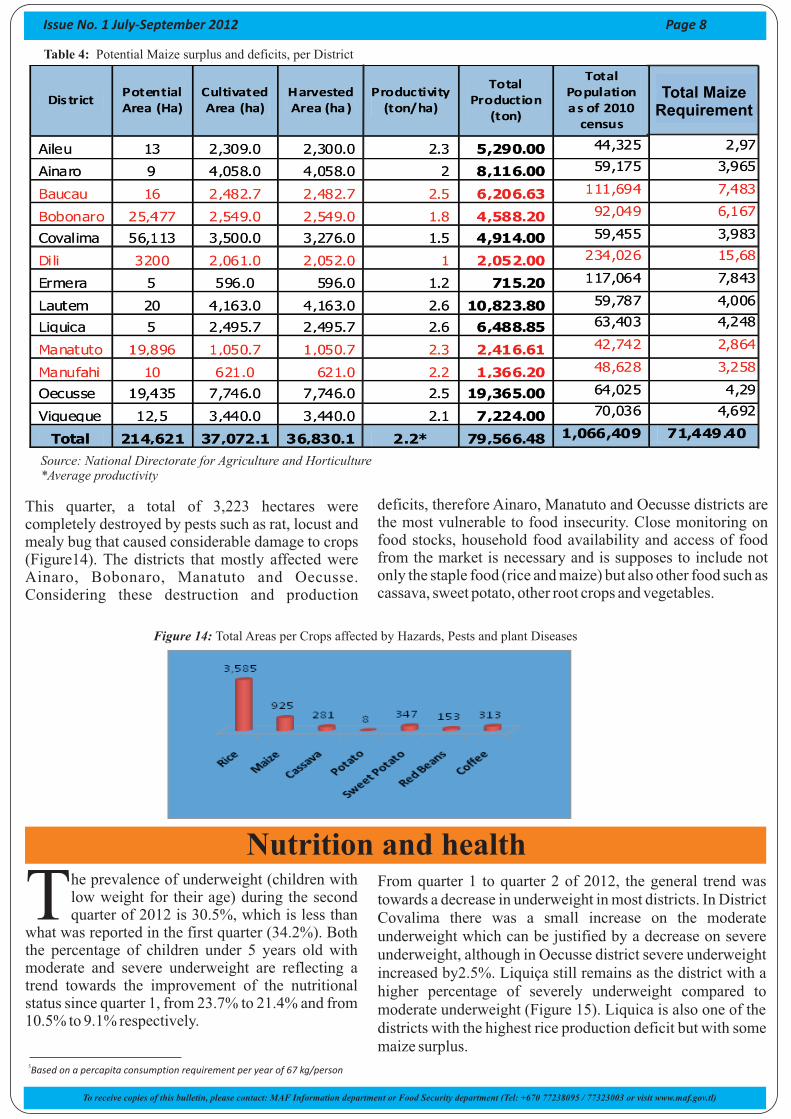
The price dispersion among districts and villages (sucos) in any single moment is significant as can be observed in Figure 12 and 14 below. The villages
Issue No. 1 July-September 2012 Page 6
Figure 11 : Average consumer prices in 70 Sucos
Source: Suco Level Food Security Monitoring System (SLMS)
(sucos) presented here were randomly chosen among the villages (sucos) that have complete market price information to illustrate the trend price change in the villages from January to June.
Figure 12 : Trend of Rice price by Suco
Figure 13: Trend of Maize price by Suco
3The CPI data for August and September were not yet available at the time of the publication
To receive copies of this bulletin, please contact: MAF Information department or Food Security department (Tel: +670 77238095 / 77323003 or visit www.maf.gov.tl)
All in all, the food supply situation across the country has been reported normal during the past lean season. The combined private sector and government rice importation from January to September totalled to 15,161 tonnes with
The government of Timor-Leste have several safety nets and humanitarian support programs. The Ministry of Social and Solidarity (MSS) and the Ministry for Commerce, Industry and Environment (MCIE) are distributing rice to the most vulnerable families and individuals nationwide. The government also regularly entered subsidized price rice at the
Issue No. 1 July-September 2012 Page 7
national and local markets. Other than this, food for work is also used to respond to food shortages. From January to September, a total of 12,398 tonnes of subsidized price rice entered the market and a total of 2,839 tonnes (59 tonnes from MCIE and 2,780 tonnes from MSS) of rice distributed to individuals, families and used for food for work.
Table 3 : Potential Rice Surplus and Deficits, per District
4Deficit to be covered by second season production, imports or other crops/food.
To receive copies of this bulletin, please contact: MAF Information department or Food Security department (Tel: +670 77238095 / 77323003 or visit www.maf.gov.tl)
Vulnerability, coping mechanisms and government response
t the national level food are mostly available and accessible particularly cereals from January to ASeptember. However, the monthly report from the
SLMS claimed that food is less available and less accessible (price more than the government fixed price) in the upland and remotely located villages. Table 3 shows that nine out of
concentration in the month of March and June. Government subsidized price rice was distributed down to the districts that most likely accessible to rural families.
HOUSEHOLD FOOD SECURITYthirteen districts have high rice deficits, while Table 4 shows the four districts that have deficits on maize (in red colour). These districts with structural production deficits are most likely vulnerable to food insecurity, although root crops such as sweet potato, cassava and taro and other nutritious vegetables such as pumpkin, moringga, cassava leaves and papaya leaves are also available in these areas that can cover up the deficits.
Issue No. 1 July-September 2012 Page 8
Table 4: Potential Maize surplus and deficits, per District
Source: National Directorate for Agriculture and Horticulture*Average productivity
This quarter, a total of 3,223 hectares were completely destroyed by pests such as rat, locust and mealy bug that caused considerable damage to crops (Figure14). The districts that mostly affected were Ainaro, Bobonaro, Manatuto and Oecusse. Considering these destruction and production
deficits, therefore Ainaro, Manatuto and Oecusse districts are the most vulnerable to food insecurity. Close monitoring on food stocks, household food availability and access of food from the market is necessary and is supposes to include not only the staple food (rice and maize) but also other food such as cassava, sweet potato, other root crops and vegetables.
5Based on a percapita consumption requirement per year of 67 kg/person
Figure 14: Total Areas per Crops affected by Hazards, Pests and plant Diseases
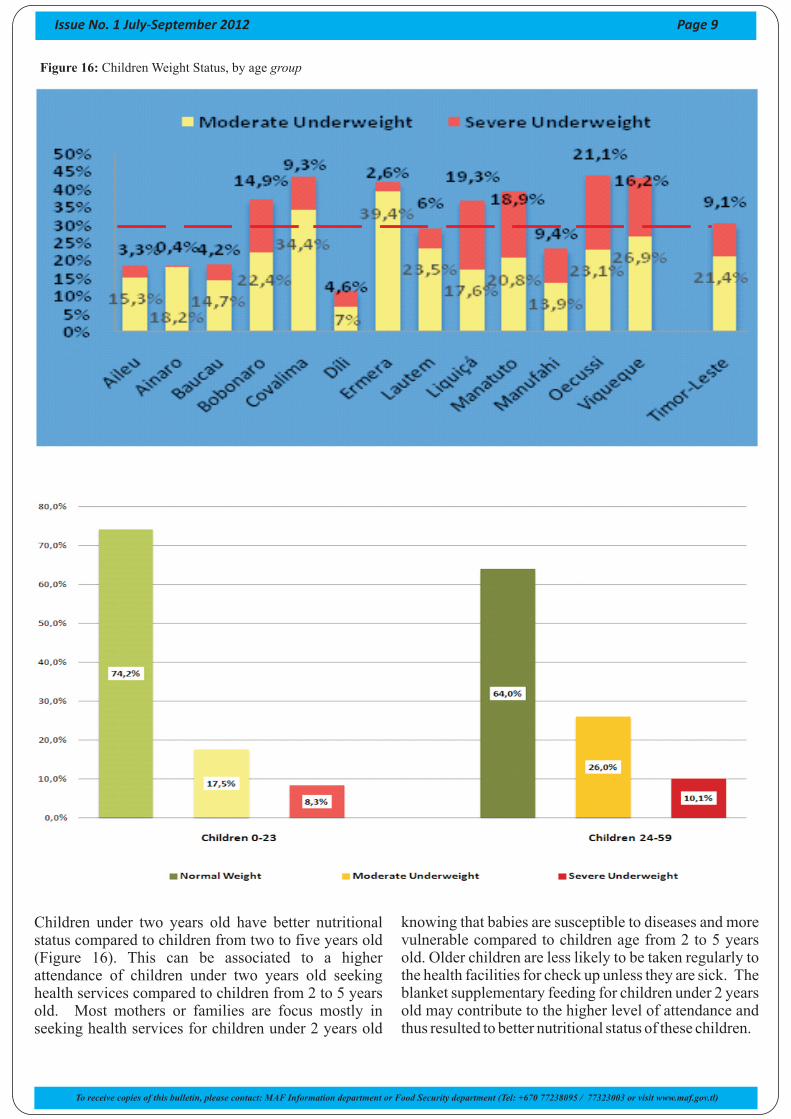
he prevalence of underweight (children with low weight for their age) during the second Tquarter of 2012 is 30.5%, which is less than
what was reported in the first quarter (34.2%). Both the percentage of children under 5 years old with moderate and severe underweight are reflecting a trend towards the improvement of the nutritional status since quarter 1, from 23.7% to 21.4% and from 10.5% to 9.1% respectively.
From quarter 1 to quarter 2 of 2012, the general trend was towards a decrease in underweight in most districts. In District Covalima there was a small increase on the moderate underweight which can be justified by a decrease on severe underweight, although in Oecusse district severe underweight increased by2.5%. Liquiça still remains as the district with a higher percentage of severely underweight compared to moderate underweight (Figure 15). Liquica is also one of the districts with the highest rice production deficit but with some maize surplus.
To receive copies of this bulletin, please contact: MAF Information department or Food Security department (Tel: +670 77238095 / 77323003 or visit www.maf.gov.tl)
Nutrition and health
Total Maize Requirement
Issue No. 1 July-September 2012 Page 9
Figure 16: Children Weight Status, by age group
Children under two years old have better nutritional status compared to children from two to five years old (Figure 16). This can be associated to a higher attendance of children under two years old seeking health services compared to children from 2 to 5 years old. Most mothers or families are focus mostly in seeking health services for children under 2 years old
knowing that babies are susceptible to diseases and more vulnerable compared to children age from 2 to 5 years old. Older children are less likely to be taken regularly to the health facilities for check up unless they are sick. The blanket supplementary feeding for children under 2 years old may contribute to the higher level of attendance and thus resulted to better nutritional status of these children.
To receive copies of this bulletin, please contact: MAF Information department or Food Security department (Tel: +670 77238095 / 77323003 or visit www.maf.gov.tl)