8/6/2019 TiO2 Deactivation During Gas-phase
http://slidepdf.com/reader/full/tio2-deactivation-during-gas-phase 1/12
Catalysis Today 76 (2002) 259–270
TiO2 deactivation during gas-phasephotocatalytic oxidation of ethanol
Eva Piera, José A. Ayllón, Xavier Doménech, José Peral∗
Departament de Quı́mica, Edifici Cn, Universitat Autònoma de Barcelona, 08193 Bellaterra (Cerdanyola del Vallès), Spain
Abstract
The deactivation of TiO2 Degussa P25 during the gas-phase photocatalytic oxidation of ethanol has been studied. Water
vapor plays a clear competitive role for surface sites adsorption, thus hampering the ethanol photo-oxidation. Dark adsorption
of ethanol on a fresh catalyst shows a Langmuirian behavior with the formation of a monolayer of adsorbate. Dark adsorption
in a TiO2 surface that has been used in consecutive photocatalytic experiments of ethanol degradation gives non-Langmuirian
isotherms, indicating the existence of noticeable changes of the catalyst surface structure. After several irradiations the catalyst
activity decreases. Such deactivation has been investigated, observing that the rate constant of ethanol and acetaldehyde (its
main degradation product) oxidation decreases with irradiation time. Several surface treatments have been studied in order to
find suitable procedures for catalytic activity recovery, but regular decay of activity is always observed after every treatment.
© 2002 Elsevier Science B.V. All rights reserved.
Keywords: TiO2; Photocatalysis; Ethanol
1. Introduction
The gas-phase photocatalytic oxidation of organic
contaminants is a subject of current interest due to its
potential for removal of low concentration pollutants
in slightly contaminated enclosed atmospheres (closed
intelligent buildings, factory buildings, especially en-
closed atmospheres, etc.). Previous work can be found
where the advantages and drawbacks of the photocat-alytic technique are highlighted, especially when com-
pared to photocatalytic processes in aqueous phase
[1–3]. In particular, (i) the reaction mechanisms in
the gas phase seem to be different to those that pre-
vail in aqueous systems, and (ii) relatively low levels
of UV light energy are needed for the occurrence of
∗ Corresponding author. Tel.: +34-93-581-2772;
fax: +34-93-581-2920.
E-mail address: [email protected] (J. Peral).
gas-phase processes, in contrast to reactions in water
[4]. In the gas phase, decomposition rates have been
found extremely high, making the technique very use-
ful for practical applications [1,5–7]. Gas-phase re-
actions also allow the direct application of analytical
tools to monitor the composition, structure and elec-
tronic states of substrate and adsorbates, and hence,
reaction mechanisms could be directly elucidated [8].
Jardim et al. [9] have mentioned additional advan-tages: (a) the diffusion of reagents and products is fa-
vored; (b) HO• scavengers present in water phase such
chlorides or alkalinity do not interfere; (c) electron
scavengers such as O2 are rarely limiting; (d) photons
absorbed by air are low.
Despite all these advantages gas-phase photocataly-
sis presents an important drawback. While in aqueous
phase water helps to remove reaction intermediates
and reaction products from the catalyst surface (spe-
cially those compounds of polar character), in gas
0920-5861/02/$ – see front matter © 2002 Elsevier Science B.V. All rights reserved.
P I I : S 0 9 2 0 - 5 8 6 1 ( 0 2 ) 0 0 2 2 4 - 9
8/6/2019 TiO2 Deactivation During Gas-phase
http://slidepdf.com/reader/full/tio2-deactivation-during-gas-phase 2/12
260 E. Piera et al. / Catalysis Today 76 (2002) 259–270
phase these species tend to accumulate in the sur-
face causing the deactivation of the catalyst. This
phenomenon has already been elegantly described
by Sauer and Ollis [10] and in other previous works[11–13]. Thus gas-phase TiO2 deactivation needs
to be studied in detail if the technique is to be of
practical application.
In the present paper deactivation of TiO2 Degussa
P25 during the photocatalytic degradation of ethanol
is studied and several procedures of catalyst activity
recovery are examined.
2. Experimental
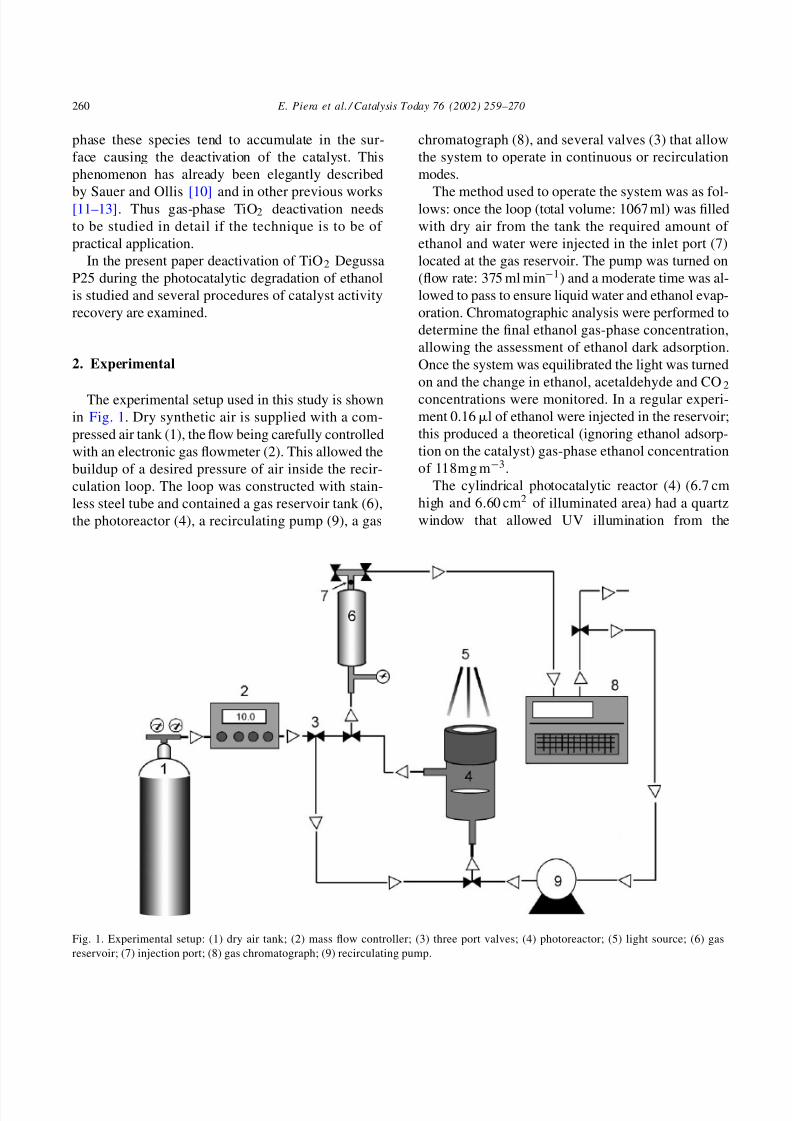
The experimental setup used in this study is shown
in Fig. 1. Dry synthetic air is supplied with a com-
pressed air tank (1), the flow being carefully controlled
with an electronic gas flowmeter (2). This allowed the
buildup of a desired pressure of air inside the recir-
culation loop. The loop was constructed with stain-
less steel tube and contained a gas reservoir tank (6),
the photoreactor (4), a recirculating pump (9), a gas
Fig. 1. Experimental setup: (1) dry air tank; (2) mass flow controller; (3) three port valves; (4) photoreactor; (5) light source; (6) gas
reservoir; (7) injection port; (8) gas chromatograph; (9) recirculating pump.
chromatograph (8), and several valves (3) that allow
the system to operate in continuous or recirculation
modes.
The method used to operate the system was as fol-lows: once the loop (total volume: 1067 ml) was filled
with dry air from the tank the required amount of
ethanol and water were injected in the inlet port (7)
located at the gas reservoir. The pump was turned on
(flow rate: 375 ml min−1) and a moderate time was al-
lowed to pass to ensure liquid water and ethanol evap-
oration. Chromatographic analysis were performed to
determine the final ethanol gas-phase concentration,
allowing the assessment of ethanol dark adsorption.
Once the system was equilibrated the light was turned
on and the change in ethanol, acetaldehyde and CO2
concentrations were monitored. In a regular experi-
ment 0.16l of ethanol were injected in the reservoir;
this produced a theoretical (ignoring ethanol adsorp-
tion on the catalyst) gas-phase ethanol concentration
of 118mg m−3.
The cylindrical photocatalytic reactor (4) (6.7 cm
high and 6.60 cm2 of illuminated area) had a quartz
window that allowed UV illumination from the
8/6/2019 TiO2 Deactivation During Gas-phase
http://slidepdf.com/reader/full/tio2-deactivation-during-gas-phase 3/12
E. Piera et al. / Catalysis Today 76 (2002) 259–270 261
top. An amount of 10.7 mg of the powdered catalyst
was spread on top of an attached fritted glass plate
perpendicular to the light beam. The inlet and outlet
ports were placed in a way that the gas was forcedto cross the catalyst film. The photoreactor is similar
to the one employed by Peral and Ollis [11]. A 80 W
Friolite HB medium pressure mercury lamp was used
as light source (5); the irradiation energy arriving at
the top of the catalyst was 143.5W cm2, measured
with a UV radiometer (Lutron UVA 365) centered at
365 nm.
The gas-phase composition was monitored by us-
ing a gas chromatograph (8) (Varian Star 3400 Cx)
equipped with a Porapack Q column and two detectors:
a flame ionization detector (FID) used to follow the
concentration of ethanol and acetaldehyde, and a ther-
mal conductivity detector (TCD) used to follow con-
centrations of CO2 and H2O. The detection of acetic
acid was carried out by solid–liquid extraction and a
consequent GC–MS analysis with a HP 6890 gas an-
alyzer equipped with a HP5 (5% phenyl) column and
connected to a HP 5973 mass spectrometer.
The ethanol used in the experiments was Panreac
(more than 99.8% purity with a maximum water con-
tent of 0.02%).Thirty three percent of H2O2 aqueous
solutions (Panreac) were used in the activity recovery
experiments. The water injected was of Milli-Q grade.The TiO2 used was Degussa P25 (80% anatase, 20%
rutile, BET surface area of 59.1 m2 g−1, average par-
ticle size of 27 nm).
3. Results and discussion
The photo-oxidation of gas-phase ethanol in pres-
ence and absence of water vapor was carried out in or-
der to ascertain the effect that water concentration has
on the reaction rate. Around 118 mg m
−3
of ethanolwere injected in the gas reservoir, the gas reached
dark adsorption equilibrium with the fresh catalyst
surface (10.7 mg TiO2) leaving a gas-phase ethanol
concentration of 48 mg m−3. Thus, 0.119 mg m−2 of
ethanol adsorbed onto the TiO2 surface. Once the dark
adsorption equilibrium was reached light was turned
on and the ethanol concentration decreased with ir-
radiation time. Sauer and Ollis [14] have identified
acetaldehyde, formaldehyde and CO2 as intermediate
and reaction products of ethanol photo-oxidation, and
have justified the presence of acetic acid and formic
acid with a theoretical kinetic network model, while
Nimlos et al. [15] and Muggli et al. [16] have identified
acetaldehyde, formaldehyde, acetic acid and formicacid as intermediate products for the same photocat-
alytic process. Due to experimental limitations only
gas-phase acetaldehyde and CO2 have been quanti-
tatively detected in the present work. A solid–liquid
extraction (TiO2–water) of the used TiO2 catalyst and
a GC–MS analysis of the liquid phase revealed the
presence of acetic acid adsorbed on the TiO2 surface.
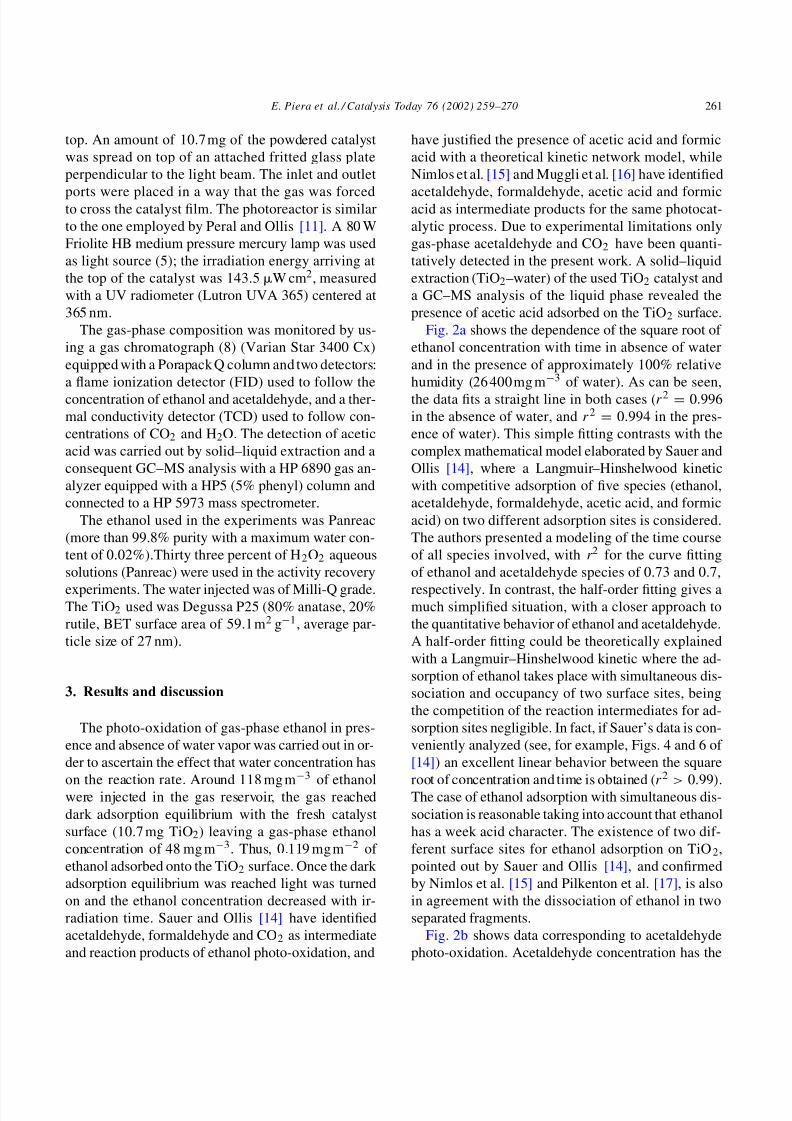
Fig. 2a shows the dependence of the square root of
ethanol concentration with time in absence of water
and in the presence of approximately 100% relative
humidity (26 400 mg m−3 of water). As can be seen,
the data fits a straight line in both cases (r2 = 0.996
in the absence of water, and r2 = 0.994 in the pres-
ence of water). This simple fitting contrasts with the
complex mathematical model elaborated by Sauer and
Ollis [14], where a Langmuir–Hinshelwood kinetic
with competitive adsorption of five species (ethanol,
acetaldehyde, formaldehyde, acetic acid, and formic
acid) on two different adsorption sites is considered.
The authors presented a modeling of the time course
of all species involved, with r 2 for the curve fitting
of ethanol and acetaldehyde species of 0.73 and 0.7,
respectively. In contrast, the half-order fitting gives amuch simplified situation, with a closer approach to
the quantitative behavior of ethanol and acetaldehyde.
A half-order fitting could be theoretically explained
with a Langmuir–Hinshelwood kinetic where the ad-
sorption of ethanol takes place with simultaneous dis-
sociation and occupancy of two surface sites, being
the competition of the reaction intermediates for ad-
sorption sites negligible. In fact, if Sauer’s data is con-
veniently analyzed (see, for example, Figs. 4 and 6 of
[14]) an excellent linear behavior between the square
root of concentration and time is obtained (r
2
> 0.99).The case of ethanol adsorption with simultaneous dis-
sociation is reasonable taking into account that ethanol
has a week acid character. The existence of two dif-
ferent surface sites for ethanol adsorption on TiO2,
pointed out by Sauer and Ollis [14], and confirmed
by Nimlos et al. [15] and Pilkenton et al. [17], is also
in agreement with the dissociation of ethanol in two
separated fragments.
Fig. 2b shows data corresponding to acetaldehyde
photo-oxidation. Acetaldehyde concentration has the
8/6/2019 TiO2 Deactivation During Gas-phase
http://slidepdf.com/reader/full/tio2-deactivation-during-gas-phase 4/12
262 E. Piera et al. / Catalysis Today 76 (2002) 259–270
Fig. 2. Square root of ethanol (a) and acetaldehyde (b) concentrations vs. time for experiments in the absence () and presence () of
water (118 mg m3 of ethanol, and 26 400mg m3 of water were injected).
typical dependence with time expected for a reaction
intermediate (see Fig. 4), going from zero to a max-
imum value and again to zero. The data shown in
Fig. 2b corresponds to acetaldehyde concentration af-
ter passing the maximum in the same experiment of
ethanol photo-oxidation of Fig. 2a. Again, an excel-
lent linear regression (r2 = 0.997) between the square
root of concentration and time is obtained. However,
for acetaldehyde it is difficult to discuss the results
in terms of simultaneous adsorption and dissociation,
since the hydrogen of the aldehyde group is not acidic.
Muggli et al. [18] studied the photo-oxidation of ac-
etaldehyde and they assumed a first-order kinetics of
acetaldehyde removal.
Table 1 contains the reaction rate constants of
ethanol and acetaldehyde degradation considering a
8/6/2019 TiO2 Deactivation During Gas-phase
http://slidepdf.com/reader/full/tio2-deactivation-during-gas-phase 5/12
E. Piera et al. / Catalysis Today 76 (2002) 259–270 263
Table 1
Reaction rate constants (k ) of ethanol and acetaldehyde disappear-
ance in presence and absence of watera
Relativehumidity (%) Ethanol k (mgm−3 min−1)0.5 Acetaldehyde k (mgm−3 min−1)0.5
0 0.086 ± 0.012 0.017 ± 0.001
100 0.0106 ± 0.0008 0.00118 ± 0.00008
a Constants deduced from data in Fig. 2.
half-order reaction, both, in presence and absence of
water. As can be seen, a 100% humidity clearly makes
the process more difficult, while the ethanol degrada-
tion is inherently faster than the acetaldehyde one.
The presence of water clearly deactivates the
photo-oxidation of ethanol and acetaldehyde. In
steady-state experiments, Falconer and Magrini-Bair
[19] have shown that water displaces both ethanol
and acetaldehyde from the catalyst surface. Thus, the
slow decrease of both reactant concentration can be
attributed to adsorption competition. Since the main
interest of this work was to study catalyst surface
deactivation during ethanol photo-oxidation, the de-
cision was taken not to inject water in the original
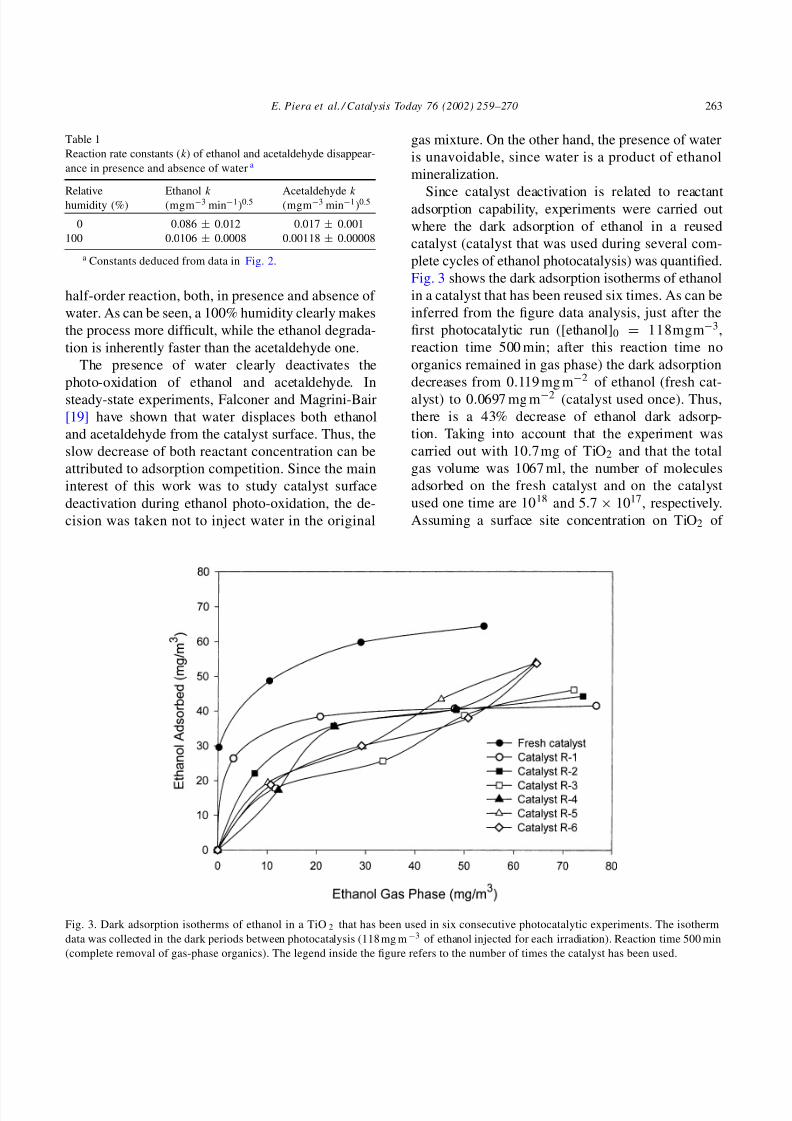
Fig. 3. Dark adsorption isotherms of ethanol in a TiO 2 that has been used in six consecutive photocatalytic experiments. The isotherm
data was collected in the dark periods between photocatalysis (118 mg m−3 of ethanol injected for each irradiation). Reaction time 500 min
(complete removal of gas-phase organics). The legend inside the figure refers to the number of times the catalyst has been used.
gas mixture. On the other hand, the presence of water
is unavoidable, since water is a product of ethanol
mineralization.
Since catalyst deactivation is related to reactantadsorption capability, experiments were carried out
where the dark adsorption of ethanol in a reused
catalyst (catalyst that was used during several com-
plete cycles of ethanol photocatalysis) was quantified.
Fig. 3 shows the dark adsorption isotherms of ethanol
in a catalyst that has been reused six times. As can be
inferred from the figure data analysis, just after the
first photocatalytic run ([ethanol]0 = 118mgm−3,
reaction time 500 min; after this reaction time no
organics remained in gas phase) the dark adsorption
decreases from 0.119 mg m−2 of ethanol (fresh cat-
alyst) to 0.0697 mg m−2 (catalyst used once). Thus,
there is a 43% decrease of ethanol dark adsorp-
tion. Taking into account that the experiment was
carried out with 10.7 mg of TiO2 and that the total
gas volume was 1067 ml, the number of molecules
adsorbed on the fresh catalyst and on the catalyst
used one time are 1018 and 5.7 × 10¹⁷, respectively.
Assuming a surface site concentration on TiO2 of
8/6/2019 TiO2 Deactivation During Gas-phase
http://slidepdf.com/reader/full/tio2-deactivation-during-gas-phase 6/12
264 E. Piera et al. / Catalysis Today 76 (2002) 259–270
5.0× 10¹⁴ sites cm−2 [20], the total available number
of sites is 2.5 × 10¹⁸, which means that, there are
2.5 more sites than ethanol molecules adsorbed on
the saturated fresh catalyst. Considering that ethanolseems to need two adsorption sites in order to partic-
ipate in a dissociative adsorption, 80% of the surface
sites would be covered during the reactant adsorption.
The remaining 20% would probably be occupied by
water molecules, or it can just be due to uncertainties
on the total number of surface sites available.
For the rest of the adsorption experiments, with the
catalyst used up to six times in photocatalytic exper-
iments, no Langmuirian isotherms are observed. The
shape of these isotherms seems to indicate that the cat-
alyst surface undergoes profound modification during
photocatalysis. Since a Langmuirian (monolayer) ad-
sorption is observed for the fresh catalyst and the cat-
alyst used just one time, it seems reasonable to think
that ethanol can adsorb on top of some of the organic
deposits responsible for deactivation after several runs.
Peral and Ollis [13] have suggested that the species re-
sponsible for permanent deactivation of the TiO2 are
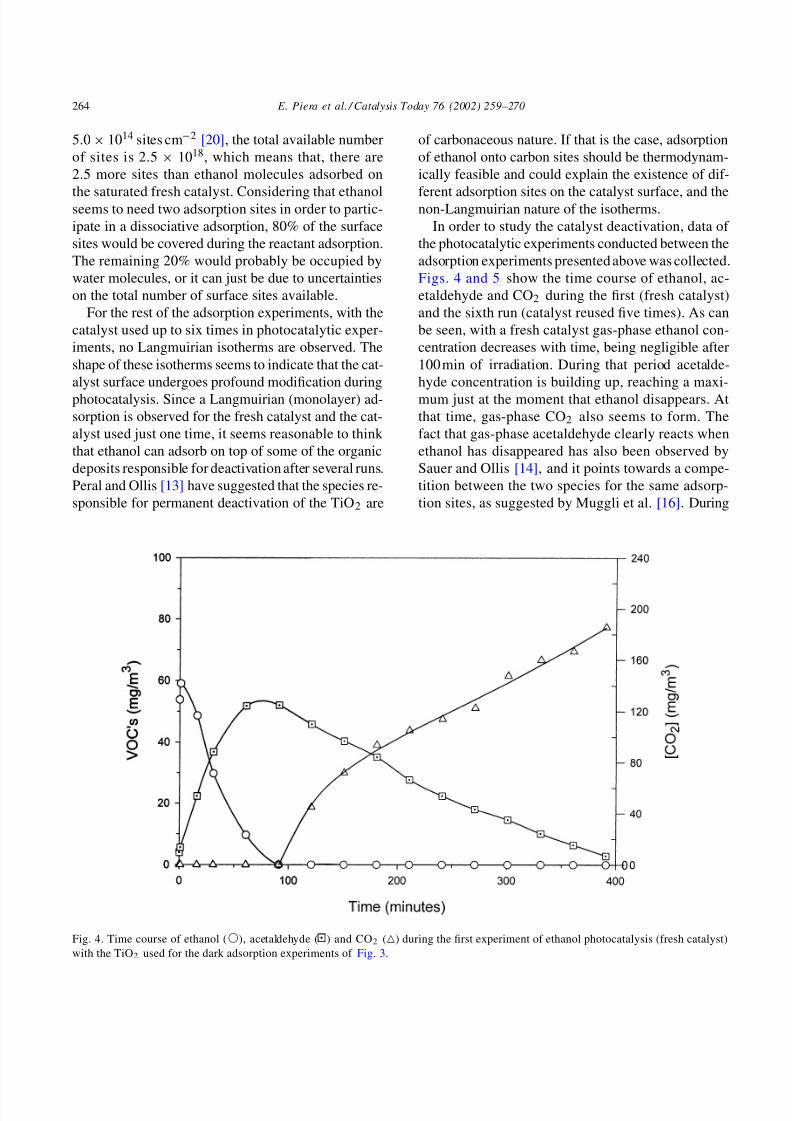
Fig. 4. Time course of ethanol (), acetaldehyde ( ) and CO2 () during the first experiment of ethanol photocatalysis (fresh catalyst)
with the TiO2 used for the dark adsorption experiments of Fig. 3.
of carbonaceous nature. If that is the case, adsorption
of ethanol onto carbon sites should be thermodynam-
ically feasible and could explain the existence of dif-
ferent adsorption sites on the catalyst surface, and thenon-Langmuirian nature of the isotherms.
In order to study the catalyst deactivation, data of
the photocatalytic experiments conducted between the
adsorption experiments presented above was collected.
Figs. 4 and 5 show the time course of ethanol, ac-
etaldehyde and CO2 during the first (fresh catalyst)
and the sixth run (catalyst reused five times). As can
be seen, with a fresh catalyst gas-phase ethanol con-
centration decreases with time, being negligible after
100 min of irradiation. During that period acetalde-
hyde concentration is building up, reaching a maxi-
mum just at the moment that ethanol disappears. At
that time, gas-phase CO2 also seems to form. The
fact that gas-phase acetaldehyde clearly reacts when
ethanol has disappeared has also been observed by
Sauer and Ollis [14], and it points towards a compe-
tition between the two species for the same adsorp-
tion sites, as suggested by Muggli et al. [16]. During
8/6/2019 TiO2 Deactivation During Gas-phase
http://slidepdf.com/reader/full/tio2-deactivation-during-gas-phase 7/12
E. Piera et al. / Catalysis Today 76 (2002) 259–270 265
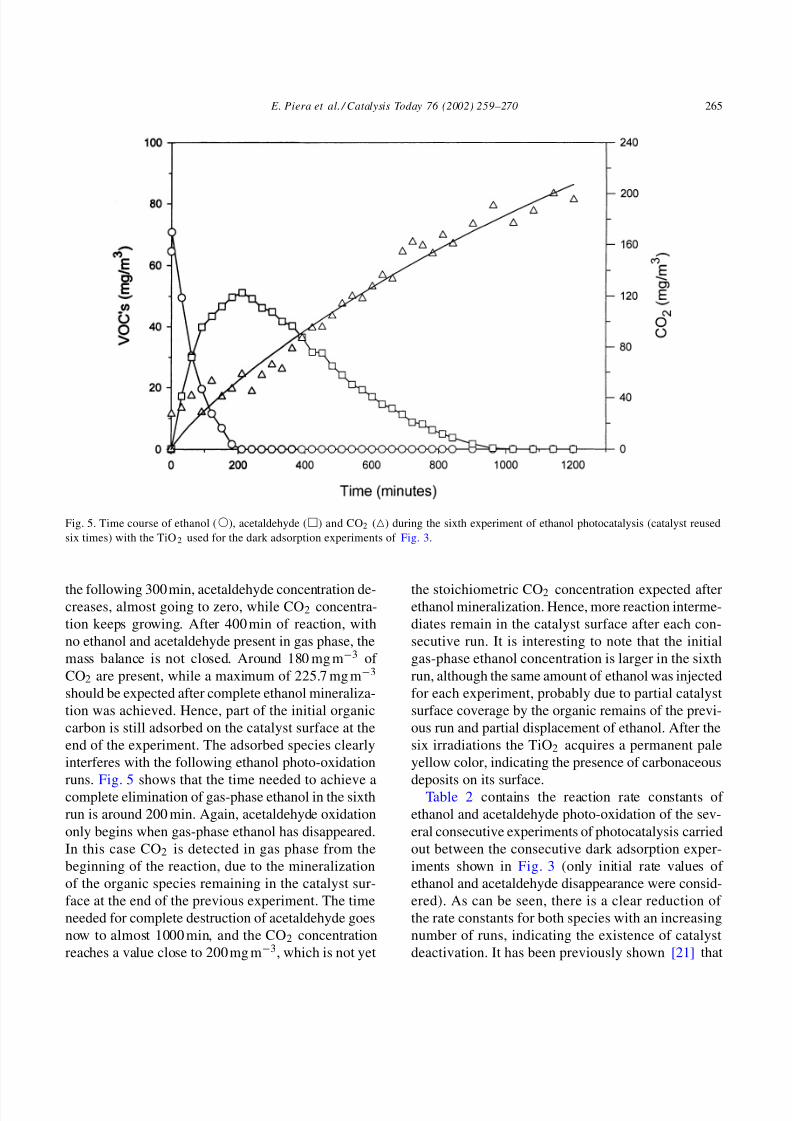
Fig. 5. Time course of ethanol (), acetaldehyde () and CO2 () during the sixth experiment of ethanol photocatalysis (catalyst reused
six times) with the TiO2 used for the dark adsorption experiments of Fig. 3.
the following 300 min, acetaldehyde concentration de-creases, almost going to zero, while CO2 concentra-
tion keeps growing. After 400 min of reaction, with
no ethanol and acetaldehyde present in gas phase, the
mass balance is not closed. Around 180 mg m−3 of
CO2 are present, while a maximum of 225.7 mg m−3
should be expected after complete ethanol mineraliza-
tion was achieved. Hence, part of the initial organic
carbon is still adsorbed on the catalyst surface at the
end of the experiment. The adsorbed species clearly
interferes with the following ethanol photo-oxidation
runs. Fig. 5 shows that the time needed to achieve acomplete elimination of gas-phase ethanol in the sixth
run is around 200 min. Again, acetaldehyde oxidation
only begins when gas-phase ethanol has disappeared.
In this case CO2 is detected in gas phase from the
beginning of the reaction, due to the mineralization
of the organic species remaining in the catalyst sur-
face at the end of the previous experiment. The time
needed for complete destruction of acetaldehyde goes
now to almost 1000 min, and the CO2 concentration
reaches a value close to 200 mg m−3, which is not yet
the stoichiometric CO2 concentration expected afterethanol mineralization. Hence, more reaction interme-
diates remain in the catalyst surface after each con-
secutive run. It is interesting to note that the initial
gas-phase ethanol concentration is larger in the sixth
run, although the same amount of ethanol was injected
for each experiment, probably due to partial catalyst
surface coverage by the organic remains of the previ-
ous run and partial displacement of ethanol. After the
six irradiations the TiO2 acquires a permanent pale
yellow color, indicating the presence of carbonaceous
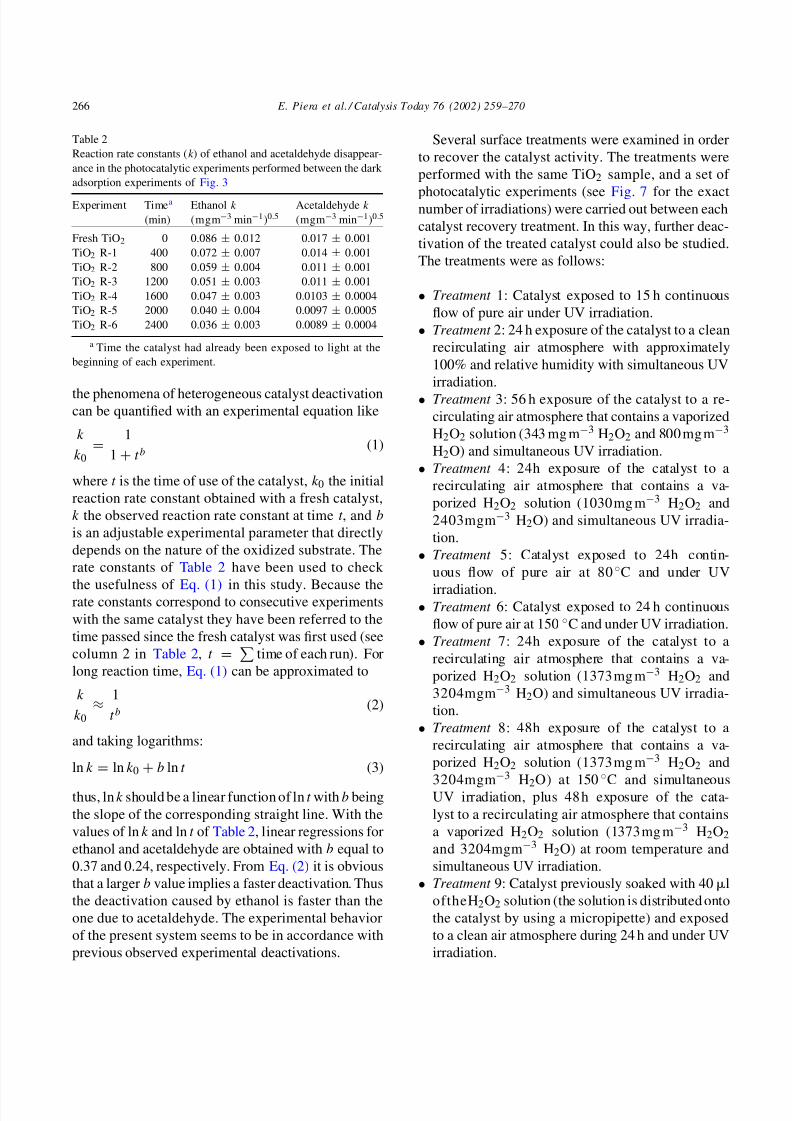
deposits on its surface.Table 2 contains the reaction rate constants of
ethanol and acetaldehyde photo-oxidation of the sev-
eral consecutive experiments of photocatalysis carried
out between the consecutive dark adsorption exper-
iments shown in Fig. 3 (only initial rate values of
ethanol and acetaldehyde disappearance were consid-
ered). As can be seen, there is a clear reduction of
the rate constants for both species with an increasing
number of runs, indicating the existence of catalyst
deactivation. It has been previously shown [21] that
8/6/2019 TiO2 Deactivation During Gas-phase
http://slidepdf.com/reader/full/tio2-deactivation-during-gas-phase 8/12
266 E. Piera et al. / Catalysis Today 76 (2002) 259–270
Table 2
Reaction rate constants (k ) of ethanol and acetaldehyde disappear-
ance in the photocatalytic experiments performed between the dark
adsorption experiments of Fig. 3
Experiment Timea
(min)
Ethanol k
(mgm−3 min−1)0.5
Acetaldehyde k
(mgm−3 min−1)0.5
Fresh TiO2 0 0.086 ± 0.012 0.017 ± 0.001
TiO2 R-1 400 0.072 ± 0.007 0.014 ± 0.001
TiO2 R-2 800 0.059 ± 0.004 0.011 ± 0.001
TiO2 R-3 1200 0.051 ± 0.003 0.011 ± 0.001
TiO2 R-4 1600 0.047 ± 0.003 0.0103 ± 0.0004
TiO2 R-5 2000 0.040 ± 0.004 0.0097 ± 0.0005
TiO2 R-6 2400 0.036 ± 0.003 0.0089 ± 0.0004
a Time the catalyst had already been exposed to light at the
beginning of each experiment.
the phenomena of heterogeneous catalyst deactivationcan be quantified with an experimental equation like
k
k0=
1
1+ t b(1)
where t is the time of use of the catalyst, k 0 the initial
reaction rate constant obtained with a fresh catalyst,k the observed reaction rate constant at time t , and b
is an adjustable experimental parameter that directly
depends on the nature of the oxidized substrate. The
rate constants of Table 2 have been used to check
the usefulness of Eq. (1) in this study. Because therate constants correspond to consecutive experiments
with the same catalyst they have been referred to the
time passed since the fresh catalyst was first used (see
column 2 in Table 2, t =
time of each run). For
long reaction time, Eq. (1) can be approximated to
k
k0≈
1
t b(2)
and taking logarithms:
ln k = ln k0 + b ln t (3)
thus, ln k should be a linear function of ln t with b being
the slope of the corresponding straight line. With the
values of ln k and ln t of Table 2, linear regressions for
ethanol and acetaldehyde are obtained with b equal to
0.37 and 0.24, respectively. From Eq. (2) it is obvious
that a larger b value implies a faster deactivation. Thus
the deactivation caused by ethanol is faster than the
one due to acetaldehyde. The experimental behavior
of the present system seems to be in accordance with
previous observed experimental deactivations.
Several surface treatments were examined in order
to recover the catalyst activity. The treatments were
performed with the same TiO2 sample, and a set of
photocatalytic experiments (see Fig. 7 for the exactnumber of irradiations) were carried out between each
catalyst recovery treatment. In this way, further deac-
tivation of the treated catalyst could also be studied.
The treatments were as follows:
• Treatment 1: Catalyst exposed to 15 h continuous
flow of pure air under UV irradiation.• Treatment 2: 24 h exposure of the catalyst to a clean
recirculating air atmosphere with approximately
100% and relative humidity with simultaneous UV
irradiation.• Treatment 3: 56 h exposure of the catalyst to a re-
circulating air atmosphere that contains a vaporized
H2O2 solution (343 mg m−3 H2O2 and 800 mg m−3
H2O) and simultaneous UV irradiation.• Treatment 4: 24h exposure of the catalyst to a
recirculating air atmosphere that contains a va-
porized H2O2 solution (1030 mg m−3 H2O2 and
2403mgm−3 H2O) and simultaneous UV irradia-
tion.• Treatment 5: Catalyst exposed to 24h contin-
uous flow of pure air at 80◦C and under UV
irradiation.• Treatment 6: Catalyst exposed to 24 h continuous
flow of pure air at 150 ◦C and under UV irradiation.• Treatment 7: 24h exposure of the catalyst to a
recirculating air atmosphere that contains a va-
porized H2O2 solution (1373 mg m−3 H2O2 and
3204mgm−3 H2O) and simultaneous UV irradia-
tion.• Treatment 8: 48h exposure of the catalyst to a
recirculating air atmosphere that contains a va-
porized H2O2 solution (1373 mg m−3 H2O2 and
3204mgm
−3
H2O) at 150
◦
C and simultaneousUV irradiation, plus 48 h exposure of the cata-
lyst to a recirculating air atmosphere that contains
a vaporized H2O2 solution (1373 mg m−3 H2O2
and 3204mgm−3 H2O) at room temperature and
simultaneous UV irradiation.• Treatment 9: Catalyst previously soaked with 40l
oftheH2O2 solution (the solution is distributed onto
the catalyst by using a micropipette) and exposed
to a clean air atmosphere during 24 h and under UV
irradiation.
8/6/2019 TiO2 Deactivation During Gas-phase
http://slidepdf.com/reader/full/tio2-deactivation-during-gas-phase 9/12
E. Piera et al. / Catalysis Today 76 (2002) 259–270 267
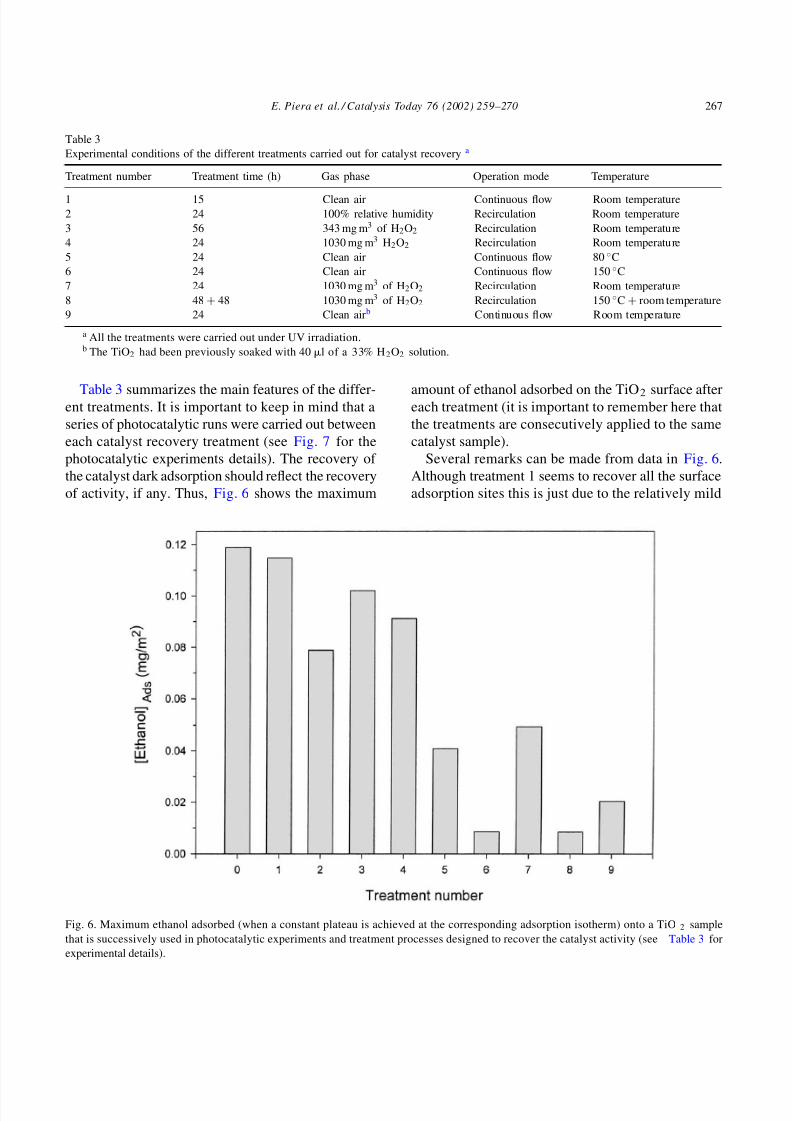
Table 3
Experimental conditions of the different treatments carried out for catalyst recovery a
Treatment number Treatment time (h) Gas phase Operation mode Temperature
1 15 Clean air Continuous flow Room temperature2 24 100% relative humidity Recirculation Room temperature
3 56 343 mg m3 of H2O2 Recirculation Room temperature
4 24 1030 mg m3 H2O2 Recirculation Room temperature
5 24 Clean air Continuous flow 80 ◦C
6 24 Clean air Continuous flow 150 ◦C
7 24 1030 mg m3 of H2O2 Recirculation Room temperature
8 48+ 48 1030 mg m3 of H2O2 Recirculation 150 ◦C+ room temperature
9 24 Clean airb Continuous flow Room temperature
a All the treatments were carried out under UV irradiation.b The TiO2 had been previously soaked with 40l of a 33% H2O2 solution.
Table 3 summarizes the main features of the differ-ent treatments. It is important to keep in mind that a
series of photocatalytic runs were carried out between
each catalyst recovery treatment (see Fig. 7 for the
photocatalytic experiments details). The recovery of
the catalyst dark adsorption should reflect the recovery
of activity, if any. Thus, Fig. 6 shows the maximum
Fig. 6. Maximum ethanol adsorbed (when a constant plateau is achieved at the corresponding adsorption isotherm) onto a TiO 2 sample
that is successively used in photocatalytic experiments and treatment processes designed to recover the catalyst activity (see Table 3 for
experimental details).
amount of ethanol adsorbed on the TiO2 surface aftereach treatment (it is important to remember here that
the treatments are consecutively applied to the same
catalyst sample).
Several remarks can be made from data in Fig. 6.
Although treatment 1 seems to recover all the surface
adsorption sites this is just due to the relatively mild
8/6/2019 TiO2 Deactivation During Gas-phase
http://slidepdf.com/reader/full/tio2-deactivation-during-gas-phase 10/12
268 E. Piera et al. / Catalysis Today 76 (2002) 259–270
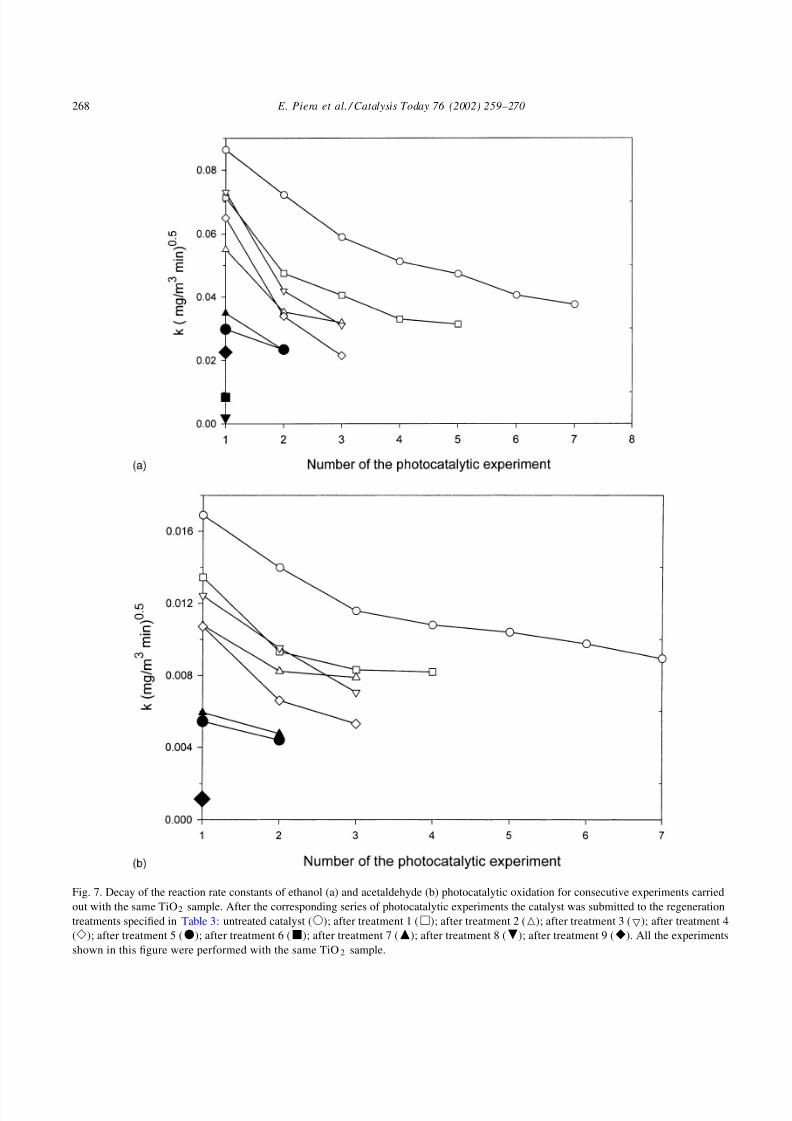
Fig. 7. Decay of the reaction rate constants of ethanol (a) and acetaldehyde (b) photocatalytic oxidation for consecutive experiments carried
out with the same TiO2 sample. After the corresponding series of photocatalytic experiments the catalyst was submitted to the regeneration
treatments specified in Table 3: untreated catalyst (); after treatment 1 (); after treatment 2 (); after treatment 3 (); after treatment 4
(); after treatment 5 (); after treatment 6 (); after treatment 7 (); after treatment 8 (); after treatment 9 (). All the experiments
shown in this figure were performed with the same TiO2 sample.
8/6/2019 TiO2 Deactivation During Gas-phase
http://slidepdf.com/reader/full/tio2-deactivation-during-gas-phase 11/12
E. Piera et al. / Catalysis Today 76 (2002) 259–270 269
deactivation that the catalyst had suffered at that time.
Several cycles of catalyst use and treatment with this
procedure show continuous decrease of ethanol ad-
sorption (data not shown). The combination of cleanair and irradiation only partially recovers the surface
activity, as shown by Peral and Ollis [11]. Although
water adsorption is mainly reversible, the presence of
water during treatment 2 clearly hampers the surface
recovery, due to the role of water as competitor for
surface sites. Temperature is also opposed to the re-
covery of surface adsorption and as can be seen, the
catalyst treated at 150 ◦C (treatment 6) almost com-
pletely losses its ethanol adsorption capability. This
can only be explained by considering that tempera-
ture helps the thermocatalytic conversion of some of
the intermediates remaining in the surface after photo-
catalysis (e.g. acetaldehyde) to a less volatile and thus,
more enduring and deactivating species (e.g. acetic
acid). In this way, temperature seems to accelerate the
process of formation of the carbonaceous deposits, a
process that on the other hand, appears to be unavoid-
able. The use of a relatively powerful oxidant like
H2O2 partially recovers the ethanol surface adsorp-
tion, but this is never the one observed for the fresh
catalyst. Treatment 4 uses a larger amount of oxidant,
but the adsorption recovery is lower than in treatment
3, indicating that catalyst surface deactivation cannotbe completely avoided. Treatment 9 supports this as-
sertion because it uses a more drastic approach: the
catalyst is wetted with a H2O2 solution, but the sur-
face recovery is only minor because the treatment is
the last one after the long series of deactivation and
recovery experiments.
The fact that the deactivation persists after the dif-
ferent treatments is clearly observed in Fig. 7 where
the reaction rate constant of consecutive experiments
of photocatalytic degradation of ethanol and acetalde-
hyde are shown. The catalyst treatments described inTable 3 and the consequent irradiation series of Fig. 7
were done with the same TiO2 sample. Even in those
cases where the catalyst activity recovery after surface
treatment is effective (e.g. after treatments 3, 4 and
7) the activity always decays in consecutive photocat-
alytic experiments. It is important to notice that the
activity decay of the TiO2 after treatment 1 is faster
than the decay observed for the fresh catalyst (com-
pare the initial slopes of the curves with open circles
() and open squares () in Fig. 7a and b). Also, the
first reaction rate constant after treatment 1 is clearly
lower than the first reaction rate constant with the fresh
catalyst, something that cause surprise since adsorp-
tion of ethanol in the fresh and the treated catalystis almost the same (as seen in Fig. 6 for treatment
0 and 1). There is a clear trend in the system reac-
tivity towards a complete passivation, no matter what
number and type of recovery treatment is applied. At
the end of the series of experiments the reaction rate
constants are almost zero for both ethanol and ac-
etaldehyde. Some treatments seem to produce a partial
activity recover.
In this sense the use of H2O2 (treatments 3, 4, 7 and
9) gives a noticeable increase of the first photocatalytic
reaction rate constant when compared to reaction rate
constant of the corresponding previous treatment, but
even in those cases the photocatalytic activity rapidly
decreases in consecutive irradiation experiments. All
the experimental evidence points toward the forma-
tion of surface species that are not easily removed
with the surface treatment procedures proposed in this
study.
4. Conclusions
The deactivation of TiO2 Degussa P25 duringgas-phase photocatalytic oxidation of ethanol has
been studied. Dark adsorption of ethanol onto a fresh
catalyst follows a Langmuirian isotherm, but the ad-
sorption features change when the catalyst sample
is reused in several photocatalytic runs. Changes on
the surface chemical nature are suggested by the ad-
sorption isotherm shapes, probably due to ethanol ad-
sorption onto the carbonaceous deposits responsible
for catalyst deactivation. Ethanol and acetaldehyde
disappearance have been found to follow a half-order
kinetics and the presence of water seriously hampersthe process. The deactivation process has been quan-
tified using an experimental equation. Several surface
treatments have been tested but it was always impos-
sible to completely recover the initial ethanol dark
adsorption and photocatalytic reactivity. The treat-
ment of the surface with temperatures between 80
and 150 ◦C is highly detrimental because it acceler-
ates the formation of the deactivating deposits. In any
case, the catalyst activity goes down no matter what
number and type of surface treatment were tried.
8/6/2019 TiO2 Deactivation During Gas-phase
http://slidepdf.com/reader/full/tio2-deactivation-during-gas-phase 12/12
270 E. Piera et al. / Catalysis Today 76 (2002) 259–270
Acknowledgements
The authors thank the Spanish Ministry of Science
and Technology (Project PB98-011) and the CYTEDnetwork VIII-G for supporting this study.
References
[1] E. Berman, J. Dong, in: W.W. Eckenfelder, A.R. Bowen,
J.A. Roth (Eds.), Proceedings of the Third International
Symposium on Chemical Oxidation: Technology for the
Nineties, Technomic Publishers, Chicago, 1993, pp. 183–189.
[2] J. Peral, X. Domènech, D.F. Ollis, J. Chem. Technol.
Biotechnol. 70 (1997) 117.
[3] R.M. Alberici, W.F. Jardim, Appl. Catal. B: Environ. 14
(1997) 55.[4] L.A. Dibble, G.B. Raupp, Environ. Sci. Technol. 26 (1992)
492.
[5] M. Murabayashi, K. Itoh, K. Togashi, K. Shiozawa, H.
Yamazaki, J. Adv. Oxid. Technol. 4 (1999) 71.
[6] S. Yamazaki-Nishida, K.J. Nagano, L.A. Phillips, S.
Cervera-March, M.A. Anderson, J. Photochem. Photobiol. A:
Chem. 70 (1993) 95.
[7] G.B. Raupp, C.T. Junio, Appl. Surf. Sci. 72 (1993) 321.
[8] J.C. Hemminger, R. Carr, G.A. Somorjai, Chem. Phys. Lett.
57 (1978) 100.
[9] W.F. Jardim, R.M. Alberici, M.M.K. Takiyama, C.P. Huang,
Hazard. Ind. Wastes 26 (1994) 230.[10] M.L. Sauer, D.F. Ollis, J. Catal. 163 (1996) 215.
[11] J. Peral, D.F. Ollis, J. Catal. 136 (1992) 554.
[12] J. Peral, D.F. Ollis, in: D.F. Ollis, H. Al-Ekabi (Eds.),
Photocatalytic Purification and Treatment of Water and Air,
Elsevier, Amsterdam, 1993, pp. 741–745.
[13] J. Peral, D.F. Ollis, J. Mol. Catal. 115 (1997) 347.
[14] M.L. Sauer, D.F. Ollis, J. Catal. 158 (1996) 570.
[15] M.R. Nimlos, E.J. Wolfrum, M.L. Brewer, J.A. Fennell, G.
Bintner, Environ. Sci. Technol. 30 (1996) 3102.
[16] D.S. Muggli, J.T. McCue, J.L. Falconer, J. Catal. 173 (1998)
470.
[17] S. Pilkenton, S. Hwang, D. Raftery, J. Phys. Chem. B 103
(1999) 11152.
[18] D.S. Muggli, K.H. Lowery, J.L. Falconer, J. Catal. 180 (1998)
111.
[19] J.L. Falconer, K.A. Magrini-Bair, J. Catal. 179 (1998) 171.
[20] L.P. Childs, D.F. Ollis, J. Catal. 66 (1980) 383.
[21] H.S. Fogler, Elements of Chemical Reaction Engineering,
Prentice-Hall, New York, 1986, pp. 273–274.