Poster Presentation Waters Technology Seminar - October, 1993 Poster #1 Systematic Development of Sanitization Protocols for a Chromatographic System Designed for Biotherapeutics Purifications Robert F. Burgoyne 1, George J. Vella 2, Mary Priest 3 & Kerry L. Roche 3 1Millipore Corporation, Waters Pharmaceutical Division 34 Maple Street, Milford, MA. 01757 U.S.A. 2Millipore Corporation, Analytical Division, 34 Maple Street, Milford, MA. 01757 U.S.A. 3Millipore Corporation, Process Division, 80 Ashby Road, Bedford, MA. 01730 U.S.A.
Transcript
Poster Presentation
Waters Technology Seminar - October, 1993
Poster #1
Systematic Development of SanitizationProtocols for a Chromatographic System
Designed for BiotherapeuticsPurifications
Robert F. Burgoyne 1, George J. Vella 2, Mary Priest 3& Kerry L. Roche 3
2Millipore Corporation, Analytical Division, 34 Maple Street,Milford, MA. 01757 U.S.A.
3Millipore Corporation, Process Division, 80 Ashby Road,Bedford, MA. 01730 U.S.A.
Abstract
The development of protein derived therapeutic drugs through theapplication of genetic engineering and biotechnolgy techniques hasresulted in the design of multi-step, multi-technology processes forproducing the target products. Considerable development time mustbe invested to optimize the fermentation, harvesting and purificationsteps to yield reproducible, high yield, economical products. Oncedeveloped, implementation of the procedures requires compre-hensive attention to Good Manufacturing Practices (GMP), GoodLaboratory Practices (GLP) and other guidelines specified byregulatory agencies. These guidelines address all aspects of theproduction process, including facility design, equipment selection,personnel training and process validation.
Many of the process requirements for product recovery andpurification are met by combinations of tangential flow filtration andchromatography separation techniques. Consequently, increasingemphasis is being placed on the development of separation tech-niques that meet the specifications for final product release. Keycomponents of the validation process for chromatographic separa-tions are equipment design and operation certification, columnpacking certification and standard operating procedures (SOP).
Clean-in-place procedures (CIP) become a part of the master methodand require validation as part of the entire process. Consequently,validation of CIP procedures requires definition of what "clean" is fora given process. Documentation of sanitization effectiveness, thechemical process of killing vegetative microbial cells, on microbialcontaminants is also necessary for certain types of equipment. It iscritical that the analytical techniques used in the validation exercisefor sanitization procedures are sensitive, accurate and reproducible.This article describes the extensive microbial challenge of a Waters TM
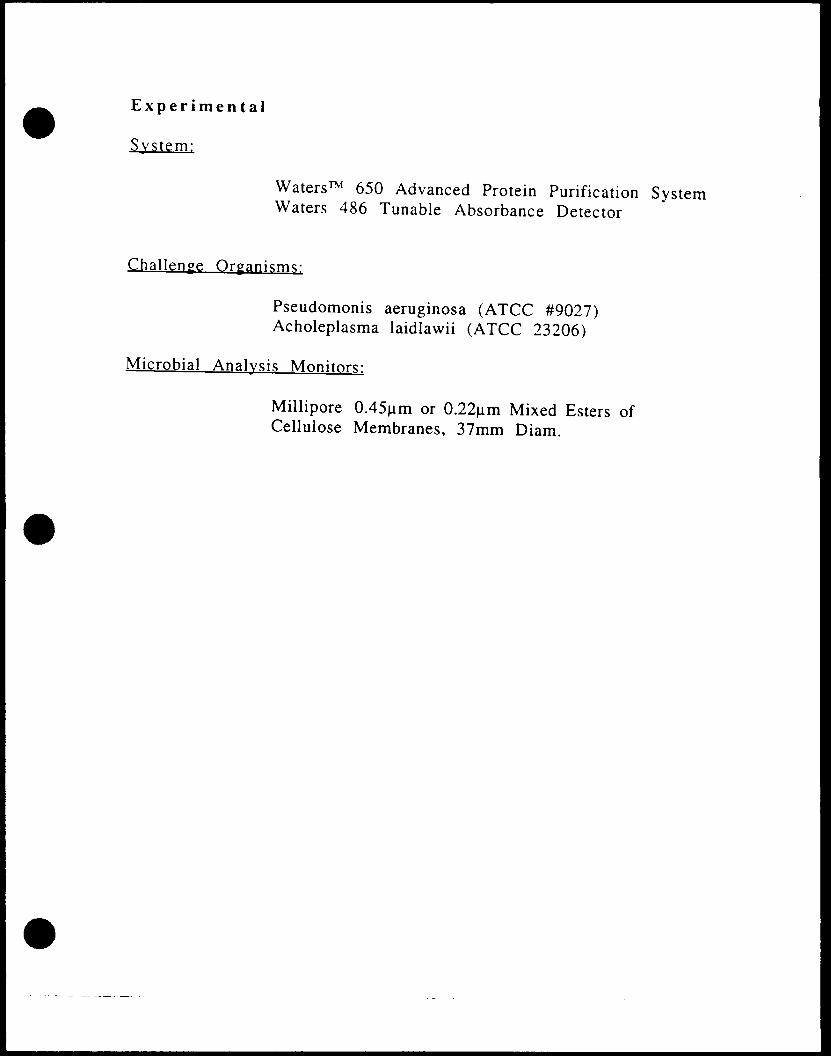
650 Advanced Protein Purification System and the effectiveness ofboth sodium hydroxide and ethanol solutions in achieving multilogreduction of microbial contamination. In addition, it describes the
application of a membrane filtration method for the highly sensitivemeasurement of microbial contamination in chromatographic eluents.
Millipore 0.45_m or 0.22_tm Mixed Esters ofCellulose Membranes, 37mm Diam.
Key Components of the Validation Process
• Equipment Design
• Operation Certification
• Column Packing Certification
• Standard Operating Procedures
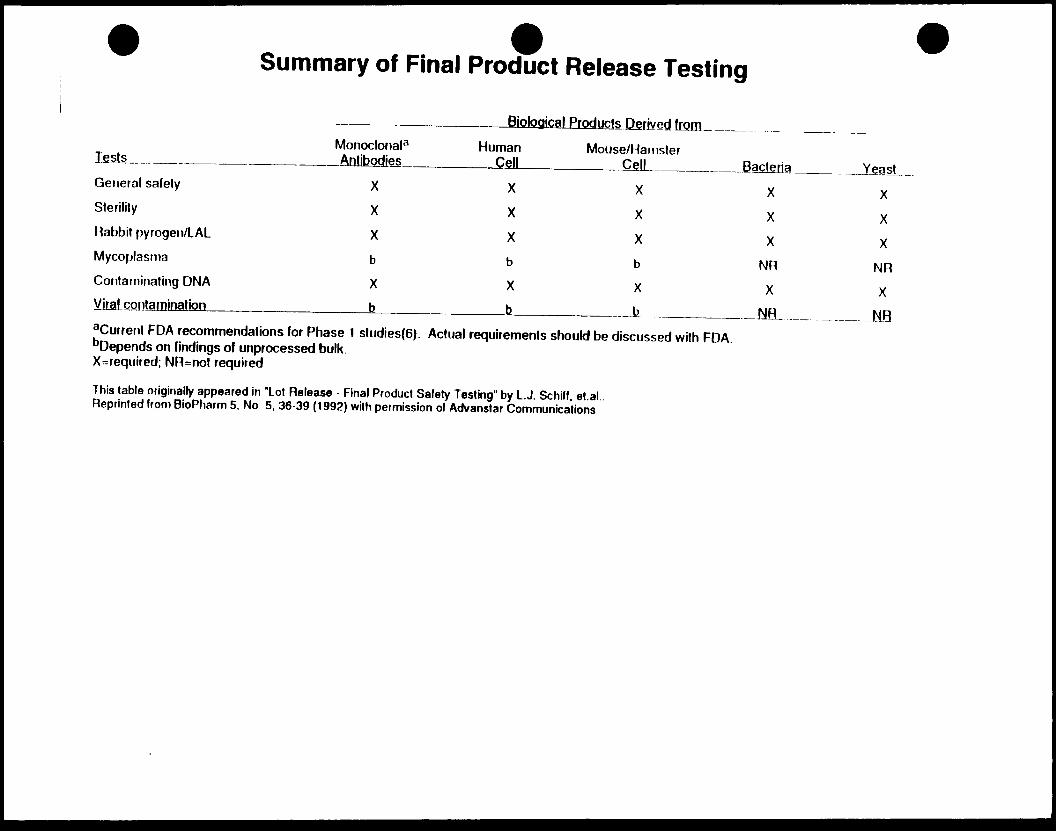
Summary of Final Product Release Testing
Biological ProductsDerLv_edfrom......
Monoclonala Human Mouse/HarvlslerTests Anlibodies Cell Cell Ua_c_L_ia_ Yeast
Gesleralsafely X X X X X
Sterilily X X X X X
rtabbil pyrogen/LAL X X X X X
Mycolulasma b b b NFI NR
CordaminatingDNA X X X X X
Viral c_9_l}taruination b b b El.l:]_ H_
aCurrerdFDA recommendations for Phase 1 studies(6). Actual requirements should be discussed with FDA.bDepends on findings of unprocessedbulk.X=required; NR=not required
This table originally appeared in "Lol Release - Final Producl Safely Testing" by L.J. Schifl. el.al..Reprinted from BioPharm 5, No. 5.36-39 (1992) with permission of Advanstar Communications
Sanitization Protocols
• The Chemical Process of Killing Vegetative Microbial Cells
• Protocols Become Part of Master Method and RequireValidation
• Require Bioburden Analysis for Validation
• The Analytical Techniques Must Be: SensitiveAccurateReproducibleQuantitative
Sources of Microbial Contaminationin a Chromatography System
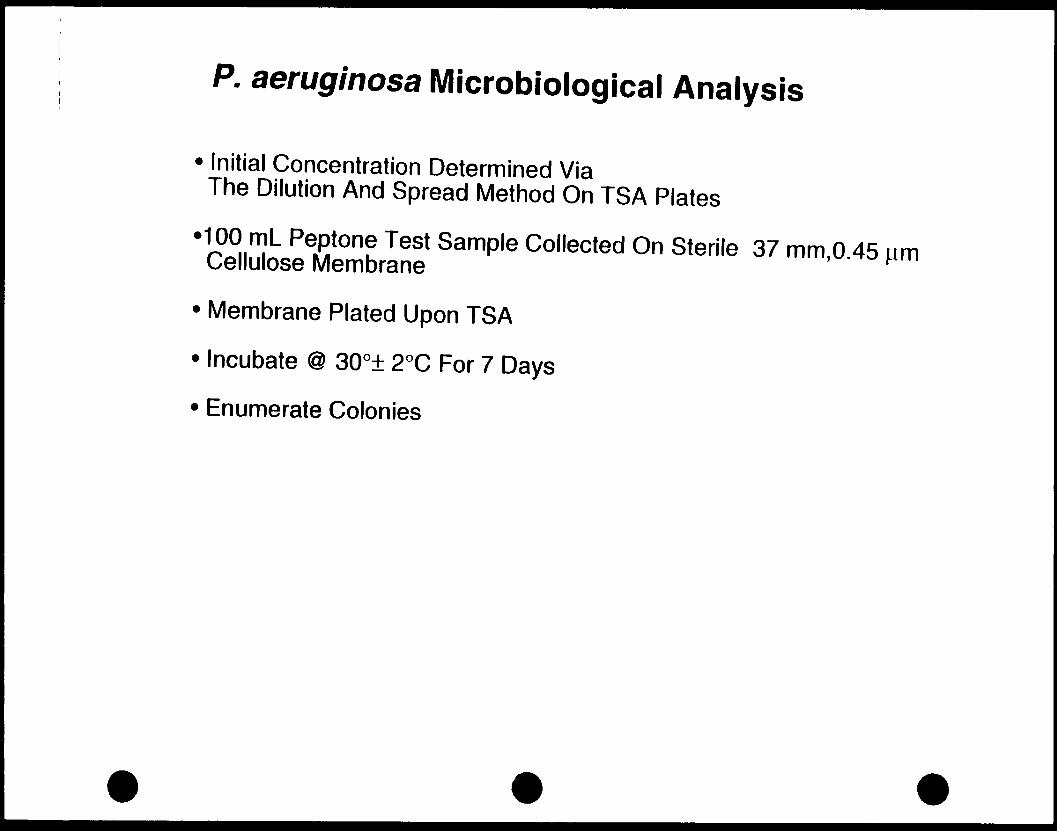
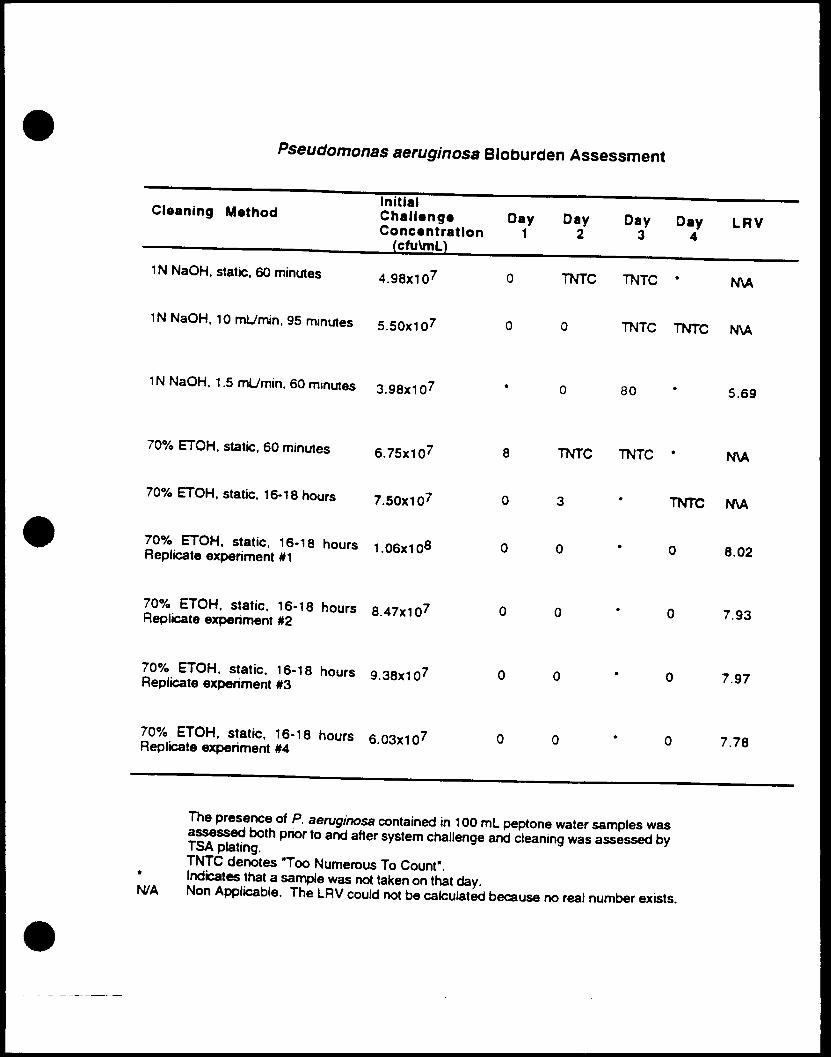
The presence of P. aeruginosa contained in 100 mL peptone water samples wasassessed both pnor to and after system challenge and cleaning was assessed byTSA plating.TNTC denotes "Too Numerous To Count'.
* Indicates that a sample was not taken on that day.N/A Non Applicable. The LRV could not be calculated because no real number exists.
Scanning Electron Microscopy of Chromatography SystemTubing Lumen Walls.
The effectiveness of the 70% aqueous ethanol sanitizer in destroyingsessile colonies of P. aeruginosa is demonstrated by the micrographs
of sections of system tubing removed prior to (A) and after (B)implementation of the sanitization protocol.
A
B
A. laidlawii Microbiological Analysis
• Initial Concentration Determined Via The Drop And Stab MethodOn FCA Plates
• 100 mL Peptone Tes_ Sample Collected In Sterile Graduated Cylinder
• Sample Filtered Through A 47 mm, 0.22 IJmCellulose Filter UsingA Vacuum Filter Funnel
• Membrane Plated Upon FCA
• Incubate @ 37°+ 2°C, 7% CO2 For 7 Days
• Visualize Colonies By Staining The Membrane Filter With DienesStain
•Enumerate Colonies Using A Stereomicroscope at 40X Power
The presence of A. laidlawii contained in 100 mL peptone water samples was assessedboth prior to and after system challenge and cleaning was assessed by FCA plating.
• Indicates that a sarr_e was not taken on that day.- Indicates that Staphylococcus contamination was detected pre-sanitization but not post
sanitization.
Conclusions
• Effective System Sanitization May Be Accomplished Using NaOHand Ethanol Solutions
• LRV = 8-9 Is Documented
• Sanitizer And Contact Time Are Critical Parameters
• Membrane Filter Method Provides The High Sensitivity RequiredFor Low Level Bioburden Analyses
• Protocols Must Be Validated For Bioburden Anticipated ina Given Process
° Sanitization Effectiveness Should Be Monitored Several DaysFollowing Protocol Implemetation