CHAPTER 2 Strategic Decisions - Strategic decisions would relate to opening and closing of mills, location of new or to be acquired mills, products and markets development, financial and operational exposure, planning strategy(e.g. decoupling point) and inventory location. Defining the planning approach has a major impact on all the investment decisions. It will fix important parameters in terms of needed technology and capacity as well as inventory levels and maximum distance to customers. Such decisions involve naturally an evaluation of how the investment will fit into the whole supply chain. Tactical Decisions - Tactical decision addresses allocation rules which define which resource or group of resources should be responsible for realizing the different supply chain activities. It also addresses the definition of the usage rules defining production, distribution delays, lot sizing and inventory policies. These decisions serves as a bridge from the long term strategic level to the detailed operative planning which has a direct influence on the actual operations in the chain (e.g. routing of trucks, definition of when to change from one product to another in the production process etc.). Typical decisions here are allocation of customers to mills and definition of necessary distribution capacity. The requirement of advance planning of the distribution depends on the transportation mode. Typically vessel, and rail transportation needs to be planned further in advance than trucks. Operative Decisions
Transcript
CHAPTER 2
Strategic Decisions
- Strategic decisions would relate to opening and closing of mills, location of new or to be acquired mills, products and markets development, financial and operational exposure, planning strategy(e.g. decoupling point) and inventory location. Defining the planning approach has a major impact on all the investment decisions. It will fix important parameters in terms of needed technology and capacity as well as inventory levels and maximum distance to customers. Such decisions involve naturally an evaluation of how the investment will fit into the whole supply chain.
Tactical Decisions
- Tactical decision addresses allocation rules which define which resource or group of resources should be responsible for realizing the different supply chain activities. It also addresses the definition of the usage rules defining production, distribution delays, lot sizing and inventory policies. These decisions serves as a bridge from the long term strategic level to the detailed operative planning which has a direct influence on the actual operations in the chain (e.g. routing of trucks, definition of when to change from one product to another in the production process etc.). Typical decisions here are allocation of customers to mills and definition of necessary distribution capacity. The requirement of advance planning of the distribution depends on the transportation mode. Typically vessel, and rail transportation needs to be planned further in advance than trucks.
Operative Decisions
- There are very high demands on this decision planning to adequately reflect in detail the reality in which the operations take place. The precise timing of operations is crucial. It is normally not adequate to know which week or month a certain action should be taken, it has to be defined in terms of days or hours. The operative planning is normally distributed to the different facilities or cells of the facilities because of the enormous quantity of data that needs to be manipulated at that level.
- One operative problem is the roll cutting problem in paper mills. Once the reel (tambour) has been produced in the paper machine it must be cut into the rolls demanded by internal and external customers. The reel may be 5-10 meters wide and 30 km. long. The customer orders are for products that may be 0.5-1.0 meter wide and 5 km. long. The problem is to decide cutting patterns, and the number of each, in order to satisfy the customer order while minimizing the number of reels required during a given period of time.
- Another large area of operative planning problems is within transportation. Routing of vessels appears between several segments of the supply chain. There are routing issues for the truck fleet used for collecting recycled paper. There is routing of trucks for the distribution of finished products from mills to customer or distribution centers.
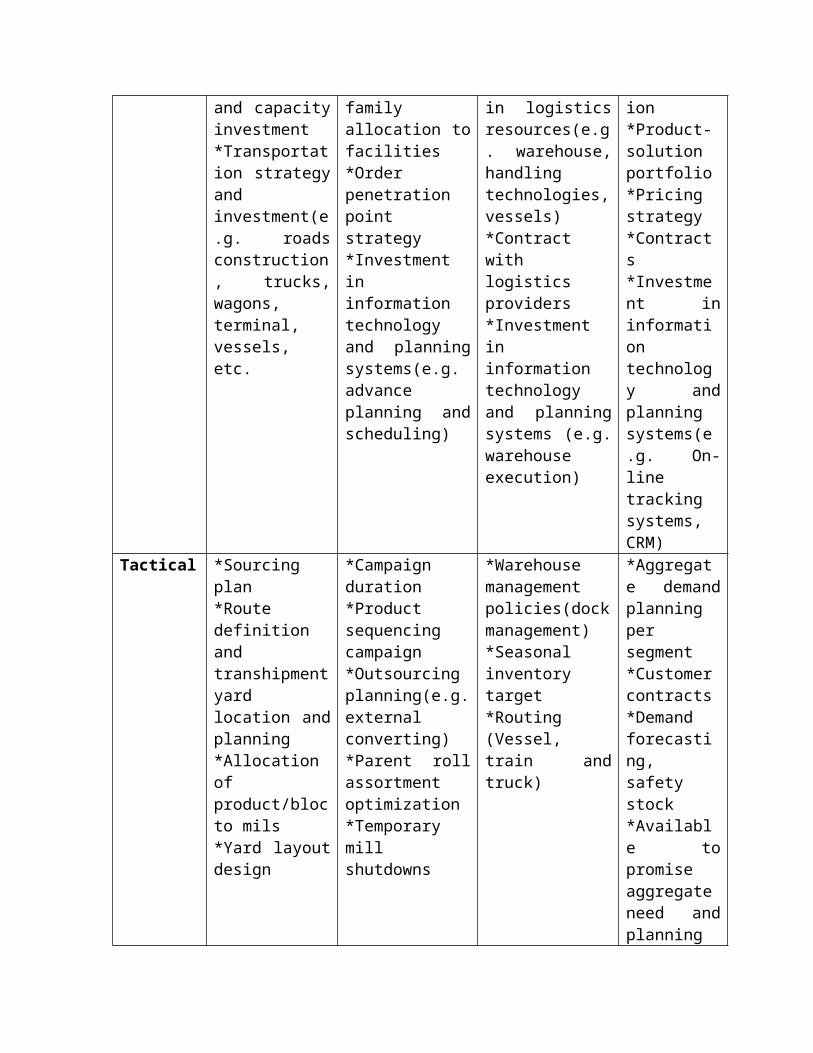
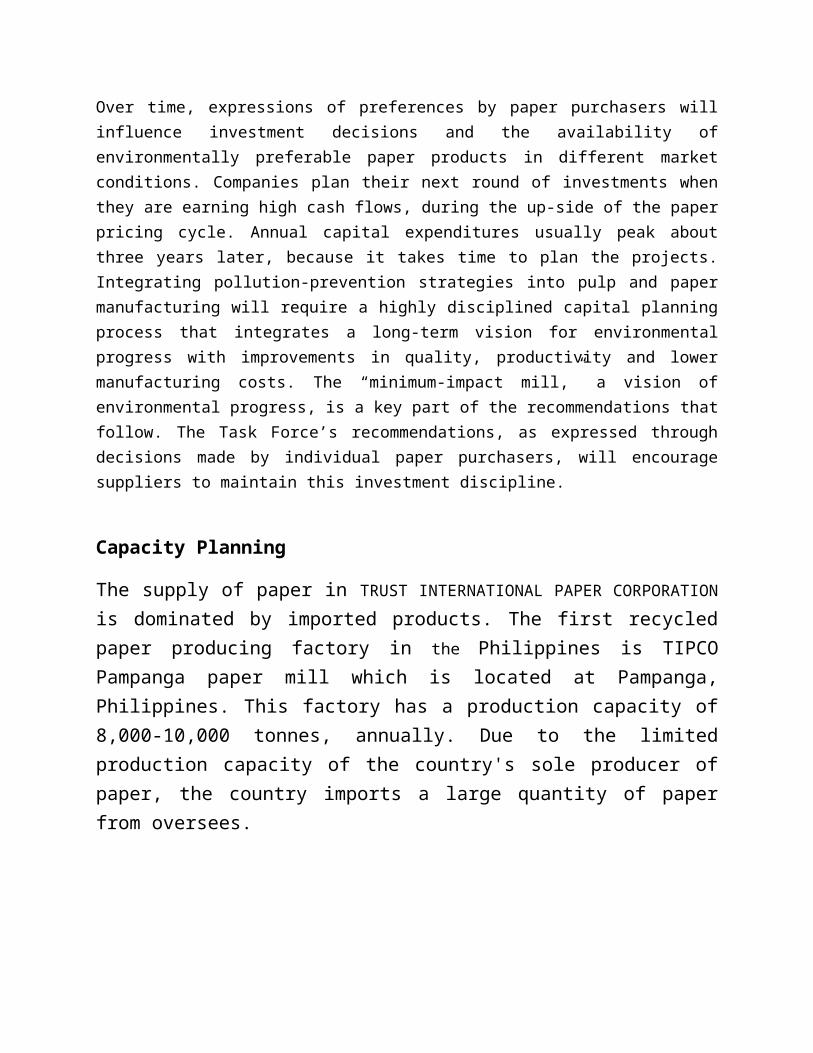
Procurement Production Distribution Sales
Strategic *Silvicultural regime and regeneration strategies*Transportation technology and capacity investment*Transportation strategy and investment(e.g. roads construction, trucks, wagons, terminal, vessels, etc.
*Location decisions *Outsourcing decisions*Technology and capacity investments *Product family allocation to facilities*Order penetration point strategy *Investment in information technology and planning systems(e.g. advance planning and scheduling)
*Warehouse Location*Allocation of markets/customers to warehouse*Investment in logistics resources(e.g. warehouse, handling technologies, vessels)*Contract with logistics providers*Investment in information technology and planning systems (e.g. warehouse execution)
*Selection of markets (e.g. location, segment)- customer segmentation*Product-solution portfolio*Pricing strategy*Contracts*Investment in information technology and planning systems(e.g. On-line tracking systems, CRM)
Tactical *Sourcing plan*Route definition and transhipment yard location and planning*Allocation of product/bloc to mils*Yard layout design
*Warehouse management policies(dock management)*Seasonal inventory target*Routing (Vessel, train and truck)
*Aggregate demand planning per segment *Customer contracts*Demand forecasting, safety stock*Available to promise aggregate need and planning
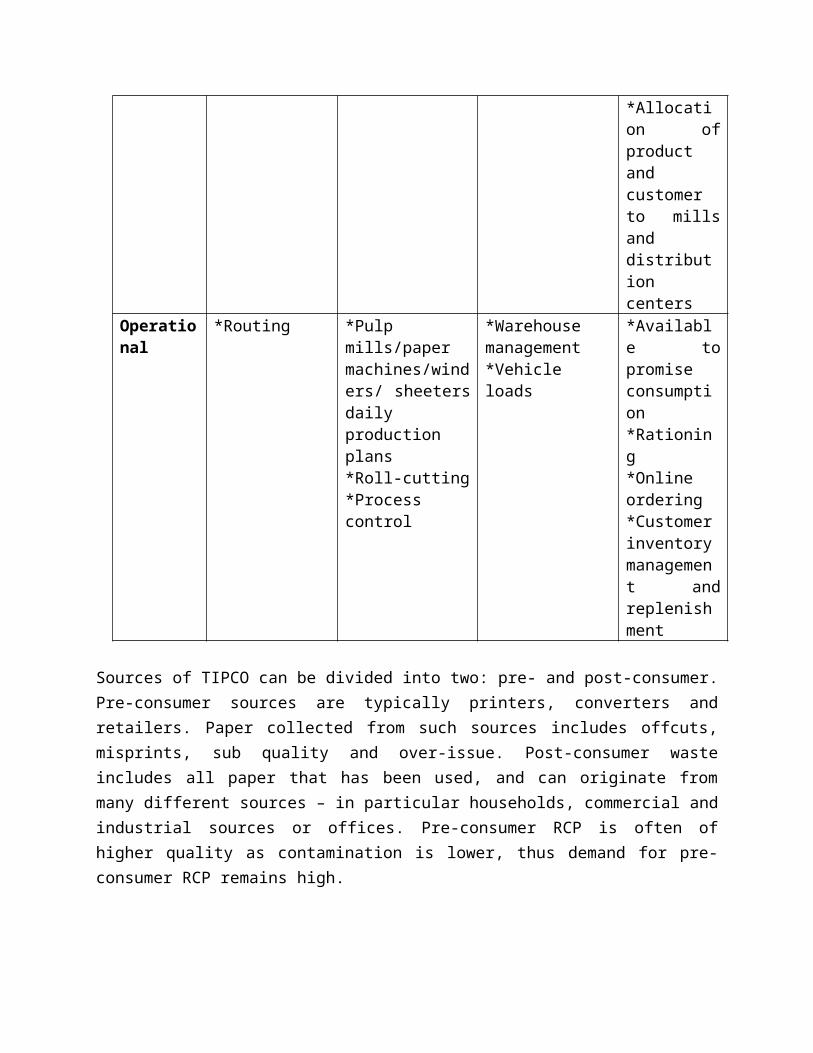
*Allocation of product and customer to mills and distribution centers
Operational *Routing *Pulp mills/paper machines/winders/ sheeters daily production plans*Roll-cutting *Process control
*Warehouse management*Vehicle loads
*Available to promise consumption*Rationing*Online ordering*Customer inventory management and replenishment
Sources of TIPCO can be divided into two: pre- and post-consumer. Pre-consumer sources are typically printers, converters and retailers. Paper collected from such sources includes offcuts, misprints, sub quality and over-issue. Post-consumer waste includes all paper that has been used, and can originate from many different sources – in particular households, commercial and industrial sources or offices. Pre-consumer RCP is often of higher quality as contamination is lower, thus demand for pre-consumer RCP remains high.
Supply Chain Management
The supply chain of the pulp and paper industry can be segmented into the following four sub-chains:
1) Procurement
- It is characterized by how MRO (Maintenance, Repair, and Operating) items are categorized, the extent of forecasting used to predict MRO requirements, the use of reorder points to maintain optimal inventory levels, and the overall value of inventory kept at the mill. It also involves the operations directed towards providing for the raw material and resources necessary for the production.
Collection MethodsA: Kerbside sorted – Dry recyclables are placed in a box or sack, these are then sorted by operatives as they transfer them from the box to the designated bins or cages on the collection truck.
B: Two-stream co-mingled – Dry recyclables are put into a bin, box or sack, with the exception of either paper or glass which is put into a separate bin, box or sack. The co-mingled fraction is later sorted at a MRF.C: Single-stream co-mingled – Dry recyclables go in a bin, box or sack (this frequently, but not always, excludes glass). The co-mingled materials are collected and sorted at a MRF.D: Single stream collections – Separated recyclables are put into material specific containers such as bins, boxes or sacks.E: Survival bags – Dry recyclables are placed by the householder into a designated coloured plastic sack and these are collected along with household refuse where the contents are then sorted at a MRF.
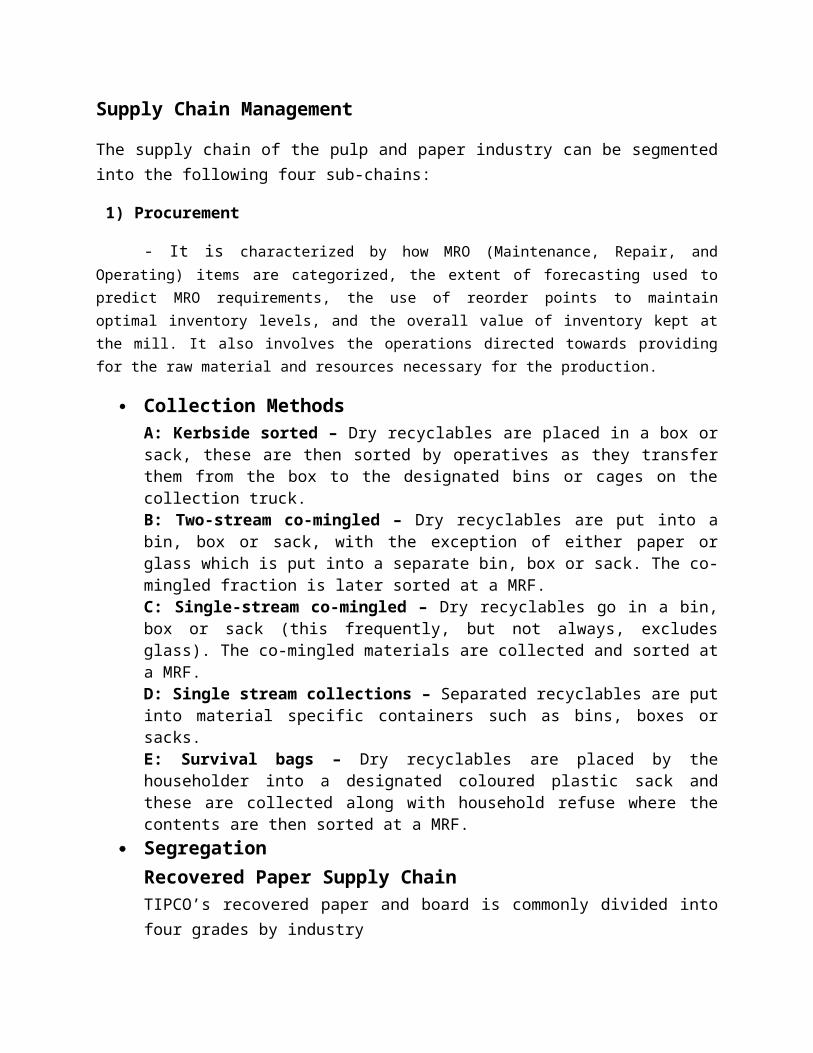
SegregationRecovered Paper Supply ChainTIPCO’s recovered paper and board is commonly divided into four grades by industry,The Four Main Grades of Recovered Paper
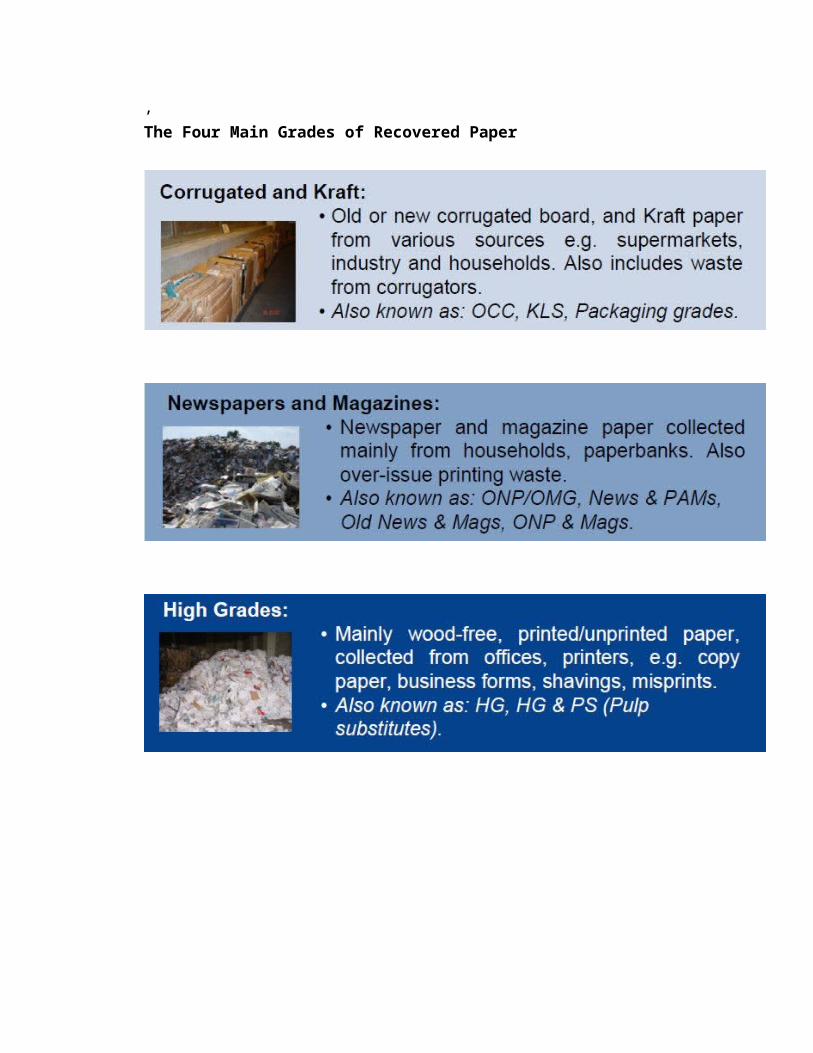
Standard Grades of Recovered Paper
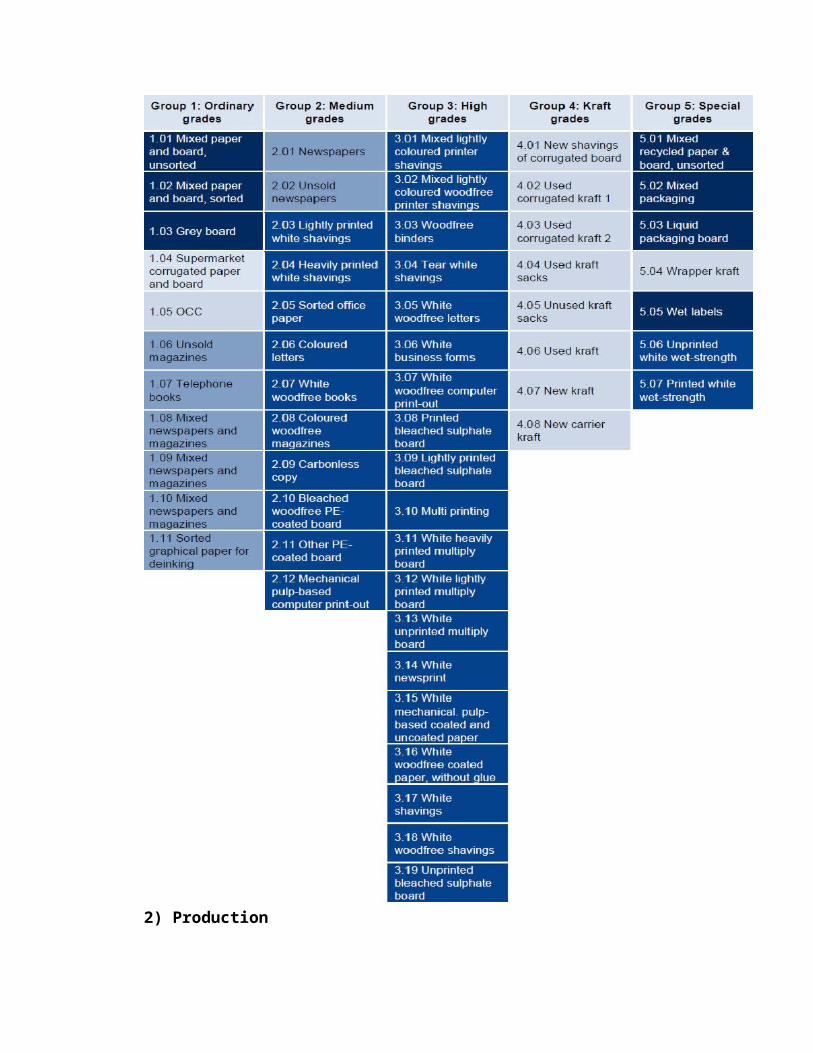
2) Production
- In this process the raw materials are converted to intermediary and/or finished products.
3) Distribution
- It involves customer fulfilment which spans order taking, production, and delivering of products to customers. It also includes the logistics taking place to move the products either to companies processing the product further or to distribution centers, and finally to retailers.
4) Sales
- This process deals with all demand planning issues including customer or market selection, pricing strategy, forecasting and order promising policies.
Role of Purchasing
Over time, expressions of preferences by paper purchasers will influence investment decisions and the availability of environmentally preferable paper products in different market conditions. Companies plan their next round of investments when they are earning high cash
flows, during the up-side of the paper pricing cycle. Annual capital expenditures usually peak about three years later, because it takes time to plan the projects. Integrating pollution-prevention strategies into pulp and paper manufacturing will require a highly disciplined capital planning process that integrates a long-term vision for environmental progress with improvements in quality, productivity and lower manufacturing costs. The “minimum-impact mill,” a vision of environmental progress, is a key part of the recommendations that follow. The Task Force’s recommendations, as expressed through decisions made by individual paper purchasers, will encourage suppliers to maintain this investment discipline.
Capacity Planning
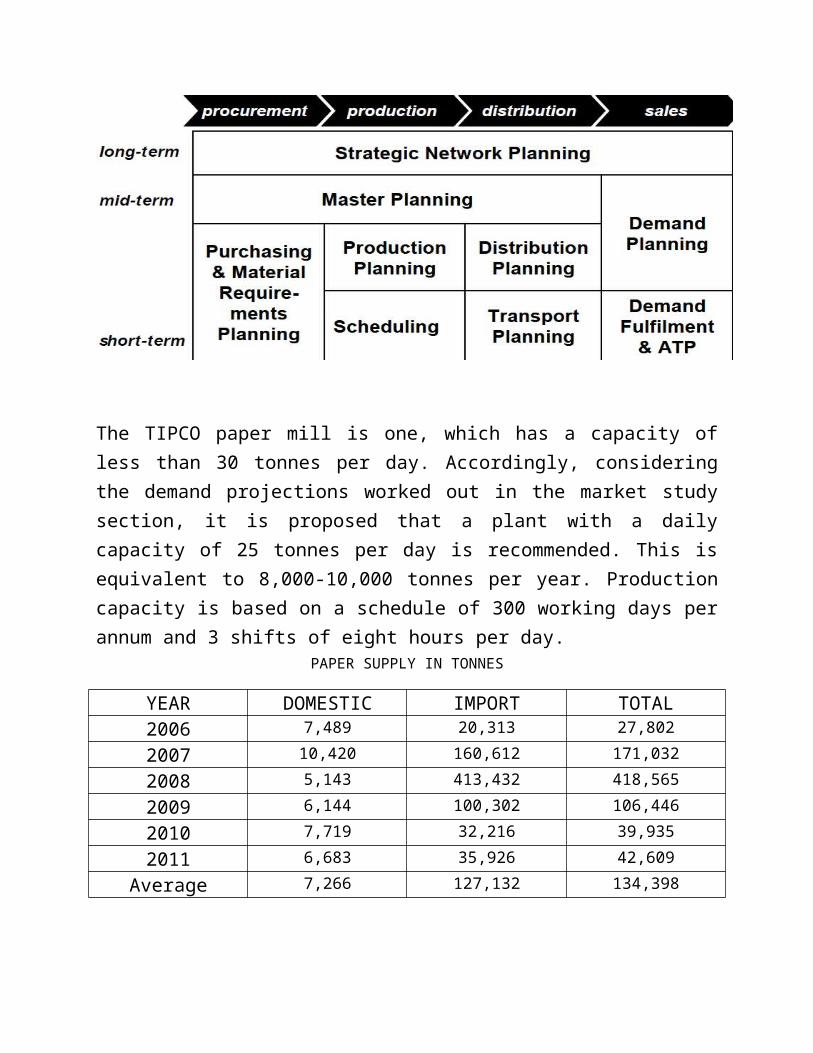
The supply of paper in TRUST INTERNATIONAL PAPER CORPORATION is dominated by imported products. The first recycled paper producing factory in the Philippines is TIPCO Pampanga paper mill which is located at Pampanga, Philippines. This factory has a production capacity of 8,000-10,000 tonnes, annually. Due to the limited production capacity of the country's sole producer of paper, the country imports a large quantity of paper from oversees.
The TIPCO paper mill is one, which has a capacity of less than 30 tonnes per day. Accordingly, considering the demand projections worked out in the market study section, it is proposed that a plant with a daily capacity of 25 tonnes per day is recommended. This is equivalent to 8,000-10,000 tonnes per year. Production
capacity is based on a schedule of 300 working days per annum and 3 shifts of eight hours per day.
PAPER SUPPLY IN TONNES
YEAR DOMESTIC IMPORT TOTAL2006 7,489 20,313 27,802
2007 10,420 160,612 171,032
2008 5,143 413,432 418,565
2009 6,144 100,302 106,446
2010 7,719 32,216 39,935
2011 6,683 35,926 42,609
Average 7,266 127,132 134,398
As can be seen from the table, the 2006/2011 average annual domestic production of paper was 7,266 tonnes while in the same period 127,132 tonnes of paper have been imported which means
the average total supply of paper during the period under consideration was 134,398 tonnes per
annum, of which only about 5% was locally produced.
Supply of paper has shown a leap in the three years (2007-2009) and returns back to the under 50, 000 tonnes level in 2010. Excluding the leap years, the average annual total supply remains 36,782 tonnes with an annual growth rate of 8.8%. Applying this annual growth rate, the current effective demand for paper is estimated at 46, 359 tonnes.
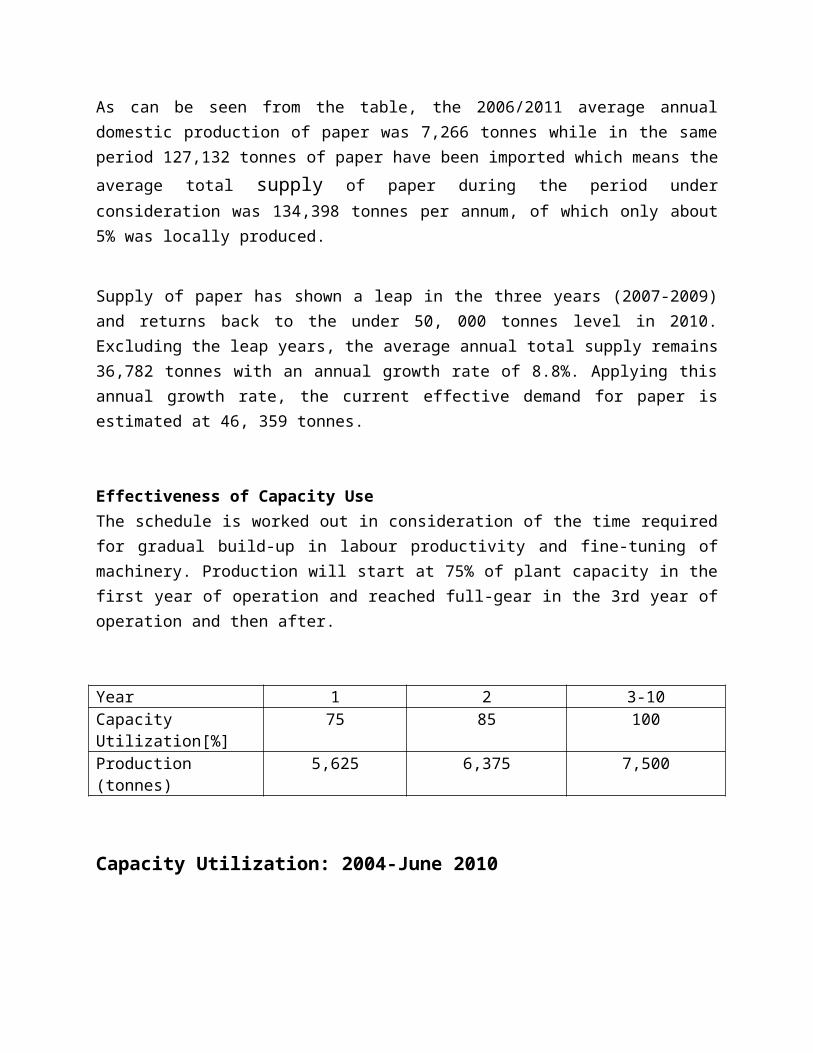
Effectiveness of Capacity UseThe schedule is worked out in consideration of the time required for gradual build-up in labour productivity and fine-tuning of machinery. Production will start at 75% of plant capacity in the first year of operation and reached full-gear in the 3rd year of operation and then after.
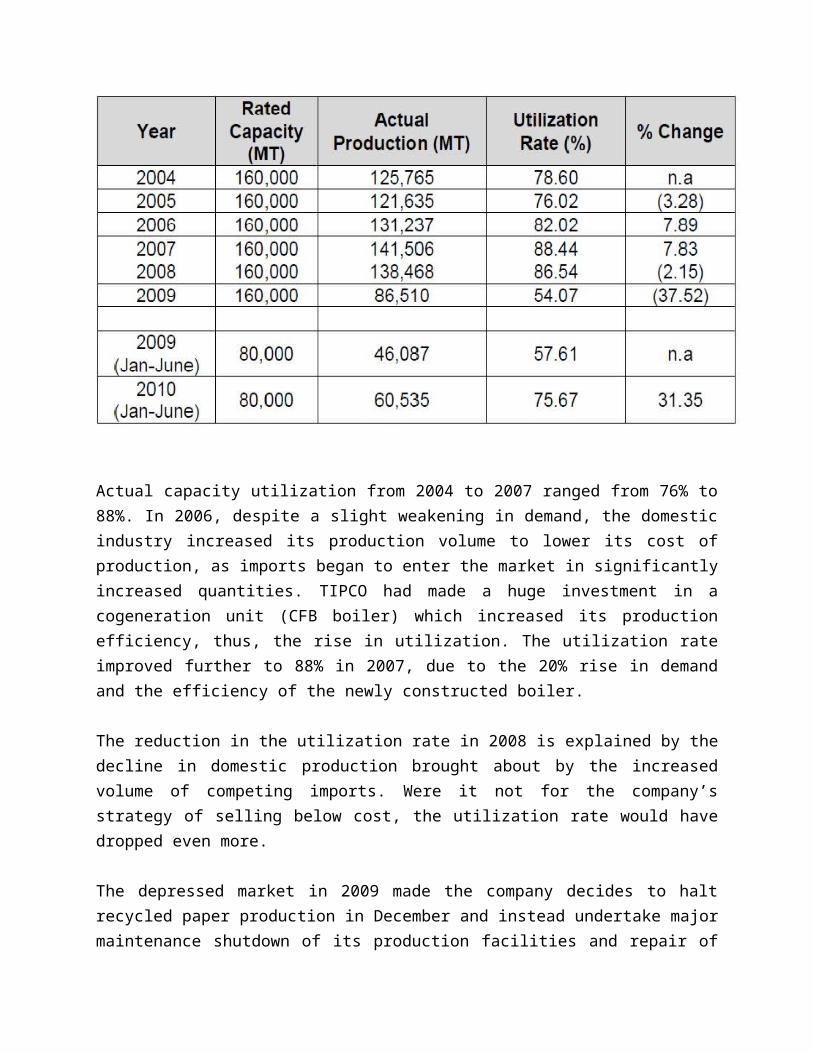
Actual capacity utilization from 2004 to 2007 ranged from 76% to 88%. In 2006, despite a slight weakening in demand, the domestic industry increased its production volume to lower its cost of production, as imports began to enter the market in significantly increased quantities. TIPCO had made a huge investment in a cogeneration unit (CFB boiler) which increased its production efficiency, thus, the rise in utilization. The utilization rate improved further to 88% in 2007, due to the 20% rise in demand and the efficiency of the newly constructed boiler.
The reduction in the utilization rate in 2008 is explained by the decline in domestic production brought about by the increased volume of competing imports. Were it not for the company’s strategy of selling below cost, the utilization rate would have dropped even more.
The depressed market in 2009 made the company decides to halt recycled paper production in December and instead undertake major maintenance shutdown of its production facilities and repair of its boiler. Capacity utilization was 54%. For the first six (6) months of 2010, the industry’s capacity utilization rate of 76% was the second lowest over the POI.
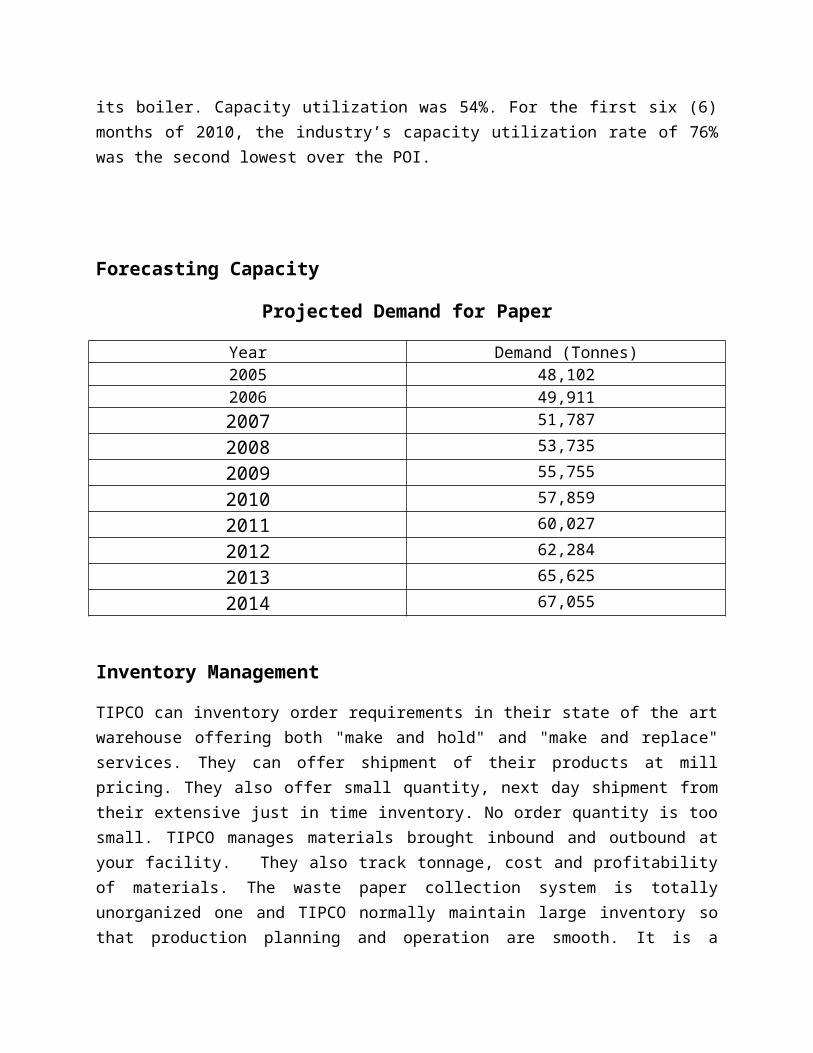
Forecasting Capacity
Projected Demand for Paper
Year Demand (Tonnes)2005 48,1022006 49,911
2007 51,787
2008 53,735
2009 55,755
2010 57,859
2011 60,027
2012 62,284
2013 65,625
2014 67,055
Inventory Management
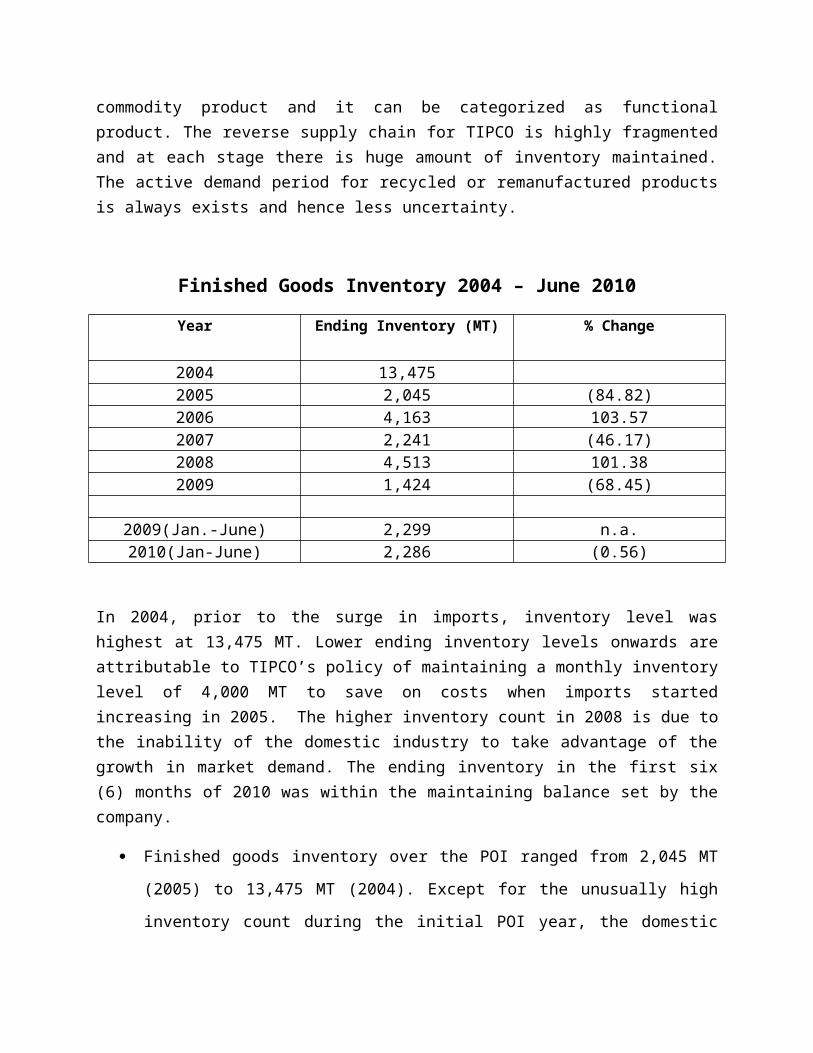
TIPCO can inventory order requirements in their state of the art warehouse offering both "make and hold" and "make and replace" services. They can offer shipment of their products at mill pricing. They also offer small quantity, next day shipment from their extensive just in time inventory. No order quantity is too small. TIPCO manages materials brought inbound and outbound at your facility. They also track tonnage, cost and profitability of materials. The waste paper collection system is totally unorganized one and TIPCO normally maintain large inventory so that production planning and operation are smooth. It is a commodity product and it can be categorized as functional product. The reverse supply chain for TIPCO is highly fragmented and at each stage there is huge amount of inventory maintained. The active demand period for recycled or remanufactured products is always exists and hence less uncertainty.
In 2004, prior to the surge in imports, inventory level was highest at 13,475 MT. Lower ending inventory levels onwards are attributable to TIPCO’s policy of maintaining a monthly inventory level of 4,000 MT to save on costs when imports started increasing in 2005. The higher inventory count in 2008 is due to the inability of the domestic industry to take advantage of the growth in market demand. The ending inventory in the first six (6) months of 2010 was within the maintaining balance set by the company.
Finished goods inventory over the POI ranged from 2,045 MT (2005) to 13,475 MT
(2004). Except for the unusually high inventory count during the initial POI year, the
domestic paper industry was generally able to maintain its target monthly inventory
count of 4,000 MT in the succeeding years.
When annual import volumes peaked in 2008, there was a doubling of ending inventory,
causing it to similarly peak at 4,513 MT. This is attributable to the failure of the domestic
industry to grow its sales despite an increase in market size.
Increased imports of recycled paper in 2008 caused the sharp rise in the finished goods
ending inventory count of the domestic recycled industry.
Inventory Cost
The company dropped its previous 50% recycled, 10% postconsumer (50/10) recycled content levels to simply 10% postconsumer on two of its #1 coated papers. The company had been purchasing preconsumer pulp on the open market when it had its own forest land that provided less expensive pulp. The cost of deinking investments makes it hard to bring down the price of recycled. Customers, too, play a role in higher prices for some recycled papers. When prices are falling, lower recycled demand can create higher price differentials between recycled and virgin papers. Distributors will sell their older, higher-cost inventory before ordering again, so customers may not be able to take advantage of lower-cost recycled paper as quickly as they can get the lower-cost virgin paper.
For manufacturers of deinked white pulp used in printing and writing paper, BCTMP (scrap from paper) will enter the recycling system gradually in the future, as non-integrated manufacturers
of high value printing and writing papers add this lower cost pulp to their paper. Deinking mills already allow a small percentage of ground wood in the recovered paper they purchase.
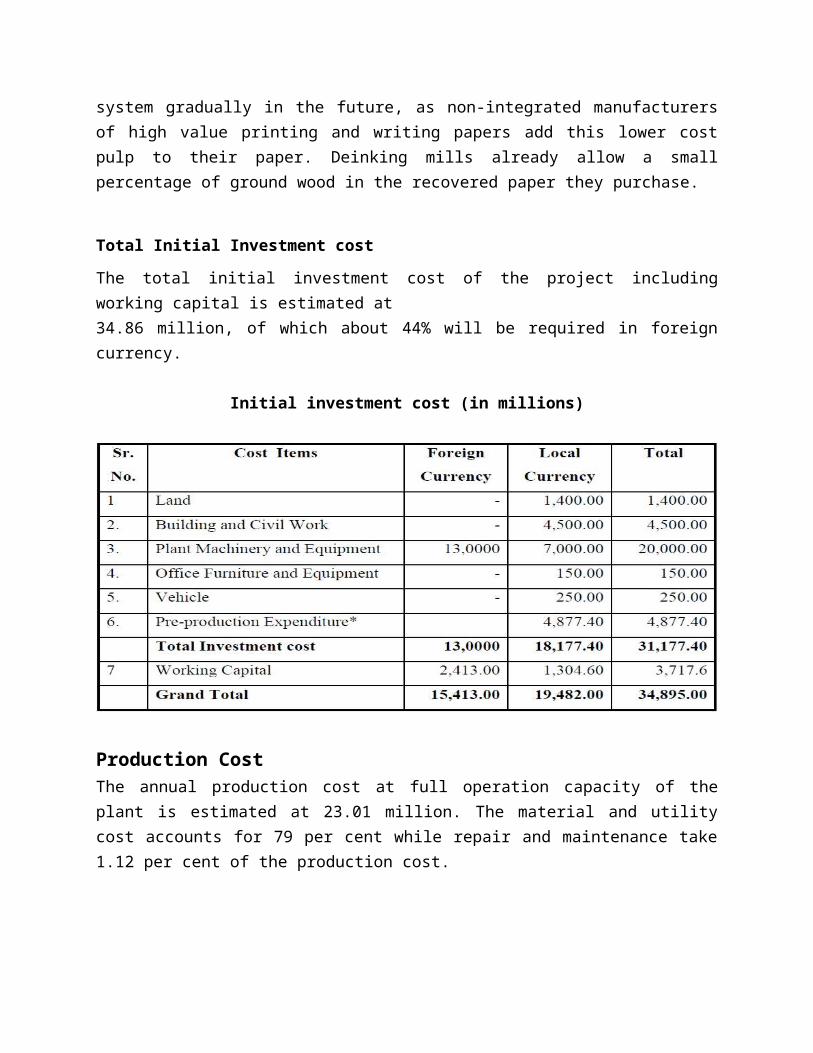
Total Initial Investment cost
The total initial investment cost of the project including working capital is estimated at34.86 million, of which about 44% will be required in foreign currency.
Initial investment cost (in millions)
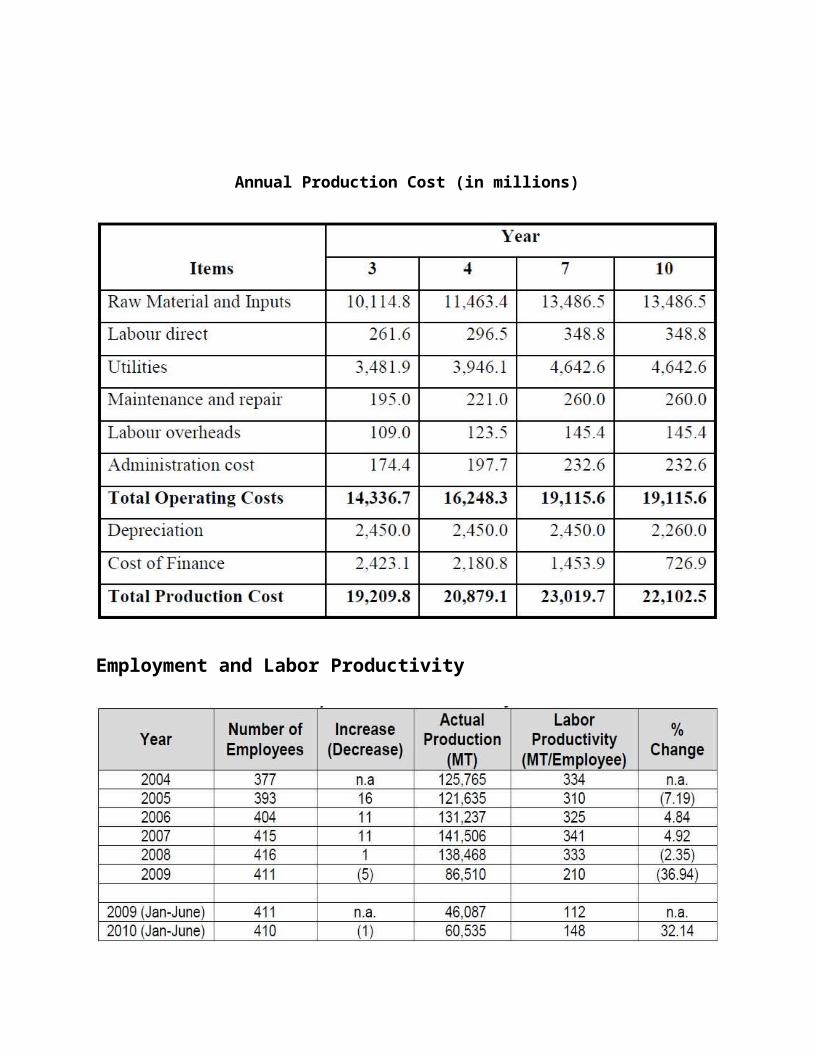
Production CostThe annual production cost at full operation capacity of the plant is estimated at 23.01 million. The material and utility cost accounts for 79 per cent while repair and maintenance take 1.12 per cent of the production cost.
Annual Production Cost (in millions)
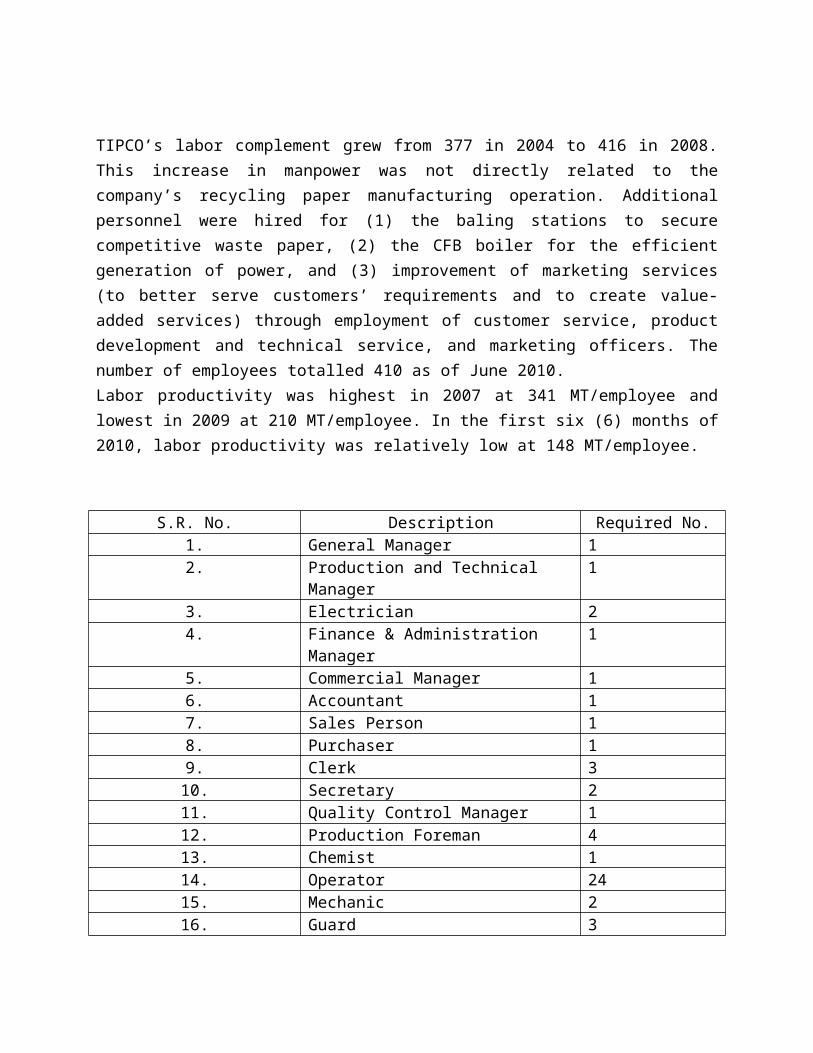
Employment and Labor Productivity
TIPCO’s labor complement grew from 377 in 2004 to 416 in 2008. This increase in manpower was not directly related to the company’s recycling paper manufacturing operation. Additional personnel were hired for (1) the baling stations to secure competitive waste paper, (2) the CFB boiler for the efficient generation of power, and (3) improvement of marketing services (to better serve customers’ requirements and to create value-added services) through employment
of customer service, product development and technical service, and marketing officers. The number of employees totalled 410 as of June 2010. Labor productivity was highest in 2007 at 341 MT/employee and lowest in 2009 at 210 MT/employee. In the first six (6) months of 2010, labor productivity was relatively low at 148 MT/employee.
S.R. No. Description Required No.1. General Manager 12. Production and Technical Manager 13. Electrician 24. Finance & Administration Manager 15. Commercial Manager 16. Accountant 17. Sales Person 18. Purchaser 19. Clerk 3
10. Secretary 211. Quality Control Manager 112. Production Foreman 413. Chemist 114. Operator 2415. Mechanic 216. Guard 317. Unskilled Labour 2018. Driver 4
TOTAL 73
Project Life Cycle
Paper mill life cycle starts from creation of paper production line component documentation and ends when the mill is disposed. When implementing seamless data exchange, analysis of the product data flows from component deliverers to system integrators, consultants and finally to the paper mill is needed.R&D engineers need information about components and systems that are used in the production line and equipment deliveries. The information available varies a lot. In some cases only basic technical specifications are available. Technical information that is needed in the different phases of the design and delivery process must be defined in order to enable efficient product data visibility.
The biggest challenges lay in collaboration processes between all the parties participating in a delivery project. When the processes cross the company borders the challenges are not only technical but also the legal rights concerning product data must be considered.
Dealing with engineering processes in modernization, especially technical documentation processes, describes how paper mills, engineering consultants, system providers, component suppliers and service are to co-operate to achieve best possible results. Each phase of the process all the product data used is defined accurately enough to enable implementation of seamless data transfer. Systematic approach to documentation processes and information content gives a solid base for the product data application implementations. It also helps to avoid unneeded processes and overlapping documentation.
Technical Documentation of Rebuilding Project in Paper Mill
The paper mill makes plan and manages the rebuilding project. It utilises the engineering consultant and / or the system provider for designing, engineering, constructing and commissioning the rebuilding project. The system provider utilises component suppliers for producing goods and services.
Main Process Diagram in the Rebuilding of Paper mill
Manage and plan the project. Bids and offers include technical data.