33
Tips for Building Energy Efficient PRWs Marcus Wilcox, President – Cascade Energy, Inc.
Tips for Building Energy Efficient PRWs
Marcus Wilcox, President – Cascade Energy, Inc.

• Never Say Never – Rates & Incentives
• Leveraging Utility Incentive Programs
• Envelope & Under-Floor Heating
• Refrigeration System
• Lighting
• Freezer Door Selection
• Battery Chargers
Agenda
2
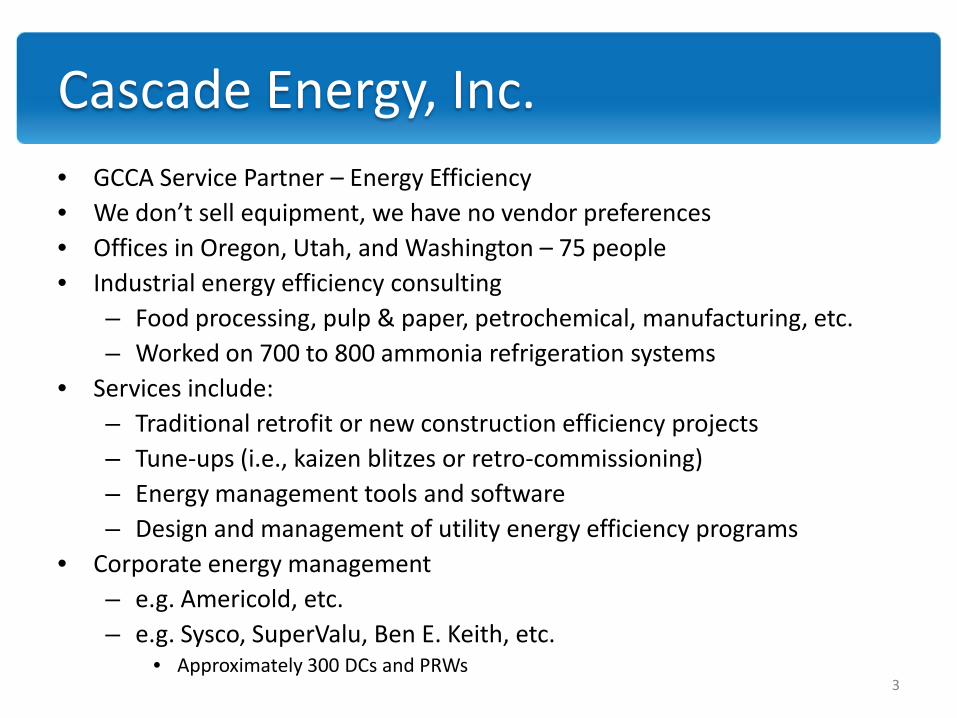
• GCCA Service Partner – Energy Efficiency• We don’t sell equipment, we have no vendor preferences• Offices in Oregon, Utah, and Washington – 75 people• Industrial energy efficiency consulting
– Food processing, pulp & paper, petrochemical, manufacturing, etc.– Worked on 700 to 800 ammonia refrigeration systems
• Services include:– Traditional retrofit or new construction efficiency projects– Tune-ups (i.e., kaizen blitzes or retro-commissioning)– Energy management tools and software– Design and management of utility energy efficiency programs
• Corporate energy management– e.g. Americold, etc.– e.g. Sysco, SuperValu, Ben E. Keith, etc.
• Approximately 300 DCs and PRWs
Cascade Energy, Inc.
3

• Average Energy Use: 5,200,000 kWh/yr
• Average Energy Rate: 7.4¢/kWh
• Average Energy Cost: ≈$400,000• Range of Efficiency: 0.6 to 2.7 kWh/ft3
– Nearly 5:1 variation!
Stats from 2010 GCCA Benchmarking
4

• Customer– Bid Specification
– Preferences or Selections: Chargers, Doors, Brands
• Architect– Insulation
– Under-Floor Heating
• General Contractor
• Refrigeration Contractor– Refrigeration Equipment Vendors
– Refrigeration Controls Vendor
• Electrical Contractor
Who Influences Energy Efficiency?
5

• Typically X¢/kWh, up to Y% of project cost– Commonly 5 to 30¢/kWh
– Commonly 50% to 70% of project cost
– May have a minimum allowable simple payback
– May vary by technology or retrofit vs. new construction
• Also prescriptive rebates– $X/light fixture
– $Y/hp for variable frequency drives
Energy-Oriented Incentive Programs
6
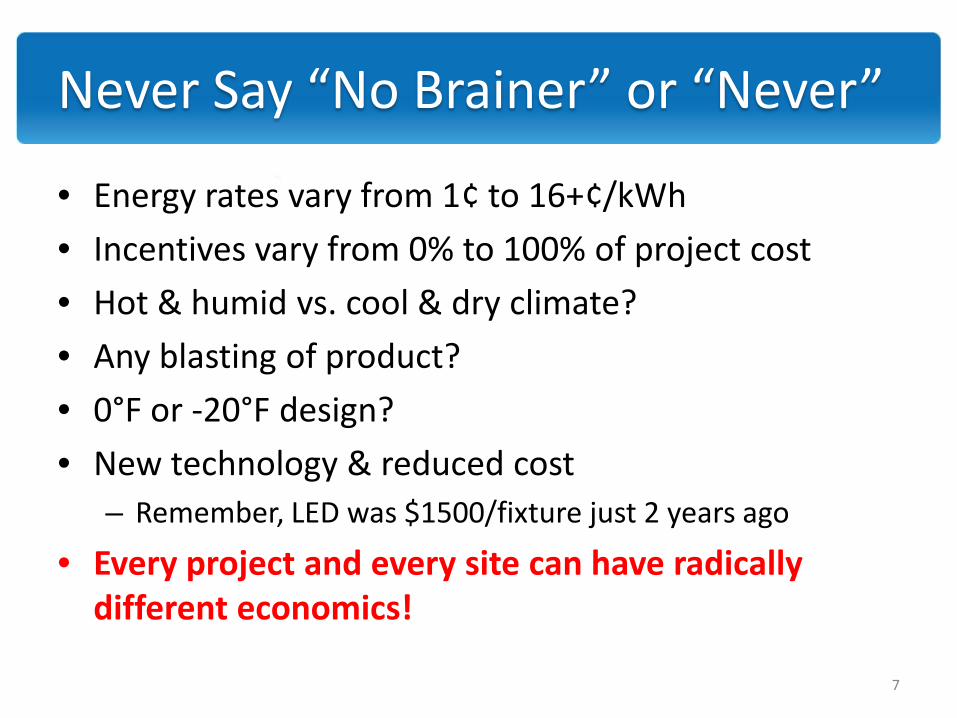
• Energy rates vary from 1¢ to 16+¢/kWh
• Incentives vary from 0% to 100% of project cost
• Hot & humid vs. cool & dry climate?
• Any blasting of product?
• 0°F or -20°F design?
• New technology & reduced cost– Remember, LED was $1500/fixture just 2 years ago
• Every project and every site can have radically different economics!
Never Say “No Brainer” or “Never”
7
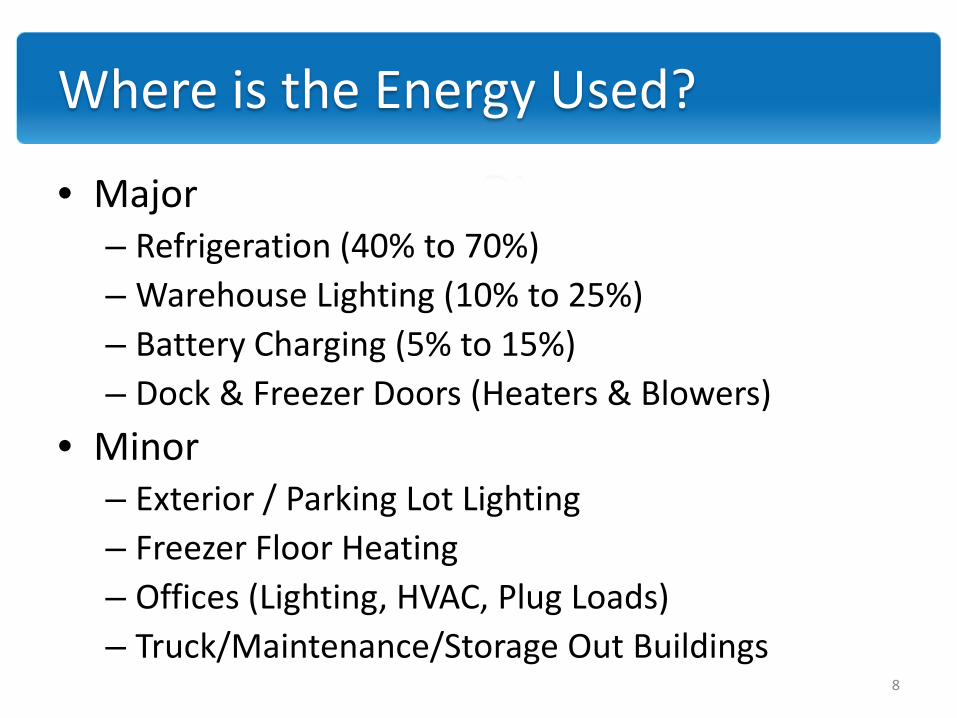
Where is the Energy Used?
• Major– Refrigeration (40% to 70%)– Warehouse Lighting (10% to 25%)– Battery Charging (5% to 15%)– Dock & Freezer Doors (Heaters & Blowers)
• Minor– Exterior / Parking Lot Lighting– Freezer Floor Heating– Offices (Lighting, HVAC, Plug Loads)– Truck/Maintenance/Storage Out Buildings
8
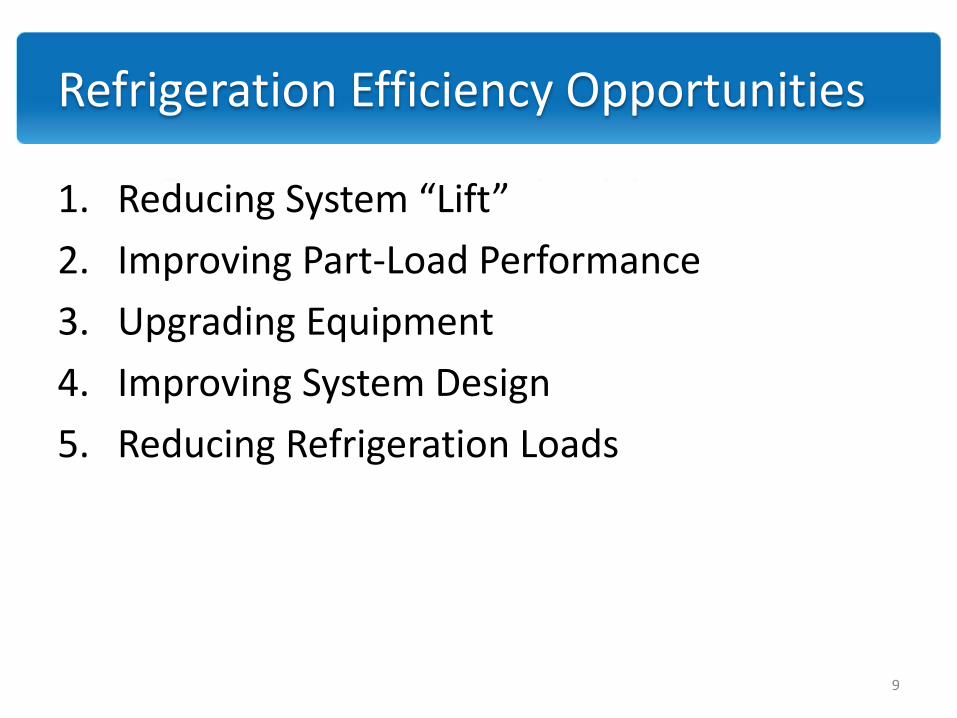
Refrigeration Efficiency Opportunities
1. Reducing System “Lift”
2. Improving Part-Load Performance
3. Upgrading Equipment
4. Improving System Design
5. Reducing Refrigeration Loads
9

1. Reducing System “Lift”
• Raise Suction Pressure (Temperature)– Rule of Thumb: 2% per degree
– May be limited by process, equipment or system• Mismatch of suctions to load
• Evaporator coil selection
• Suction line pressure drop
• Suction temperature set point is too low
• Reduce Discharge Pressure (Temperature)– Rule of Thumb: 1½% per degree
– May be limited by process, equipment or system• Defrost system design
• Freezer floor heat
• Condenser selection
10

2. Improved Part-Load Performance
• Evaporators– Optimum Control Algorithms
– Variable Frequency Drives (VFDs)
• Compressors– Improved Control System Sequencing
– VFD Control
• Condensers– Improved Control System Algorithms
– VFD Control
11

Screw Compressor Slide Valve Unloading
12

Evaporator & Condenser VFDs
Variable speed control is ALWAYS the most efficient form of part load control.
Sample Evaporator & Condenser Fan VFDs
13
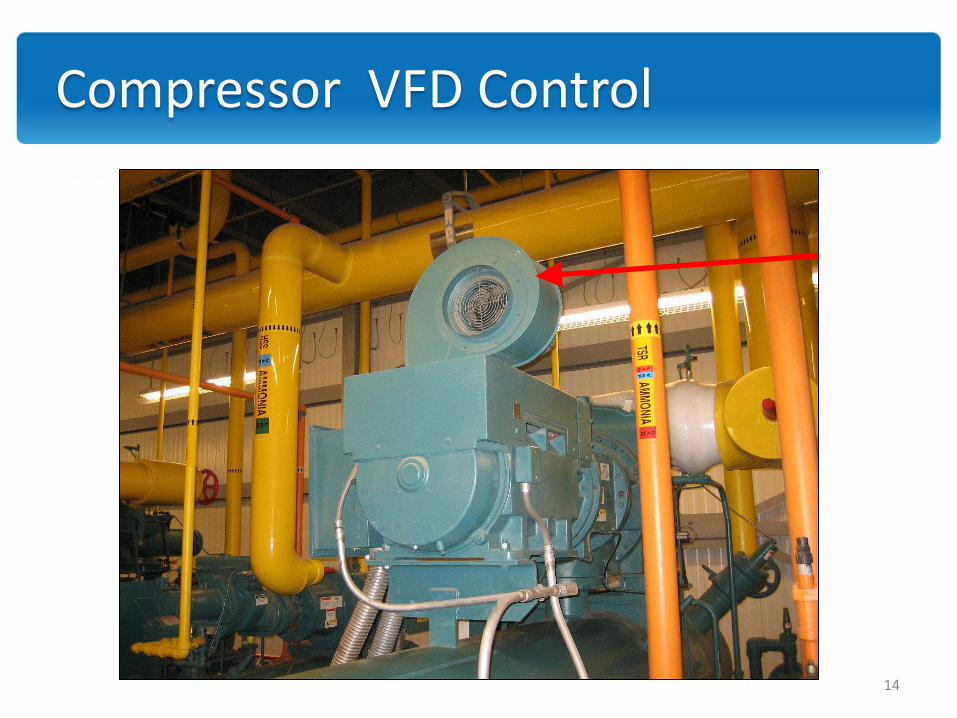
Compressor VFD Control
14
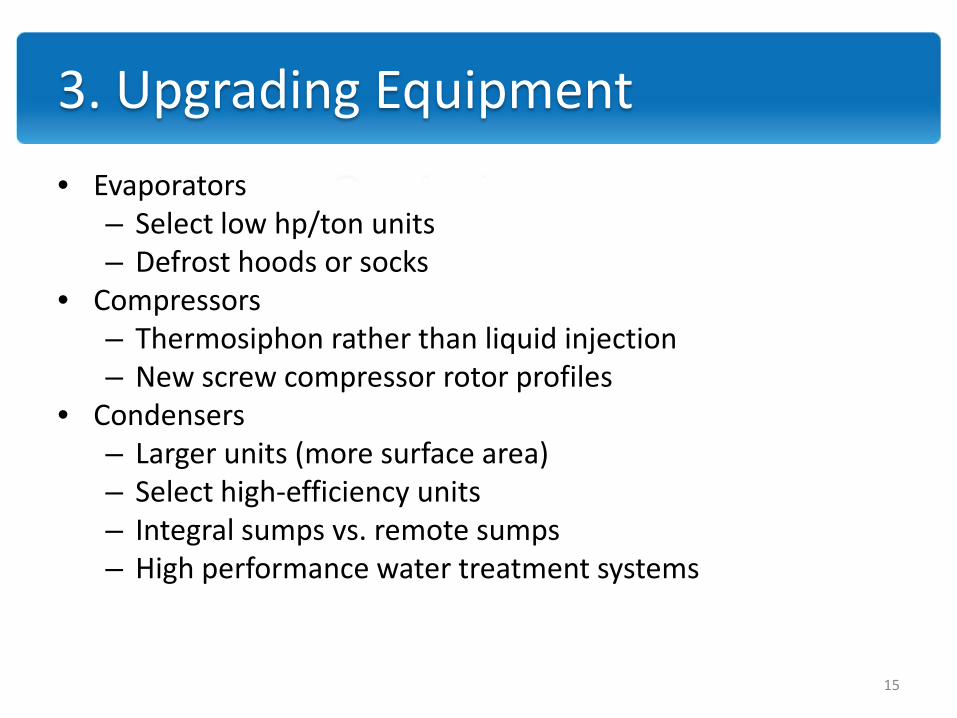
3. Upgrading Equipment
• Evaporators– Select low hp/ton units– Defrost hoods or socks
• Compressors– Thermosiphon rather than liquid injection– New screw compressor rotor profiles
• Condensers– Larger units (more surface area)– Select high-efficiency units– Integral sumps vs. remote sumps– High performance water treatment systems
15

Efficient Coil Defrost Hoods or Socks
Evaporator Return Air Defrost Hood Defrost Hoods and Socks
16

Efficient Compressor Cooling
Liquid Injection
Thermosiphon
17

Efficient Condenser Selections
Sample Condenser Series Efficiency
0
50
100
150
200
250
300
350
400
5,000 10,000 15,000 20,000 25,000 30,000
Nominal Heat Rejection - MBH
MB
H p
er F
an/P
ump
HP
Am
mon
ia C
harg
e
Lowest$/MBH
(This is likelywhat is bid)
HighestMBH/hp
(This is theefficient
selection)
18
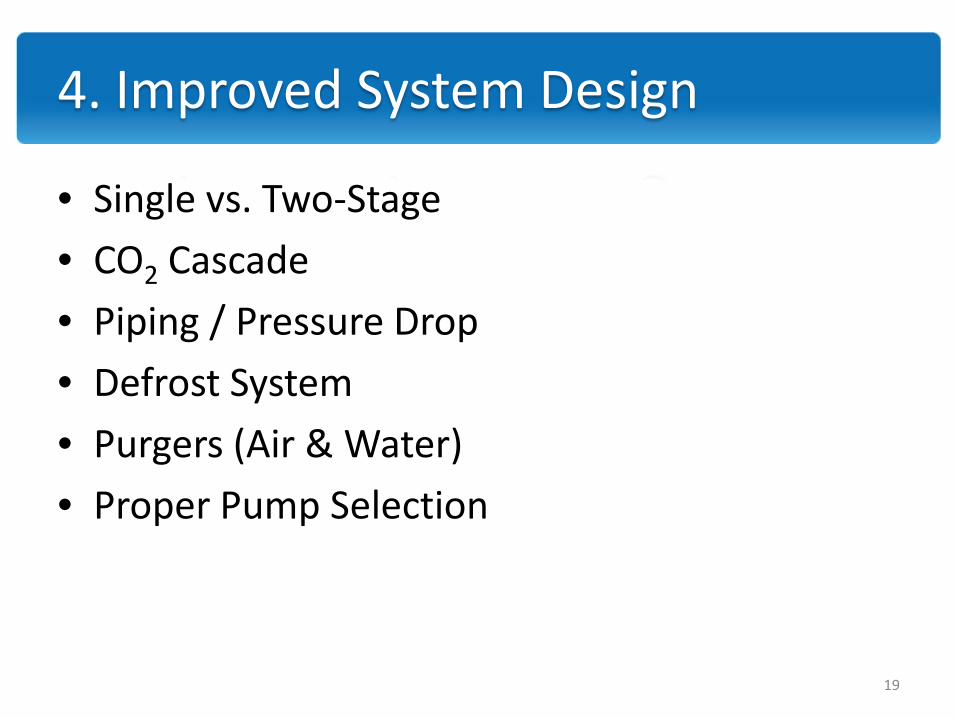
4. Improved System Design
• Single vs. Two-Stage
• CO2 Cascade
• Piping / Pressure Drop
• Defrost System
• Purgers (Air & Water)
• Proper Pump Selection
19

• Insulation Levels
• Under-Floor Heating
• Warehouse Doors
• Leveler Seals
• Warehouse Lighting
5. Reducing Refrigeration Load
20

• Roof and wall insulation levels
• Under-floor insulation level
• Structural considerations
• Tradition or convention seemsto dominate design
• Is life-cycle analysis performed?– Remember, energy rates vary 10:1 or more
– Remember, utility incentive vary from 0% to 70%
Warehouse Envelope
21
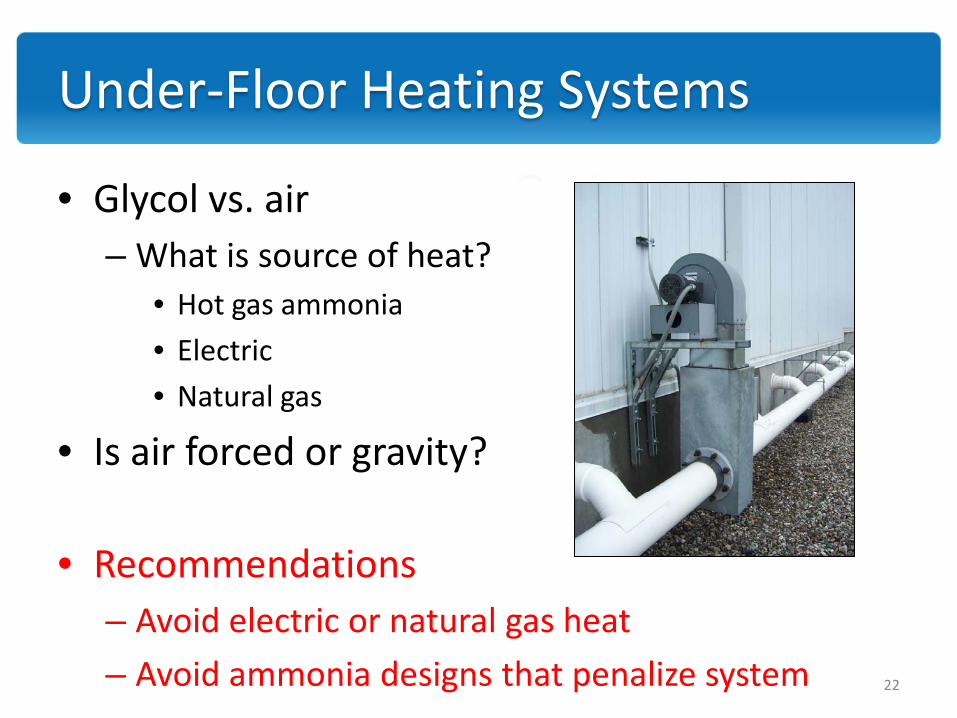
• Glycol vs. air– What is source of heat?
• Hot gas ammonia
• Electric
• Natural gas
• Is air forced or gravity?
• Recommendations– Avoid electric or natural gas heat
– Avoid ammonia designs that penalize system
Under-Floor Heating Systems
22
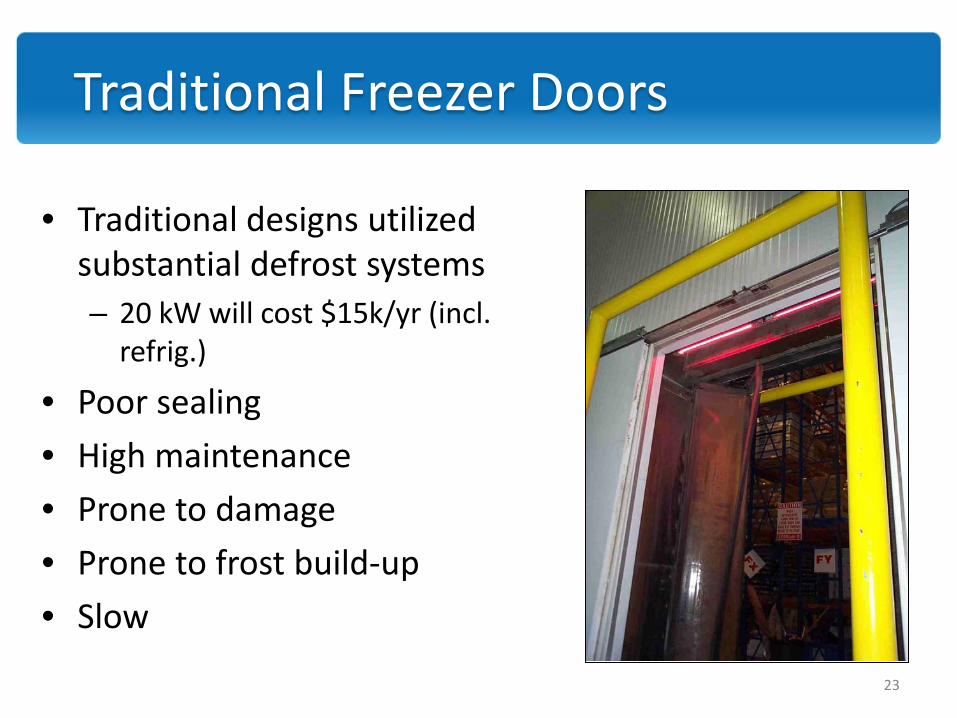
Traditional Freezer Doors
• Traditional designs utilized substantial defrost systems– 20 kW will cost $15k/yr (incl.
refrig.)
• Poor sealing
• High maintenance
• Prone to damage
• Prone to frost build-up
• Slow
23

• High speed• Impactable• Self-healing• Insulated• Fewer sealing edges
to leak• Minimal to no
heating requirement
Today’s Fast Roll-Up or Sliding Doors
24

Recirculatory Air Doors
• High traffic applications• Improved safety…..?• Consider fan energy use• Recirculatory air heated
– Avoid electric– Avoid hot gas with high
pressure requirement• Fans can be VFD controlled• Consider hybrid
configuration– Mated to fast or bi-
parting door, VFD on fans, heating disabled
25

Dock Leveler Seals
26
• T5/T8 Fluorescent or LED?– LED twice the cost
– LED is most efficient
– LED has the ultimate controls
– LED is only at half it’s max efficiency!
Reducing Lighting Load
27

Projection of LED Progress
28
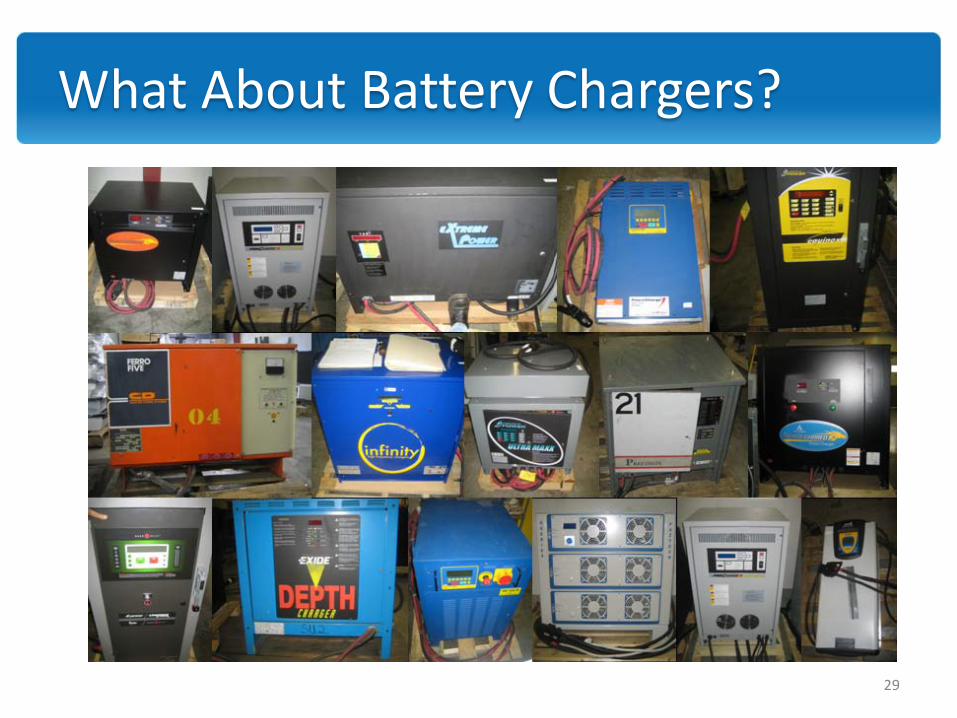
What About Battery Chargers?
29
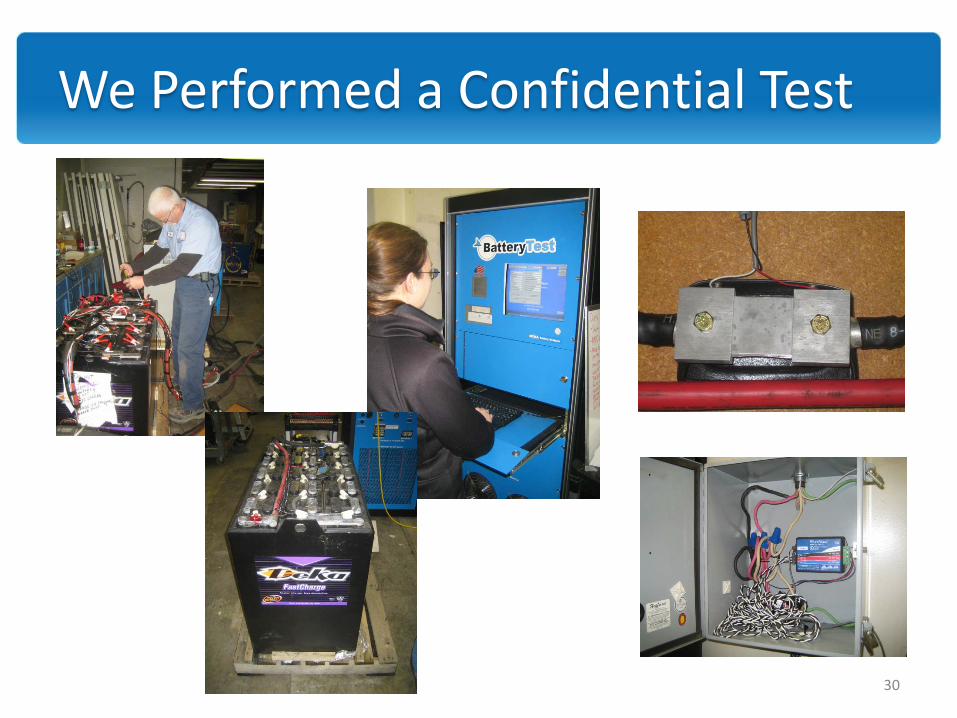
We Performed a Confidential Test
30

Cascade’s Test Findings• There are no formal efficiency ratings or testing guidelines for
chargers– This puts end-users in a real bind. Other than rigorous side-by-
side testing, there is no means of making an educated decision on an efficient charger
• There is no clear relationship between charging technology and efficiency
• 15% best to worse difference in round-trip efficiency (for modern chargers)– Not technology specific
– Not vendor specific
– Charger model is the primary issue
• Peak demand can vary by 25% between models– Fast charging can kill your peak demand 31

• LEED Certification
• Energy Star Certification
• Benchmarking
Topics for Another Day…..
32


