96
Titan Europe Plc Annual Report & Accounts 2009
17643 25/05/10 Proof6 17643 25/05/10 Proof6
Titan Europe Plc Annual Report &
Accounts 2009
Titan Europe PlcAnnual Report & Accounts 2009
Titan Europe PlcTitan Europe HeadquartersBridge Road, CookleyKidderminster, WorcestershireDY10 3SDUnited Kingdom
Tel: +44 (0)1562 850561Fax: +44 (0)1562 852554
Registered in England No. 3018340

17643 25/05/10 Proof 6 17643 25/05/10 Proof 6
Titan Europe Plc Annual Report & Accounts 2009
WHO WE ARE
OUR BUSINESS
01 Summary of Financial Results02 Global Reach — Local Presence04 10 Reasons to do business with Titan Europe06 Wheels10 Undercarriage
PERFORMANCE
14 Chief Executive’s Report
GOVERNANCE
20 Directors & Advisers22 Directors’ Report30 Corporate Governance Statement31 Independent Auditors’ Report
FINANCIAL
32 Consolidated Income Statement33 Consolidated Statement of Comprehensive Income34 Consolidated Balance Sheet35 Consolidated Statement of Changes in Equity36 Consolidated Cash Flow Statement37 Reconciliation of Cash Flow to Net Debt38 Notes to the Consolidated Financial Statements81 Independent Auditors’ Report82 Company Balance Sheet83 Movements in Shareholders’ Funds84 Notes to the Company Financial Statements
TITAN EUROPE Plc
à A world leading engineering group designing, developing, manufacturing and distributing products and services for the global construction, agricultural and mining machinery markets
à Recognised as a technical innovator and leading provider of integrated solutions. Focused on its markets and customers, Titan Europe delivers products to global OEM customers and their associated aftermarkets
à Titan Europe's objective is to excel at supporting customers through local production and distribution locations, a strategy which helps to differentiate the business from many of its competitors
à Titan Europe currently has two distinct product ranges, organised into two divisions, Wheels and Undercarriage
17643TITANEU cvr(spine).indd 217643TITANEU cvr(spine).indd 2 25/05/2010 10:1525/05/2010 10:15

17643 25/05/10 Proof6
Summary of Financial Results
www.titaneurope.com Stock code: AIM: TSW.L
01
our business
www.titaneurope.com Stock code: AIM: TSW.L
our business
01
summary of financial results
Wheels divisionThe Wheels division is a leading global designer, manufacturer and distributor of technically advanced wheels and brakes. In addition, Continental/General and Titan tyres are distributed from its centre in the UK.
The 1,100 staff support global customers from eleven locations worldwide.
undercarriage divisionThe Undercarriage division (“Titan ITM”) is a multinational specialist designer, manufacturer and distributor of undercarriage frames and components to OEMs and customers operating in the aftermarket worldwide.
1,200 people are employed across nine locations across the world.
Year ended Year ended
31 December 31 December
2009 2008
£’000 £’000
Revenue 258,570 452,313
Trading (loss)/profit (18,130) 31,164
Restructuring and rationalisation costs (14,682) (3,944)
Significant legal costs (651) —
Movement on fair value of forward foreign exchange contracts — (4,110)
(Loss)/profit from operations (33,463) 23,110
Net financing costs (9,361) (12,461)
Share of profit/(loss) of associate and joint venture 1,383 (1,014)
(Loss)/profit before income tax (41,441) 9,635
Income tax credit/(expense) 7,050 (4,144)
(Loss)/profit for the year (34,391) 5,491
Net debt (148,030) (158,165)
Cash generated from operations 11,834 34,819
www.titaneurope.com Stock code: AIM: TSW.L

02
titan europe Plc Annual Report & Accounts 2009
17643 25/05/10 Proof6
GLobaL ReaCh — LoCaL pReseNCe
Titan Europe has developed long-term relationships with OEM customers across the world over many years
americas euroPe
TiTaN’s MaRKeT
Titan continues to respond to the changing pattern of its customers’ needs, by further developing its global manufacturing footprint from its traditional European focus.
The new undercarriage factory in China is expected to be in full production during the third quarter of 2010 and a second phase of further expansion to support demand from customers is now being planned. Titan already supplies Western manufacturers based in China with undercarriage assemblies. This demand is stronger than expected.
Titan is well positioned to take advantage of growth in the South American markets with the existing Brazilian undercarriage facility and the mining wheels businesses in Chile and Peru. Titan has further projects that will assist the expansion of Titan’s mining market penetration in the Americas and Australasia for both wheel and undercarriage products. Titan has further opportunities in the significant growth markets of India and Russia.

www.titaneurope.com Stock code: AIM: TSW.L
03
our business
17643 25/05/10 Proof6
Global Reach — Local Presence
● Wheels ● Undercarriage
Pacific basin
“Titan continues to respond to the changing pattern of its customers’ needs, by further developing its global manufacturing footprint from its traditional European focus.”
17643 25/05/10 Proof6
04
titan europe Plc Annual Report & Accounts 2009
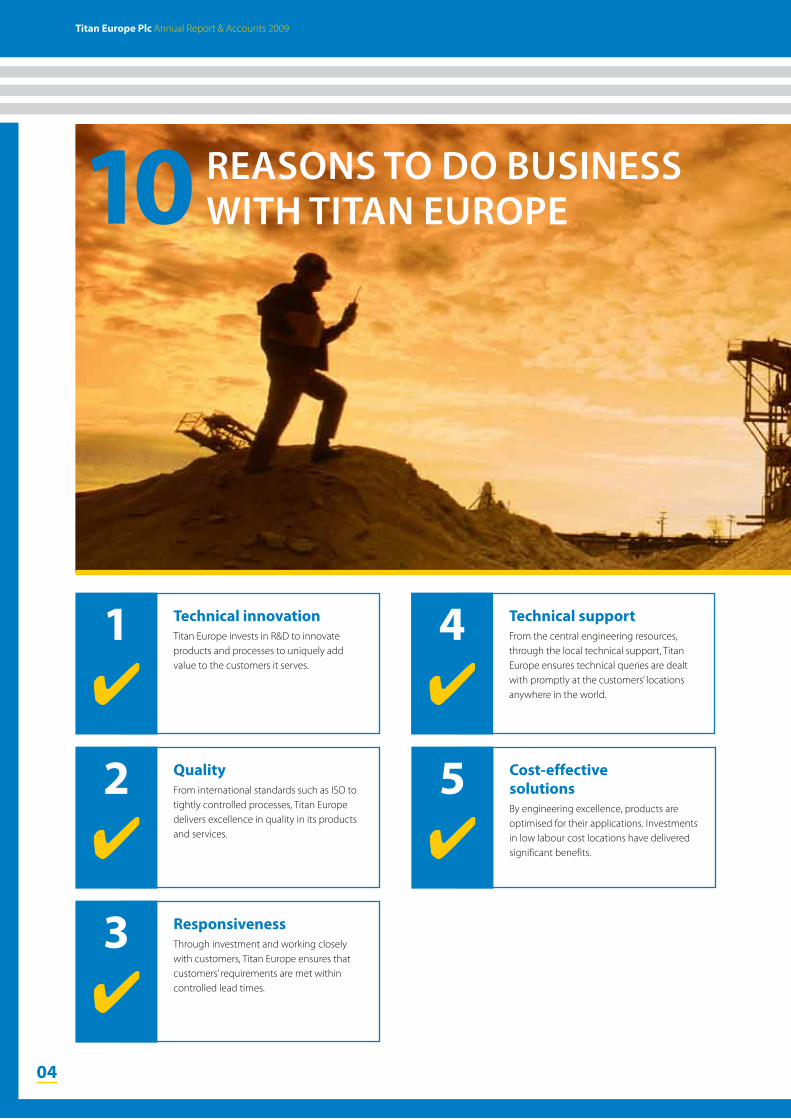
technical innovationTitan Europe invests in R&D to innovate products and processes to uniquely add value to the customers it serves.
1✔
responsivenessThrough investment and working closely with customers, Titan Europe ensures that customers’ requirements are met within controlled lead times.
3✔
cost-effective solutionsBy engineering excellence, products are optimised for their applications. Investments in low labour cost locations have delivered significant benefits.
5✔
QualityFrom international standards such as ISO to tightly controlled processes, Titan Europe delivers excellence in quality in its products and services.
2✔
technical supportFrom the central engineering resources, through the local technical support, Titan Europe ensures technical queries are dealt with promptly at the customers’ locations anywhere in the world.
4✔
ReasoNs To Do busiNess wiTh TiTaN euRope

www.titaneurope.com Stock code: AIM: TSW.L
05
our business
17643 25/05/10 Proof6
www.titaneurope.com Stock code: AIM: TSW.L
05
our business
10 Reasons to do business with Titan Europe
Global reach — local presenceTitan locates its plants close to its customers to ensure rapid response times and a well-managed supply chain which is flexible.
7✔
DiversificationTitan Europe has a unique position with facilities to support mining locally, with undercarriage, wheel and tyre needs through its service centres.
9✔
customer serviceTitan Europe sells products but more importantly a complete service to its customers, through ongoing support and technical assistance.
6✔
excellence in manufacturingWith a focus on lean manufacturing and an experienced management team, Titan Europe has highly efficient manufacturing plants across the world.
8✔
off-highway core focusTitan Europe is completely focused on its markets and its customers in the off-highway businesses.
10✔

17643 25/05/10 Proof6
06
titan europe Plc Annual Report & Accounts 2009
wheeLstitan europe is a specialist designer, manufacturer and service provider of wheels for all kinds of off-highway vehicles serving the agricultural, construction, material handling and mining industries.
44%
wheels divisionGroup revenue
wheels market split by region
Europe 69%
North America 6%
UK 3%
ROW 20%
South America 2%
06
www.titaneurope.com Stock code: AIM: TSW.L
07
our business
17643 25/05/10 Proof6
Wheels
www.titaneurope.com Stock code: AIM: TSW.L
07
our business
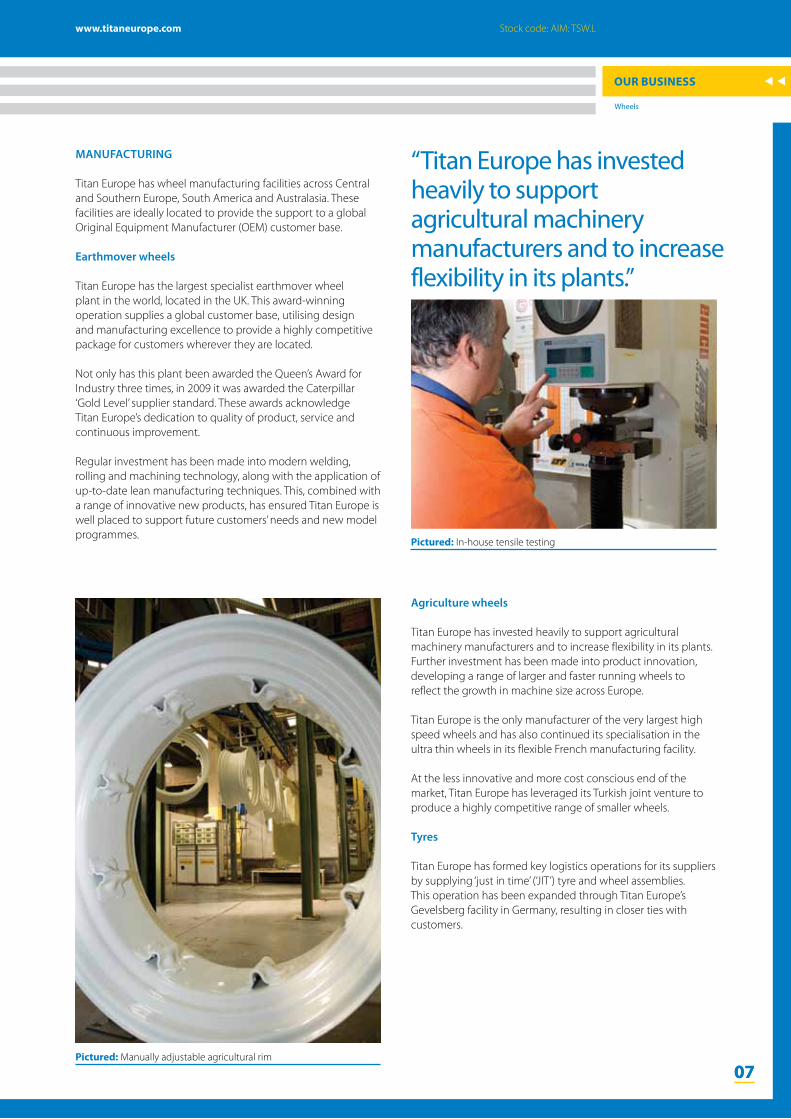
“Titan Europe has invested heavily to support agricultural machinery manufacturers and to increase flexibility in its plants.”
MaNufaCTuRiNG
Titan Europe has wheel manufacturing facilities across Central and Southern Europe, South America and Australasia. These facilities are ideally located to provide the support to a global Original Equipment Manufacturer (OEM) customer base.
earthmover wheels
Titan Europe has the largest specialist earthmover wheel plant in the world, located in the UK. This award-winning operation supplies a global customer base, utilising design and manufacturing excellence to provide a highly competitive package for customers wherever they are located.
Not only has this plant been awarded the Queen’s Award for Industry three times, in 2009 it was awarded the Caterpillar ‘Gold Level’ supplier standard. These awards acknowledge Titan Europe’s dedication to quality of product, service and continuous improvement.
Regular investment has been made into modern welding, rolling and machining technology, along with the application of up-to-date lean manufacturing techniques. This, combined with a range of innovative new products, has ensured Titan Europe is well placed to support future customers’ needs and new model programmes.
agriculture wheels
Titan Europe has invested heavily to support agricultural machinery manufacturers and to increase flexibility in its plants. Further investment has been made into product innovation, developing a range of larger and faster running wheels to reflect the growth in machine size across Europe.
Titan Europe is the only manufacturer of the very largest high speed wheels and has also continued its specialisation in the ultra thin wheels in its flexible French manufacturing facility.
At the less innovative and more cost conscious end of the market, Titan Europe has leveraged its Turkish joint venture to produce a highly competitive range of smaller wheels.
Tyres
Titan Europe has formed key logistics operations for its suppliers by supplying ‘just in time’ (‘JIT’) tyre and wheel assemblies. This operation has been expanded through Titan Europe’s Gevelsberg facility in Germany, resulting in closer ties with customers.
Pictured: In-house tensile testing
07Pictured: Manually adjustable agricultural rim
17643 25/05/10 Proof6
08
titan europe Plc Annual Report & Accounts 2009
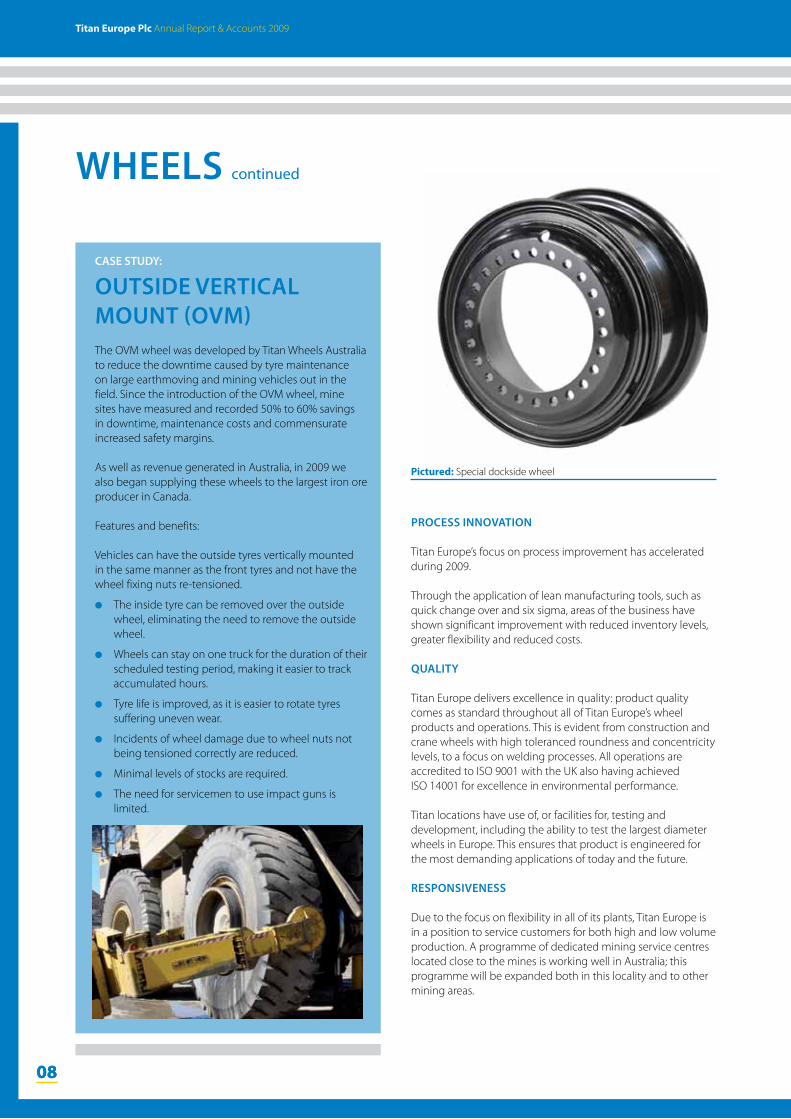
wheeLs continued
Pictured: Special dockside wheel
08
pRoCess iNNovaTioN
Titan Europe’s focus on process improvement has accelerated during 2009.
Through the application of lean manufacturing tools, such as quick change over and six sigma, areas of the business have shown significant improvement with reduced inventory levels, greater flexibility and reduced costs.
QuaLiTY
Titan Europe delivers excellence in quality: product quality comes as standard throughout all of Titan Europe’s wheel products and operations. This is evident from construction and crane wheels with high toleranced roundness and concentricity levels, to a focus on welding processes. All operations are accredited to ISO 9001 with the UK also having achieved ISO 14001 for excellence in environmental performance.
Titan locations have use of, or facilities for, testing and development, including the ability to test the largest diameter wheels in Europe. This ensures that product is engineered for the most demanding applications of today and the future.
RespoNsiveNess
Due to the focus on flexibility in all of its plants, Titan Europe is in a position to service customers for both high and low volume production. A programme of dedicated mining service centres located close to the mines is working well in Australia; this programme will be expanded both in this locality and to other mining areas.
Case sTuDY:
ouTsiDe veRTiCaL MouNT (ovM) The OVM wheel was developed by Titan Wheels Australia to reduce the downtime caused by tyre maintenance on large earthmoving and mining vehicles out in the field. Since the introduction of the OVM wheel, mine sites have measured and recorded 50% to 60% savings in downtime, maintenance costs and commensurate increased safety margins.
As well as revenue generated in Australia, in 2009 we also began supplying these wheels to the largest iron ore producer in Canada.
Features and benefits:
Vehicles can have the outside tyres vertically mounted in the same manner as the front tyres and not have the wheel fixing nuts re-tensioned.
●● The inside tyre can be removed over the outside wheel, eliminating the need to remove the outside wheel.
●● Wheels can stay on one truck for the duration of their scheduled testing period, making it easier to track accumulated hours.
●● Tyre life is improved, as it is easier to rotate tyres suffering uneven wear.
●● Incidents of wheel damage due to wheel nuts not being tensioned correctly are reduced.
●● Minimal levels of stocks are required.
●● The need for servicemen to use impact guns is limited.

www.titaneurope.com Stock code: AIM: TSW.L
09
our business
17643 25/05/10 Proof6
Wheels
www.titaneurope.com Stock code: AIM: TSW.L
09
our business
09
“Titan Europe delivers excellence in quality: product quality comes as standard throughout all of Titan Europe’s wheels products and operations.”

17643 25/05/10 Proof6
10
titan europe Plc Annual Report & Accounts 2009
uNDeRCaRRiaGetitan europe’s undercarriage division (‘titan itm’) designs, manufactures and supplies undercarriage components and complete undercarriage assemblies to the global market for construction, agricultural and mining equipment. a key titan itm objective is to provide solutions to customers’ needs and to create value through technology and innovation in products, processes and services. titan itm is a preferred supplier to many global oem manufacturers and aftermarket customers.
56%
undercarriage divisionGroup revenue
undercarriage market split by region
Europe 50%
ROW 19%
North America 12%
South America 16%
UK 3%
10
www.titaneurope.com Stock code: AIM: TSW.L
11
our business
17643 25/05/10 Proof6
Undercarriage
www.titaneurope.com Stock code: AIM: TSW.L
11
our business
11
MaNufaCTuRiNG
The new Stock OptimizatiON (SOON) manufacturing planning system was fully implemented in all Titan ITM facilities during 2009. This project has resulted in a reduction in stock of £26.4m since the start date of April 2008. The system has additional benefits of a reduction in lead times to customers and improved manufacturing flexibility.
Lean manufacturing in the Italian Titan ITM plants has also contributed to reduced set up times and the elimination of non-added-value operations, improving overall flexibility. A complete review of the Potenza plant layout and the consolidation of the other Italian plants completed in 2008 will create a very strong base from which to serve our European customers and benefit from future growth opportunities.
In February 2009, Titan ITM obtained the business licence for a new Chinese manufacturing plant, Titan ITM Tianjin Ltd. This new subsidiary has already started assembling frames for our key European customers in China. The plant will be completed in June 2010, improving both profitability and flexibility from the second half of 2010 within Titan ITM.
Demand levels from our target customers in China have been stronger than originally expected.
“Titan ITM is continually adapting products and processes to improve performance.”
pRoDuCT iNNovaTioN
Titan ITM is continually adapting products and processes to improve performance. Investment has been made in the design and development of a new generation of complete machines for key OEMs.
New products have also progressed with an extended life for extreme working conditions. Examples of completed projects include the new generation 140 ton mining excavators, the 60 ton telecrane undercarriage and the new generation of road mills and paver machines. 2009 also saw the development of new rollers, chains and shoes for heavy duty and mining applications. Large mining applications were enhanced with the introduction of a new range of D11 undercarriage components to support the range of Titan ITM products worldwide. The success of these projects has increased Titan ITM market share with existing and new customers, significantly adding to Titan ITM’s profile, giving the division the opportunity to differentiate from competition. Titan ITM will further benefit as its market recovers.
These developments are co-ordinated through Titan ITM’s global engineering headquarters in Germany. As reported in 2008, significant investment has also been made in additional testing capacity. Titan ITM testing is now operating in Italy alongside other Group testing facilities. The combination of German and Italian engineering teams gives Titan ITM the potential capability to support future undercarriage developments and customers’ new model programmes.
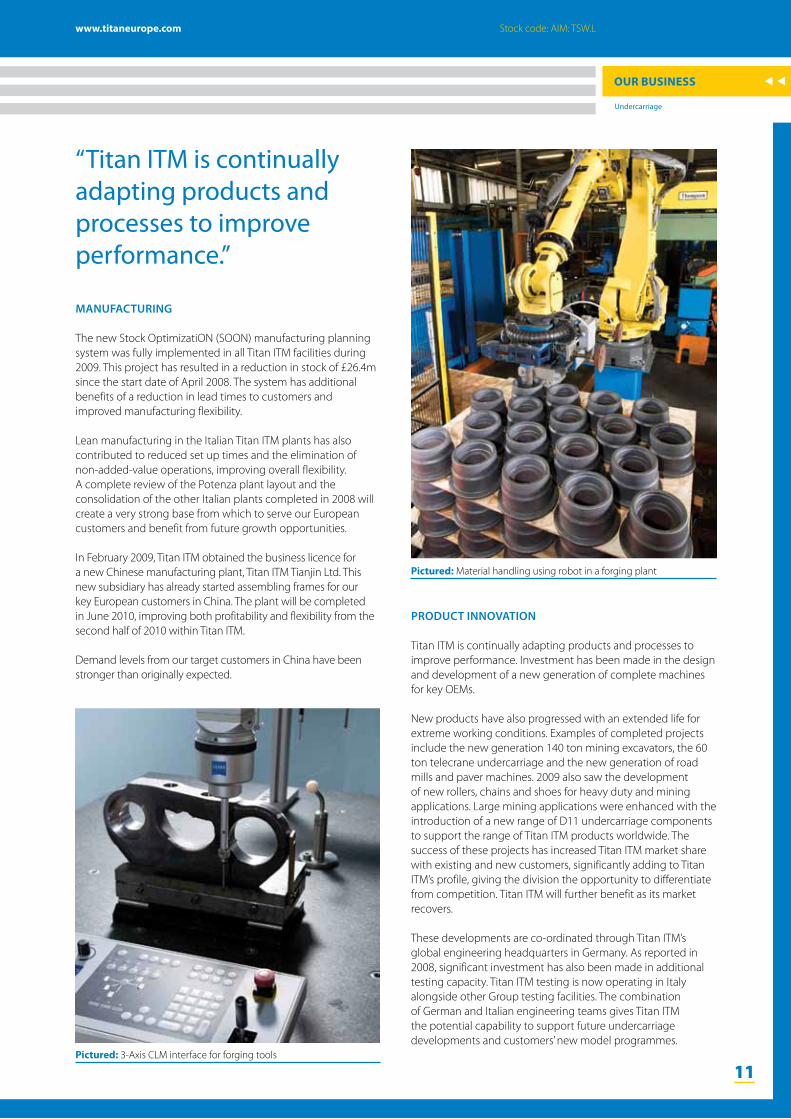
Pictured: Material handling using robot in a forging plant
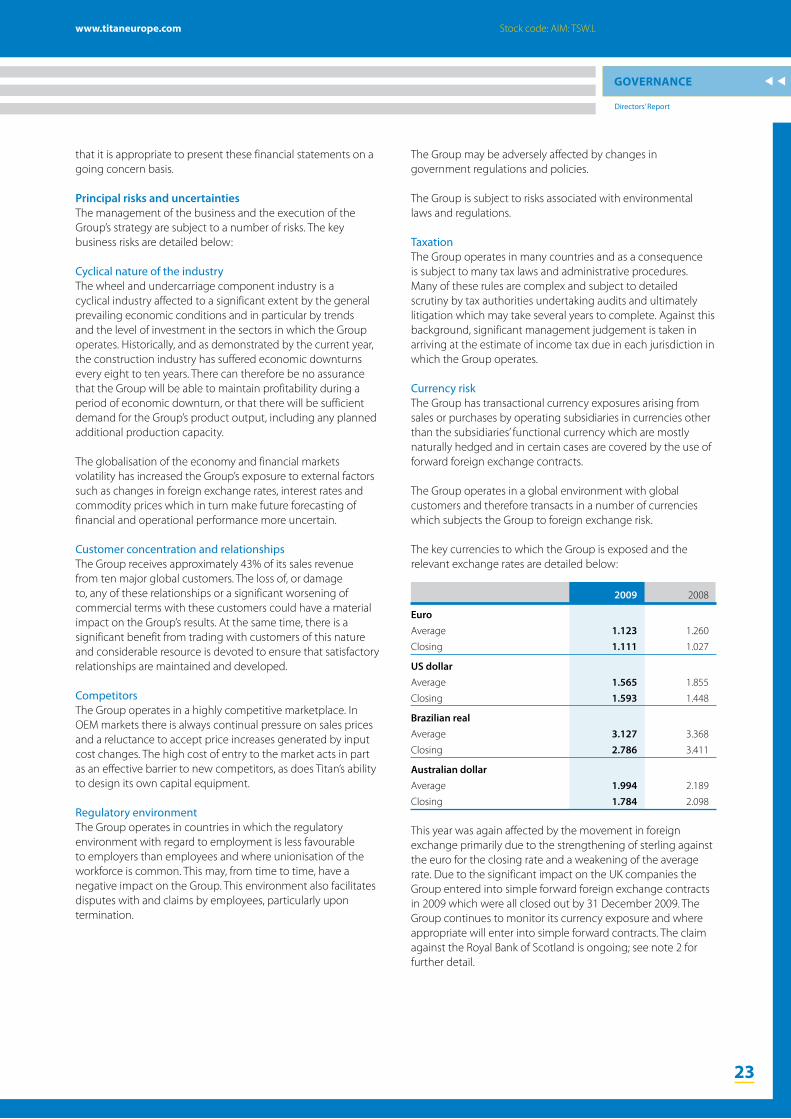
Pictured: 3-Axis CLM interface for forging tools

17643 25/05/10 Proof6
12
titan europe Plc Annual Report & Accounts 2009
uNDeRCaRRiaGe continued
12
In 2009, Titan ITM further recognised the need for aftersales customer support by assigning a senior engineer to head up this function. His team’s role is primarily focused on ensuring an effective aftersales service to the customers, at the same time gathering key indicators from the field to maintain continuous and direct improvements in product performance.
QuaLiTY
Titan ITM maintains a global reputation for high quality products designed and manufactured worldwide, using a combination of local experience and support from our central engineering functions. The ITM quality standards are the same for customers worldwide, independent of the location of manufacture.
RespoNsiveNess
Titan ITM manufactures a full range of undercarriage components and, uniquely, the complete undercarriage frame assembly; this provides a clear differentiation in the market. With customers demanding more and more ‘full service support’, Titan ITM is in a position to deliver this. For the aftermarket, successful flexible sales and marketing techniques previously used in Europe have been transferred to South America. This has supported and driven growth despite difficult general market conditions.
GLobaL pReseNCe aND CosT-effeCTiveNess
The financial crisis and dramatic downturn of the markets in which Titan ITM operates have accelerated the process of delocalisation of the main Western OEMs with relocation, mainly to the Far East. This relocation is aimed at serving the local growth in demand as well as to address continuous pressure on price for some products. Recognising the OEM demands for cost improvement and local sourcing, Titan ITM is positioned to address its customers’ globalisation strategy.
Titan ITM’s manufacturing platform is well balanced to serve global customers worldwide. This will be further enhanced with the new plant in China, unique in manufacturing lower cost undercarriage products to service Western OEM customers who have transferred production to China. In addition to this, the efficient and modern plant in Brazil services the South and North American markets. Global customers will benefit from products supplied with the traditional high levels of Titan ITM quality at lower costs.
European plants continue to service local OEMs effectively and also retain the manufacture of special products for mining and heavy duty applications. The technical knowledge and developments from local Titan ITM experts are always supported by the central Titan ITM engineering resources.
Pictured: Track group assembly with Z bar shoes
Pictured: Single flange roller with shaft

www.titaneurope.com Stock code: AIM: TSW.L
13
our business
17643 25/05/10 Proof6
Undercarriage
www.titaneurope.com Stock code: AIM: TSW.L
13
our business
13
Case sTuDY:
italtractor Landroni LTDa received the ‘partner-level’ supplier award from John DeereIn January 2009, Italtractor Landroni LTDA received the highest classification award possible for a supplier to John Deere do Brazil. This ‘Partner-level’ Supplier Award formally recognises Titan’s dedicated service and support on behalf of its customers. Only six suppliers from almost 400 global suppliers received this award which was accredited through the ‘Achieving Excellence’ programme.
‘Achieving Excellence’ is a strategy for world class supplier relationships that evaluates the performance of the supplier in terms of ‘Quality’, ‘Delivery’, ‘Technical Support’, ‘Wavelength’ and ‘Cost Management’.

17643 25/05/10 Proof6
14
titan europe Plc Annual Report & Accounts 2009
Chief exeCuTive’s RepoRT
14
“Titan continues to have a strong presence with key OEMs with long-term relationships and with a 100% top customer retention.”
miKe aKers Chief Executive

www.titaneurope.com Stock code: AIM: TSW.L
15
our business
17643 25/05/10 Proof6
Chief Executive’s Report
www.titaneurope.com Stock code: AIM: TSW.L
15
Performance
iNTRoDuCTioN
The Group continues to be the only specialist manufacturer of tracked and wheeled movement systems to the construction, agricultural and mining industries.
The impact of the recession on these industries has been reported so widely that it needs no further embellishment here. It can however be reported that Q3/Q4 2009 were, as predicted, the worst trading periods for the business with the ‘bottom’ occurring somewhere in Q3.
It has been evident that within the industries that Titan supplies, 2009 end-user sales have been significantly higher than equipment manufacturers’ build rates. This destocking effect has had a significantly geared impact on revenue. As a consequence, without end market increases, volumes of manufacture for Titan’s market segments will rise in 2010.
For Titan the main impact of the recession has fallen in Europe and North America, whilst the Australian and South American businesses fared relatively well. Equally, key areas for restructuring of Titan’s manufacturing resources have been in the ‘traditional’ manufacturing base of Western Europe, particularly Italy. The programme of locating production into new growth areas is expected to continue and subsequently, this will have a permanent impact on some of Titan’s more traditional manufacturing supply routes.
The programme of reducing fixed costs has continued, in terms of physical assets and, unavoidably, personnel. During the year average employee numbers reduced by 20% to 2,336 (2008: 2,920); in addition to this reduction, various government schemes around the world have allowed a temporary reduction in employees which accounted for a reduction of a further 486 people (21%). Furthermore, as part of this programme, there have been substantial changes in manufacturing methods which have resulted in greater flexibility, faster changeover times and lower inventory costs.
Titan continues to have a strong presence with key OEMs with long-term relationships and with a 100% top customer retention.
ResuLTs
The Group produced revenue of £258.6m (2008: £452.3m). This was a decrease of 42.8% over 2008, and was affected by the move in exchange rates, the impact of which is clearly set out in the Directors’ Report on page 23.
The Wheels division recorded revenue (including share of joint venture) at £118.0m (2008: £197.2m), down 40.2% on 2008 levels, and produced a trading loss (excluding share of joint venture) of £4.2m (2008: £22.6m profit).
The Undercarriage division accounted for revenue of £143.5m (2008: £259.5m), down 44.7% on 2008 levels, and recorded a trading loss of £13.9m (2008: £8.6m profit).
The reduction in revenue in the Undercarriage division was higher than the Wheels division due to the higher exposure of the Undercarriage division to the construction market which was more severely impacted by the recession.
Overall, the Group trading loss was £18.1m (2008: £31.2m profit). The impact of significant one-off items (largely relating to restructuring and in 2008, movements in fair value of exchange contracts) left operating loss at £33.5m (2008: £23.1m profit), pre-tax loss at £41.4m (2008: £9.6m profit) and the post-tax loss for the year ended December 2009 at £34.4m (2008: £5.5m profit).
Case sTuDY:
CaTeRpiLLaR As part of Caterpillar’s supplier quality excellence process
certification, Titan Steel Wheels Ltd was awarded the
prestigious ‘Gold Level’ standard in 2009. This noteworthy
recognition follows Titan’s achievement in previously
attaining Caterpillar’s ‘Supplier of the Year’.
The Caterpillar award at ‘Gold Level’ puts Titan Steel Wheels
at the very pinnacle of suppliers to Caterpillar and is a
measure of outstanding product quality, and the application
of modern manufacturing techniques and methods.
On announcing the award, Jennifer Franklin from Caterpillar
Global Quality and part of the Caterpillar Production Centre
of Excellence said:
“Our ‘Gold Level’ standard recognises not only quality of process
and product but also reflects the standards invested by our
suppliers through their teams. Congratulations to the employees
at Titan Steel Wheels on this achievement and we look forward
to working with them as we look to the future.”
15
Pictured: Group management team

17643 25/05/10 Proof6
16
titan europe Plc Annual Report & Accounts 2009
Chief exeCuTive’s RepoRT continued
“The global downturn in industrial activity has not changed the outstanding quality of Titan’s physical assets and human resources.”Basic loss per share was 41.44p (2008: 6.62p earnings), however, the pre-exceptional level was 28.70p loss per share (2008: 13.43p earnings).
Although there was a significant operating loss, the Group’s net cash inflow from operating activities was £3.3m (2008: £22.6m), mainly as a result of the £24.8m reduction in working capital.
Net debt at the year end was £148.0m (2008: £158.2m). This again was significantly impacted by exchange rates; as the majority of the Group’s debt is in euros, reflecting the Group’s asset base and trading activities being heavily skewed to the Euro Zone. The impact of exchange rates on net debt is further explained in the Directors’ Report on page 23.
The Group’s property, plant and equipment had a net book value of £150.2m (2008: £171.0m) being mainly freehold land and buildings, and plant and machinery. Capital expenditure was reduced to £5.4m (2008: £18.2m), which is considered by the Board to be a minimum consistent with health and safety, and key strategic business needs.
opeRaTioNs
The global downturn in industrial activity has not changed the outstanding quality of Titan’s physical assets and human resources. The Group has manufacturing plants in Europe, South America, North America and Australia and will begin manufacturing in China during 2010. Many of these plants command major market shares in industry sectors with a high cost of entry and significant shipping cost barriers for non-indigenous manufacturers.
The Group’s technical excellence continues to ensure that its sales are dependent not only on price and quality, but the ability of engineers to “design & build” unique solutions to meet customers’ needs.
wheeLs DivisioN
Revenue from the agricultural market restated at 2008 rates was down 39.1% to £66.0m (2008: £108.4m). Agricultural revenues represented 61% of total revenues (2008: 55%).
Revenue from the construction market restated at 2008 rates was down 57.2% to £33.1m (2008: £77.4m). Construction revenues represented 30% of total revenues (2008: 39%).
Revenue from the mining market restated at 2008 rates was down 23.7% to £7.1m (2008: £9.3m). Mining revenues represented 7% of total revenues (2008: 5%).
Other revenue amounted to £2.2m (2008: £2.1m).
Titan Italia, Titan France, and the 50% joint venture with Titan Jantsa, all of which produce agricultural wheels, saw substantial volume reductions. Titan Italia was able to use the temporary lay off (‘CIG’) system to reduce the effective headcount and therefore cost. A somewhat slower recovery is expected in the agricultural market to that in the mining and construction sectors. Management expectations are that volumes are likely to increase during Q2 2010.
Titan Steel Wheels, manufacturing wheels for mining and construction, saw the biggest individual revenue fall. There was a heavy programme of redundancy in this plant, but, as demand through the supply chain increases, volumes are now rising and new staff are being hired.
The mining activities in Australia, Chile and Peru fared better than other wheel areas and are already seeing full recovery to pre-recession levels of activity.
The associate company, Wheels India Limited (‘Wheels India’), in which Titan hold a 35.9% equity stake, started to recover during 2009 with only an 11.4% decline in revenues. The share of the pre-exceptional profits of Wheels India amounted to £0.5m (2008: £1.2m). This is further explained in the Directors’ Report on page 25.
Pictured: Wheels management team

www.titaneurope.com Stock code: AIM: TSW.L
17
our business
17643 25/05/10 Proof6
Chief Executive’s Report
www.titaneurope.com Stock code: AIM: TSW.L
17
Performance
uNDeRCaRRiaGe DivisioN
Revenue from the agricultural market restated at 2008 rates was down 24.4% to £6.2m (2008: £8.2m). Agricultural revenues represented 5% of total revenues (2008: 3%).
Revenue from the construction market restated at 2008 rates was down 53.2% to £81.4m (2008: £174.0m). Construction revenues represented 64% of total revenues (2008: 67%).
Revenue from the mining market restated at 2008 rates was down 47.0% to £38.4m (2008: £72.5m). Mining revenues represented 30% of total revenues (2008: 28%).
Other revenue amounted to £1.9m (2008: £4.8m).
The Undercarriage division experienced an unprecedented year with a reduction in revenues of 50.7% (at constant exchange rates) and an even more dramatic reduction in manufacturing activity of about 65%. Volume in manufacturing started to decline, particularly in North America, during 2007 and continued to decline in 2008 and 2009.
Case sTuDY:
New ChiNa pLaNTAcknowledging the increasing numbers of Western OEMs
moving production to China to gain market share, the
Undercarriage division began work on a new plant in this
region during early 2009, obtaining the business licence in
February 2009. This facility became active in the final quarter
of 2009.
Located in Tianjin, the nearest port to the city of Bejing,
and at an anticipated total cost of €5,000,000 over the next
3 years, the manufacturing operation services the local
demands of OEMs, and also protects margins on worldwide
AMKs by focusing on the more competitive range of small
chains and rollers.
Production during phase one is concentrated on roller and
chain components, though by phase three in 2012, the plant
is expected to have expanded its capacity, also enabling it to
provide idler and shoe components.
Against this backdrop, the key target for the division was the control of working capital and cash in the business together with the reduction of fixed costs. The division identified and implemented the most appropriate solutions in terms of temporary or permanent redundancy agreements with workers and unions in the different regions in which Titan operates.
Important cutbacks in capacity and a plant closure were completed in 2008, but these did not fully compensate for the further volume reductions experienced in 2009. The speed of the continuous reduction in volume and the necessity to adjust the manufacturing activity almost on a “day by day” basis did not allow the management of the workforce and fixed cost reductions in an efficient manner, therefore impacting Titan’s profitability.
The management of the working capital and the continuous focus on stock reduction has driven a negative impact on margins due to rework costs and in some cases higher transport costs.
Whilst the operating environment was very difficult, Titan continued its strategic programme of consolidation of the manufacturing activity in Europe and globalisation of the manufacturing footprint in line with Titan’s key Western OEMs strategies. A key issue for the Group’s OEMs during 2009 was the ability of key suppliers to deliver a strategy in line with their global sourcing requirements mainly in China, India and Brazil.
Brazil, since acquisition in 2005, has become a very efficient and competitive manufacturing operation, making small/medium components for undercarriage vehicles in South and North America. It has been a very important solution not only to address local demand, but also to win new business in North America in the face of competition mainly from the Far East.
China has been the key focus of 2009 in the global strategy. Titan obtained the business licence in February 2009 and Titan has dedicated resources to set up a new manufacturing operation in China to serve the local demand from Western OEMs. The activity of serving this market started during the fourth quarter of 2009.
Pictured: Undercarriage management team

17643 25/05/10 Proof6
titan europe Plc Annual Report & Accounts 2009
18
Year ended
Year ended 31 December Year ended
31 December 2009 31 December
2009 at 2008 rates 2008
£m £m £m
Market
Agricultural 80.0 72.2 116.6
Construction 126.0 114.5 251.4
Mining 51.0 45.5 81.8
Other 4.5 4.1 6.9
Total revenue 261.5 236.3 456.7
Revenue and trading profit by division Year ended Year ended 31 December Year ended
31 December 2009 31 December
2009 at 2008 rates 2008
£000 £000 £000
Revenue
Wheels (including
share of joint venture) 118,049 108,427 197,224
Undercarriages 143,451 127,908 259,526
Revenue including
share of joint venture 261,500 236,335 456,750
Less share of joint
venture (2,930) (2,969) (4,437)
Group revenue 258,570 233,366 452,313
Trading (loss)/profit
Wheels (excluding
share of joint venture) (4,192) (4,102) 22,571
As a percentage of
revenue (3.6%) (3.9%) 11.7%
Undercarriages (13,938) (12,040) 8,593
As a percentage of
revenue (9.7%) (9.4%) 3.3%
Group trading (loss)/profit (18,130) (16,142) 31,164
Chief exeCuTive’s RepoRT continued
The focus on the European business based on engineering excellence and servicing our major customers with a ‘design and build’ solution for their complete undercarriage needs has continued.
Further progress has been made towards creating a ‘Centre of Excellence’ for engineering in the facility at Gevelsberg, Germany, with the fully assembled frame business being supplied from this location and from the Intertractor America location in Elkhorn, Wisconsin. This engineering resource is able to focus on large scale applications; manufacturing facilities are expected to move in a similar direction. The testing site has been completed at the Group testing department in Italy and started to operate with all new testing machines in 2009.
The Italian manufacturing plants are being re-engineered to focus on mid to large range products with a more flexible manufacturing process system using less work in progress and with shorter lead times.
Other developments which have been reported in the past, such as mining and service centres, are working well and will be a blueprint for the future.
In all, the Undercarriage division has overcome the worst part of the global recession whilst continuing to operate efficiently as a global player in a global market, and is well placed to respond as demand increases.
Revenue by geographical destination and market (including share of joint venture) Year ended
Year ended 31 December Year ended
31 December 2009 31 December
2009 at 2008 rates 2008
£m £m £m
Destination
UK 7.8 7.3 20.7
Europe 153.0 138.4 264.8
North America 24.0 20.8 55.2
South America 26.2 24.3 28.6
Rest of the World 50.5 45.5 87.4
Total revenue 261.5 236.3 456.7

www.titaneurope.com Stock code: AIM: TSW.L
19
our business
17643 25/05/10 Proof6
Chief Executive’s Report
www.titaneurope.com Stock code: AIM: TSW.L
19
Performance
DiviDeND
As part of the amendment and restatement agreement with our primary bankers Intesa Sanpaolo SpA and Unicredit SpA, no dividend distributions will be made until after the Company has recommenced payments of the loan in January 2011 and are subject to the Company achieving a leverage ratio of 3.5:1 or less.
2010 ouTLooK
Entering Q2 of the 2010 financial year, the Group is now seeing order volumes at a level approximately 45% higher than in the second half of 2009.
Overall, the Board believes that the business has created a strong platform for the ongoing development of the Group, with stronger engineering and quality presence in the market, supported by more efficient manufacturing. This is confirmed by the recent awards from Caterpillar (‘Gold Level’ for the Titan Steel Wheels business in the UK) and John Deere (the ‘Partner-level’ Supplier Award for the Italtractor Landroni business in Brazil).
Titan continues to respond to the changing pattern of its customers’ needs, by further developing the global manufacturing footprint from its traditional European focus. The new undercarriage factory in China is expected to be in full production during Q3 and a second phase of further expansion to support demand from customers is now being planned. Titan already supplies Western manufacturers based in China with undercarriage assemblies. This demand is stronger than expected.
This greater diversity of location, stronger market presence and manufacturing efficiencies, combined with a substantial reduction in fixed costs, leaves the Group well placed to benefit from the recovery in its markets.
posT-YeaR eND eveNTs
amendment of banking facilitiesDue to the significant impact on the 2009 results as a result of the global downturn, the Group has negotiated an amendment to the covenants which includes no testing until the June 2011 results and revised covenants based on the Group’s revised business plans. This does not affect the capital repayment profile as renegotiated in May 2009.
Mike akersChief Executive7 June 2010
Pictured: Fabricated idler with precision machined brackets
Pictured: MAVT adjustable tractor wheels
This outlook may contain forward-looking statements with respect to the financial condition, results, operations and businesses of Titan Europe Plc. Such statements and forecasts involve risk and uncertainty because they relate to events and depend upon circumstances that will occur in the future. There are a number of factors that could cause actual results or developments to differ materially from those expressed or implied by forward-looking statements and forecasts. Forward-looking statements and forecasts are based on the directors’ current view and information known to them at the date of this statement. Nothing in this statement should be construed as a profit forecast.

17643 25/05/10 Proof6
20
titan europe Plc Annual Report & Accounts 2009
DiReCToRs & aDviseRs
1. 2. 3.
4. 5. 6.
7.
1. MoRRY TaYLoR
2. MiKe aKeRs
3. GaRY ChesTeRToN
4. CeCiLia La MaNNa
5. viNCeNT wiCKs
6. biLL biLLiG
7. phiL GaRTsiDe

www.titaneurope.com Stock code: AIM: TSW.L
21
our business
17643 25/05/10 Proof6
Directors & Advisers
www.titaneurope.com Stock code: AIM: TSW.L
21
GoVernance
Company and Registered officeTitan Europe PlcBridge Road, CookleyKidderminsterWorcestershire DY10 3SDTel: +44 (0)1562 [email protected]
Registered in england3018340
Company secretaryGary Chesterton FCCA
auditorsPricewaterhouseCoopers LLPChartered Accountants andRegistered Auditors19 Cornwall StreetBirmingham B3 2DT
financial public RelationsCitigate Dewe Rogerson Ltd1 Wrens Court, Lower Queen Street Birmingham B72 1RT
Legal adviserHBJ Gateley Wareing LLPOne Eleven, Edmund StreetBirmingham B3 2HJ
Nominated adviser and brokerSeymour Pierce Ltd20 Old Bailey London EC4M 7EN
MoRRY TaYLoRNon-executive Chairman
Morry is Chief Executive of Titan International Inc. He comes from an engineering family. He holds a degree in engineering from Michigan Tech. Morry developed a business as a manufacturers’ agent in the wheel business before founding, with one of his principals, Titan Wheel (then named “Can-Am”). Morry managed the growth and expansion of this business which became a leading specialist manufacturer of off-highway wheels and tyres in the US, taking the Company public first on NASDAQ and later on NYSE. Morry was appointed as a director of Titan Europe on 4 March 2004.
MiKe aKeRsChief executive
Mike has a background in the UK automotive components industry. He began organising the start-up of Titan Europe’s European operations in 1989 and became a member of Titan International Inc. management team in 1995. Mike has overseen the development of Titan Europe. He graduated with a first class honours degree in Engineering from the University of Cardiff, holds an MBA from Warwick University and sits on the Board of Warwick Business School. Mike was appointed as a director of Titan Europe on 2 February 1995.
GaRY ChesTeRToNGroup finance Director
Gary has over 26 years of internal audit and financial management experience gained from within the construction and engineering sectors. Before joining Titan Europe in 2006 to assist the Group Finance Director, he was European Financial Controller for a US construction company; prior to this he worked for a Fortune 200 diversified manufacturing company in both financial and general management roles. Gary became Group Finance Director in October 2008, focusing on the management of the Group’s finance and treasury functions.
CeCiLia La MaNNaexecutive Director
Cecilia is a chartered accountant and has a doctorate in accountancy. She trained and worked for Pricewaterhouse Coopers in Italy and in the UK. She joined Titan Europe in 1996 as Finance Controller of the Italian subsidiary and developed her career in the Group becoming Finance Director of Titan Europe in 2001. She was involved in the extensive acquisition programs including the Group’s expansion into the undercarriages sector. In 2006, she led the integration of Italtractor ITM into the Group. Her primary role is now as Managing Director of the Undercarriage division.
viNCeNT wiCKsexecutive Director
Vince is an experienced Company Secretary and Finance Director with a long career in UK manufacturing companies. He is a Chartered Secretary and also a Fellow of the Chartered Institute of Management Accountants. He joined the Company that is now Titan Steel Wheels Limited as Finance Director in 1989.
biLL biLLiGNon-executive Director
Bill is a well-known and respected figure in the automotive and engineering world on both sides of the Atlantic. Bill is Vice-Chairman of the Board of directors of Titan International Inc. and is also director and Chairman of MSX International Inc., a leading supplier of subcontract engineering to the automotive industry.
phiL GaRTsiDeNon-executive Director
Phil is an accountant with experience in the manufacturing industry at Chief Executive level. He has been a director of several UK public companies and now combines managing a number of engineering businesses with his role as Chairman of Bolton Wanderers Football Club. Phil was appointed as a director of Titan Europe on 4 March 2004.

17643 25/05/10 Proof6
22
titan europe Plc Annual Report & Accounts 2009
DiReCToRs’ RepoRT
The directors present their report and the audited financial statements of the Company and Group for the year ended 31 December 2009.
pRiNCipaL aCTiviTies
The principal activity of the Group is the manufacture and sale of steel wheels and undercarriages for the off-highway vehicles industry. Principal markets are construction, agriculture and mining. The principal activity of the Company is to act as a holding company.
busiNess Review
business environmentTitan Europe and its subsidiaries are the only worldwide manufacturer specialising in the technology of both tracked and wheeled vehicle movement systems for the construction, agricultural and mining industries. The overall demand for the products, which is driven primarily by the demand for construction, agricultural and mining equipment, has been severely affected by the global recession and the destocking process implemented by the Original Equipment Manufacturers (‘OEMs’).
The Group operates in a highly competitive market but is well placed because of its concentration in developing the technology of this highly specialised product area which is important to relationships with key OEMs such as Caterpillar, Agco, CNH, Liebherr and Hitachi. The Company continues to work closely with these OEMs on future product development.
strategyTitan’s strategy is designed to create the most effective supply systems for undercarriage assemblies, components and spare parts; and for wheels and wheel and tyre assemblies to customers at all levels in the supply chain throughout the construction, agricultural and mining world. These include OEMs, large users of fleets of equipment, dealers and distributors.
The Group has continued to support its OEM customers with their global repositioning such as the joint venture, Titan Jantsa in Turkey and the new plant in China which will begin production during 2010. There are further ongoing projects to enhance this strategy.
This manufacturing and distribution strategy will be supported by the best available research development design and testing facilities centrally located to achieve maximum efficiency and accessibility for our customers.
Finally, the Group aims to employ the best available international management team to obtain maximum benefit from its facilities.
Research and developmentTitan continually develops innovative products to add value to its customers’ machines by improving cost and performance. Titan’s focus on developing solutions for its customers with the centralised engineering development for undercarriage products in Germany has resulted in a significant number of new project opportunities with both existing and new customers.
Due to the global recession and an emphasis on cash preservation the Group reduced its capital expenditure to a minimum level consistent with health & safety and key strategic business needs. In 2009, there was a net cash outflow for capital expenditure of £4,000,000 (2008: £13,900,000).
TaxationThe effective tax rate for 2009 is 16.5%, as per the Key Financial Ratios on page 27, which is below the UK rate of corporation tax. This is due to the impact of our overseas entities, mainly Italian, suffering an average effective rate of 14.5%. Note 9 shows an impact of £3,321,000 (2008: (£760,000)) within “Movement in unrecognised deferred taxation”. Of this movement, the Italian subsidiaries account for £3,600,000 (2008: £nil) as a result of the write-off of deferred tax assets which expire in 2010 and 2011. future outlookAlthough generally the global markets continue to be weak across all sectors, there still exist opportunities for the Group specifically in the large mining wheels and undercarriages sectors. This, coupled with the impact of our cost reductions and working capital focus, will continue to strengthen the Group’s position as the global markets recover.
financing and going concernThe Group funds its operations through a mixture of retained earnings and borrowing facilities, including leasing. The relative proportions of equity and borrowings are governed by stipulated parameters. These are designed to preserve prudent financial ratios, including interest, dividend and cash flow cover, whilst also minimising the overall weighted average cost of capital to the Group.
All the Group’s borrowing facilities are arranged centrally and controlled by the Group Finance Director. The funds are raised in an appropriate way to serve the needs of the business in a range of currencies and locations. These funds may then be lent, directly or indirectly, to operating subsidiaries on commercial arm’s length terms.
The directors have assessed the future funding requirements of the Group and the Company. Having undertaken this review and considered a number of possible outcomes, the directors are of the opinion that the Group has adequate resources to fund its operations for the foreseeable future and so determine
www.titaneurope.com Stock code: AIM: TSW.L
23
our business
17643 25/05/10 Proof6
Directors’ Report
www.titaneurope.com Stock code: AIM: TSW.L
23
GoVernance
that it is appropriate to present these financial statements on a going concern basis.
principal risks and uncertaintiesThe management of the business and the execution of the Group’s strategy are subject to a number of risks. The key business risks are detailed below:
Cyclical nature of the industryThe wheel and undercarriage component industry is a cyclical industry affected to a significant extent by the general prevailing economic conditions and in particular by trends and the level of investment in the sectors in which the Group operates. Historically, and as demonstrated by the current year, the construction industry has suffered economic downturns every eight to ten years. There can therefore be no assurance that the Group will be able to maintain profitability during a period of economic downturn, or that there will be sufficient demand for the Group’s product output, including any planned additional production capacity.
The globalisation of the economy and financial markets volatility has increased the Group’s exposure to external factors such as changes in foreign exchange rates, interest rates and commodity prices which in turn make future forecasting of financial and operational performance more uncertain.
Customer concentration and relationshipsThe Group receives approximately 43% of its sales revenue from ten major global customers. The loss of, or damage to, any of these relationships or a significant worsening of commercial terms with these customers could have a material impact on the Group’s results. At the same time, there is a significant benefit from trading with customers of this nature and considerable resource is devoted to ensure that satisfactory relationships are maintained and developed.
CompetitorsThe Group operates in a highly competitive marketplace. In OEM markets there is always continual pressure on sales prices and a reluctance to accept price increases generated by input cost changes. The high cost of entry to the market acts in part as an effective barrier to new competitors, as does Titan’s ability to design its own capital equipment.
Regulatory environmentThe Group operates in countries in which the regulatory environment with regard to employment is less favourable to employers than employees and where unionisation of the workforce is common. This may, from time to time, have a negative impact on the Group. This environment also facilitates disputes with and claims by employees, particularly upon termination.
The Group may be adversely affected by changes in government regulations and policies.
The Group is subject to risks associated with environmental laws and regulations.
TaxationThe Group operates in many countries and as a consequence is subject to many tax laws and administrative procedures. Many of these rules are complex and subject to detailed scrutiny by tax authorities undertaking audits and ultimately litigation which may take several years to complete. Against this background, significant management judgement is taken in arriving at the estimate of income tax due in each jurisdiction in which the Group operates. Currency riskThe Group has transactional currency exposures arising from sales or purchases by operating subsidiaries in currencies other than the subsidiaries’ functional currency which are mostly naturally hedged and in certain cases are covered by the use of forward foreign exchange contracts.
The Group operates in a global environment with global customers and therefore transacts in a number of currencies which subjects the Group to foreign exchange risk.
The key currencies to which the Group is exposed and the relevant exchange rates are detailed below:
2009 2008
euro
Average 1.123 1.260
Closing 1.111 1.027
us dollar
Average 1.565 1.855
Closing 1.593 1.448
brazilian real
Average 3.127 3.368
Closing 2.786 3.411
australian dollar
Average 1.994 2.189
Closing 1.784 2.098
This year was again affected by the movement in foreign exchange primarily due to the strengthening of sterling against the euro for the closing rate and a weakening of the average rate. Due to the significant impact on the UK companies the Group entered into simple forward foreign exchange contracts in 2009 which were all closed out by 31 December 2009. The Group continues to monitor its currency exposure and where appropriate will enter into simple forward contracts. The claim against the Royal Bank of Scotland is ongoing; see note 2 for further detail.
17643 25/05/10 Proof6
24
titan europe Plc Annual Report & Accounts 2009
DiReCToRs’ RepoRT continued
InsuranceThe Group insures against the impact of a range of unpredicted losses whether associated with business assets such as building, plant, machinery and ensuing financial impact arising from the interruption to the business, as well as its liabilities (whether statutory or not) in connection with employees, products supplied or the public at large.
Supply chain — key commoditiesThe Group is exposed to price fluctuations of key commodities, primarily steel and energy. The Group mitigates this risk with the Group purchasing structure and resultant purchasing power of the Group.
Credit riskWith the concentration of customers noted above, the financial failure of any one of them could have a material impact on the results. The Group closely monitors credit exposures which are reported to divisional management, and overall divisional performance is reviewed regularly by senior management.
Environmental riskThe environmental laws of various countries impose obligations on our businesses to operate in an environmentally friendly way. Failure to do so would result not only in financial consequences, but also in damage to the Group’s reputation and may impact shareholder value as well as Titan employees and the communities in which Titan operates. In environmental terms, our manufacturing processes are not inherently high risk; nevertheless, great care is taken to prevent any adverse impact arising.
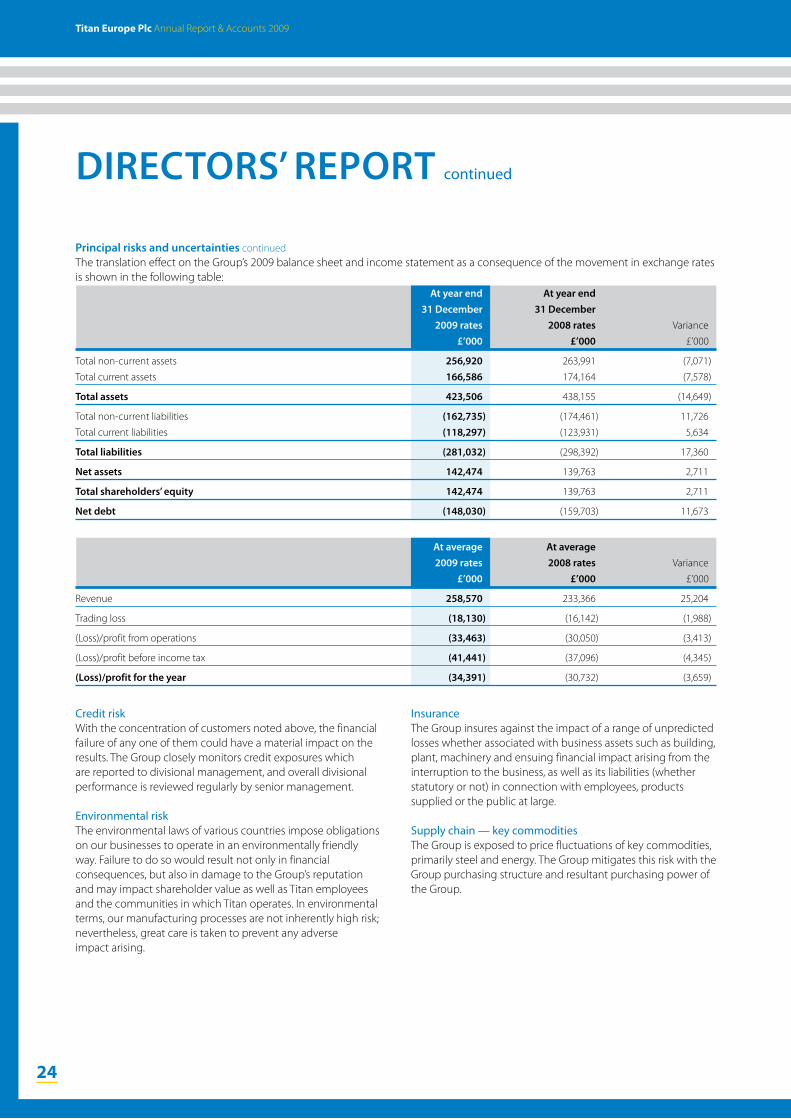
principal risks and uncertainties continuedThe translation effect on the Group’s 2009 balance sheet and income statement as a consequence of the movement in exchange rates is shown in the following table: at year end at year end 31 December 31 December 2009 rates 2008 rates Variance
£’000 £’000 £’000
Total non-current assets 256,920 263,991 (7,071)
Total current assets 166,586 174,164 (7,578)
Total assets 423,506 438,155 (14,649)
Total non-current liabilities (162,735) (174,461) 11,726
Total current liabilities (118,297) (123,931) 5,634
Total liabilities (281,032) (298,392) 17,360
Net assets 142,474 139,763 2,711
Total shareholders’ equity 142,474 139,763 2,711
Net debt (148,030) (159,703) 11,673
at average at average 2009 rates 2008 rates Variance
£’000 £’000 £’000
Revenue 258,570 233,366 25,204
Trading loss (18,130) (16,142) (1,988)
(Loss)/profit from operations (33,463) (30,050) (3,413)
(Loss)/profit before income tax (41,441) (37,096) (4,345)
(Loss)/profit for the year (34,391) (30,732) (3,659)
www.titaneurope.com Stock code: AIM: TSW.L
25
our business
17643 25/05/10 Proof6
Directors’ Report
www.titaneurope.com Stock code: AIM: TSW.L
25
GoVernance
Dependence on key executives and personnelThe Group’s future success is substantially dependent on the continued services and performance of its executive directors and its ability to attract and retain highly skilled and qualified personnel. Measures are in place to reward and retain individuals and to protect the Group from the impact of staff turnover. The Group does not have a high senior staff turnover and has been successful in finding high quality replacements for any staff that have left.
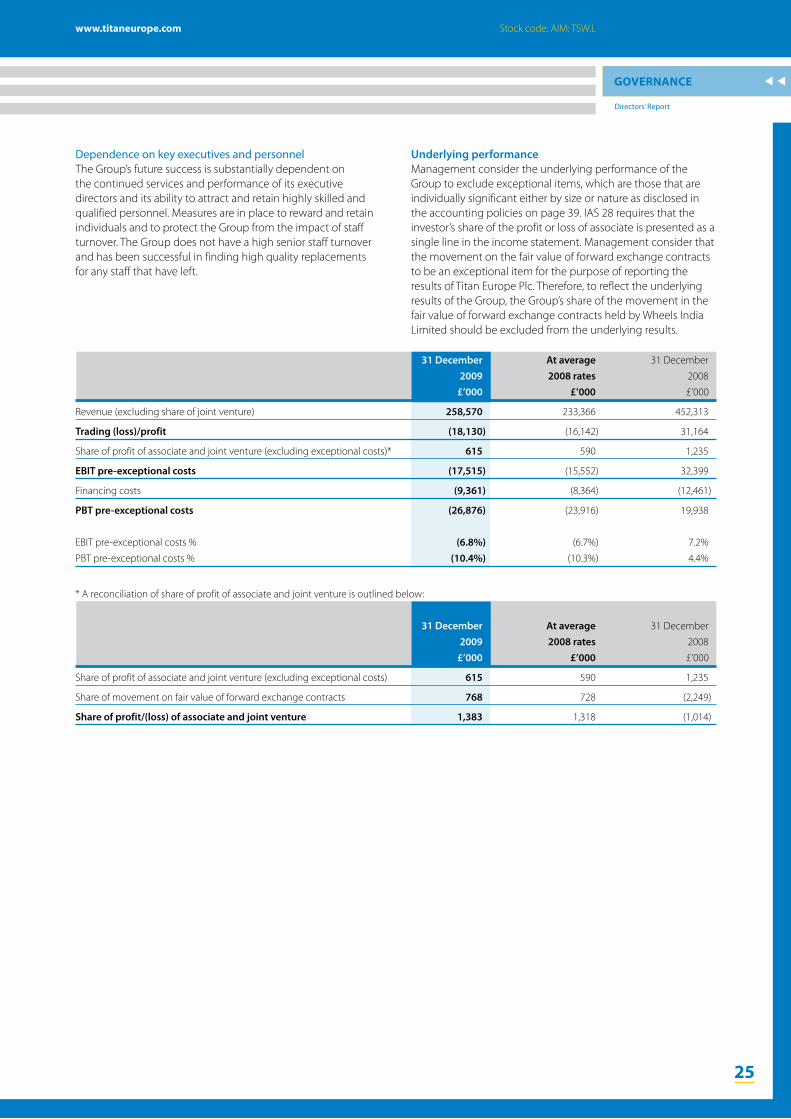
underlying performanceManagement consider the underlying performance of the Group to exclude exceptional items, which are those that are individually significant either by size or nature as disclosed in the accounting policies on page 39. IAS 28 requires that the investor’s share of the profit or loss of associate is presented as a single line in the income statement. Management consider that the movement on the fair value of forward exchange contracts to be an exceptional item for the purpose of reporting the results of Titan Europe Plc. Therefore, to reflect the underlying results of the Group, the Group’s share of the movement in the fair value of forward exchange contracts held by Wheels India Limited should be excluded from the underlying results.
31 December at average 31 December
2009 2008 rates 2008
£’000 £’000 £’000
Revenue (excluding share of joint venture) 258,570 233,366 452,313
Trading (loss)/profit (18,130) (16,142) 31,164
Share of profit of associate and joint venture (excluding exceptional costs)* 615 590 1,235
ebiT pre-exceptional costs (17,515) (15,552) 32,399
Financing costs (9,361) (8,364) (12,461)
pbT pre-exceptional costs (26,876) (23,916) 19,938
EBIT pre-exceptional costs % (6.8%) (6.7%) 7.2%
PBT pre-exceptional costs % (10.4%) (10.3%) 4.4%
* A reconciliation of share of profit of associate and joint venture is outlined below:
31 December at average 31 December
2009 2008 rates 2008
£’000 £’000 £’000
Share of profit of associate and joint venture (excluding exceptional costs) 615 590 1,235
Share of movement on fair value of forward exchange contracts 768 728 (2,249)
share of profit/(loss) of associate and joint venture 1,383 1,318 (1,014)

17643 25/05/10 Proof6
26
titan europe Plc Annual Report & Accounts 2009
DiReCToRs’ RepoRT continued
Key performance indicatorsThe Board monitors progress on the overall Group strategy with reference to the following key performance indicators and key financial ratios which have been calculated based on the sterling translated balances:
2009 at Definition, method of 2009 2008 rates 2008 calculation and analysis
Revenue growth (42.8%) (48.4%) 17.2% Year on year revenue growth. At constant
exchange rates the Undercarriage division was
lower than 2008 by 50.1% and the Wheels division
lower than 2008 by 45.0%.
Gross profit as a % of revenue 4.9% 5.1% 13.8% Profit before distribution, administration and
significant one-off items. Gross profit percentage
reduced due to inefficiencies and impact of fixed
costs on significantly reduced volumes.
EBITDA as a % of revenue 0.4% 0.6% 10.9% Trading (loss)/profit including underlying share
of associate and joint venture (as defined in
the reconciliation above), before depreciation
and amortisation. Impact of lower gross profit
percentage.
Revenue per employee £110,689 £99,900 £154,902 Total Group revenue divided by the average
number of employees. At constant exchange rates
down by 35.5% which is lower than the revenue
impact due to headcount reductions.
Inventory turn 2.9 2.6 3.1 Annual cost of sales divided by the year end
inventory balance. Reduced from 2008 due to
significant reduction in volumes not entirely
matched by overall inventory reduction.
Debtor days 70 84 70 Year end net trade debtors balance divided by
the annual sales multiplied by 365. At constant
exchange rates the result of a reduced level of
debt factoring in 2009 had an adverse effect of
7 days coupled with a change in the debtor mix
in the Undercarriage division, as the aftermarket
debtors (with longer terms) represented a higher
proportion of the debt.
Creditor days 66 77 84 Year end trade creditor balance divided by the
cost of sales plus distribution costs multiplied
by 365. This change is due to significant 2009
reductions in raw material purchases.

www.titaneurope.com Stock code: AIM: TSW.L
27
our business
17643 25/05/10 Proof6
Directors’ Report
www.titaneurope.com Stock code: AIM: TSW.L
27
GoVernance
ResuLTs aND DiviDeNDs
The Group’s loss after taxation for the year ended 31 December 2009 amounted to £34,391,000 (2008: £5,491,000 profit). The income statement is shown on page 32.
As part of the May 2009 amendment and restatement agreement with our primary bankers Intesa Sanpaolo SpA and Unicredit SpA no dividend distributions will be made until after the Company has recommenced payments of the loan in January 2011 and are subject to the Company achieving a leverage ratio of 3.5:1 or less.
On the basis of the above, no interim dividend per ordinary share was paid (2008: 2.17p), and the directors will not be proposing a final dividend. There was therefore no full dividend for the year (2008: 2.17p) and the total cost of dividends for 2009 was £nil (2008: £1,800,000).
DiReCToRs
The directors who served during the year and up to the date of signing these financial statements were as follows:J M A Akers E H BilligM C La Manna P A GartsideV M R Wicks G ChestertonM M Taylor
The Company has purchased and maintained throughout the year directors’ and officers’ liability insurance in respect of itself and its directors. The directors also have the benefit of the indemnity provisions contained in the Company’s Articles of Association. The insurance and indemnity provisions were in place during the year and are still in place at the date of this report.
DiReCToRs’ iNTeResTs
The beneficial interests of the directors in the 40p ordinary shares in the Company at 31 December 2009 are shown below:
fully paid ordinary shares
31 December 31 December
2009 2008
J M A Akers* 700,000 610,000
V M R Wicks* 500,000 500,000
G Chesterton* 65,000 —
E H Billig 40,000 40,000
P A Gartside 24,000 24,000
M C La Manna 288,000 288,000
* These ordinary shares are registered in the name of The Steel Wheels Executive Pension Scheme, a pension scheme of which J M A Akers, G Chesterton and V M R Wicks are beneficiaries.
Key financial Ratios
2009 at Definition, method of 2009 2008 rates 2008 calculation and analysis
Interest cover on EBITDA 0.1 0.2 4.4 EBITDA as defined above divided by the total net
financing cost excluding bond redemption costs
and other finance charges. Significant reduction
due to overall decline in EBITDA as a result of the
volume reductions.
Interest cover on EBIT (2.2) (1.9) 2.9 EBITDA as defined above adding back
depreciation and amortisation adjustments,
divided by total net financing costs excluding
bond redemption costs and other finance charges.
Significant change as a result of the loss at EBIT
level.
Effective tax rate 16.5% 16.6% 38.9% Income tax charge divided by profit before tax,
excluding share of associate and joint venture.
Distorted by level of losses mainly in the Italian
subsidiaries.
Gearing 104% 114% 91% Net debt divided by net assets. Net debt held at
similar levels but net assets reduced by net loss in
period.
Cash conversion ratio 101% 100% 31% Net cash generated from operating activities
less net cash used in investing activities, divided
by (loss)/profit from operations. Improvements
in working capital and control of capital
expenditures have enabled a positive cash
generation despite a loss from operations.
Information which fulfils the remaining requirements of the Business Review can be found in the Chief Executive’s Report on pages 14 to 19.

17643 25/05/10 Proof6
28
titan europe Plc Annual Report & Accounts 2009
DiReCToRs’ RepoRT continued
opTioNs
Options held Cancelled Granted options held at 1 January during during at 31 DecemberDirector 2009 the year the year 2009
J M A Akers 1,710,000 (1,710,000) 1,710,000 1,710,000M C La Manna 660,000 (660,000) 660,000 660,000V M R Wicks 180,000 (180,000) 180,000 180,000G Chesterton — — 200,000 200,000M M Taylor 180,000 (180,000) 180,000 180,000E H Billig 180,000 (180,000) 180,000 180,000P A Gartside 180,000 (180,000) 180,000 180,000
The share options cancelled during the year refer to those options that were granted on the admission to the AIM market on 7 April 2005 and those options granted on the readmission to the AIM market on 30 December 2005. These share options were cancelled on 1 June 2009 and replaced with options granted on 1 June 2009 under the Unapproved Share Option Scheme 2004. The shares were granted with an option price of 40p, the nominal value of the underlying shares. These options are exercisable during the period 1 June 2012 to 1 June 2019.
The options granted to G Chesterton have been granted on the same basis as the replacement options above, with an exercise price of 40p and exercisable during the period 1 June 2012 to 1 June 2019.
No director had any interest in contracts of the Company or the Group during the year.
eMpLoYee poLiCies
The directors recognise the considerable benefits which accrue from keeping employees at all levels informed of the progress of the business and involving them in the Group’s performance. The Group’s policy is to ensure that information and views are exchanged and considered in meetings with employee representatives and that employees are made aware of the financial and economic factors affecting the Group’s performance by the publishing of such information on noticeboards.
The Group considers any application for employment by disabled persons. In the event of any employee becoming disabled, the Group explores all options to retain the individual and to comply fully and fairly with legislation relating to such persons.
DoNaTioNs
Charitable donations made by the Group during the year in support of the local community amounted to £4,100 (2008: £7,100). During the year, the Group has not made any political donations (2008: £nil).
paYMeNTs To suppLieRs
The Group agrees terms and conditions for its business transactions with individual suppliers, ensures that suppliers are made aware of the terms of payment and makes payment in accordance with these terms. At the year end, the trade creditor days for the Group were 66 days (2008: 84 days) and for the Company the creditor days were 41 days (2008: 73 days).
subsTaNTiaL shaRehoLDiNGs
As at 9 April 2010, the Company was aware of the following interests in 3.0% or more in the ordinary share capital of the Company: Number % held
Mefro Wheels GmbH 24,788,853 29.9
Titan Luxembourg SARL. 18,993,821 22.9
AXA Framlington Investment Management 6,451,179 7.8
Carlson Capital LP 3,212,775 3.9
www.titaneurope.com Stock code: AIM: TSW.L
29
our business
17643 25/05/10 Proof6
Directors’ Report
www.titaneurope.com Stock code: AIM: TSW.L
29
GoVernance
fiNaNCiaL iNsTRuMeNTs
The Group’s financial risk management objectives and policies are explained in note 2. The Group uses credit insurance as appropriate to manage its credit risk on an individual customer basis where the risk is considered sufficient to merit the cover.
ReseaRCh aND DeveLopMeNT
Research is carried out by the Group to ensure that our position as market leaders in the businesses in which we operate, is maintained. The Group’s research and development costs are detailed in note 12 to the financial statements.
eNviRoNMeNT
The Group requires the management of its subsidiary companies to adopt policies to comply with local environmental requirements. The Group provides considerable local autonomy for capital expenditure needed for environmental compliance.
posT-baLaNCe sheeT eveNTs
The information that fulfils the requirements of post-balance sheet events disclosure in the Directors’ Report can be found on page 19.
sTaTeMeNT of DisCLosuRe of iNfoRMaTioN To auDiToRs
As far as the directors are aware there is no relevant audit information of which the Company’s auditors are unaware and the directors have taken all the steps that ought to have been taken to make ourselves aware of any relevant audit information and to establish that the Company’s auditors are aware of that information.
sTaTeMeNT of DiReCToRs’ RespoNsibiLiTies iN RespeCT of The aNNuaL RepoRT aND The fiNaNCiaL sTaTeMeNTs
The directors are responsible for preparing the Annual Report and the Group and the Company financial statements in accordance with applicable law and regulations.
Company law requires the directors to prepare financial statements for each financial year. Under that law the directors have prepared the Group financial statements in accordance with International Financial Reporting Standards (‘IFRSs’) as adopted by the European Union, and the Company financial statements in accordance with applicable law and United Kingdom Accounting Standards (United Kingdom Generally Accepted Accounting Practice). The Group and Company financial statements are required by law to give a true and fair view of the state of affairs of the Company and the Group and of the profit or loss of the Group for that period.
In preparing those financial statements, the directors are required to:
●● select suitable accounting policies and then apply them consistently;
●● make judgements and estimates that are reasonable and prudent;
●● state that the financial statements comply with IFRSs as adopted by the European Union and with regard to the Company financial statements that applicable UK Accounting Standards have been followed, subject to any material departures disclosed and explained in the financial statements; and
●● prepare the financial statements on the going concern basis unless it is inappropriate to presume that the Group will continue in business, in which case there should be supporting assumptions or qualifications as necessary.
The directors confirm that they have complied with the above requirements in preparing the financial statements.
The directors are responsible for keeping proper accounting records that disclose with reasonable accuracy at any time the financial position of the Company and the Group and to enable them to ensure that the Group financial statements comply with the Companies Act 2006 and the Company financial statements comply with the Companies Act 2006. They are also responsible for safeguarding the assets of the Company and the Group and hence for taking reasonable steps for the prevention and detection of fraud and other irregularities.
The directors are responsible for the maintenance and integrity of the Company website. Legislation in the United Kingdom governing the preparation and dissemination of financial statements may differ from legislation in other jurisdictions.
auDiToRs
A resolution to reappoint PricewaterhouseCoopers LLP as auditors to the Company will be proposed at the Annual General Meeting.
By Order of the BoardG ChestertonGroup Finance Director 7 June 2010

17643 25/05/10 Proof6
30
titan europe Plc Annual Report & Accounts 2009
CoRpoRaTe GoveRNaNCe sTaTeMeNTiNTRoDuCTioN
The Board of Titan Europe Plc is committed to achieving good standards of corporate governance, integrity and business ethics for all activities. Under the rules of the Alternative Investment Market, the Group is not required to comply with the Combined Code. Nevertheless, the Group has taken steps to comply in so far as it can be applied practically and appropriately, given the size of the Group and the nature of its operations. The Board is continuing to consider other aspects of the Code for appropriateness and these may be introduced when it becomes relevant for the Group to do so.
boaRD CoMposiTioN
The Board of directors comprises four executive and three non-executive directors. The non-executive directors are:
M M TaylorE H BilligP A Gartside
auDiT CoMMiTTee
The Audit Committee, composed of the non-executive directors, reviews the Company’s financial reporting (including accounting policies) and internal financial controls.
The chairman is P A Gartside.
ReMuNeRaTioN CoMMiTTee
The Remuneration Committee, composed of the non-executive directors, is responsible for establishing and developing Titan Europe’s general policy on executive and senior management remuneration and determining specific remuneration packages for executive directors.
The chairman is M M Taylor.
fiNaNCiaL CoNTRoL
The Group has a comprehensive system for reporting financial results to the Board. Monthly trading results are prepared for each operating business and at consolidated level, with comparison against budget and prior year. The Board reviews these and meets periodically to determine appropriate action.
GoiNG CoNCeRN
The directors have reviewed the Group’s budget and cash flows for 2010 together with longer-term plans and are satisfied that it is appropriate to present these financial statements on a going concern basis.
p a GartsideChairman of the Audit Committee7 June 2010

www.titaneurope.com Stock code: AIM: TSW.L
31
our business
17643 25/05/10 Proof6
Corporate Governance StatementIndependent Auditors’ Report
www.titaneurope.com Stock code: AIM: TSW.L
31
GoVernance
iNDepeNDeNT auDiToRs’ RepoRT To The MeMbeRs of TiTaN euRope plcWe have audited the Group financial statements of Titan Europe Plc for the year ended 31 December 2009 which comprise the Consolidated Income Statement, the Consolidated Statement of Comprehensive Income, the Consolidated Balance Sheet, the Consolidated Statement of Changes in Equity, the Consolidated Cash Flow Statement, and the Reconciliation of Cash Flow to Net Debt and the related notes. The financial reporting framework that has been applied in their preparation is applicable law and International Financial Reporting Standards (IFRSs) as adopted by the European Union.
We have reported separately on the Company financial statements of Titan Europe Plc for the year ended 31 December 2009.
RespeCTive RespoNsibiLiTies of DiReCToRs aND auDiToRs
As explained more fully in the directors’ responsibilities statement, the directors are responsible for the preparation of the financial statements and for being satisfied that they give a true and fair view. Our responsibility is to audit the Group financial statements in accordance with applicable law and International Standards on Auditing (UK and Ireland). Those standards require us to comply with the Auditing Practices Board’s Ethical Standards for Auditors.
This report, including the opinions, has been prepared for and only for the Company’s members as a body in accordance with Chapter 3 of Part 16 of the Companies Act 2006 and for no other purpose. We do not, in giving this opinion, accept or assume responsibility for any other purpose or to any other person to whom this report is shown or into whose hands it may come save where expressly agreed by our prior consent in writing.
sCope of The auDiT of The fiNaNCiaL sTaTeMeNTs
An audit includes obtaining evidence about the amounts and disclosures in the financial statements sufficient to give reasonable assurance that the financial statements are free from material misstatement, whether caused by fraud or error. This includes an assessment of: whether the accounting policies are appropriate to the Group’s circumstances and have been consistently applied and adequately disclosed; the reasonableness of significant accounting estimates made by the directors; and overall presentation of the financial statements.
opiNioN oN fiNaNCiaL sTaTeMeNTs
In our opinion the Group financial statements:
●● give a true and fair view of the state of the Group’s affairs as at 31 December 2009 and of its loss and cash flows for the year then ended;
●● have been properly prepared in accordance with IFRSs as adopted by the European Union; and
●● have been prepared in accordance with the requirements of the Companies Act 2006.
opiNioN oN oTheR MaTTeR pResCRibeD bY The CoMpaNies aCT 2006
In our opinion the information given in the Directors’ Report for the financial year for which the Group financial statements are prepared is consistent with the Group financial statements.
MaTTeRs oN whiCh we aRe ReQuiReD To RepoRT bY exCepTioN
We have nothing to report in respect of the following matters where the Companies Act 2006 requires us to report to you if, in our opinion:
●● certain disclosures of directors’ remuneration specified by law are not made; or
●● we have not received all the information and explanations we require for our audit.
oTheR MaTTeR
We have reported separately on the Parent Company financial statements of Titan Europe Plc for the year ended 31 December 2009.
andrew hammond (Senior Statutory Auditor)for and on behalf of PricewaterhouseCoopers LLPChartered Accountants and Registered AuditorsBirmingham7 June 2010
(a) The maintenance and integrity of the Titan Europe Plc website is the responsibility of the directors; the work carried out by the auditors does not involve consideration of these matters and, accordingly, the auditors accept no responsibility for any changes that may have occurred to the financial statements since they were initially presented on the websites.
(b) Legislation in the United Kingdom governing the preparation and dissemination of financial statements and Regulatory financial statements may differ from legislation in other jurisdictions.

32
titan europe Plc Annual Report & Accounts 2009
17643 25/05/10 Proof6
32
titan europe Plc Annual Report & Accounts 2009
17643 25/05/10 Proof6
CoNsoLiDaTeD iNCoMe sTaTeMeNT For the year ended 31 December 2009
2009 2008
Note £’000 £’000
Revenue 4 258,570 452,313
Trading (loss)/profit 4 (18,130) 31,164
Restructuring and rationalisation costs 5 (14,682) (3,944)
Significant legal costs (651) —
Movement on fair value of forward foreign exchange contracts — (4,110)
(Loss)/profit from operations 4 (33,463) 23,110
Financing costs 6 (6,325) (10,511)
Finance charges 7 (1,538) (615)
Other finance charges 8 (1,498) (1,335)
Net financing costs (9,361) (12,461)
Share of profit/(loss) of associate and joint venture 19, 20 1,383 (1,014)
(Loss)/profit before income tax (41,441) 9,635
Income tax credit/(expense) 9 7,050 (4,144)
(Loss)/profit for the year (34,391) 5,491
Attributable to: Equity holders of the Company (34,391) 5,491
earnings per 40p ordinary share
Basic 11 (41.44p) 6.62p
Diluted 11 (41.44p) 6.62p
Basic excluding exceptional items* 11 (28.70p) 13.43p
Diluted excluding exceptional items* 11 (28.70p) 13.43p
Dividends
Payments to shareholders 10 — 5,393
* This excludes restructuring and rationalisation costs, significant legal costs and movement on fair value of forward foreign exchange contracts.

www.titaneurope.com Stock code: AIM: TSW.L
33
our business
17643 25/05/10 Proof6
www.titaneurope.com Stock code: AIM: TSW.L
33
financial
17643 25/05/10 Proof6
Consolidated Income StatementConsolidated Statement of Comprehensive Income
2009 2008
Note £’000 £’000
(Loss)/profit for the year (34,391) 5,491
other comprehensive income
Hedge accounting on financial instruments
— current year losses (973) (5,238)
— reclassification to profit or loss 1,930 93
Tax (charge)/credit on hedge accounting on financial instruments 30 (277) 1,416
Net actuarial losses on pension liabilities 31 (60) (444)
Tax on net actuarial losses on pension liabilities 30 25 125
Movement on liquidation — 61
Movement in translation adjustment 1,603 18,539
other comprehensive income, net of tax 2,248 14,552
Total comprehensive (expense)/income for the period attributable to equity shareholders (32,143) 20,043
CoNsoLiDaTeD sTaTeMeNT of CoMpReheNsive iNCoMeFor the year ended 31 December 2009

34
titan europe Plc Annual Report & Accounts 2009
17643 25/05/10 Proof6
34
titan europe Plc Annual Report & Accounts 2009
17643 25/05/10 Proof6
2009 2008
Note £’000 £’000
asseTs Non-current assets Property, plant and equipment 16 150,177 171,018Intangible assets 17 54,327 54,973Investments 18 15,422 14,956Deferred taxes 30 36,856 31,748Trade and other receivables 21 138 389
Total non-current assets 256,920 273,084
Current assets Inventories 23 84,417 127,124Trade and other receivables 21 59,046 96,816Income tax recoverable 1,608 1,815Cash and cash equivalents 24 19,046 34,258Held for sale assets 22 2,469 4,647
Total current assets 166,586 264,660
Total assets 423,506 537,744
LiabiLiTies Non-current liabilities Borrowings 29 124,744 115,085Trade and other payables 25 2,805 3,903Income tax and other tax payable — 2Derivative financial instruments 26 3,249 1,534Deferred taxes 30 20,074 19,344Employee benefits 31 11,045 14,915Provisions 32 818 964
Total non-current liabilities 162,735 155,747
Current liabilities Borrowings 29 43,303 77,998Trade and other payables 25 64,311 113,942Income tax and other tax payable 4,547 8,382Derivative financial instruments 26 1,691 3,633Employee benefits 31 2,333 1,019Provisions 32 2,112 2,556
Total current liabilities 118,297 207,530
Total liabilities 281,032 363,277
Net assets 142,474 174,467
equity Issued share capital 33 33,192 33,192Share premium account 77,248 77,248Other reserves 6,458 6,458Retained earnings 25,576 57,569
Total shareholders’ funds 142,474 174,467
The financial statements on pages 32 to 80 were approved by the Board of directors on 7 June 2010 and were signed on its behalf by:
J M a akers G ChestertonDirector Director Registered Number: 3018340
CoNsoLiDaTeD baLaNCe sheeT As at 31 December 2009

www.titaneurope.com Stock code: AIM: TSW.L
35
our business
17643 25/05/10 Proof6
www.titaneurope.com Stock code: AIM: TSW.L
35
financial
17643 25/05/10 Proof6
Consolidated Balance SheetConsolidated Statement of Changes in Equity
attributable to equity holders of the Company Retained earnings issued share Retained Currency share premium other earnings hedging translation capital account reserves reserve reserve reserve Total £’000 £’000 £’000 £’000 £’000 £’000 £’000
Year ended 31 December 2008
At 1 January 2008 33,128 77,112 6,458 39,527 366 2,820 159,411
Transactions with owners:
Dividends paid to shareholders — — — (5,393) — — (5,393)
Shares issued 64 — — — — — 64
Premium on shares issued — 136 — — — — 136
Credit in respect of employee share schemes — — — 206 — — 206
64 136 — (5,187) — — (4,987)
Profit for the year — — — 5,491 — — 5,491
Other comprehensive income:
Movement in translation adjustment — — — — — 18,539 18,539
Movement on liquidation — — — 61 — — 61
Hedge accounting on financial instruments — — — — (5,145) — (5,145)
Tax on hedge accounting on financial
instruments — — — — 1,416 — 1,416
Actuarial losses on pension liabilities — — — (444) — — (444)
Tax on actuarial losses for the year — — — 125 — — 125
Total comprehensive income for the period — — — 5,233 (3,729) 18,539 20,043
at 31 December 2008 33,192 77,248 6,458 39,573 (3,363) 21,359 174,467
Year ended 31 December 2009
At 1 January 2009 33,192 77,248 6,458 39,573 (3,363) 21,359 174,467
Transactions with owners:
Credit in respect of employee share schemes — — — 150 — — 150
— — — 150 — — 150
Loss for the year — — — (34,391) — — (34,391)
Other comprehensive income:
Movement in translation adjustment — — — — — 1,603 1,603
Hedge accounting on financial instruments — — — — 957 — 957
Tax on hedge accounting on financial
instruments — — — — (277) — (277)
Actuarial losses on pension liabilities — — — (60) — — (60)
Tax on actuarial losses for the year — — — 25 — — 25
Total comprehensive income for the period — — — (34, 426) 680 1,603 (32,143)
at 31 December 2009 33,192 77,248 6,458 5,297 (2,683) 22,962 142,474
Other reserves represent a capital contribution reserve which in the opinion of the directors is not distributable.
The Hedging reserve represents the cumulative portion of gains and losses on hedging instruments deemed effective.
The Currency translation reserve relates to exchange differences arising on the translation of the net assets of the Group’s foreign operations, from their
functional currency into the Parent’s functional currency.
CoNsoLiDaTeD sTaTeMeNT of ChaNGes iN eQuiTYFor the year ended 31 December 2009
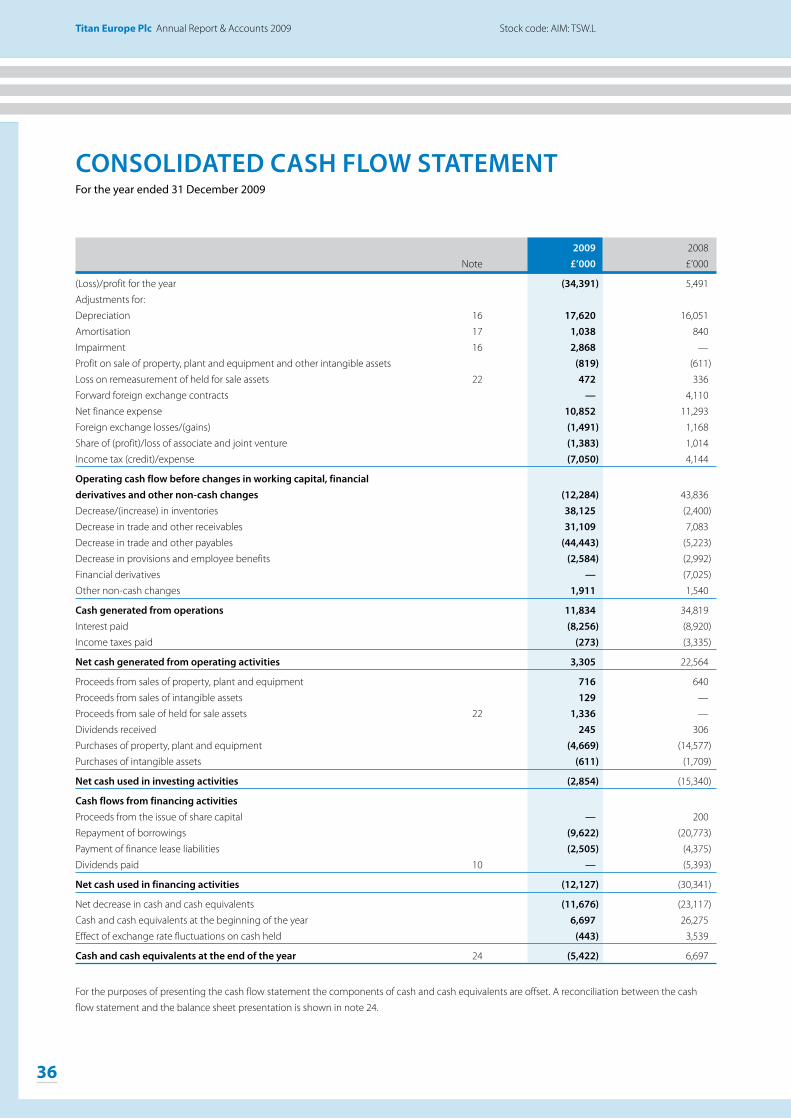
36
titan europe Plc Annual Report & Accounts 2009
17643 25/05/10 Proof6
36
titan europe Plc Annual Report & Accounts 2009
17643 25/05/10 Proof6
Stock code: AIM: TSW.L
CoNsoLiDaTeD Cash fLow sTaTeMeNTFor the year ended 31 December 2009
2009 2008
Note £’000 £’000
(Loss)/profit for the year (34,391) 5,491
Adjustments for:
Depreciation 16 17,620 16,051
Amortisation 17 1,038 840
Impairment 16 2,868 —
Profit on sale of property, plant and equipment and other intangible assets (819) (611)
Loss on remeasurement of held for sale assets 22 472 336
Forward foreign exchange contracts — 4,110
Net finance expense 10,852 11,293
Foreign exchange losses/(gains) (1,491) 1,168
Share of (profit)/loss of associate and joint venture (1,383) 1,014
Income tax (credit)/expense (7,050) 4,144
operating cash flow before changes in working capital, financial derivatives and other non-cash changes (12,284) 43,836
Decrease/(increase) in inventories 38,125 (2,400)
Decrease in trade and other receivables 31,109 7,083
Decrease in trade and other payables (44,443) (5,223)
Decrease in provisions and employee benefits (2,584) (2,992)
Financial derivatives — (7,025)
Other non-cash changes 1,911 1,540
Cash generated from operations 11,834 34,819
Interest paid (8,256) (8,920)
Income taxes paid (273) (3,335)
Net cash generated from operating activities 3,305 22,564
Proceeds from sales of property, plant and equipment 716 640
Proceeds from sales of intangible assets 129 —
Proceeds from sale of held for sale assets 22 1,336 —
Dividends received 245 306
Purchases of property, plant and equipment (4,669) (14,577)
Purchases of intangible assets (611) (1,709)
Net cash used in investing activities (2,854) (15,340)
Cash flows from financing activities
Proceeds from the issue of share capital — 200
Repayment of borrowings (9,622) (20,773)
Payment of finance lease liabilities (2,505) (4,375)
Dividends paid 10 — (5,393)
Net cash used in financing activities (12,127) (30,341)
Net decrease in cash and cash equivalents (11,676) (23,117)
Cash and cash equivalents at the beginning of the year 6,697 26,275
Effect of exchange rate fluctuations on cash held (443) 3,539
Cash and cash equivalents at the end of the year 24 (5,422) 6,697
For the purposes of presenting the cash flow statement the components of cash and cash equivalents are offset. A reconciliation between the cash
flow statement and the balance sheet presentation is shown in note 24.

www.titaneurope.com Stock code: AIM: TSW.L
37
our business
17643 25/05/10 Proof6
www.titaneurope.com Stock code: AIM: TSW.L
37
financial
17643 25/05/10 Proof6
Consolidated Cash Flow StatementReconciliation of Cash Flow to Net Debt
Other at At 1 January non-cash Exchange 31 December 2009 Cash flow changes movements 2009 Note £000 £000 £000 £000 £000
Cash at bank and in hand 24 34,258 (13,346) — (1,866) 19,046Overdrafts 29 (27,561) 1,670 — 1,423 (24,468)
6,697 (11,676) — (443) (5,422)Borrowings due after one year* 29 (107,611) (18,879) (910) 7,856 (119,544)Borrowings due within one year* 29 (47,072) 28,501 — 2,824 (15,747)Finance leases due after one year 29 (7,474) 2,294 (547) 527 (5,200)Finance leases due within one year 29 (3,365) 211 (156) 222 (3,088)Liquid resources 21 660 320 — (9) 971
Net debt (158,165) 771 (1,613) 10,977 (148,030)
* Included with borrowings due within one year at the 1 January 2009 was €30,000,000 (£29,205,000) of capital relating to the Intesa Sanpaolo SpA
and Unicredit SpA agreement, as a result of the renegotiation of the banking facilities during May 2009 €22,500,000 was reclassified to borrowings
due after one year (£21,903,000).
ReCoNCiLiaTioN of Cash fLow To NeT DebT For the year ended 31 December 2009

38
titan europe Plc Annual Report & Accounts 2009
17643 25/05/10 Proof6
38
titan europe Plc Annual Report & Accounts 2009
17643 25/05/10 Proof6
NoTes To The CoNsoLiDaTeD fiNaNCiaL sTaTeMeNTsFor the year ended 31 December 2009
1 aCCouNTiNG poLiCiesa) General informationTitan Europe Plc is a company incorporated in the United Kingdom under the Companies Act. The address of the registered office is Bridge Road, Cookley, Kidderminster, Worcestershire, DY10 3SD.
The nature of the Group’s operations and its principal activities are set out in the Directors’ Report.
b) basis of preparation The Group consolidated financial statements have been prepared in accordance with the Companies Act 2006 as applicable to companies reporting under IFRS and with those IFRS standards and IFRIC interpretations issued, effective and endorsed by the European Union as at the time of preparing these statements.
The Group consolidated financial statements have been prepared on a going concern basis. The directors have reviewed the funding position
of the Group and the Company in light of the amended facilities with Intesa Sanpaolo SpA and Unicredit SpA. In doing so the directors have considered and forecasted the cash flow requirements of the Group and the Company arising from operational, investment and financing activities and they believe it is appropriate to prepare these financial statements on a going concern basis.
The financial statements have been prepared based on the accounting policies noted below, with the exception for the adoption of IAS 1 (revised) Presentation of Financial Statements. They have been prepared under the historical cost convention, as modified by the revaluation of certain non-current financial assets and liabilities (including derivative financial instruments) at fair value through the profit or loss.
The adoption of IAS 1 (revised) does not affect the financial position or profits of the Group, but gives rise to additional disclosures. The measurement and recognition of the Group’s assets, liabilities, income and expenses is unchanged, however, some items that were recognised directly in equity are now recognised in other comprehensive income. The revised standard prohibits the presentation of items of income and expenses (non-owner changes in equity) in the statement of changes in equity, requiring “non-owner changes in equity” to be presented separately from owner changes in equity. All “non-owner changes in equity” are required to be shown in a performance statement. Entities can choose whether to present one performance statement (the statement of comprehensive income) or two statements (the income statement and statement of comprehensive income). The Group has elected to present two statements: an income statement and a statement of comprehensive income. The financial statements have been prepared under the revised disclosure requirements. In accordance with the new standard the entity does not present a “Statement of recognised income and expenses” (SORIE), as was presented in the 2008 consolidated financial statements. Further, a “Statement of changes in equity” is presented as a primary statement where previously it was presented within the notes to the financial statements.
c) basis of consolidationSubsidiariesSubsidiaries are entities over which the Group has the power to govern the financial and operating policies generally accompanying a shareholding of more than 50% of the voting rights. In assessing control potential voting rights that are currently exercisable or convertible are taken into account. The financial statements of subsidiaries are included in the consolidated financial statements from the date of acquisition. They are de-consolidated from the date that control ceases. All business combinations are accounted for by the purchase method. Assets, liabilities and contingent liabilities acquired in business combinations are measured at fair value.
Intra-Group transactionsIntra-Group transactions and balances and any unrealised gains and losses arising from intra-Group transactions are eliminated. Accounting policies of subsidiaries have been changed where necessary to ensure consistency with policies adopted by the Group.
AssociatesAssociates are those entities in which the Group has significant influence, but not control, over the financial and operating policies. The consolidated financial statements include the Group’s share of the total recognised income and expense of associates on an equity accounted basis, from the date that significant influence commences until the date that significant influence ceases. The Group’s investment in associates includes goodwill identified on acquisition, net of accumulated impairment loss. When the Group’s share of losses exceeds its interest in an associate, the Group’s carrying amount is reduced to nil and recognition of further losses is discontinued except to the extent that the Group has incurred legal or constructive obligations or made payments on behalf of an associate.

www.titaneurope.com Stock code: AIM: TSW.L
39
our business
17643 25/05/10 Proof6
Notes to the Consolidated Financial Statements
www.titaneurope.com Stock code: AIM: TSW.L
39
financial
17643 25/05/10 Proof6
1 aCCouNTiNG poLiCies (continued)c) basis of consolidation (continued)Joint ventureJoint ventures are those entities where joint control exists and strategic operating, investing and financing decisions require the consent of a majority of the owners. The consolidated financial statements include the Group’s share of the total recognised income and expense of the joint venture on an equity method of accounting.
d) presentation of the income statementThe format of the income statement adopted by the Group combines the specific requirements of IFRS together with additional disclosures designed to assist the understanding of the Group’s performance. The format is further explained below.
(Loss)/profit from operations is the result of the continuing subsidiary companies prior to finance costs and taxation. In order to present consistent and comparable information this is further analysed to show the results of normal trading activities (trading (loss)/profit), and individually significant items. Such items arise because of their size or nature and comprise:
— charges relating to the restructuring and rationalisation programme; — significant legal costs;— the impact of curtailments to the Group’s post-employment schemes; and— the movement on fair value of forward foreign exchange contracts.
Net finance costs represent the cash costs and other charges arising from the Group’s financing activities. These have been further analysed in order to provide clarity over these costs as follows:
Cash costs/income— Financing costs represents the Group’s interest cost on outstanding borrowings along with the impact of currency movements on
borrowings denominated in foreign currencies.
Non-cash costs/income— Finance charges represents the interest charge associated with the Group’s post employment obligations, offset by the expected return on
the Group’s pension scheme assets and gains/losses on remeasurement of interest rate swaps; and— Other finance charges represent the unwinding of fair value adjustments made to acquired debt instruments.
e) foreign currencyTransactions in foreign currencies are translated at exchange rates approximating to the rate ruling at the date of the transaction. Monetary assets and liabilities denominated in foreign currencies at the balance sheet date are translated at the foreign exchange rate ruling at that date. Foreign exchange differences arising on translation are recognised in the income statement. Non-monetary assets and liabilities that are measured in terms of historical cost in a foreign currency are translated using the exchange rate at the date of the transaction. Non-monetary assets such as foreign exchange swaps denominated in foreign currencies that are stated at fair value are translated at foreign exchange rates ruling at the dates the fair value was determined.
The assets and liabilities of foreign operations, including goodwill and fair value adjustments arising on consolidation, are translated at foreign exchange rates ruling at the balance sheet date. The revenues and expenses of foreign operations are translated at an average rate for the period where this rate approximates to the foreign exchange rates ruling at the dates of the transactions.
Exchange differences arising from this translation of foreign operations, and of related qualifying hedges that satisfy the hedging conditions of IAS 39, are taken directly to retained earnings. They are released into the income statement upon disposal.
The Group has taken advantage of relief available in IFRS 1 to deem the cumulative translation differences for all foreign operations to be zero at the date of transition to IFRS (1 January 2006).
The functional currency of a subsidiary is determined by certain primary and secondary factors. Once determined, this functional currency is used and translated for consolidation purposes.

40
titan europe Plc Annual Report & Accounts 2009
17643 25/05/10 Proof6
40
titan europe Plc Annual Report & Accounts 2009
NoTes To The CoNsoLiDaTeD fiNaNCiaL sTaTeMeNTs continued
For the year ended 31 December 2009
17643 25/05/10 Proof6
1 aCCouNTiNG poLiCies (continued)
f) investments in debt and equity securitiesUnlisted equity investments are stated at cost less impairment where the investment does not have a quoted market price in an active market
that cannot be reliably measured.
g) Derivative financial instruments and hedgingDerivative financial instruments
Derivative financial instruments are primarily used to manage the Group’s exposure to market risks from changes in interest and foreign
exchange rates. Derivative financial instruments are recognised at fair value.
Where derivative financial instruments are not designated as or not determined to be effective hedges, any gain or loss on the remeasurement of
the fair value is taken to the income statement.
The fair value of interest rate swaps is the estimated amount that the Group would receive or pay to terminate the swap at the balance sheet
date, taking into account current interest rates and the current creditworthiness of the swap counterparties. The fair value of forward exchange
contracts is their quoted market price at the balance sheet date, being the present value of the quoted forward price.
Cash flow hedges
Where a derivative financial instrument is designated as a hedge of the variability in cash flows of a recognised asset or liability, or a highly
probable forecast transaction, the effective part of any gain or loss on the derivative financial instrument is recognised directly in retained
earnings. Any ineffective portion of the hedge is recognised immediately in the income statement.
When the forecast transaction subsequently results in the recognition of a non-financial asset or non-financial liability, the associated cumulative
gain or loss remains in the hedging reserve and is reclassified into the income statement in the same year or years during which the asset
acquired or liability assumed affects the income statement, i.e. when a non-financial asset is depreciated.
If a hedge of a forecasted transaction subsequently results in the recognition of a financial asset or financial liability, the associated gains or losses
that were recognised directly in equity are reclassified into the income statement in the same year or years during which the asset acquired or
liability assumed affects the income statement, i.e. when the interest income or expense is recognised.
When a hedging instrument expires or is sold, terminated or exercised, or the entity revokes designation of the hedge relationship but the
hedged forecast transaction is still expected to occur, the cumulative gain or loss at that point remains in equity and is deferred in accordance
with the above policy when the transaction occurs. If the hedged transaction is no longer expected to take place, the cumulative unrealised gain
or loss recognised in equity is recognised in the income statement immediately.
h) property, plant and equipmentProperty, plant and equipment are stated at cost, which includes the purchase cost plus costs directly associated with bringing the asset into use
including interest where required, less accumulated depreciation and impairment losses.
Where parts of an item of property, plant and equipment have different useful lives, they are accounted for as separate items of property, plant
and equipment.
Depreciation is charged to the income statement on a straight-line basis over the estimated useful lives of each part of an item of property,
plant and equipment which are reviewed on an annual basis. Land is not depreciated. The residual values are reassessed on an annual basis. The
estimated useful lives are as follows:

www.titaneurope.com Stock code: AIM: TSW.L
41
our business
17643 25/05/10 Proof6
Notes to the Consolidated Financial Statements
www.titaneurope.com Stock code: AIM: TSW.L
41
financial
17643 25/05/10 Proof6
1 aCCouNTiNG poLiCies (continued)
h) property, plant and equipment (continued)
Freehold buildings * 33–40 years
Plant and machinery 5–30 years
Tools 4–6 years (included in fixtures, fittings, tools and equipment in note 16)
Fixtures, fittings and office equipment 3–5 years
Motor vehicles 2–4 years (included within plant and machinery in note 16)
* The normal estimated life for freehold buildings is between 33 and 40 years, however, when a company is acquired and asset fair values are
reviewed external guidance is sought on the useful life which may differ from this range.
Leasehold property is depreciated over the life of the lease.
Major assets in the course of construction are included in property, plant and equipment on the basis of expenditure incurred at the balance
sheet date. No depreciation is charged on major assets in the course of construction until they are brought into operational use.
i) held for sale assetsAssets or groups of assets are reclassified as held for sale assets in accordance with IFRS 5 when management have committed to a plan to sell
the asset and an active program is in place to locate a buyer. The asset is measured at the lower of carrying value or cost, and once the asset is
classified as held for sale it is no longer depreciated or amortised. See note 22.
j) finance leasesLeases in which the Group assumes substantially all the risks and rewards of ownership of the leased asset are classified as finance leases. Where
land and buildings are held under finance leases, the accounting treatment of the land is considered separately from that of the buildings. Leased
assets acquired by way of finance lease are stated at an amount equal to the lower of their fair value and the present value of the minimum lease
payments at inception of the lease, less accumulated depreciation and impairment losses and included within property, plant and equipment.
In line with the requirements of IAS 17, sale and finance leaseback assets are treated as having being sold and re-acquired with any gains
recognised over the life of the lease.
k) intangible assets Goodwill
Goodwill, arising on acquisitions which have occurred since 1 January 2006, represents the difference between the fair value of the purchase
consideration and the fair value of the identifiable net assets and contingencies of an acquired entity. Consideration includes the attributable
costs of the acquisition. In respect of acquisitions which occurred prior to 1 January 2006, goodwill is included on the basis of its deemed cost,
which represents the amount recorded under previous GAAP. This is in accordance with the transitional provisions of IFRS 1.
Positive goodwill is recognised as an asset in the consolidated balance sheet and is subject to annual impairment review. Goodwill arising on
the acquisition of subsidiary undertakings is recognised separately as an intangible asset in the consolidated balance sheet. Goodwill arising
on the acquisition of associated undertakings is included within the carrying value of the investment. Negative goodwill is recognised in the
income statement immediately. In accordance with the transitional provisions of IFRS 3, any goodwill previously written off to reserves remains in
reserves.
Goodwill is not amortised but allocated to cash-generating units and is tested annually for impairment.
Research and development
Research expenditure is written off as incurred.
Where development expenditure results in a new or substantially improved product, service or process then such costs will be capitalised and
amortised over the useful life and periodically reviewed for impairment.

42
titan europe Plc Annual Report & Accounts 2009
17643 25/05/10 Proof6
42
titan europe Plc Annual Report & Accounts 2009
NoTes To The CoNsoLiDaTeD fiNaNCiaL sTaTeMeNTs continued
For the year ended 31 December 2009
17643 25/05/10 Proof6
1 aCCouNTiNG poLiCies (continued)
k) intangible assets (continued)
Computer software costs
Where computer software is not integral to an item of property, plant and equipment its costs are capitalised and categorised as intangible
assets. Amortisation is provided on a straight-line basis over its useful economic life which is between three and five years.
Other intangible assets
Other intangible assets are stated at cost less accumulated amortisation and impairment losses.
Amortisation is charged on a straight line basis and is based on the useful economic lives of the assets concerned which are principally as follows:
Licences and patents 3–15 years
l) impairmentThe carrying amounts of the Group’s assets are tested to determine if there is any indication of impairment. Assets which have an indefinite useful
life are not subject to amortisation and are tested for impairment at each balance sheet date. Assets subject to depreciation and amortisation
are reviewed for impairment whenever events or circumstances indicate that the carrying amount may not be recoverable. An impairment loss
is recognised in the income statement based on the amount by which the carrying amount exceeds the recoverable amount. The recoverable
amount is the higher of fair values less costs to sell and value in use.
m) Trade and other receivablesTrade and other receivables are stated at their amortised cost less impairment losses based on the directors’ view of the collectability of those
receivables.
n) inventoriesInventories are stated at the lower of cost and net realisable value (being the estimated selling price in the ordinary course of business less
estimated costs of completion and selling expenses). Cost is determined on a first in first out basis. Cost comprises raw material, direct labour and
appropriate production overheads based on the normal levels of business activity. Provision for slow-moving or obsolete inventories are based
upon the directors’ view of the recoverable value of the individual items included within inventory, based on ageing reports and usage reports.
o) Cash and cash equivalentsCash and cash equivalents comprise cash balances and call deposits. Bank overdrafts that are repayable on demand and form an integral part of
the Group’s cash management are included as a component of cash and cash equivalents for the purpose only of the statement of cash flows.
p) interest-bearing borrowingsInterest-bearing borrowings are recognised initially at fair value less attributable transaction costs. Subsequent to initial recognition, interest-
bearing borrowings are stated at amortised cost with any difference between cost and redemption value being recognised in the income
statement over the period of the borrowings on an effective interest basis.
q) DividendsDividends are recognised in the year in which they are approved by the Group’s shareholders or, in the case of an interim dividend, when the
dividend is paid.
r) employee benefitsDefined contribution schemes
Obligations for contributions to defined contribution pension schemes are recognised as an expense in the income statement as incurred.

www.titaneurope.com Stock code: AIM: TSW.L
43
our business
17643 25/05/10 Proof6
Notes to the Consolidated Financial Statements
www.titaneurope.com Stock code: AIM: TSW.L
43
financial
17643 25/05/10 Proof6
1 aCCouNTiNG poLiCies (continued)
r) employee benefits (continued) Defined benefit schemes
For defined benefit pension schemes, the cost of providing benefits is calculated annually by independent actuaries using the projected unit
credit method. The retirement benefit obligation recognised in the balance sheet represents the excess of the present value of scheme liabilities
over the fair value of scheme assets. Differences between the actual and expected returns on assets and experience gains and losses arising on
scheme liabilities during the year, together with differences arising from changes in assumptions, are recognised in the consolidated statement
of comprehensive income.
Contributions to the scheme are paid in accordance with the scheme rules and the recommendation of the actuary. The charge to the income
statement reflects the current and past service cost of such obligations. The expected return on scheme assets and the interest cost on scheme
liabilities are included within the finance charges in the income statement.
Other post-retirement benefit scheme and long-term benefits scheme
For the accrued benefit schemes and long service leave provision the cost of providing benefits is calculated at least annually by independent
actuaries using the projected unit credit method. The accrued benefit obligation recognised in the balance sheet represents the present value of
scheme liabilities. The experience gains and losses arising on scheme liabilities during the year, together with differences arising from changes in
assumptions, are recognised in the consolidated statement of comprehensive income in the year. The charge to the income statement reflects
the current and past service cost of such obligations and the impact of curtailments. The expected return on scheme assets and the interest cost
on scheme liabilities are included within the finance charges in the income statement.
s) share-based payment transactionsThe share option programme allows Group employees to acquire shares of the ultimate Parent Company; these awards are granted by the
ultimate Parent. The fair value of options granted is recognised as an employee expense with a corresponding increase in equity. The fair value is
measured at grant date and spread over the period during which the employees become unconditionally entitled to the options. The fair value
of the options granted is measured using an option valuation model, taking into account the terms and conditions upon which the options were
granted. The amount recognised as an expense is adjusted to reflect the actual number of share options that vest except where forfeiture is due
only to share prices not achieving the threshold for vesting. In accordance with the transitional arrangements of IFRS 2, no expense is recorded
for equity-settled options granted prior to 7 November 2002 nor for those vested by 1 January 2006.
t) provisionsA provision is recognised in the balance sheet when the Group has a present legal or constructive obligation as a result of a past event, and it
is probable that an outflow of economic benefits will be required to settle the obligation. If the effect is material, provisions are determined by
discounting the expected future cash flows at a pre-tax rate that reflects current market assessments of the time value of money and, where
appropriate, the risks specific to the liability.
Warranty provisions are made for specific product issues based on an estimate of the likely cost arising. It has been deemed prudent to provide
for an amount based on historical information.
u) RevenueRevenue represents the total value of amounts invoiced to all customers in respect of goods or services rendered during the year net of credit
notes, returns and any contractually agreed discounts, excluding value added tax.
Invoices for goods are raised when the risks and rewards of ownership have passed which may differ between customers depending on the
contractual arrangements in place.
Revenue is recognised in the income statement when it can be reliably measured, along with the associated costs, and its collectability is
reasonably assured.

44
titan europe Plc Annual Report & Accounts 2009
17643 25/05/10 Proof6
44
titan europe Plc Annual Report & Accounts 2009
NoTes To The CoNsoLiDaTeD fiNaNCiaL sTaTeMeNTs continued
For the year ended 31 December 2009
17643 25/05/10 Proof6
1 aCCouNTiNG poLiCies (continued)
v) expensesOperating lease payments
Payments made under operating leases are recognised in the income statement on a straight-line basis over the term of the lease. Lease
incentives received are recognised in the income statement as an integral part of the total lease expense.
Finance lease payments
Minimum lease payments are apportioned between the finance charge and the reduction of the outstanding liability. The finance charge is
allocated to each year during the lease term so as to produce a constant periodic rate of interest on the remaining balance of the liability.
Net financing costs
Net financing costs comprise interest payable, finance charges on finance leases, interest receivable on funds invested, dividend income, foreign
exchange gains and losses and gains and losses on hedging instruments that are recognised in the income statement, unwinding of fair value
adjustments, post-employment obligation charges and expected return on pension scheme assets.
Interest income and interest payable is recognised in the income statement as it accrues, using the effective interest method. Dividend income is
recognised in the income statement on the date the entity’s right to receive payments is established.
Government grants
Grants receivable from governments or similar bodies are credited to the balance sheet in the period in which conditions relating to the grant
are met. Where they relate to specific assets they are amortized on a straight-line basis over the same period the asset is depreciated. Where they
relate to revenue expenditure and/or non-asset criteria they are taken to the income statement to match the period in which the expenditure is
incurred and criteria met.
w) TaxationTax on the profit or loss for the year comprises current and deferred tax. Tax is recognised in the income statement except to the extent that it
relates to items recognised directly in equity, in which case it is recognised in equity.
Current tax is the expected tax payable on the taxable income for the year, using tax rates enacted or substantively enacted at the balance sheet
date, and any adjustment to tax payable in respect of previous years.
Deferred tax is provided on temporary differences between the carrying amounts of assets and liabilities for financial reporting purposes and
the amounts used for taxation purposes. The following temporary differences are not provided for: the initial recognition of goodwill; the
initial recognition of assets or liabilities that affect neither accounting nor taxable profit other than in a business combination; and differences
relating to investments in subsidiaries to the extent that they will probably not reverse in the foreseeable future. The amount of deferred tax
provided is based on the expected manner of realisation or settlement of the carrying amount of assets and liabilities, using tax rates enacted or
substantively enacted at the balance sheet date.
A deferred tax asset is recognised only to the extent that it is probable that future taxable profits will be available against which the asset can be
utilised.

www.titaneurope.com Stock code: AIM: TSW.L
45
our business
17643 25/05/10 Proof6
Notes to the Consolidated Financial Statements
www.titaneurope.com Stock code: AIM: TSW.L
45
financial
17643 25/05/10 Proof6
1 aCCouNTiNG poLiCies (continued)
x) segmental reportingIFRS 8 “Operating Segments” was issued in November 2006 and is required to be implemented from 1 January 2009. IFRS 8 was early adopted in
2008. IFRS 8 replaces IAS 14. The new standard requires a “management approach”, under which segment information is presented on the same
basis as that used for internal reporting purposes. The segments are reported in a manner that is more consistent with the internal reporting
provided to the Chief Operating Decision Maker (CODM). Goodwill is allocated by management to groups of cash-generating units on a segment
level, the allocation of goodwill remains as reported in 2007, between the Wheels and Undercarriage segments.
Operating segments are reported in a manner consistent with the internal reporting provided to the CODM on a monthly basis. The CODM has
been identified as the Chief Executive Officer (CEO) who is responsible for assessing performance of the operating segments and allocating
resources to these segments.
y) standards, amendments to standards and interpretations issued but not yet appliedInterpretations effective in 2009:
IAS 1 (Revised), “Presentation of financial statements” regarding presentation of financial statements, see accounting policy b) for further details.
IFRS 7 “Financial instruments — Disclosures” (amendment) regarding enhanced disclosures about fair value measurement and liquidity risk.
IFRS 2 (Amendment) “Share-based payment” regarding vesting conditions. This amendment does not have a material impact on the Group or
Company financial statements.
Standards, amendments and interpretations to existing standards which are not yet effective
The following is a summary of relevant revisions and amendments to standards and interpretations which are unlikely to have a material impact
on the Group’s results, assets or liabilities.
IFRIC 17 “Distribution of non-cash assets to owners” regarding distributions of non-cash assets to shareholders.
IFRS 3 (Revised) “Business Combinations” regarding fair values at the acquisition date and treatment of contingent payments.
IFRS 5 (Amendment) “Non-current assets held for sale and discontinued operations” regarding disclosure of assets and liabilities when there is a
partial loss of control.
IAS 38 (Amendments) “Intangible assets” regarding methods of amortisation and recognition of prepaid goods and services.
There are a number of standards, amendments and interpretations that are not relevant to the Group which have therefore not been listed above.
z) significant judgements, key assumptions and estimatesThe Group’s significant accounting policies are set out above. The preparation of financial statements, in conformity with IFRS, requires the use
of estimates, subjective judgement and assumptions that may affect the amounts of assets and liabilities at the balance sheet date and reported
profit and earnings for the year. The directors base these judgements on the basis of past experience, professional expert advice and other
relevant evidence. The accounting policies where the directors consider that more complex estimates, judgements and assumptions have to be
made are those in respect of intangible assets, derivative financial instruments, employee benefits and taxation. See note 3.
2 fiNaNCiaL RisK MaNaGeMeNTfinancial risk factorsThe Group’s activities expose it to a variety of financial risks: market risk (including currency risk, fair value interest rate risk and cash flow interest
rate risk), credit risk and liquidity risk. The Group’s overall risk management programme focuses on the unpredictability of financial markets and
seeks to minimise potential adverse effects on the Group’s financial performance. The Group uses derivative financial instruments to hedge
certain risk exposures.
Risk management is carried out centrally under policies approved by the Board of directors. Centrally management identify, evaluate and hedge
financial risks in close co-operation with the Group’s operating units. The Board provides written principles for overall risk management, as well
as written policies covering specific areas, such as foreign exchange risk, interest rate risk, credit risk, use of derivative financial instruments and
non-derivative financial instruments, and investment of excess liquidity.
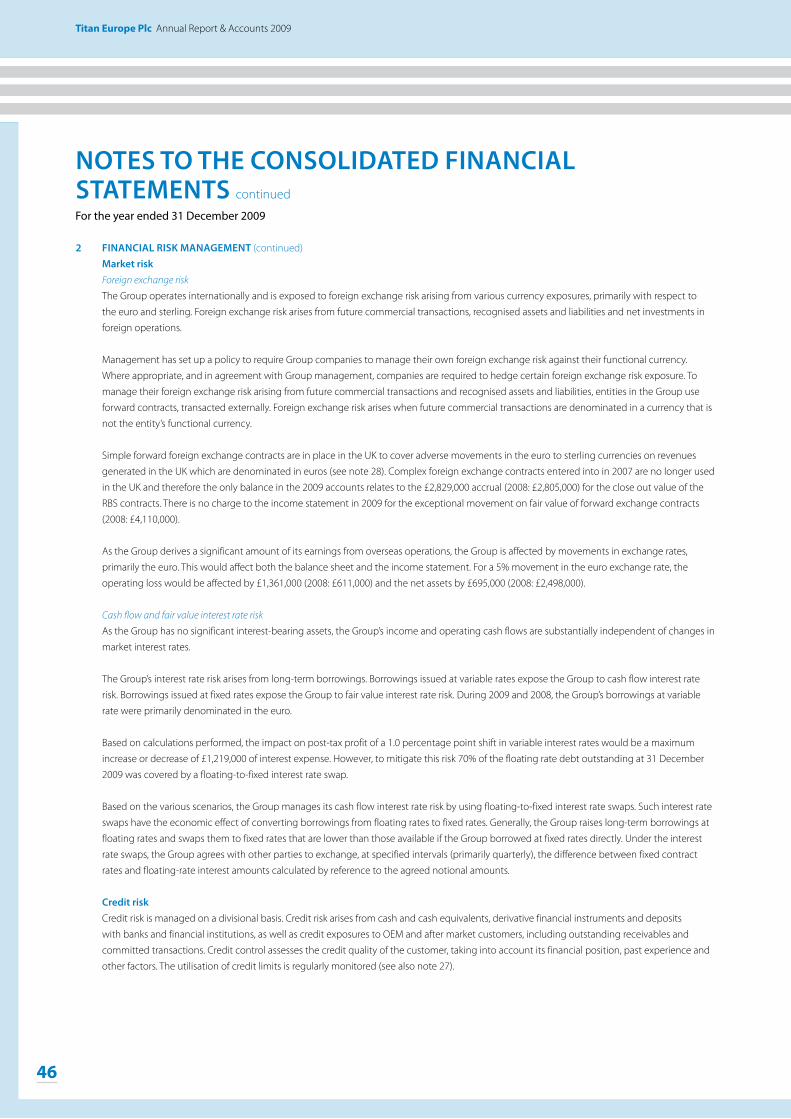
46
titan europe Plc Annual Report & Accounts 2009
17643 25/05/10 Proof6
46
titan europe Plc Annual Report & Accounts 2009
NoTes To The CoNsoLiDaTeD fiNaNCiaL sTaTeMeNTs continued
For the year ended 31 December 2009
17643 25/05/10 Proof6
2 fiNaNCiaL RisK MaNaGeMeNT (continued)
Market riskForeign exchange risk
The Group operates internationally and is exposed to foreign exchange risk arising from various currency exposures, primarily with respect to
the euro and sterling. Foreign exchange risk arises from future commercial transactions, recognised assets and liabilities and net investments in
foreign operations.
Management has set up a policy to require Group companies to manage their own foreign exchange risk against their functional currency.
Where appropriate, and in agreement with Group management, companies are required to hedge certain foreign exchange risk exposure. To
manage their foreign exchange risk arising from future commercial transactions and recognised assets and liabilities, entities in the Group use
forward contracts, transacted externally. Foreign exchange risk arises when future commercial transactions are denominated in a currency that is
not the entity’s functional currency.
Simple forward foreign exchange contracts are in place in the UK to cover adverse movements in the euro to sterling currencies on revenues
generated in the UK which are denominated in euros (see note 28). Complex foreign exchange contracts entered into in 2007 are no longer used
in the UK and therefore the only balance in the 2009 accounts relates to the £2,829,000 accrual (2008: £2,805,000) for the close out value of the
RBS contracts. There is no charge to the income statement in 2009 for the exceptional movement on fair value of forward exchange contracts
(2008: £4,110,000).
As the Group derives a significant amount of its earnings from overseas operations, the Group is affected by movements in exchange rates,
primarily the euro. This would affect both the balance sheet and the income statement. For a 5% movement in the euro exchange rate, the
operating loss would be affected by £1,361,000 (2008: £611,000) and the net assets by £695,000 (2008: £2,498,000).
Cash flow and fair value interest rate risk
As the Group has no significant interest-bearing assets, the Group’s income and operating cash flows are substantially independent of changes in
market interest rates.
The Group’s interest rate risk arises from long-term borrowings. Borrowings issued at variable rates expose the Group to cash flow interest rate
risk. Borrowings issued at fixed rates expose the Group to fair value interest rate risk. During 2009 and 2008, the Group’s borrowings at variable
rate were primarily denominated in the euro.
Based on calculations performed, the impact on post-tax profit of a 1.0 percentage point shift in variable interest rates would be a maximum
increase or decrease of £1,219,000 of interest expense. However, to mitigate this risk 70% of the floating rate debt outstanding at 31 December
2009 was covered by a floating-to-fixed interest rate swap.
Based on the various scenarios, the Group manages its cash flow interest rate risk by using floating-to-fixed interest rate swaps. Such interest rate
swaps have the economic effect of converting borrowings from floating rates to fixed rates. Generally, the Group raises long-term borrowings at
floating rates and swaps them to fixed rates that are lower than those available if the Group borrowed at fixed rates directly. Under the interest
rate swaps, the Group agrees with other parties to exchange, at specified intervals (primarily quarterly), the difference between fixed contract
rates and floating-rate interest amounts calculated by reference to the agreed notional amounts.
Credit riskCredit risk is managed on a divisional basis. Credit risk arises from cash and cash equivalents, derivative financial instruments and deposits
with banks and financial institutions, as well as credit exposures to OEM and after market customers, including outstanding receivables and
committed transactions. Credit control assesses the credit quality of the customer, taking into account its financial position, past experience and
other factors. The utilisation of credit limits is regularly monitored (see also note 27).
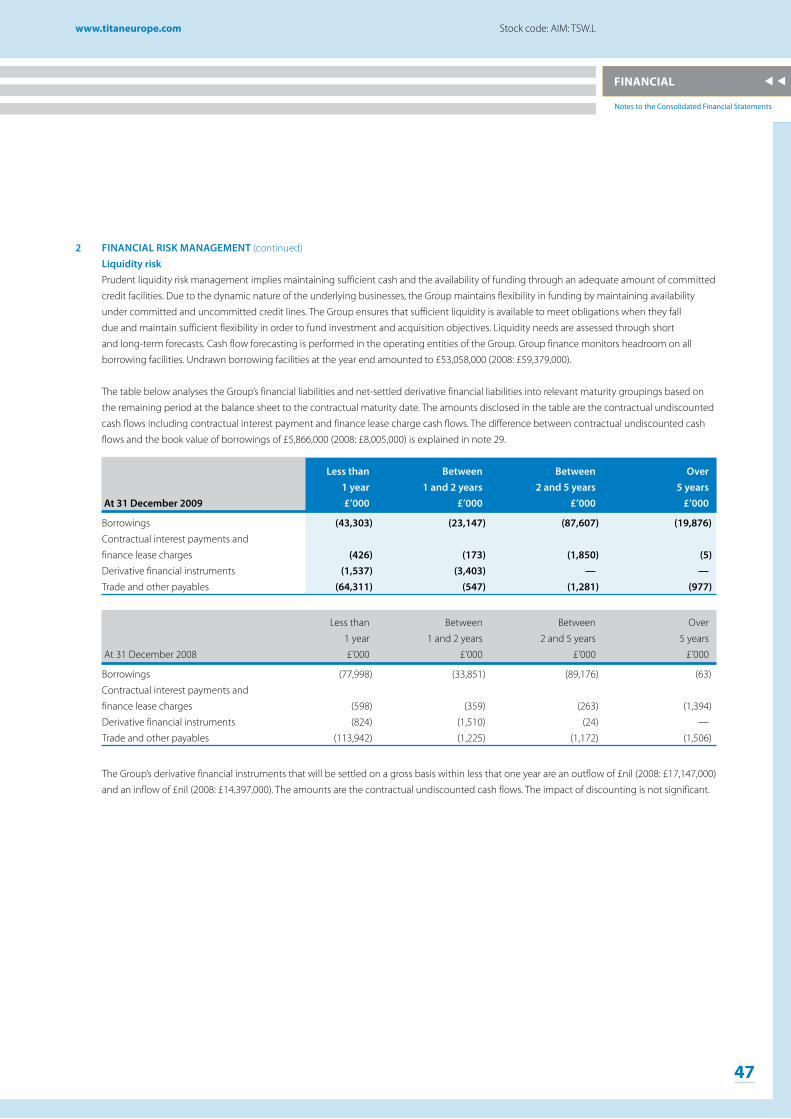
www.titaneurope.com Stock code: AIM: TSW.L
47
our business
17643 25/05/10 Proof6
Notes to the Consolidated Financial Statements
www.titaneurope.com Stock code: AIM: TSW.L
47
financial
17643 25/05/10 Proof6
2 fiNaNCiaL RisK MaNaGeMeNT (continued)
Liquidity riskPrudent liquidity risk management implies maintaining sufficient cash and the availability of funding through an adequate amount of committed
credit facilities. Due to the dynamic nature of the underlying businesses, the Group maintains flexibility in funding by maintaining availability
under committed and uncommitted credit lines. The Group ensures that sufficient liquidity is available to meet obligations when they fall
due and maintain sufficient flexibility in order to fund investment and acquisition objectives. Liquidity needs are assessed through short
and long-term forecasts. Cash flow forecasting is performed in the operating entities of the Group. Group finance monitors headroom on all
borrowing facilities. Undrawn borrowing facilities at the year end amounted to £53,058,000 (2008: £59,379,000).
The table below analyses the Group’s financial liabilities and net-settled derivative financial liabilities into relevant maturity groupings based on
the remaining period at the balance sheet to the contractual maturity date. The amounts disclosed in the table are the contractual undiscounted
cash flows including contractual interest payment and finance lease charge cash flows. The difference between contractual undiscounted cash
flows and the book value of borrowings of £5,866,000 (2008: £8,005,000) is explained in note 29.
Less than between between over 1 year 1 and 2 years 2 and 5 years 5 years at 31 December 2009 £’000 £’000 £’000 £’000
Borrowings (43,303) (23,147) (87,607) (19,876)Contractual interest payments and
finance lease charges (426) (173) (1,850) (5)Derivative financial instruments (1,537) (3,403) — —Trade and other payables (64,311) (547) (1,281) (977)
Less than Between Between Over
1 year 1 and 2 years 2 and 5 years 5 years
At 31 December 2008 £’000 £’000 £’000 £’000
Borrowings (77,998) (33,851) (89,176) (63)
Contractual interest payments and
finance lease charges (598) (359) (263) (1,394)
Derivative financial instruments (824) (1,510) (24) —
Trade and other payables (113,942) (1,225) (1,172) (1,506)
The Group’s derivative financial instruments that will be settled on a gross basis within less that one year are an outflow of £nil (2008: £17,147,000)
and an inflow of £nil (2008: £14,397,000). The amounts are the contractual undiscounted cash flows. The impact of discounting is not significant.

48
titan europe Plc Annual Report & Accounts 2009
17643 25/05/10 Proof6
48
titan europe Plc Annual Report & Accounts 2009
NoTes To The CoNsoLiDaTeD fiNaNCiaL sTaTeMeNTs continued
For the year ended 31 December 2009
17643 25/05/10 Proof6
2 fiNaNCiaL RisK MaNaGeMeNT (continued)
Capital risk managementThe Group’s objectives when managing capital are to safeguard the Group’s ability to continue as a going concern in order to provide returns for
the shareholders, benefits for other stakeholders and to maintain an optimal capital structure to reduce the cost of capital.
In line with external requirements, the Group closely monitors net debt on a monthly basis and has annual targets on the level of net debt.
2009 2008
Note £’000 £’000
Total borrowings 29 (168,047) (193,083)
Less liquid resources 21 971 660
Less cash and cash equivalents 24 19,046 34,258
Net debt (148,030) (158,165)
Group net debt is lower than last year at £148,030,000 (2008: £158,165,000). However, this is significantly affected by the weakening of the
euro year end exchange rate generating a translation impact as at 31 December 2009 of £10,977,000 (exchange movement reported in the
reconciliation of cash flow to net debt). The Group’s net debt as at 31 December 2009 at the 2008 year end exchange rate would have been
£159,703,000.
fair value estimationThe Group uses a variety of methods and makes assumptions that are based on market conditions existing at each balance sheet date. The
fair value of interest rate swaps is calculated as the present value of the estimated future cash flows. The fair value of forward foreign exchange
contracts is determined using quoted forward exchange rates at the balance sheet date.
The carrying value less impairment provision of trade receivables and payables is assumed to approximate their fair values. The fair value of
financial liabilities for disclosure purposes is estimated by discounting the future contractual cash flows at the current market interest rate that is
available to the Group for similar financial instruments.

www.titaneurope.com Stock code: AIM: TSW.L
49
our business
17643 25/05/10 Proof6
Notes to the Consolidated Financial Statements
www.titaneurope.com Stock code: AIM: TSW.L
49
financial
17643 25/05/10 Proof6
3 CRiTiCaL aCCouNTiNG esTiMaTes aND JuDGeMeNTsEstimates and judgements are continually evaluated and are based on historical experience and other factors, including expectations of future
events that are believed to be reasonable under the circumstances.
Critical accounting estimates and assumptionsThe Group makes estimates and assumptions concerning the future. The resulting accounting estimates will, by definition, seldom equal the
related actual results. The estimates and assumptions that have a significant risk of causing a material adjustment to the carrying amounts of
assets and liabilities within the next financial year are discussed below.
Estimated impairment of goodwill (note 17)
The Group tests annually whether goodwill has suffered any impairment, in accordance with the accounting policy stated in note 1(l). The
recoverable amounts of cash-generating units have been determined based on value-in-use calculations. These calculations require the use of
estimates (note 17). No impairment charges arose in the Group during 2009.
Income taxes (notes 9 and 30)
The Group is subject to income taxes in numerous jurisdictions. Significant judgement is required in determining the worldwide provision for
income taxes. There are many transactions and calculations for which the ultimate tax determination is uncertain during the ordinary course of
business. The Group recognises liabilities for anticipated tax audit issues based on estimates of whether additional taxes will be due. Where the
final tax outcome of these matters is different from the amounts that were initially recorded, such differences will impact the income tax and
deferred tax provisions in the period in which the determination is made but management do not consider that any favourable or unfavourable
movements would be material. Recognition of deferred tax assets, and hence credits to the income statement, is based on forecast future taxable
income and therefore involves judgement regarding the future financial performance of particular legal entities of tax groups in which the
deferred tax assets are recognised.
Fair value of derivatives and other financial instruments (note 28)
The fair value of financial instruments that are not traded in an active market (for example, over-the-counter derivatives) is determined by using
valuation techniques. The Group uses its judgement to select a variety of methods and make assumptions that are mainly based on market
conditions existing at each balance sheet date.
Employee benefits (note 31)
The Group operates two defined benefit schemes and also has several post-employment benefit schemes in place. A significant proportion, 82%
as at 31 December 2009 (2008: 84%), of the total liability relates to the TFR (Trattamento di Fine Rapporto) scheme in Italy.

50
titan europe Plc Annual Report & Accounts 2009
17643 25/05/10 Proof6
50
titan europe Plc Annual Report & Accounts 2009
NoTes To The CoNsoLiDaTeD fiNaNCiaL sTaTeMeNTs continued
For the year ended 31 December 2009
17643 25/05/10 Proof6
4 seGMeNTaL aNaLYsisManagement has determined the operating segments, based on the reports reviewed by the Chief Executive Officer (‘CEO’), to monitor
performance of the segments and make strategic decisions.
Management consider the business to have two segments, being Undercarriage and Wheels. The Undercarriage segment derives its revenue
from sales of undercarriages to the OEM market and aftermarket. The Wheels segment derives its revenue from sales of wheels and tyres to the
OEM market. The Wheels segment as reported to management includes the head office function. Management fees are charged by the head
office function to the two segments, and are reported within those segments.
Sales between segments are carried out at arm’s length. The revenue from external parties reported to the CEO is measured in a manner
consistent with the income statement contained in the financial statements. There are no differences between the amounts presented to the
Chief Operating Decision Maker (‘CODM’) and amounts included within the financial statements, with the exception of the classification of
goodwill as explained on the following page.
The performance reports reviewed by the CEO are consistent with the format reported in the income statement, with the main measure
reviewed being trading profit. Amounts reviewed with respect to total assets and liabilities are measured in a manner consistent with the
financial statements. Both assets and liabilities are allocated based on the operations of the segment and the physical location of the assets.
wheels undercarriage Total 2009 2008 2009 2008 2009 2008
£’000 £’000 £’000 £’000 £’000 £’000
Revenue
Total revenue 115,711 200,013 235,552 447,477 351,263 647,490
Intercompany revenue (2,508) (11,006) (90,185) (184,171) (92,693) (195,177)
external revenue 113,203 189,007 145,367 263,306 258,570 452,313
Trading (loss)/profit (4,192) 22,571 (13,938) 8,593 (18,130) 31,164
Restructuring and rationalisation costs (6,496) (296) (8,186) (3,648) (14,682) (3,944)
Significant legal costs (651) — — — (651) —
Movement on fair value of forward
foreign exchange contracts — (4,110) — — — (4,110)
(Loss)/profit from operations (11,339) 18,165 (22,124) 4,945 (33,463) 23,110
Share of profit/(loss) of associate 1,277 (1,100) — — 1,277 (1,100)
Share of profit of joint venture 106 86 — — 106 86
Finance income 914 571 892 692 1,806 1,263
Finance expense (3,168) (4,910) (7,999) (8,814) (11,167) (13,724)
(Loss)/profit before income tax (12,210) 12,812 (29,231) (3,177) (41,441) 9,635
income tax credit/(expense) 3,073 (4,315) 3,977 171 7,050 (4,144)
(Loss)/profit for the year (9,137) 8,497 (25,254) (3,006) (34,391) 5,491

www.titaneurope.com Stock code: AIM: TSW.L
51
our business
17643 25/05/10 Proof6
Notes to the Consolidated Financial Statements
www.titaneurope.com Stock code: AIM: TSW.L
51
financial
17643 25/05/10 Proof6
4 seGMeNTaL aNaLYsis (continued)
wheels undercarriages Total 2009 2008 2009 2008 2009 2008
£’000 £’000 £’000 £’000 £’000 £’000
assets
Intangible assets* (129) 422 54,456 54,551 54,327 54,973
Property, plant and equipment 48,301 56,991 101,876 114,027 150,177 171,018
Interest in associate and joint venture 15,382 14,916 — — 15,382 14,916
Other assets 60,741 103,344 104,415 159,930 165,156 263,274
Income tax recoverable 300 294 1,308 1,521 1,608 1,815
Deferred tax assets 6,440 5,642 30,416 26,106 36,856 31,748
Total assets 131,035 181,609 292,471 356,135 423,506 537,744
Liabilities
Borrowings (51,580) (53,800) (116,467) (139,283) (168,047) (193,083)
Other liabilities (32,910) (57,914) (55,454) (84,552) (88,364) (142,466)
Income tax payable (2,446) (5,190) (2,101) (3,194) (4,547) (8,384)
Deferred tax liabilities (6,831) (7,628) (13,243) (11,716) (20,074) (19,344)
Total liabilities (93,767) (124,532) (187,265) (238,745) (281,032) (363,277)
Net assets 37,268 57,077 105,206 117,390 142,474 174,467
other segment items
Capital expenditure
— intangible assets (27) (350) (584) (1,359) (611) (1,709)
— property, plant and equipment (1,794) (9,236) (3,578) (8,928) (5,372) (18,164)
Total capital expenditure (1,821) (9,586) (4,162) (10,287) (5,983) (19,873)
Depreciation (7,615) (6,723) (10,005) (9,328) (17,620) (16,051)
Amortisation (481) (442) (557) (398) (1,038) (840)
Impairment — — (2,868) — (2,868) —
* Consolidation adjustments to goodwill are reported above on the basis of the management accounts presented to the CODM. For statutory
reporting purposes, an additional £8,104,000 credit to goodwill is reallocated to the Undercarriage division, resulting in 2009 and 2008
goodwill for statutory purposes of £5,997,000 Wheels and £44,571,000 Undercarriage.

52
titan europe Plc Annual Report & Accounts 2009
17643 25/05/10 Proof6
52
titan europe Plc Annual Report & Accounts 2009
NoTes To The CoNsoLiDaTeD fiNaNCiaL sTaTeMeNTs continued
For the year ended 31 December 2009
17643 25/05/10 Proof6
4 seGMeNTaL aNaLYsis (continued)
The entity is domiciled in the United Kingdom. Revenue is based on the customer location, the geographical spread of revenue is disclosed below.
wheels undercarriage Total 2009 2008 2009 2008 2009 2008
£’000 £’000 £’000 £’000 £’000 £’000
UK 3,175 8,620 4,596 12,080 7,771 20,700
Europe 79,023 137,813 72,556 124,598 151,579 262,411
North America 6,601 12,793 17,365 42,469 23,966 55,262
South America 2,384 3,955 23,829 24,620 26,213 28,575
Rest of the World 22,020 25,826 27,021 59,539 49,041 85,365
Total 113,203 189,007 145,367 263,306 258,570 452,313
The directors consider that the above disclosure reflects most closely how the business is monitored by the CODM.
Non-current assets by location are summarised below:
wheels undercarriage Total 2009 2008 2009 2008 2009 2008
£’000 £’000 £’000 £’000 £’000 £’000
Property, plant and equipment 48,301 56,991 101,876 114,027 150,177 171,018
Intangible assets (129) 422 54,456 54,551 54,327 54,973
Investments 15,382 14,916 40 40 15,422 14,956
Trade and other receivables 20 112 118 277 138 389
63,574 72,441 156,490 168,895 220,064 241,336
By Location
UK 9,375 17,407 — — 9,375 17,407
Italy 44,997 45,090 113,474 108,254 158,471 153,344
Other 9,202 9,944 43,016 60,641 52,218 70,585
Total 63,574 72,441 156,490 168,895 220,064 241,336

www.titaneurope.com Stock code: AIM: TSW.L
53
our business
17643 25/05/10 Proof6
Notes to the Consolidated Financial Statements
www.titaneurope.com Stock code: AIM: TSW.L
53
financial
17643 25/05/10 Proof6
5 ResTRuCTuRiNG aND RaTioNaLisaTioN CosTs
2009 2008
£’000 £’000
Redundancy costs 7,746 3,457
Temporary lay-off costs 3,536 —
Retirement costs 155 —
Restructuring of manufacturing plants 3,245 487
14,682 3,944
Of the costs incurred in the year, £8,186,000 (2008: £3,648,000) relates to the Undercarriage division and £6,496,000 (2008: £296,000) relates to the
Wheels division.
Included in accruals at the year end is £4,276,000 (2008: £422,000) of costs recognised in 2009 which will be paid in 2010. This is as a result of the
management actions to scale back people and manufacturing to match the significant revenue decline.
2009 Note Number
2008 average employee numbers 13 2,920Permanent reduction in staff (584)
2009 average employee numbers 13 2,336Impact of temporary lay-off on average employee numbers (486)
2009 effective average employee numbers 1,850
Government schemes around the world, particularly in Italy and Germany, have enabled temporary reductions in workforce.
6 fiNaNCiNG CosTs
2009 2008
finance income Note £’000 £’000
Bank balances 191 750
Gains arising on the translation of foreign currency loans 15 1,575 308
Other 40 205
Total finance income 1,806 1,263
finance expense
Bank overdrafts (614) (1,423)
Bank loans (6,524) (7,838)
Hire purchase and finance lease arrangements (427) (546)
Losses arising on the translation of foreign currency loans 15 (84) (1,476)
Other (482) (491)
Total finance expense (8,131) (11,774)
Net financing costs (6,325) (10,511)

54
titan europe Plc Annual Report & Accounts 2009
17643 25/05/10 Proof6
54
titan europe Plc Annual Report & Accounts 2009
NoTes To The CoNsoLiDaTeD fiNaNCiaL sTaTeMeNTs continued
For the year ended 31 December 2009
17643 25/05/10 Proof6
7 fiNaNCe ChaRGes
2009 2008
£’000 £’000
Interest on defined benefit pension plan (129) (125)
Interest on other long-term employee benefits (529) (583)
Net (loss)/gain on remeasurement of derivatives to fair value (880) 93
(1,538) (615)
8 oTheR fiNaNCe ChaRGes
2009 2008
£’000 £’000
Unwinding of the fair value adjustment on the Accordo Quadro loans (1,498) (1,335)
9 iNCoMe Tax expeNse
2009 2008
Note £’000 £’000
Current tax
UK corporation tax:
— Current year (557) 1,278
— Adjustment in respect of prior years (680) (864)
Total UK current tax (1,237) 414
Foreign corporation tax:
— Current year (9) 2,980
— Adjustment in respect of prior years 7 103
Total current tax charge (1,239) 3,497
Deferred tax
Origination and reversal of timing differences 30 (5,811) 647
Total deferred tax charge (5,811) 647
Tax on profits on ordinary activities (7,050) 4,144
The tax assessed for the year is lower (2008: higher) than the standard rate of corporation tax in the United Kingdom of 28% (2008: 28.5%).
2009 2008
£’000 £’000
(Loss)/profit before tax (41,441) 9,635
(Loss)/profit on ordinary activities at the UK tax rate 28% (2008: 28.5%) (11,603) 2,746
effects of:
Expenses not deductible for tax purposes 716 721
Effect of foreign taxation rates 367 2,190
Movement in unrecognised deferred taxation 3,321 (760)
Adjustment in respect of prior years – current tax (673) (761)
Prior year deferred tax 822 8
Total tax (credit)/charge (7,050) 4,144

www.titaneurope.com Stock code: AIM: TSW.L
55
our business
17643 25/05/10 Proof6
Notes to the Consolidated Financial Statements
www.titaneurope.com Stock code: AIM: TSW.L
55
financial
17643 25/05/10 Proof6
10 DiviDeNDs
2009 2008
£’000 £’000
Equity — Ordinary
Interim paid: Nil (2008: 2.17p) per 40p share — 1,800
Final paid: Nil (2008: 4.33p) per 40p share — 3,593
— 5,393
11 eaRNiNGs peR shaReThe weighted average number of shares in issue used in the basic earnings per share calculation may be reconciled to the number used in the
diluted earnings per ordinary share calculation as follows:
weighted average number 2009 2008
Basic earnings per share denominator 82,980,624 82,912,460
Issuable on conversion of options — —
Diluted earnings per share denominator 82,980,624 82,912,460
No share options have a dilutive effect on the earnings per share as the share price is lower than the exercise price of the options.
The earnings to which the earnings per share calculation has been applied are as follows:
2009 2008
£’000 £’000
(Loss)/earnings attributable to ordinary shareholders (34,391) 5,491
Significant one-off items (net of tax):
Restructuring and rationalisation costs 10,103 2,708
Significant legal costs 469 —
Movements on fair value of forward foreign exchange contracts — 2,939
(Loss)/earnings attributable to ordinary shareholders excluding exceptional costs (23,819) 11,138
12 expeNses bY NaTuRe
2009 2008
Note £’000 £’000
Changes in inventories of finished goods and WIP, raw materials
and consumables used 138,114 234,907
Employee benefit expense 13 66,321 90,673
Depreciation and amortisation 16, 17 18,658 16,891
Transportation expenses 5,915 9,989
Utilities 11,513 18,205
Repairs and maintenance 4,813 8,753
Outsourcing costs 11,576 21,315
Operating lease payments — property 1,691 1,497
Operating lease payments — other 2,214 2,439
Foreign exchange losses/(gains) 15 2,171 (1,642)
Other expense 16,059 20,477
Other operating income (2,345) (2,355)
276,700 421,149

56
titan europe Plc Annual Report & Accounts 2009
17643 25/05/10 Proof6
56
titan europe Plc Annual Report & Accounts 2009
NoTes To The CoNsoLiDaTeD fiNaNCiaL sTaTeMeNTs continued
For the year ended 31 December 2009
17643 25/05/10 Proof6
12 expeNses bY NaTuRe (continued)
In the year, the Group incurred research and development expenditure of £3,221,000 (2008: £3,259,000).
2009 2008
£’000 £’000
Audit services
— Fees payable to PricewaterhouseCoopers LLP for the statutory audit of the
Company’s annual accounts 147 110
— Fees payable to PricewaterhouseCoopers LLP and their associates for other services to the Group:
— Audit of the Company’s subsidiaries pursuant to legislation 316 357
Total audit fees 463 467
— Other services pursuant to legislation 41 40
— Tax services 66 149
— Other services 1 75
Total non-audit fees 108 264
Total fees payable to PricewaterhouseCoopers LLP and their associates 571 731
All fees payable to PricewaterhouseCoopers LLP, the Company’s auditors, include amounts in respect of expenses. All fees payable to
PricewaterhouseCoopers LLP have been charged to the income statement.
13 eMpLoYee beNefiT expeNse
2009 2008
£’000 £’000
Wages and salaries 48,927 65,042
Social security costs 12,511 16,579
Employee share options scheme charge 150 206
Pension costs — defined contribution plan 3,460 3,358
Pension costs — defined benefit plan 85 124
Other post-employment benefits 52 35
Temporary staff 766 4,840
Welfare 370 489
66,321 90,673
The average number of persons employed by the Group (including executive directors) during the year was:
2009 2008
Number Number
Production 1,996 2,551
Selling and distribution 116 134
Administration 224 235
2,336 2,920
The key management of the Group comprises the Titan Europe Plc Board of directors and other key management. Details of key management
remuneration is included in note 38. Details of directors’ remuneration are contained in note 14.
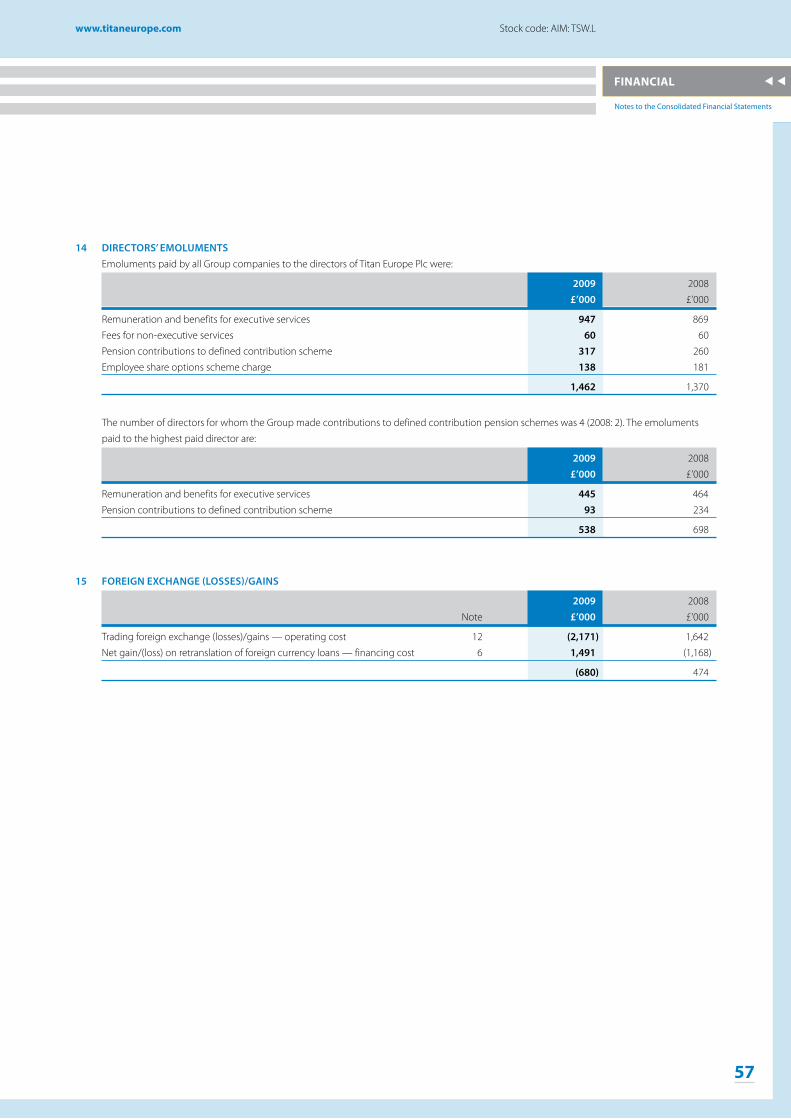
www.titaneurope.com Stock code: AIM: TSW.L
57
our business
17643 25/05/10 Proof6
Notes to the Consolidated Financial Statements
www.titaneurope.com Stock code: AIM: TSW.L
57
financial
17643 25/05/10 Proof6
14 DiReCToRs’ eMoLuMeNTsEmoluments paid by all Group companies to the directors of Titan Europe Plc were:
2009 2008
£’000 £’000
Remuneration and benefits for executive services 947 869
Fees for non-executive services 60 60
Pension contributions to defined contribution scheme 317 260
Employee share options scheme charge 138 181
1,462 1,370
The number of directors for whom the Group made contributions to defined contribution pension schemes was 4 (2008: 2). The emoluments
paid to the highest paid director are:
2009 2008
£’000 £’000
Remuneration and benefits for executive services 445 464
Pension contributions to defined contribution scheme 93 234
538 698
15 foReiGN exChaNGe (Losses)/GaiNs
2009 2008
Note £’000 £’000
Trading foreign exchange (losses)/gains — operating cost 12 (2,171) 1,642
Net gain/(loss) on retranslation of foreign currency loans — financing cost 6 1,491 (1,168)
(680) 474

58
titan europe Plc Annual Report & Accounts 2009
17643 25/05/10 Proof6
58
titan europe Plc Annual Report & Accounts 2009
NoTes To The CoNsoLiDaTeD fiNaNCiaL sTaTeMeNTs continued
For the year ended 31 December 2009
17643 25/05/10 Proof6
16 pRopeRTY, pLaNT aND eQuipMeNT
fixtures, fittings, assets in freehold land Leasehold plant and tools and the course of and buildings property machinery equipment construction Total
Note £’000 £’000 £’000 £’000 £’000 £’000
at 1 January 2008
Cost or valuation 48,249 9,271 139,987 18,269 5,111 220,887
Accumulated depreciation (3,347) (1,091) (66,968) (9,460) — (80,866)
Net book amount 44,902 8,180 73,019 8,809 5,111 140,021
Year ended 31 December 2008
Opening net book amount 44,902 8,180 73,019 8,809 5,111 140,021
Additions 3,415 22 9,683 2,824 2,220 18,164
Disposals — (1) (421) (14) (125) (561)
Reclassifications 108 — 1,882 (284) (1,706) —
Foreign exchange movement 12,108 2,574 17,164 1,699 1,469 35,014
Transfer to held for sale assets (2,665) — (522) — (1,873) (5,060)
Other 5 — (345) (9) (160) (509)
Depreciation charge 12 (1,685) (257) (10,968) (3,141) — (16,051)
Closing net book amount 56,188 10,518 89,492 9,884 4,936 171,018
at 31 December 2008
Cost or valuation 63,770 12,269 192,239 25,577 4,936 298,791
Accumulated depreciation/impairment (7,582) (1,751) (102,747) (15,693) — (127,773)
Net book amount 56,188 10,518 89,492 9,884 4,936 171,018
Year ended 31 December 2009
Opening net book amount 56,188 10,518 89,492 9,884 4,936 171,018
Additions 439 62 1,980 588 2,303 5,372
Disposals (13) — (382) (12) — (407)
Reclassifications 1 — 4,073 489 (4,563) —
Foreign exchange movement (2,403) (798) (1,588) (227) (292) (5,308)
Other — — (8) 17 (19) (10)
Impairment (5) — (2,300) (16) (547) (2,868)
Depreciation charge 12 (1,866) (292) (12,405) (3,057) — (17,620)
Closing net book amount 52,341 9,490 78,862 7,666 1,818 150,177
at 31 December 2009
Cost or valuation 61,342 11,406 188,725 25,638 4,171 291,282Accumulated depreciation/impairment (9,001) (1,916) (109,863) (17,972) (2,353) (141,105)
Net book amount 52,341 9,490 78,862 7,666 1,818 150,177
Property, plant and equipment pledged as security for borrowings for 2009 was £17,555,000 (2008: £10,839,000). This includes the Group’s
obligations under finance leases (see note 29) which are secured by the lessors’ title to the leased assets.
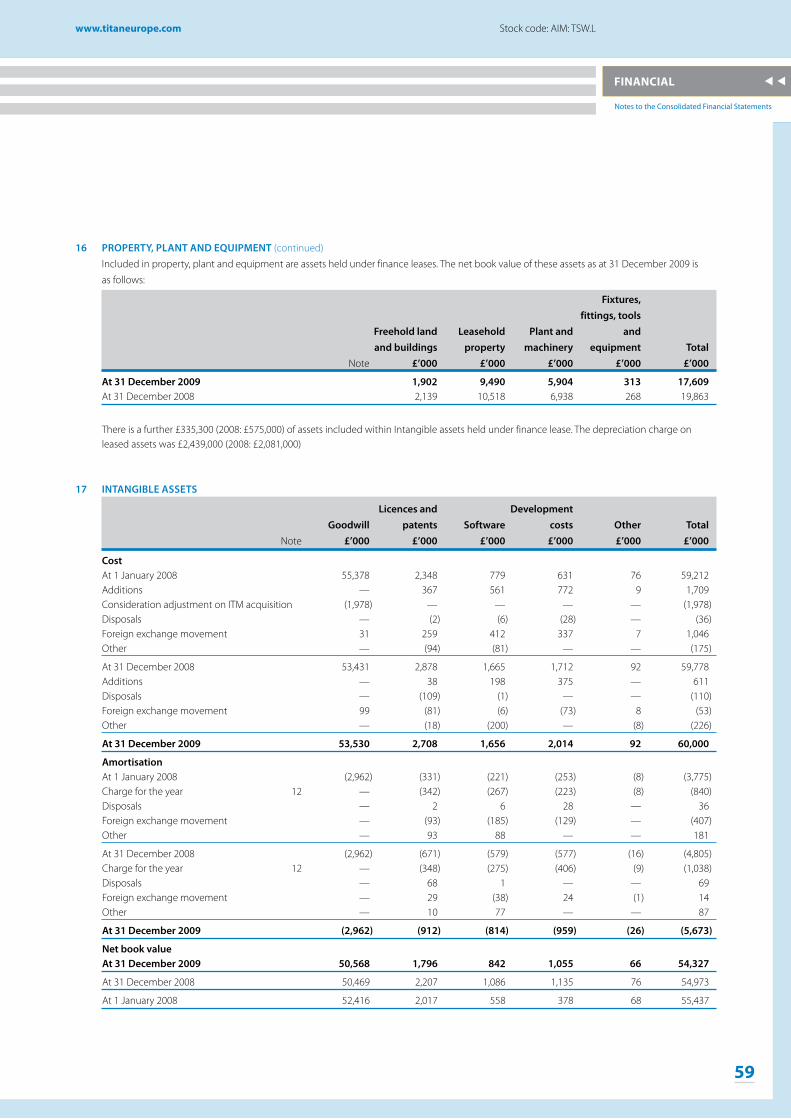
www.titaneurope.com Stock code: AIM: TSW.L
59
our business
17643 25/05/10 Proof6
Notes to the Consolidated Financial Statements
www.titaneurope.com Stock code: AIM: TSW.L
59
financial
17643 25/05/10 Proof6
16 pRopeRTY, pLaNT aND eQuipMeNT (continued)
Included in property, plant and equipment are assets held under finance leases. The net book value of these assets as at 31 December 2009 is
as follows:
fixtures, fittings, tools freehold land Leasehold plant and and and buildings property machinery equipment Total
Note £’000 £’000 £’000 £’000 £’000
at 31 December 2009 1,902 9,490 5,904 313 17,609At 31 December 2008 2,139 10,518 6,938 268 19,863
There is a further £335,300 (2008: £575,000) of assets included within Intangible assets held under finance lease. The depreciation charge on leased assets was £2,439,000 (2008: £2,081,000)
17 iNTaNGibLe asseTs
Licences and Development Goodwill patents software costs other Total Note £’000 £’000 £’000 £’000 £’000 £’000
Cost At 1 January 2008 55,378 2,348 779 631 76 59,212Additions — 367 561 772 9 1,709Consideration adjustment on ITM acquisition (1,978) — — — — (1,978)Disposals — (2) (6) (28) — (36)Foreign exchange movement 31 259 412 337 7 1,046Other — (94) (81) — — (175)
At 31 December 2008 53,431 2,878 1,665 1,712 92 59,778Additions — 38 198 375 — 611Disposals — (109) (1) — — (110)Foreign exchange movement 99 (81) (6) (73) 8 (53)Other — (18) (200) — (8) (226)
at 31 December 2009 53,530 2,708 1,656 2,014 92 60,000
amortisation At 1 January 2008 (2,962) (331) (221) (253) (8) (3,775)Charge for the year 12 — (342) (267) (223) (8) (840)Disposals — 2 6 28 — 36Foreign exchange movement — (93) (185) (129) — (407)Other — 93 88 — — 181
At 31 December 2008 (2,962) (671) (579) (577) (16) (4,805)Charge for the year 12 — (348) (275) (406) (9) (1,038)Disposals — 68 1 — — 69Foreign exchange movement — 29 (38) 24 (1) 14Other — 10 77 — — 87
at 31 December 2009 (2,962) (912) (814) (959) (26) (5,673)
Net book value at 31 December 2009 50,568 1,796 842 1,055 66 54,327
At 31 December 2008 50,469 2,207 1,086 1,135 76 54,973
At 1 January 2008 52,416 2,017 558 378 68 55,437
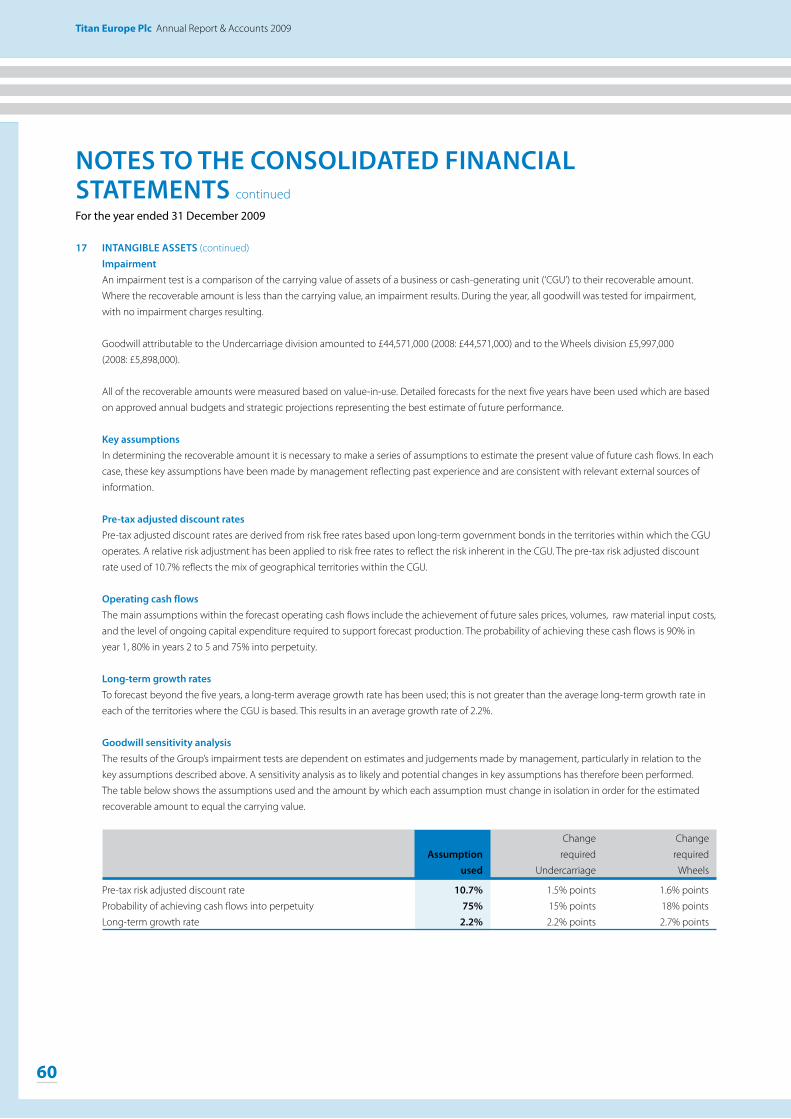
60
titan europe Plc Annual Report & Accounts 2009
17643 25/05/10 Proof6
60
titan europe Plc Annual Report & Accounts 2009
NoTes To The CoNsoLiDaTeD fiNaNCiaL sTaTeMeNTs continued
For the year ended 31 December 2009
17643 25/05/10 Proof6
17 iNTaNGibLe asseTs (continued)
impairmentAn impairment test is a comparison of the carrying value of assets of a business or cash-generating unit (‘CGU’) to their recoverable amount.
Where the recoverable amount is less than the carrying value, an impairment results. During the year, all goodwill was tested for impairment,
with no impairment charges resulting.
Goodwill attributable to the Undercarriage division amounted to £44,571,000 (2008: £44,571,000) and to the Wheels division £5,997,000
(2008: £5,898,000).
All of the recoverable amounts were measured based on value-in-use. Detailed forecasts for the next five years have been used which are based
on approved annual budgets and strategic projections representing the best estimate of future performance.
Key assumptions In determining the recoverable amount it is necessary to make a series of assumptions to estimate the present value of future cash flows. In each
case, these key assumptions have been made by management reflecting past experience and are consistent with relevant external sources of
information.
pre-tax adjusted discount ratesPre-tax adjusted discount rates are derived from risk free rates based upon long-term government bonds in the territories within which the CGU
operates. A relative risk adjustment has been applied to risk free rates to reflect the risk inherent in the CGU. The pre-tax risk adjusted discount
rate used of 10.7% reflects the mix of geographical territories within the CGU.
operating cash flowsThe main assumptions within the forecast operating cash flows include the achievement of future sales prices, volumes, raw material input costs,
and the level of ongoing capital expenditure required to support forecast production. The probability of achieving these cash flows is 90% in
year 1, 80% in years 2 to 5 and 75% into perpetuity.
Long-term growth ratesTo forecast beyond the five years, a long-term average growth rate has been used; this is not greater than the average long-term growth rate in
each of the territories where the CGU is based. This results in an average growth rate of 2.2%.
Goodwill sensitivity analysisThe results of the Group’s impairment tests are dependent on estimates and judgements made by management, particularly in relation to the
key assumptions described above. A sensitivity analysis as to likely and potential changes in key assumptions has therefore been performed.
The table below shows the assumptions used and the amount by which each assumption must change in isolation in order for the estimated
recoverable amount to equal the carrying value.
Change Change
assumption required required
used Undercarriage Wheels
Pre-tax risk adjusted discount rate 10.7% 1.5% points 1.6% points
Probability of achieving cash flows into perpetuity 75% 15% points 18% points
Long-term growth rate 2.2% 2.2% points 2.7% points

www.titaneurope.com Stock code: AIM: TSW.L
61
our business
17643 25/05/10 Proof6
Notes to the Consolidated Financial Statements
www.titaneurope.com Stock code: AIM: TSW.L
61
financial
17643 25/05/10 Proof6
18 iNvesTMeNTsInvestments in subsidiary undertakings
The investments in subsidiary undertakings are at cost. Subsidiary undertakings are as follows:
Company’s equity Registered shareholding at Company country principal business 31 December 2009
Titan Steel Wheels Limited England Manufacture of steel wheels for off-road vehicles 100%
Titan Steel Wheels Exports Limited England Dormant See below*
Titan Distribution (UK) Limited England Distribution of wheels and tyres for off-road and 100%
agricultural vehicles
Titan ITM Holding SpA Italy Italian Holding Company 100%
Titan Italia SpA Italy Manufacture of agricultural wheels, idlers and See below†
brakes for off-road vehicles
Italtractor ITM SpA Italy Distribution of complete undercarriage See below†
components and assemblies
Italtractor Operations SpA Italy Manufacture of undercarriage components See below†
and assemblies
Dosfly SA Spain Dormant See below†
Titan Intertractor GmbH Germany Design, assembly and distribution of complete See below†
undercarriage frames. Distribution of undercarriage
components. Manufacture of steel wheels for off-road
and agricultural vehicles
Piezas Rodajes SA Spain Manufacture of cast components for undercarriage See below †
and ground engaging tools
Casting Product SA Spain Dormant See below†
Italtractor ITM Track Ltd China Assembly and distribution of undercarriage components See below†
Titan ITM (Tianjin) Co China Manufacture, assembly and distribution of undercarriage See below†
components
Italtractor Landroni Ltda Brazil Manufacture and distribution of undercarriage See below†
components
Intertractor America Corp USA Manufacture, assembly and distribution of See below†
undercarriage components
Titan France SAS France Manufacture of steel wheels for off-road and See below†
agricultural vehicles
Titan Wheels Australia Pty Ltd Australia Assembly and distribution of steel wheels. Manufacture 100%
and distribution of agricultural wheels and associated
components, construction and mining wheels. Distribution
and service of Undercarriage components for the mining market
Titan Wheels Indonesia PT Indonesia Assembly and distribution of steel wheels. Distribution of See below‡
construction and mining wheels
Aros Del Pacifico S.A. Chile Assembly and distribution of off-highway wheels for mining 100%
and construction vehicles
Aros Del Pacifico S.A.C. Peru Assembly and distribution of off-highway wheels for mining 100%
and construction vehicles
* 100% held via the Company’s holding in Titan Steel Wheels Limited.
† 100% held via the Company’s holding in Titan ITM Holding SpA.
‡ 100% held via the Company’s holding in Titan Wheels Australia Pty Ltd.

62
titan europe Plc Annual Report & Accounts 2009
17643 25/05/10 Proof6
62
titan europe Plc Annual Report & Accounts 2009
NoTes To The CoNsoLiDaTeD fiNaNCiaL sTaTeMeNTs continued
For the year ended 31 December 2009
17643 25/05/10 Proof6
18 iNvesTMeNTs (continued)
Investments are summarised below:
2009 2008
£’000 £’000
Share of net assets of associated undertaking including goodwill 11,293 10,574
Share of net assets of joint venture including goodwill 4,089 4,342
Other investments 40 40
end of the year 15,422 14,956
The directors consider that the values of the investment are supported by their underlying assets.
19 iNvesTMeNT iN assoCiaTeThe investment in associate represents the 35.91% equity stake in Wheels India Limited, (held by the Company Titan Europe Plc) a company
incorporated in India and listed on the National Stock Exchange in India. The Group’s share of Wheels India Limited results and net assets is
disclosed below:
2009 2008
£’000 £’000
Beginning of the year 10,574 11,400
Share of profit/(loss) 1,277 (1,100)
Exchange differences (313) 580
Other equity movements (245) (306)
end of the year 11,293 10,574
Goodwill assets Liabilities Revenues profit/(loss) interest held £’000 £’000 £’000 £’000 £’000 %
2008 2,811 43,820 (36,057) 55,705 (1,100) 35.91
2009 2,811 43,597 (35,115) 49,347 1,277 35.91
The Company’s principal activity is the manufacture of commercial vehicle wheels. Wheels India Limited has a reporting date of 31 March. Results
are included for the 12 months up to and including 31 December 2009.
Included in the profit for the year is an exceptional credit movement on the fair value of foreign exchange contracts used for cash flow hedging
of £768,000 (2008: £2,249,000 debit movement).

www.titaneurope.com Stock code: AIM: TSW.L
63
our business
17643 25/05/10 Proof6
Notes to the Consolidated Financial Statements
www.titaneurope.com Stock code: AIM: TSW.L
63
financial
17643 25/05/10 Proof6
20 iNvesTMeNT iN JoiNT veNTuRe
Investments in joint ventures comprise a 50% equity stake in Titan Jantsa, Turkey, held by Titan Italia SpA. The Group’s share of Titan Jantsa results
and net assets is disclosed below:
2009 2008
£’000 £’000
Revenues 2,930 4,437
Operating costs and other income (2,773) (4,287)
Profit from operations 157 150
Net financing costs (11) (42)
Profit before income tax 146 108
Taxation (40) (22)
Profit after income tax 106 86
Non-current assets 2,303 2,920
Current assets 2,945 4,299
Gross assets 5,248 7,219
Non-current liabilities (480) (728)
Current liabilities (786) (2,256)
Gross liabilities (1,266) (2,984)
Goodwill 107 107
21 TRaDe aND oTheR ReCeivabLes
2009 2008
Note £’000 £’000
Trade receivables 50,430 87,158
Less: provision for impairment of trade receivables (1,209) (1,296)
Trade receivables — net 49,221 85,862
Prepayments 2,553 3,021
Other debtors 6,236 6,666
Short-term deposits 971 660
Receivables from related parties 38 203 753
Loans to related parties 38 — 243
59,184 97,205
Less: non-current portion:
Prepayments 48 46
Other debtors 90 343
138 389
Current portion 59,046 96,816

64
titan europe Plc Annual Report & Accounts 2009
17643 25/05/10 Proof6
64
titan europe Plc Annual Report & Accounts 2009
NoTes To The CoNsoLiDaTeD fiNaNCiaL sTaTeMeNTs continued
For the year ended 31 December 2009
17643 25/05/10 Proof6
21 TRaDe aND oTheR ReCeivabLes (continued)
Analysis of trade receivables past due but not impaired:
2009 2008
£’000 £’000
Up to 3 months 8,234 16,439
3 to 6 months 1,954 1,703
Over 6 months 201 279
10,389 18,421
Credit quality of trade receivables is outlined in Note 27.
Currency analysis
2009 2008
£’000 £’000
Sterling 772 2,151
Euro 44,894 78,426
US dollar 4,422 7,395
Australian dollar 2,828 3,737
Other 6,268 5,496
59,184 97,205
Provision against trade receivables
2009 2008
£’000 £’000
At 1 January 1,296 1,133
Provision for receivables impairment 501 87
Receivables written off during the year as uncollectible (439) (232)
Unused amounts reversed (57) (3)
Unwind of discount (5) (12)
Foreign exchange movement (87) 323
at 31 December 1,209 1,296
Trade receivables include £3,501,000 (2008: £3,691,000) of invoices under a recourse invoice discounting agreement.

www.titaneurope.com Stock code: AIM: TSW.L
65
our business
17643 25/05/10 Proof6
Notes to the Consolidated Financial Statements
www.titaneurope.com Stock code: AIM: TSW.L
65
financial
17643 25/05/10 Proof6
22 heLD foR saLe asseTs
2009 2008
Note £’000 £’000
At 1 January 4,647 —
Transfer in to held for sale assets during the year 16 — 5,060
Impairment during the year (472) (336)
Foreign exchange movement (370) (77)
Disposals (1,336) —
at 31 December 2,469 4,647
Held for sale assets represent the building and plant and machinery of the Varese plant which has been closed as part of the ongoing
restructuring of the Undercarriage division. It is anticipated that the assets will be disposed of within 12 months. The asset is recorded at the
net book value at the date the asset was reclassified to held for sale less subsequent impairment which has been recognised in the income
statement for the year. The impairment amount is included with restructuring and rationalisation costs (note 5).
23 iNveNToRies
2009 2008
£’000 £’000
Raw materials 23,608 36,992
Work in progress 10,803 17,584
Finished goods 50,006 72,548
84,417 127,124
The amount of any write-down reversal recognised as an income in the year was £61,000 (2008: £68,000).
24 Cash aND Cash eQuivaLeNTs
2009 2008
£’000 £’000
Cash at bank and on hand 19,046 34,258
Cash, cash equivalents and bank overdrafts include the following for the purposes of the cash flow statement:
2009 2008
Note £’000 £’000
Cash and cash equivalents 19,046 34,258
Bank overdrafts 29 (24,468) (27,561)
(5,422) 6,697
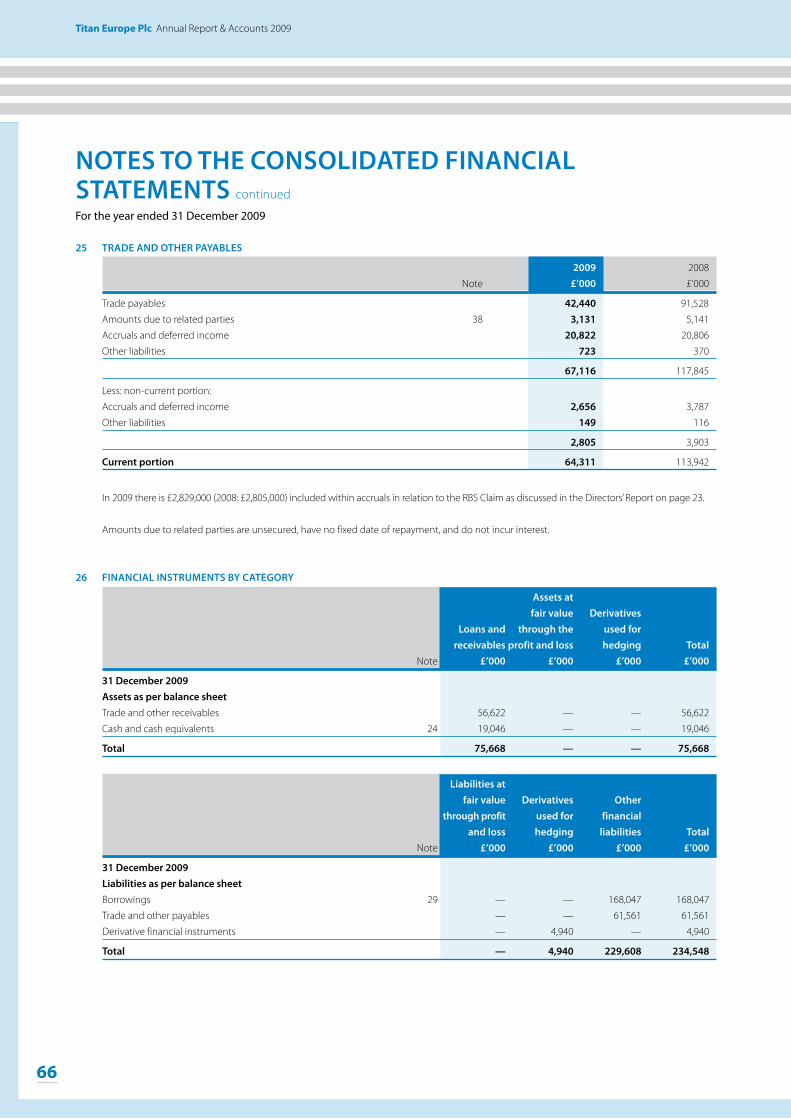
66
titan europe Plc Annual Report & Accounts 2009
17643 25/05/10 Proof6
66
titan europe Plc Annual Report & Accounts 2009
NoTes To The CoNsoLiDaTeD fiNaNCiaL sTaTeMeNTs continued
For the year ended 31 December 2009
17643 25/05/10 Proof6
25 TRaDe aND oTheR paYabLes
2009 2008
Note £’000 £’000
Trade payables 42,440 91,528
Amounts due to related parties 38 3,131 5,141
Accruals and deferred income 20,822 20,806
Other liabilities 723 370
67,116 117,845
Less: non-current portion:
Accruals and deferred income 2,656 3,787
Other liabilities 149 116
2,805 3,903
Current portion 64,311 113,942
In 2009 there is £2,829,000 (2008: £2,805,000) included within accruals in relation to the RBS Claim as discussed in the Directors’ Report on page 23.
Amounts due to related parties are unsecured, have no fixed date of repayment, and do not incur interest.
26 fiNaNCiaL iNsTRuMeNTs bY CaTeGoRY
assets at fair value Derivatives Loans and through the used for receivables profit and loss hedging Total Note £’000 £’000 £’000 £’000
31 December 2009 assets as per balance sheet
Trade and other receivables 56,622 — — 56,622
Cash and cash equivalents 24 19,046 — — 19,046
Total 75,668 — — 75,668
Liabilities at fair value Derivatives other through profit used for financial and loss hedging liabilities Total Note £’000 £’000 £’000 £’000
31 December 2009 Liabilities as per balance sheet
Borrowings 29 — — 168,047 168,047
Trade and other payables — — 61,561 61,561
Derivative financial instruments — 4,940 — 4,940
Total — 4,940 229,608 234,548

www.titaneurope.com Stock code: AIM: TSW.L
67
our business
17643 25/05/10 Proof6
Notes to the Consolidated Financial Statements
www.titaneurope.com Stock code: AIM: TSW.L
67
financial
17643 25/05/10 Proof6
26 fiNaNCiaL iNsTRuMeNTs bY CaTeGoRY (continued)
Assets at
fair value Derivatives
Loans and through the used for
receivables profit and loss hedging Total
Note £’000 £’000 £’000 £’000
31 December 2008 assets as per balance sheet
Trade and other receivables 94,179 — — 94,179
Cash and cash equivalents 24 34,258 — — 34,258
Total 128,437 — — 128,437
Liabilities at
fair value Derivatives Other
through profit used for financial
and loss hedging liabilities Total
Note £’000 £’000 £’000 £’000
31 December 2008
Liabilities as per balance sheet
Borrowings 29 — — 193,083 193,083
Trade and other payables — — 110,768 110,768
Derivative financial instruments — 5,167 — 5,167
Total — 5,167 303,851 309,018
The fair value is considered to approximate to the carrying value as disclosed above.
27 CReDiT QuaLiTY of fiNaNCiaL asseTsA significant proportion of the trade receivables comprise receivables with the major international original equipment manufacturers (OEMs),
in some cases these receivables being also covered by credit insurance. Cash and cash equivalents are held with primarily major non-UK banks.
The carrying amount of financial assets recorded in the financial statements, which is net of impairment losses, represents the Group’s maximum
exposure to credit risk, however against this there is some coverage from credit insurance, but no other collateral or other credit enhancements
are held.
28 DeRivaTive fiNaNCiaL iNsTRuMeNTsDerivative financial instruments which are used for hedging relate to interest rate swaps and forward foreign exchange contracts. The liabilities
at fair value through profit and loss in 2008 relate to forward foreign exchange contracts in the UK to cover the euro to sterling exchange risk on
revenues denominated in euros. For more detail refer to the Currency note in the Directors’ Report. As the UK continues to be exposed to euro
sterling risk on revenues, further simple forward contracts will be entered into as appropriate. These simple forward contracts have been treated
as a cash flow hedge and accounted for as a movement in reserves of £2,809,000 (2008: £2,809,000). There were no contracts outstanding at the
year end.
Derivative financial instruments are the only category of financial assets and financial liabilities held at fair value. For the purposes of IFRS 7 these
are categorised as level 2 fair value measurement.
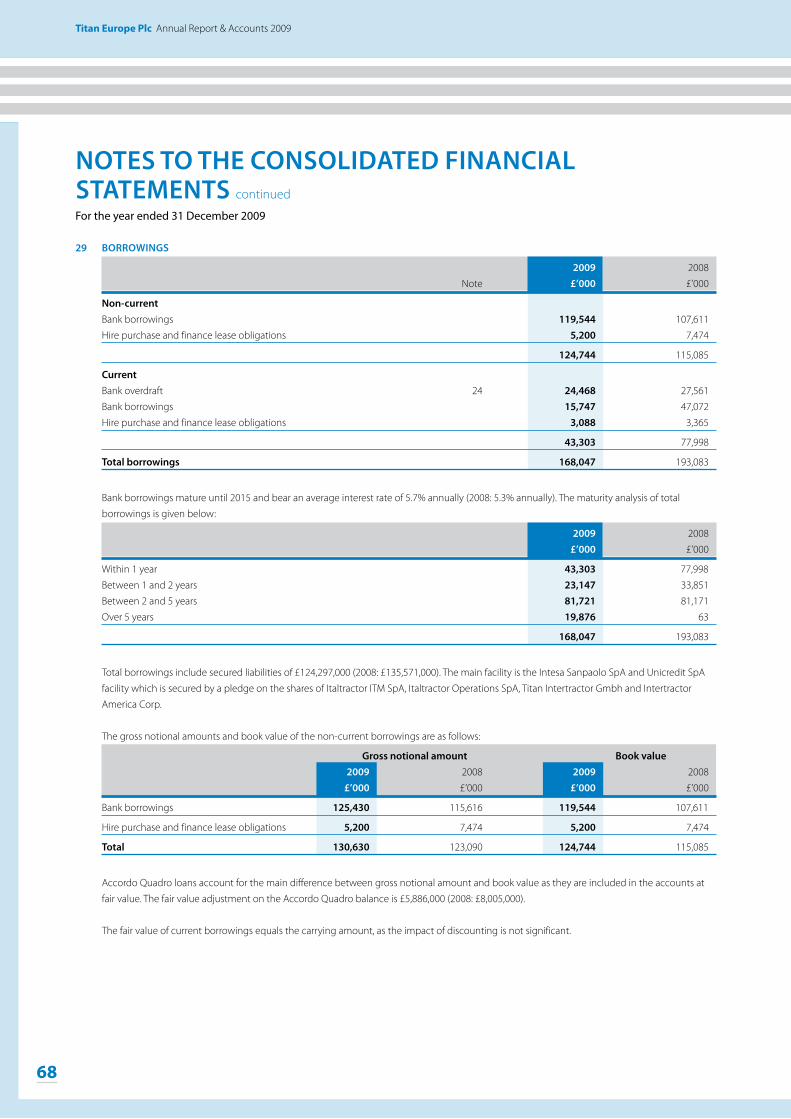
68
titan europe Plc Annual Report & Accounts 2009
17643 25/05/10 Proof6
68
titan europe Plc Annual Report & Accounts 2009
NoTes To The CoNsoLiDaTeD fiNaNCiaL sTaTeMeNTs continued
For the year ended 31 December 2009
17643 25/05/10 Proof6
29 boRRowiNGs
2009 2008
Note £’000 £’000
Non-current
Bank borrowings 119,544 107,611
Hire purchase and finance lease obligations 5,200 7,474
124,744 115,085
Current
Bank overdraft 24 24,468 27,561
Bank borrowings 15,747 47,072
Hire purchase and finance lease obligations 3,088 3,365
43,303 77,998
Total borrowings 168,047 193,083
Bank borrowings mature until 2015 and bear an average interest rate of 5.7% annually (2008: 5.3% annually). The maturity analysis of total
borrowings is given below:
2009 2008
£’000 £’000
Within 1 year 43,303 77,998
Between 1 and 2 years 23,147 33,851
Between 2 and 5 years 81,721 81,171
Over 5 years 19,876 63
168,047 193,083
Total borrowings include secured liabilities of £124,297,000 (2008: £135,571,000). The main facility is the Intesa Sanpaolo SpA and Unicredit SpA
facility which is secured by a pledge on the shares of Italtractor ITM SpA, Italtractor Operations SpA, Titan Intertractor Gmbh and Intertractor
America Corp.
The gross notional amounts and book value of the non-current borrowings are as follows:
Gross notional amount book value 2009 2008 2009 2008
£’000 £’000 £’000 £’000
Bank borrowings 125,430 115,616 119,544 107,611
Hire purchase and finance lease obligations 5,200 7,474 5,200 7,474
Total 130,630 123,090 124,744 115,085
Accordo Quadro loans account for the main difference between gross notional amount and book value as they are included in the accounts at
fair value. The fair value adjustment on the Accordo Quadro balance is £5,886,000 (2008: £8,005,000).
The fair value of current borrowings equals the carrying amount, as the impact of discounting is not significant.
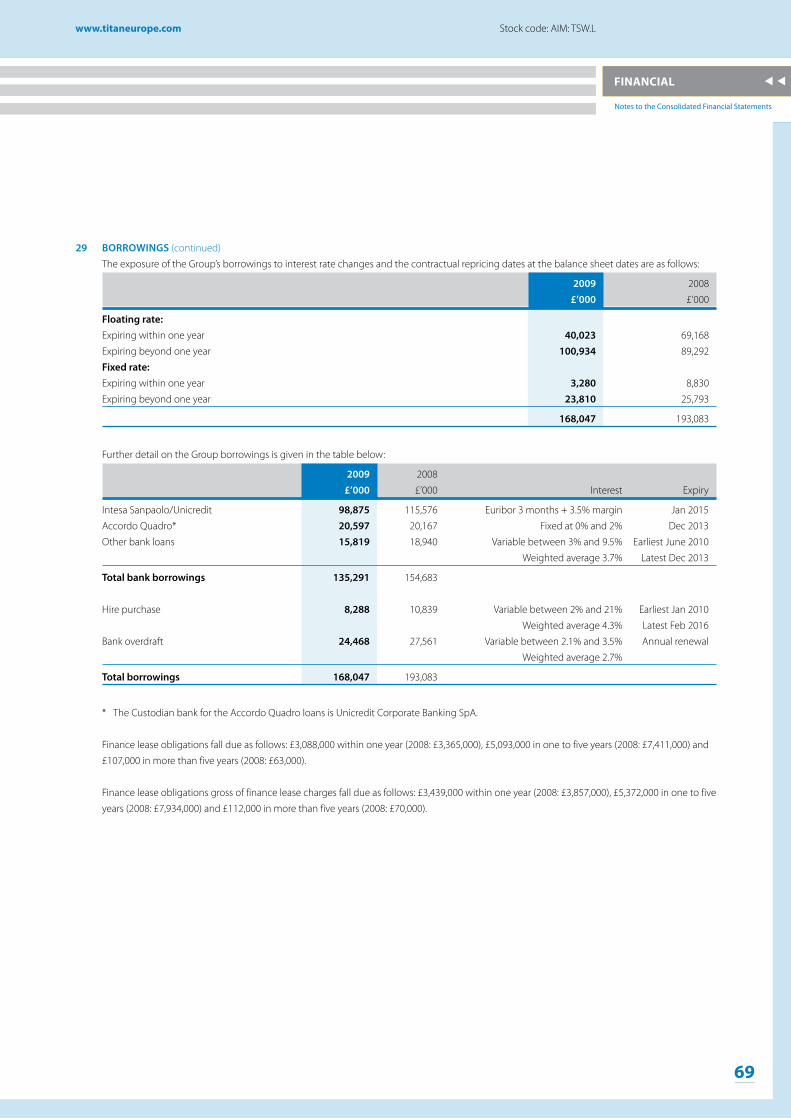
www.titaneurope.com Stock code: AIM: TSW.L
69
our business
17643 25/05/10 Proof6
Notes to the Consolidated Financial Statements
www.titaneurope.com Stock code: AIM: TSW.L
69
financial
17643 25/05/10 Proof6
29 boRRowiNGs (continued)
The exposure of the Group’s borrowings to interest rate changes and the contractual repricing dates at the balance sheet dates are as follows:
2009 2008
£’000 £’000
floating rate:
Expiring within one year 40,023 69,168
Expiring beyond one year 100,934 89,292
fixed rate:
Expiring within one year 3,280 8,830
Expiring beyond one year 23,810 25,793
168,047 193,083
Further detail on the Group borrowings is given in the table below:
2009 2008
£’000 £’000 Interest Expiry
Intesa Sanpaolo/Unicredit 98,875 115,576 Euribor 3 months + 3.5% margin Jan 2015
Accordo Quadro* 20,597 20,167 Fixed at 0% and 2% Dec 2013
Other bank loans 15,819 18,940 Variable between 3% and 9.5% Earliest June 2010
Weighted average 3.7% Latest Dec 2013
Total bank borrowings 135,291 154,683
Hire purchase 8,288 10,839 Variable between 2% and 21% Earliest Jan 2010
Weighted average 4.3% Latest Feb 2016
Bank overdraft 24,468 27,561 Variable between 2.1% and 3.5% Annual renewal
Weighted average 2.7%
Total borrowings 168,047 193,083
* The Custodian bank for the Accordo Quadro loans is Unicredit Corporate Banking SpA.
Finance lease obligations fall due as follows: £3,088,000 within one year (2008: £3,365,000), £5,093,000 in one to five years (2008: £7,411,000) and
£107,000 in more than five years (2008: £63,000).
Finance lease obligations gross of finance lease charges fall due as follows: £3,439,000 within one year (2008: £3,857,000), £5,372,000 in one to five
years (2008: £7,934,000) and £112,000 in more than five years (2008: £70,000).

70
titan europe Plc Annual Report & Accounts 2009
17643 25/05/10 Proof6
70
titan europe Plc Annual Report & Accounts 2009
NoTes To The CoNsoLiDaTeD fiNaNCiaL sTaTeMeNTs continued
For the year ended 31 December 2009
17643 25/05/10 Proof6
29 boRRowiNGs (continued)
The Group’s borrowings are denominated in the following currencies:
2009 2008
£’000 £’000
borrowings
Sterling 5,065 3,058
Euro 129,660 152,500
US dollars 6,291 7,569
Australian dollars 2,267 2,108
Other 296 287
143,579 165,522
bank overdraft
Sterling 10,564 9,193
Euro 13,904 18,368
US dollars — —
Australian dollars — —
Other — —
24,468 27,561
TotalSterling 15,629 12,251
Euro 143,564 170,868
US dollars 6,291 7,569
Australian dollars 2,267 2,108
Other 296 287
168,047 193,083

www.titaneurope.com Stock code: AIM: TSW.L
71
our business
17643 25/05/10 Proof6
Notes to the Consolidated Financial Statements
www.titaneurope.com Stock code: AIM: TSW.L
71
financial
17643 25/05/10 Proof6
30 DefeRReD iNCoMe Tax
2009 2008
£’000 £’000
Deferred tax assets:
— deferred tax assets to be recovered after more than 12 months 30,356 14,804
— deferred tax assets to be recovered within 12 months 6,500 16,944
36,856 31,748
Deferred tax liabilities:
— deferred tax liabilities to be recovered after more than 12 months (19,085) (16,633)
— deferred tax liabilities to be recovered within 12 months (989) (2,711)
(20,074) (19,344)
Deferred tax assets (net) 16,782 12,404
assets Liabilities Net 2009 2008 2009 2008 2009 2008
£’000 £’000 £’000 £’000 £’000 £’000
Property, plant and equipment 13,303 12,629 (15,504) (15,281) (2,201) (2,652)
Intangible assets 24 41 (11) (18) 13 23
Inventory 805 1,919 — — 805 1,919
Interest-bearing loans and borrowings 1,704 813 (1,648) (2,242) 56 (1,429)
Employee benefits 292 212 (283) (327) 9 (115)
Deferred government grants 108 117 — — 108 117
Provisions 2,826 1,413 (372) (404) 2,454 1,009
Tax value of loss carry-forwards 15,884 13,175 — — 15,884 13,175
Other 1,910 1,429 (2,256) (1,072) (346) 357
36,856 31,748 (20,074) (19,344) 16,782 12,404
at 31 at 1 January Recognised Recognised exchange December 2009 in equity in equity differences 2009 £’000 £’000 £’000 £’000 £’000
Property, plant and equipment 2,652 (886) — 435 2,201Intangible assets (23) 8 — 2 (13)Inventory (1,919) 1,037 — 77 (805)Interest-bearing loans and borrowings 1,429 (1,010) (509) 34 (56)Employee benefits 115 (90) (25) (9) (9)Deferred government grants (117) — — 9 (108)Provisions (1,009) (1,424) — (21) (2,454)Tax value of loss carry-forwards (13,175) (3,201) — 492 (15,884)Other (357) (245) 786 162 346
(12,404) (5,811) 252 1,181 (16,782)

72
titan europe Plc Annual Report & Accounts 2009
17643 25/05/10 Proof6
72
titan europe Plc Annual Report & Accounts 2009
NoTes To The CoNsoLiDaTeD fiNaNCiaL sTaTeMeNTs continued
For the year ended 31 December 2009
17643 25/05/10 Proof6
30 DefeRReD iNCoMe Tax (continued)
At 31
At 1 January Recognised Recognised Exchange December
2008 in equity in equity differences 2008
£’000 £’000 £’000 £’000 £’000
Property, plant and equipment 2,403 584 — (335) 2,652
Intangible assets (30) 13 — (6) (23)
Inventory (1,174) (295) — (450) (1,919)
Interest-bearing loans and borrowings 1,916 228 (613) (102) 1,429
Employee benefits 409 (204) (141) 51 115
Deferred government grants (89) — — (28) (117)
Provisions (1,447) 689 16 (267) (1,009)
Tax value of loss carry-forwards (10,862) 509 — (2,822) (13,175)
Other 1,253 (877) (803) 70 (357)
(7,621) 647 (1,541) (3,889) (12,404)
Deferred income tax assets are recognised for tax loss carry-forwards to the extent that the realisation of the related tax benefit through future
taxable profits is probable.
Deferred taxation assets and liabilities that are unrecognised/unprovided comprise:
assets Liabilities Net 2009 2008 2009 2008 2009 2008
£’000 £’000 £’000 £’000 £’000 £’000
Deductible temporary differences 45 255 — — 45 255
Unrelieved tax losses 9,350 4,699 — — 9,350 4,699
9,395 4,954 — — 9,395 4,954
No asset has been recognised in respect of £9,350,000 (2008: £4,699,000) due to the unpredictability of future profit streams. Unrecognised tax
losses expire between 2010 and 2014. Other losses may be carried forward indefinitely.
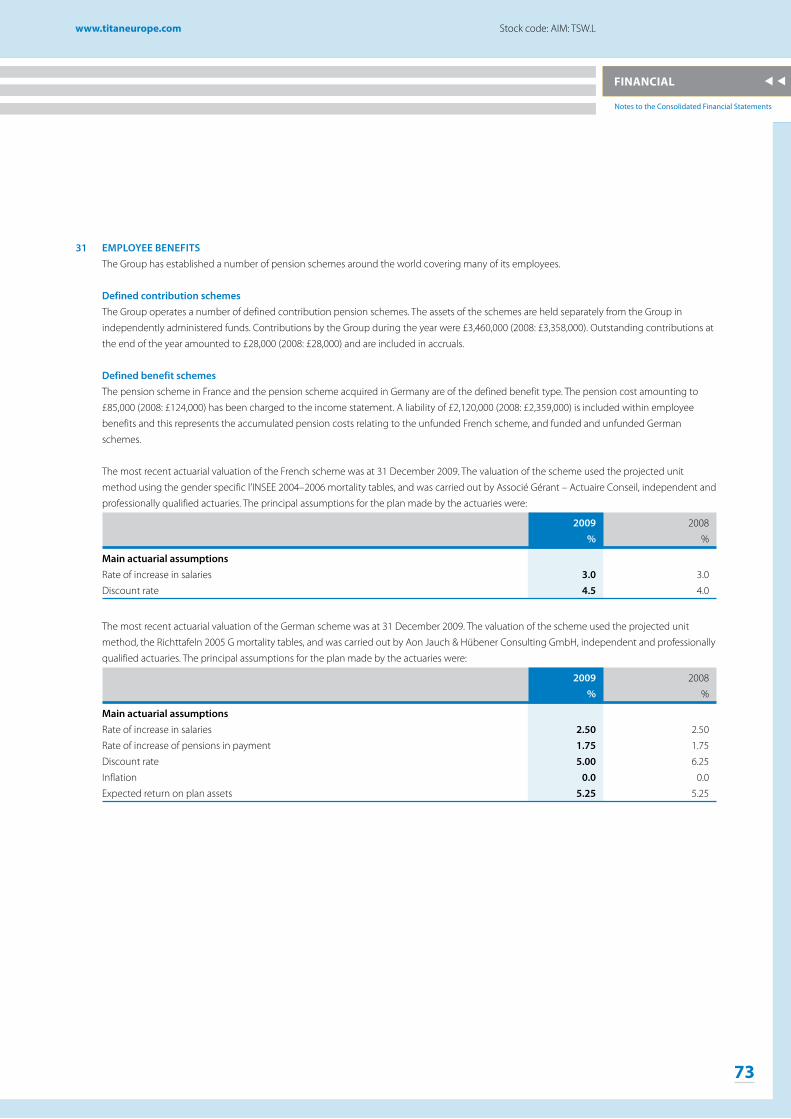
www.titaneurope.com Stock code: AIM: TSW.L
73
our business
17643 25/05/10 Proof6
Notes to the Consolidated Financial Statements
www.titaneurope.com Stock code: AIM: TSW.L
73
financial
17643 25/05/10 Proof6
31 eMpLoYee beNefiTsThe Group has established a number of pension schemes around the world covering many of its employees.
Defined contribution schemesThe Group operates a number of defined contribution pension schemes. The assets of the schemes are held separately from the Group in
independently administered funds. Contributions by the Group during the year were £3,460,000 (2008: £3,358,000). Outstanding contributions at
the end of the year amounted to £28,000 (2008: £28,000) and are included in accruals.
Defined benefit schemesThe pension scheme in France and the pension scheme acquired in Germany are of the defined benefit type. The pension cost amounting to
£85,000 (2008: £124,000) has been charged to the income statement. A liability of £2,120,000 (2008: £2,359,000) is included within employee
benefits and this represents the accumulated pension costs relating to the unfunded French scheme, and funded and unfunded German
schemes.
The most recent actuarial valuation of the French scheme was at 31 December 2009. The valuation of the scheme used the projected unit
method using the gender specific l’INSEE 2004–2006 mortality tables, and was carried out by Associé Gérant – Actuaire Conseil, independent and
professionally qualified actuaries. The principal assumptions for the plan made by the actuaries were:
2009 2008
% %
Main actuarial assumptions
Rate of increase in salaries 3.0 3.0
Discount rate 4.5 4.0
The most recent actuarial valuation of the German scheme was at 31 December 2009. The valuation of the scheme used the projected unit
method, the Richttafeln 2005 G mortality tables, and was carried out by Aon Jauch & Hübener Consulting GmbH, independent and professionally
qualified actuaries. The principal assumptions for the plan made by the actuaries were:
2009 2008
% %
Main actuarial assumptions
Rate of increase in salaries 2.50 2.50
Rate of increase of pensions in payment 1.75 1.75
Discount rate 5.00 6.25
Inflation 0.0 0.0
Expected return on plan assets 5.25 5.25

74
titan europe Plc Annual Report & Accounts 2009
17643 25/05/10 Proof6
74
titan europe Plc Annual Report & Accounts 2009
NoTes To The CoNsoLiDaTeD fiNaNCiaL sTaTeMeNTs continued
For the year ended 31 December 2009
17643 25/05/10 Proof6
31 eMpLoYee beNefiTs (continued)
other post-retirement benefits schemeThe Trattamento di fine Rapporto (“TFR”) scheme in Italy relates to an accrued benefit that is paid when an employee leaves the Company. The
pension cost amounting to £nil (2008: £nil) has been charged to the income statement. A liability of £11,006,000 (2008: £13,331,000) is included
within employee benefits and this represents the accumulated pension costs relating to the unfunded Italian scheme.
The most recent actuarial valuation of the Italian scheme was at 31 December 2009. The valuation used the projected unit method, the RG48
mortality tables, and was carried out by Managers & Partners S.p.A., independent and professionally qualified actuaries. The principal assumptions
for the plan made by the actuaries were:
2009 2008
% %
Main actuarial assumptions
Rate of increase in salaries n/a n/a
Rate of increase of pensions in payment 3.0 3.9
Discount rate 4.0 4.6
Inflation 2.0 3.2
other long-term employee benefits schemeThe pension scheme in Australia relates to a long service leave provision. The pension cost amounting to £52,000 (2008: £35,000) has been
charged to the income statement. A liability of £252,000 (2008: £244,000) is included within employee benefits and this represents the
accumulated pension costs relating to the unfunded Australian scheme.
The valuation was carried out by AON Consulting Pty Ltd, independent and professionally qualified actuaries. The principal assumptions for the
plan made by the actuaries were:
2009 2008
% %
Main actuarial assumptions
Rate of increase in salaries 4.0 4.0
Discount rate 6.5 5.5
Total employee benefits
2009 2008
£’000 £’000
balance sheet
Present value of funded obligation 2,416 2,456
Fair value of plan assets (1,131) (1,182)
1,285 1,274
Present value of unfunded obligations 12,093 14,660
Liability in the balance sheet 13,378 15,934
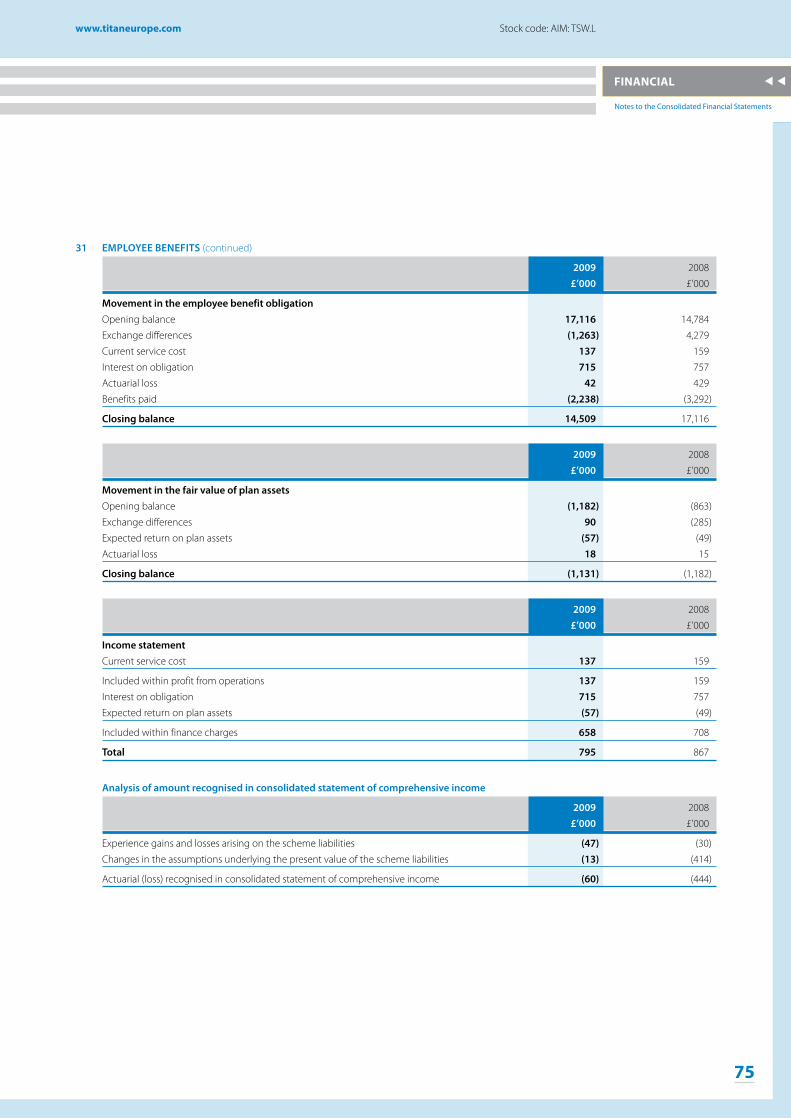
www.titaneurope.com Stock code: AIM: TSW.L
75
our business
17643 25/05/10 Proof6
Notes to the Consolidated Financial Statements
www.titaneurope.com Stock code: AIM: TSW.L
75
financial
17643 25/05/10 Proof6
31 eMpLoYee beNefiTs (continued)
2009 2008
£’000 £’000
Movement in the employee benefit obligation Opening balance 17,116 14,784
Exchange differences (1,263) 4,279
Current service cost 137 159
Interest on obligation 715 757
Actuarial loss 42 429
Benefits paid (2,238) (3,292)
Closing balance 14,509 17,116
2009 2008
£’000 £’000
Movement in the fair value of plan assets Opening balance (1,182) (863)
Exchange differences 90 (285)
Expected return on plan assets (57) (49)
Actuarial loss 18 15
Closing balance (1,131) (1,182)
2009 2008
£’000 £’000
income statement
Current service cost 137 159
Included within profit from operations 137 159
Interest on obligation 715 757
Expected return on plan assets (57) (49)
Included within finance charges 658 708
Total 795 867
analysis of amount recognised in consolidated statement of comprehensive income
2009 2008
£’000 £’000
Experience gains and losses arising on the scheme liabilities (47) (30)
Changes in the assumptions underlying the present value of the scheme liabilities (13) (414)
Actuarial (loss) recognised in consolidated statement of comprehensive income (60) (444)

76
titan europe Plc Annual Report & Accounts 2009
17643 25/05/10 Proof6
76
titan europe Plc Annual Report & Accounts 2009
NoTes To The CoNsoLiDaTeD fiNaNCiaL sTaTeMeNTs continued
For the year ended 31 December 2009
17643 25/05/10 Proof6
31 eMpLoYee beNefiTs (continued)
history of experience gains and losses
2009 2008 2007 2006
£’000 £’000 £’000 £’000
experience gains and losses arising on the scheme liabilities:Amount (47) (30) 25 106
Percentage of the present value of the
scheme liabilities (0.3%) (0.2%) 0.2% 0.6%
Present value of scheme liabilities (14,509) (17,116) (14,784) (16,489)
Fair value of scheme assets 1,131 1,182 863 142
Employee benefit liability (13,378) (15,934) (13,921) (16,347)
The actual return on plan assets was a loss of £39,000 (2008: loss £34,000)
The estimated amount of contributions expected to be paid to the scheme during the current financial year is £nil (2008: £nil).
32 pRovisioNs
warranty other Total £’000 £’000 £’000
At 1 January 2009 2,531 989 3,520
Charged/(credited) to the income statement:
— Additional provisions 265 133 398
— Unused amounts reversed — (41) (41)
Used during the year (648) (185) (833)
Exchange differences (177) 63 (114)
at 31 December 2009 1,971 959 2,930
Other provisions mainly relate to potential tax liabilities for which the outcome is uncertain. It is expected that this provision will be utilised in
the next two to five years. The warranty provision represents management’s best estimate of the Group’s liabilities under warranties granted on
undercarriage products. The timing of the utilisation of this provision is uncertain but it is expected to be used within the next two years.
warranty other Total £’000 £’000 £’000
Within 1 year 1,774 338 2,112
Between 1 and 2 years 197 98 295
Between 2 and 5 years — 523 523
Over 5 years — — —
at 31 December 2009 1,971 959 2,930

www.titaneurope.com Stock code: AIM: TSW.L
77
our business
17643 25/05/10 Proof6
Notes to the Consolidated Financial Statements
www.titaneurope.com Stock code: AIM: TSW.L
77
financial
17643 25/05/10 Proof6
33 issueD shaRe CapiTaLAuthorised:
Number of 40 pence shares ordinary shares (thousands) £’000
At 1 January 2009 125,000 50,000
Increase in authorised share capital 25,000 10,000
at 31 December 2009 150,000 60,000
Allotted, called up and fully paid:
Number of 40 pence shares ordinary shares (thousands) £’000
At 1 January 2009 and at 31 December 2009 82,981 33,192
34 shaRe-baseD paYMeNTsDuring the year share options were cancelled that were granted under the Unapproved Share Option Scheme (USOS) in 2004 and 2005.
New share options have been granted under the Unapproved Share Option Scheme (‘USOS’) 2004. These new share options have been treated
as a modification of the original options. Under this scheme, the Company can grant options over shares to employees in the Group. Options
were granted with a fixed exercise price equal to the nominal price of the shares under option at the date of the grant. The contractual life of
an option is 10 years. Awards under the USOS are generally reserved for employees at senior management level and above. Options granted
under the USOS are exercisable on or after the third anniversary of the date of grant. Exercise of an option is subject to continued employment.
The share options can only be exercised once the Group achieves a leverage ratio of 3.5:1 or less. Options were valued using the Black–Scholes
option-pricing model. The fair value per option granted and the assumptions used in the calculation are as follows:
Grant
Grant date 01/06/09
Share price at grant date 0.335
Exercise price 0.40
Number of employees 10
Shares under option 3,890,000
Vesting period (years) 3
Expected volatility 105.7%
Option life (years) 10
Expected life (years) 6.5
Risk free rate 2.64%
Expected dividends expressed as a dividend yield 2.18%
Fair value per option £0.23
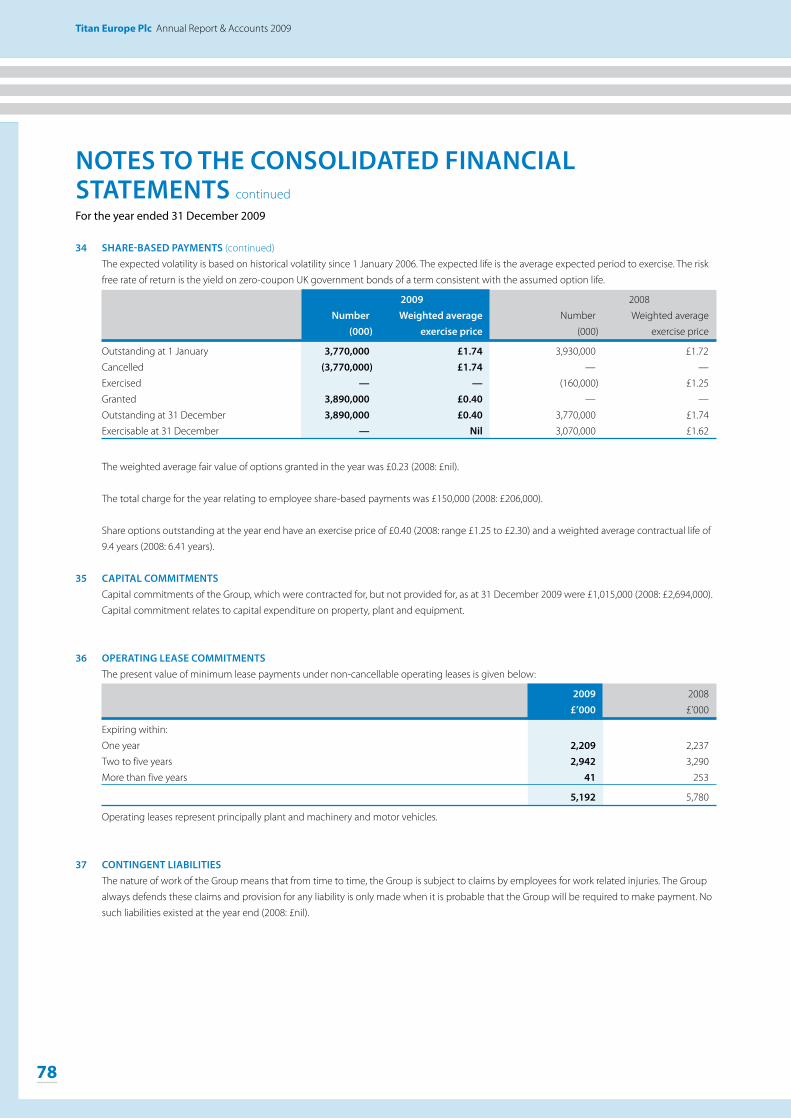
78
titan europe Plc Annual Report & Accounts 2009
17643 25/05/10 Proof6
78
titan europe Plc Annual Report & Accounts 2009
NoTes To The CoNsoLiDaTeD fiNaNCiaL sTaTeMeNTs continued
For the year ended 31 December 2009
17643 25/05/10 Proof6
34 shaRe-baseD paYMeNTs (continued)
The expected volatility is based on historical volatility since 1 January 2006. The expected life is the average expected period to exercise. The risk
free rate of return is the yield on zero-coupon UK government bonds of a term consistent with the assumed option life.
2009 2008
Number weighted average Number Weighted average
(000) exercise price (000) exercise price
Outstanding at 1 January 3,770,000 £1.74 3,930,000 £1.72
Cancelled (3,770,000) £1.74 — —
Exercised — — (160,000) £1.25
Granted 3,890,000 £0.40 — —
Outstanding at 31 December 3,890,000 £0.40 3,770,000 £1.74
Exercisable at 31 December — Nil 3,070,000 £1.62
The weighted average fair value of options granted in the year was £0.23 (2008: £nil).
The total charge for the year relating to employee share-based payments was £150,000 (2008: £206,000).
Share options outstanding at the year end have an exercise price of £0.40 (2008: range £1.25 to £2.30) and a weighted average contractual life of
9.4 years (2008: 6.41 years).
35 CapiTaL CoMMiTMeNTsCapital commitments of the Group, which were contracted for, but not provided for, as at 31 December 2009 were £1,015,000 (2008: £2,694,000).
Capital commitment relates to capital expenditure on property, plant and equipment.
36 opeRaTiNG Lease CoMMiTMeNTsThe present value of minimum lease payments under non-cancellable operating leases is given below:
2009 2008
£’000 £’000
Expiring within:
One year 2,209 2,237
Two to five years 2,942 3,290
More than five years 41 253
5,192 5,780
Operating leases represent principally plant and machinery and motor vehicles.
37 CoNTiNGeNT LiabiLiTiesThe nature of work of the Group means that from time to time, the Group is subject to claims by employees for work related injuries. The Group
always defends these claims and provision for any liability is only made when it is probable that the Group will be required to make payment. No
such liabilities existed at the year end (2008: £nil).

www.titaneurope.com Stock code: AIM: TSW.L
79
our business
17643 25/05/10 Proof6
Notes to the Consolidated Financial Statements
www.titaneurope.com Stock code: AIM: TSW.L
79
financial
17643 25/05/10 Proof6
38 ReLaTeD paRTY TRaNsaCTioNsDuring the year the Group companies entered into the following transactions with related parties:
2009 2008
£’000 £’000
sales of goods:
— Titan International Inc related companies — 84
— Associate 13 —
— Joint venture 65 303
78 387
purchases of goods:
— Titan International Inc related companies (5,008) (9,843)
— Associate (303) (413)
— Joint venture (2,797) (4,814)
(8,108) (15,070)
Year end balances arising from sales/purchases of goods
2009 2008
Note £’000 £’000
Receivables from related parties:
— Titan International Inc related companies 2 —
— Associate — —
— Joint venture 201 753
21 203 753
payables to related parties:
— Titan International Inc related companies (1,777) (2,975)
— Associate (233) (71)
— Joint venture (1,121) (2,095)
25 (3,131) (5,141)
Year end balances arising from loans receivable/payable
2009 2008
Note £’000 £’000
Loans receivable from related parties:
Beginning of the year 243 184
Loan repayments received (225) —
Foreign exchange (18) 59
21 — 243

80
titan europe Plc Annual Report & Accounts 2009
17643 25/05/10 Proof6
80
titan europe Plc Annual Report & Accounts 2009
NoTes To The CoNsoLiDaTeD fiNaNCiaL sTaTeMeNTs continued
For the year ended 31 December 2009
17643 25/05/10 Proof6
38 ReLaTeD paRTY TRaNsaCTioNs (continued)
Remuneration of key management personnelKey management personnel includes executive directors whose remuneration is detailed in note 14, Company managing directors and key
operational directors.
2009 2008
Note £’000 £’000
Short-term employee benefits 3,219 2,752
Post-employment benefits 901 656
Share-based payments 150 206
4,270 3,614
39 eveNTs afTeR The baLaNCe sheeT DaTeamendment of banking facilitiesDue to the significant impact on the 2009 results as a result of the global downturn, the Group has negotiated an amendment to the covenants
which includes no testing until the June 2011 results and revised covenants based on the Group’s revised business plans. This does not affect the
capital repayment profile as renegotiated in May 2009.

www.titaneurope.com Stock code: AIM: TSW.L
81
our business
17643 25/05/10 Proof6
www.titaneurope.com Stock code: AIM: TSW.L
81
financial
17643 25/05/10 Proof6
Notes to the Consolidated Financial StatementsIndependent Auditors’ Report
We have audited the Parent Company financial statements of Titan Europe Plc for the year ended 31 December 2009 which comprise the Company balance sheet, the Movement in Shareholders’ Funds and the related notes. The financial reporting framework that has been applied in their preparation is applicable law and United Kingdom Accounting Standards (United Kingdom Generally Accepted Accounting Practice).
RespeCTive RespoNsibiLiTies of DiReCToRs aND auDiToRs
As explained more fully in the Directors’ Responsibilities Statement, the directors are responsible for the preparation of the Parent Company financial statements and for being satisfied that they give a true and fair view. Our responsibility is to audit the financial statements in accordance with applicable law and International Standards on Auditing (UK and Ireland). Those standards require us to comply with the Auditing Practices Board’s Ethical Standards for Auditors.
This report, including the opinions, has been prepared for and only for the Company’s members as a body in accordance with Chapter 3 of Part 16 of the Companies Act 2006 and for no other purpose. We do not, in giving these opinions, accept or assume responsibility for any other purpose or to any other person to whom this report is shown or into whose hands it may come save where expressly agreed by our prior consent in writing.
sCope of The auDiT of The fiNaNCiaL sTaTeMeNTs
An audit involves obtaining evidence about the amounts and disclosures in the financial statements sufficient to give reasonable assurance that the financial statements are free from material misstatement, whether caused by fraud or error. This includes an assessment of: whether the accounting policies are appropriate to the Parent Company’s circumstances and have been consistently applied and adequately disclosed; the reasonableness of significant accounting estimates made by the directors; and the overall presentation of the financial statements.
opiNioN oN fiNaNCiaL sTaTeMeNTs
In our opinion the Parent Company financial statements:
●● give a true and fair view of the state of the Company’s affairs as at 31 December 2009;
●● have been properly prepared in accordance with United Kingdom Generally Accepted Accounting Practice; and
●● have been prepared in accordance with the requirements of the Companies Act 2006.
opiNioN oN oTheR MaTTeR pResCRibeD bY The CoMpaNies aCT 2006
In our opinion the information given in the Directors’ Report for the financial year for which the Parent Company financial statements are prepared is consistent with the Parent Company financial statements.
MaTTeRs oN whiCh we aRe ReQuiReD To RepoRT bY exCepTioN
We have nothing to report in respect of the following matters where the Companies Act 2006 requires us to report to you if, in our opinion:
●● adequate accounting records have not been kept by the Parent Company, or returns adequate for our audit have not been received from branches not visited by us; or
●● the Parent Company financial statements are not in agreement with the accounting records and returns; or
●● certain disclosures of directors’ remuneration specified by law are not made; or
●● we have not received all the information and explanations we require for our audit.
oTheR MaTTeR
We have reported separately on the Group financial statements of Titan Europe Plc for the year ended 31 December 2009.
andrew hammond (Senior Statutory Auditor)for and on behalf of PricewaterhouseCoopers LLPChartered Accountants and Registered AuditorsBirmingham7 June 2010
(a) The maintenance and integrity of the Titan Europe Plc website is the responsibility of the directors; the work carried out by the auditors does not involve consideration of these matters and, accordingly, the auditors accept no responsibility for any changes that may have occurred to the financial statements since they were initially presented on the website.
(b) Legislation in the United Kingdom governing the preparation and dissemination of financial statements and Regulatory financial statements may differ from legislation in other jurisdictions.
iNDepeNDeNT auDiToRs’ RepoRT To The MeMbeRs of TiTaN euRope plc

82
titan europe Plc Annual Report & Accounts 2009
17643 25/05/10 Proof6
82
titan europe Plc Annual Report & Accounts 2009
NoTes To The CoNsoLiDaTeD fiNaNCiaL sTaTeMeNTs continued
For the year ended 31 December 2009
17643 25/05/10 Proof6
8282
2009 2008
Note £’000 £’000
fixed assets
Intangible assets 3 1,253 1,449
Tangible assets 4 76 101
Investments 5 109,585 109,537
Total fixed assets 110,914 111,087
Current assets
Debtors (including £55,653,000 (2008: £55,985,000) due after more than one year) 6 64,237 61,755
Cash at bank and in hand 39 760
64,276 62,515
Creditors: amounts falling due within one year 7 (16,817) (11,655)
Net current assets 47,459 50,860
Total assets less current liabilities 158,373 161,947
Creditors: amounts falling due after more than one year 8 (24,326) (29,993)
Net assets 134,047 131,954
Capital and reserves
Called up share capital 11 33,192 33,192
Share premium account 12 77,248 77,248
Other reserves 12 6,458 6,458
Retained earnings 12 17,149 15,056
Total shareholders’ funds 134,047 131,954
The financial statements on pages 82 to 90 were approved by the Board of directors on 7 June 2010 and were signed on its behalf by:
J M a akers G ChestertonDirector Director
CoMpaNY baLaNCe sheeTAs at 31 December 2009
17643 25/05/10 Proof6
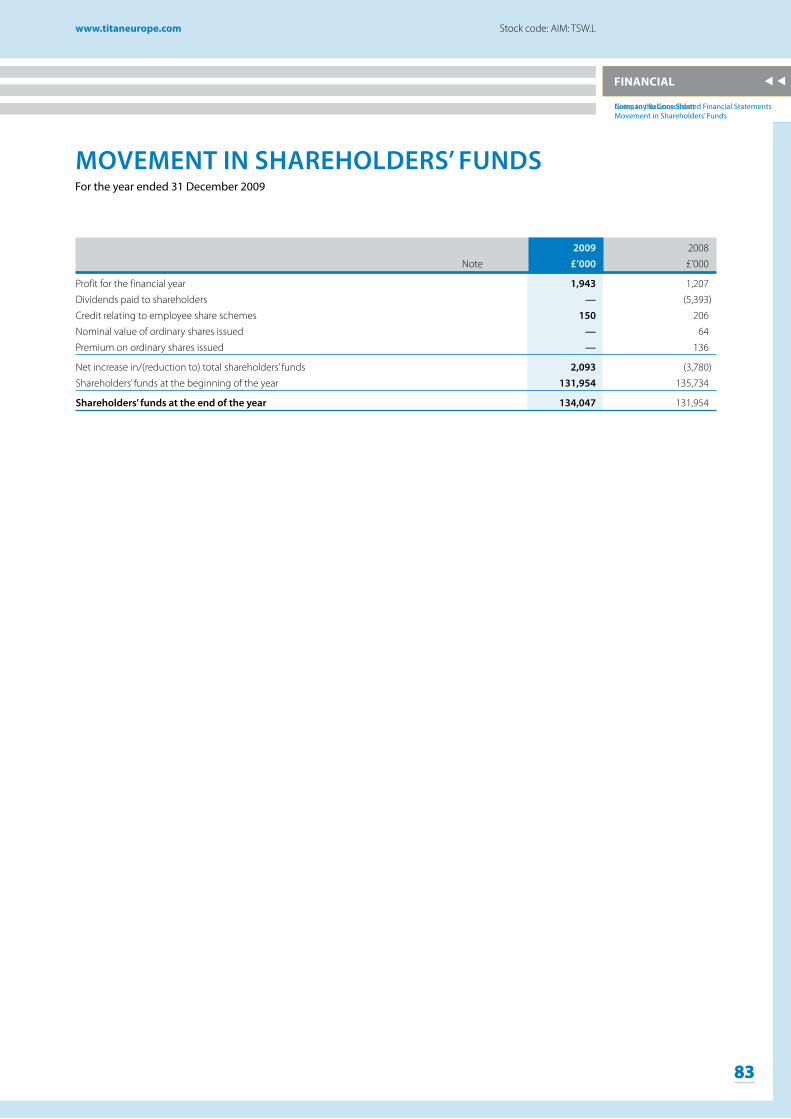
www.titaneurope.com Stock code: AIM: TSW.L
83
our business
17643 25/05/10 Proof6
Notes to the Consolidated Financial Statements
www.titaneurope.com Stock code: AIM: TSW.L
83
financial
17643 25/05/10 Proof6
8383
Company Balance SheetMovement in Shareholders’ Funds
2009 2008
Note £’000 £’000
Profit for the financial year 1,943 1,207
Dividends paid to shareholders — (5,393)
Credit relating to employee share schemes 150 206
Nominal value of ordinary shares issued — 64
Premium on ordinary shares issued — 136
Net increase in/(reduction to) total shareholders’ funds 2,093 (3,780)
Shareholders’ funds at the beginning of the year 131,954 135,734
shareholders’ funds at the end of the year 134,047 131,954
MoveMeNT iN shaRehoLDeRs’ fuNDsFor the year ended 31 December 2009
17643 25/05/10 Proof6

84
titan europe Plc Annual Report & Accounts 2009
17643 25/05/10 Proof6
84
titan europe Plc Annual Report & Accounts 2009
17643 25/05/10 Proof6
1 pRiNCipaL aCCouNTiNG poLiCies of The CoMpaNYa) accounting principlesThe Company Balance Sheet has been prepared under the historical cost convention and in accordance with the Companies Act 2006 and applicable
UK accounting standards which have been consistently applied. The Company Balance sheet has been prepared on a going concern basis.
b) basis of preparationAs permitted by Section 408(1) of the Companies Act 2006, a separate Profit and Loss account has not been presented for the Company. The
profit after taxation dealt with in the accounts of the Company was £1,943,000 (2008: £1,207,000).
c) hire purchase and leasingAssets held under hire purchase agreements and finance leases, being those which transfer substantially all the risks and rewards of ownership
of the asset to the Company, are capitalised and the capital element of future repayments is included within creditors. Rentals payable are
apportioned between the finance element, which is charged to the profit and loss account, and the capital element which reduces the
outstanding obligation for future instalments using the inherent rate of interest within the contract. The assets are depreciated over the shorter
of the useful economic life and the lease term.
Rentals payable under operating leases are charged to the profit and loss account on a straight-line basis over the lease period.
d) investmentsInvestments held as fixed assets are stated at cost and subject to impairment reviews per FRS 11.
e) Cash flow statementAs the ultimate holding company of the Titan Europe Plc Group, the Company has relied upon the exemption in FRS 1 (Revised 1996) not to
present a cash flow statement as part of its financial statements.
f) DividendsDividends are recognised in the year in which they are paid or received.
g) interest-bearing borrowingsInterest-bearing borrowings are recognised initially at the net proceeds amount less attributable transaction costs per FRS 4. Subsequent to initial
recognition, interest-bearing borrowings are stated at amortised cost with any difference between cost and redemption value being recognised
in the profit and loss account over the period of the borrowings on an effective interest basis.
h) Related party transactionsUnder FRS 8, the Company has relied upon the exemption not to disclose related party transactions with other Group undertakings as they are
all included in the Titan Europe Plc consolidated financial statements.
i) employee benefits Defined contribution schemes
Obligations for contributions to defined contribution pension schemes are recognised as an expense in the profit and loss account as incurred.
j) share-based payment transactionsThe equity-settled share option programme allows Company employees to acquire shares of the ultimate Parent Company; these awards
are granted by the ultimate Parent. The fair value of options granted is recognised as an employee expense with a corresponding increase in
equity. The fair value is measured at grant date and spread over the period during which the employees become unconditionally entitled to
the options. The fair value of all the options granted are measured using the Black–Scholes option pricing model, taking into account the terms
and conditions upon which the options were granted. The amount recognised as an expense is adjusted to reflect the actual number of share
options that vest except where forfeiture is due only to share prices not achieving the threshold for vesting.
Share options made available to employees of the Company’s subsidiaries are treated as increases in equity over the vesting period of the award,
with a corresponding increase in the Company’s investments in subsidiaries, based on an estimate of the number of shares that will eventually vest.
NoTes To The CoMpaNY fiNaNCiaL sTaTeMeNTs For the year ended 31 December 2009

www.titaneurope.com Stock code: AIM: TSW.L
85
our business
17643 25/05/10 Proof6
www.titaneurope.com Stock code: AIM: TSW.L
85
financial
17643 25/05/10 Proof6
Notes to the Company Financial Statements
1 pRiNCipaL aCCouNTiNG poLiCies of The CoMpaNY (continued)
k) intangible assetsIntangible assets are included at cost less any impairment and are amortised to their residual values over their useful economic life of between 3
and 15 years.
l) Tangible assetsTangible assets are stated at cost less depreciation.
Depreciation is provided on a straight-line basis so as to write off the cost less residual value of tangible fixed assets over the period of their
remaining estimated useful lives as follows:
— Plant and machinery (motor vehicles) 2–4 years
— Fixtures and fittings 3–5 years
m) TaxationCorporation tax is charged based on assessable profits arising in the tax jurisdiction of the Company.
Deferred taxation is recognised in respect of all timing differences that have originated but not reversed at the balance sheet date where
transactions or events that result in an obligation to pay more tax or a right to pay less tax in the future have occurred. Timing differences are
differences between the Company’s taxable profits and its results as stated in the financial statements. Deferred taxation assets are recognised
where, in the opinion of the directors, it is more likely than not that these amounts will be realised in future years.
Deferred taxation is measured at the tax rates that are expected to apply in the years in which the timing differences are expected to reverse,
based on tax rates and laws that have been enacted or substantively enacted by the balance sheet date. Deferred tax is measured on a
non-discounted basis.
n) foreign currency transactionsTransactions in foreign currency are translated at exchange rates approximating to the rate ruling at the date of the transaction. Monetary assets
and liabilities denominated in foreign currencies at the balance sheet date are translated at the foreign exchange rate ruling at that date. Foreign
exchange differences are recognised in the income statement.
2 DiReCToRs aND eMpLoYeesThe aggregate payroll costs including the executive directors were as follows:
2009 2008
£’000 £’000
Wages and salaries 962 1,198
Social security costs 100 138
Pension costs — defined contribution plan 324 363
Share-based payments 102 137
1,488 1,836
For directors’ emoluments information refer to note 14 of the notes to the Group financial statements.
The average monthly number of people employed by the Company including executive directors and the areas of the business where these
people work are as follows:
2009 2008
Number Number
Administration 8 12

86
titan europe Plc Annual Report & Accounts 2009
17643 25/05/10 Proof6
86
titan europe Plc Annual Report & Accounts 2009
17643 25/05/10 Proof6
3 iNTaNGibLe asseTs
Licences and patents £’000
Cost At 1 January 2009 1,942
Disposals (109)
at 31 December 2009 1,833
amortisation
At 1 January 2009 493
Charge for the year 155
Disposals (68)
at 31 December 2009 580
Net book value at 31 December 2009 1,253
At 31 December 2008 1,449
4 TaNGibLe asseTs
plant and fixtures and machinery fittings Total £’000 £’000 £’000
Cost
At 1 January 2009 100 72 172
Additions 11 — 11
Disposals — (18) (18)
at 31 December 2009 111 54 165
Depreciation
At 1 January 2009 33 38 71
Charge for the year 19 11 30
Disposals — (12) (12)
at 31 December 2009 52 37 89
Net book value at 31 December 2009 59 17 76
At 31 December 2008 67 34 101
Included in tangible assets are plant and machinery held under finance leases. The net book value of these assets at 31 December 2009 was
£49,500 (2008: £66,800).The depreciation charge in respect of finance leases was £17,000 (2008: £17,000).
NoTes To The CoMpaNY fiNaNCiaL sTaTeMeNTs continued
For the year ended 31 December 2009

www.titaneurope.com Stock code: AIM: TSW.L
87
our business
17643 25/05/10 Proof6
www.titaneurope.com Stock code: AIM: TSW.L
87
financial
17643 25/05/10 Proof6
Notes to the Company Financial Statements
5 iNvesTMeNTsfixed asset investments
shares in shares in subsidiary associated undertakings undertakings Total £’000 £’000 £’000
At 1 January 2009 102,405 7,132 109,537
Additions 48 — 48
at 31 December 2009 102,453 7,132 109,585
Additions in the year reflect the share options charge relating to employees of the Company’s subsidiaries amounting to £48,000 (2008: £69,000).
The investments in subsidiary undertakings are stated at cost. The directors consider that the values of the investments are supported by their
underlying assets.
For detailed breakdown of investments refer to note 18 in the notes to the Group financial statements.
6 DebToRs
2009 2008
Note £’000 £’000
Amounts owed by Group undertakings 61,965 58,991
Deferred taxation assets 10 676 1,274
Other debtors 1,529 1,423
Pre-payments 67 67
64,237 61,755
Included in deferred taxation assets are amounts of £676,000 (2008: £1,274,000) relating to amounts falling due in more than one year.
Amounts owed by Group undertakings are unsecured and have no fixed date of repayment. Included within this amount is £54,977,000 (2008:
£54,711,000) falling due after more than one year. Interest accrues at 0% – 2% per annum on €27,517,000 (£24,761,000) (2008: £26,788,000) of the
intercompany balance which will be repaid in two unequal instalments on 31 December 2012 and 31 December 2013.
7 CReDiToRs: aMouNTs faLLiNG Due wiThiN oNe YeaR
2009 2008
Note £’000 £’000
Bank overdrafts 9 10,564 6,691
Bank loans 9 5,016 3,003
Trade creditors 340 382
Amounts due to subsidiaries 2 826
Hire purchase and finance lease obligations 9 49 6
Other taxation and social security 4 13
Accruals and deferred income 842 734
16,817 11,655
Amounts due to subsidiaries are unsecured, have no fixed date of repayment, and they do not incur interest.

88
titan europe Plc Annual Report & Accounts 2009
17643 25/05/10 Proof6
88
titan europe Plc Annual Report & Accounts 2009
17643 25/05/10 Proof6
NoTes To The CoMpaNY fiNaNCiaL sTaTeMeNTs continued
For the year ended 31 December 2009
8 CReDiToRs: aMouNTs faLLiNG Due afTeR MoRe ThaN oNe YeaR
2009 2008
Note £’000 £’000
Bank loans 9 20,597 20,167
Amounts due to subsidiaries 3,729 9,777
Hire purchase and finance lease obligations 9 — 49
24,326 29,993
Amounts due to subsidiaries are unsecured and have no fixed date of repayment. The balance relates to an intercompany loan which accrues
interest at Euribor +1.3%.
9 boRRowiNGs
2009 2008
Note £’000 £’000
Non-current
Bank borrowings 20,597 20,167
Hire purchase and finance lease obligations — 49
20,597 20,216
Current
Bank overdraft 10,564 6,691
Bank borrowings 5,016 3,003
Hire purchase and finance lease obligations 49 6
15,629 9,700
Total borrowings 36,226 29,916
Maturity of financial liabilities and borrowingsThe maturity profile of the financial liabilities and borrowings is shown below:
hire purchases borrowings and finance leases 2009 Total £’000 £’000 £’000
within 1 year 15,580 49 15,629between 1 and 2 years — — —between 2 and 5 years 20,597 — 20,597over 5 years — — —
Total gross payments 36,177 49 36,226Less finance charges included above — — —
36,177 49 36,226

www.titaneurope.com Stock code: AIM: TSW.L
89
our business
17643 25/05/10 Proof6
www.titaneurope.com Stock code: AIM: TSW.L
89
financial
17643 25/05/10 Proof6
Notes to the Company Financial Statements
9 boRRowiNGs (continued)
Hire purchases
Borrowings and finance leases 2008 Total
£’000 £’000 £’000
Within 1 year 9,694 6 9,700
Between 1 and 2 years — 49 49
Between 2 and 5 years 20,167 — 20,167
Over 5 years — — —
Total gross payments 29,861 55 29,916
Less finance charges included above — — —
At 31 December 2008 29,861 55 29,916
The Company’s bank overdraft is secured by a Debenture and legal charge over the assets of the subsidiary company Titan Steel Wheels Limited.
It incurs interest at a floating rate of UK bank base rate plus 3% and is repayable on demand.
The Company’s bank loans as at 31 December 2009 include:
a) an unsecured loan of £20,597,000 (2008: £20,167,000) which incurs interest of 0% and 2% and will be fully repaid in two unequal
instalments on 30 December 2012 and 30 December 2013 (Accordo Quadro);
b) a secured revolving credit facility of £5,016,000 (2008: £3,003,000) which incurs interest at a floating rate of LIBOR plus a variable margin
which was rolled over on 30 November 2009. The facility is secured by a Debenture and legal charge over the assets of the subsidiary
company Titan Steel Wheels Limited.
10 DefeRReD iNCoMe TaxDeferred taxation assets have been calculated based upon the expected rates at which these amounts would reverse, at a rate of 28% (2008:
28%). Details of deferred taxation assets and the movement in these over the year are detailed below:
The details of deferred taxation assets that are recognised and not recognised in respect of the Company are as below:
2009 2008
Recognised Recognised
£’000 £’000
Accelerated capital allowances 14 8
Other timing differences 524 374
Unrelieved taxation losses 138 892
676 1,274
The movement in the year on the deferred taxation asset is detailed below:
Deferred taxation £’000
At 1 January 2009 1,274
Recognised in the year 294
Utilised (892)
at 31 December 2009 676

90
titan europe Plc Annual Report & Accounts 2009
17643 25/05/10 Proof6
90
titan europe Plc Annual Report & Accounts 2009
17643 25/05/10 Proof6
11 CaLLeD up shaRe CapiTaLAuthorised:
Number of 40 pence shares ordinary shares (thousands) £’000
At 1 January 2009 125,000 50,000Increase in authorised share capital 25,000 10,000
at 31 December 2009 150,000 60,000
Allotted, called up and fully paid:
Number of 40 pence shares ordinary shares (thousands) £’000
At 1 January 2009 and at 31 December 2009 82,981 33,192
12 ReseRves
share premium other profit and account reserves loss account £’000 £’000 £’000
At 1 January 2008 77,112 6,458 19,036Premium on shares issued in the year 136 — —Credit relating to employee share schemes — — 206Profit for the year — — 1,207Dividends paid to shareholders — — (5,393)
at 31 December 2008 77, 248 6,458 15,056Credit relating to employee share schemes — — 150Profit for the year — — 1,943
at 31 December 2009 77,248 6,458 17,149
Other reserves represent a capital contribution reserve which in the opinion of the directors is not distributable.
The 2009 credit relating to employee share schemes of £150,000 (2008: £206,000) includes £48,000 (2008: £69,000) relating to subsidiary employee share options which have been capitalised in investments (note 5).
Included in the profit and loss account reserve is £13,546,000 (2008: £13,546,000) of unrealised profit arising from the sale of Titan Italia SpA to ITM Holding SpA.
13 opeRaTiNG Lease CoMMiTMeNTsAnnual commitments in respect of non-cancellable leases for plant and machinery are as follows:
2009 2008 plant and Plant and machinery machinery £’000 £’000
expiring within:One year — 30Two to five years 8 6
8 36
NoTes To The CoMpaNY fiNaNCiaL sTaTeMeNTs continued
For the year ended 31 December 2009

www.titaneurope.com Stock code: AIM: TSW.L
91
our business
17643 25/05/10 Proof6
www.titaneurope.com Stock code: AIM: TSW.L
91
financial
17643 25/05/10 Proof6
Notes to the Company Financial Statements
shaRehoLDeR NoTes

92
titan europe Plc Annual Report & Accounts 2009
17643 25/05/10 Proof6
92
titan europe Plc Annual Report & Accounts 2009
17643 25/05/10 Proof6
shaRehoLDeR NoTes

17643 25/05/10 Proof 6 17643 25/05/10 Proof 6
Titan Europe Plc Annual Report & Accounts 2009
WHO WE ARE
OUR BUSINESS
01 Summary of Financial Results02 Global Reach — Local Presence04 10 Reasons to do business with Titan Europe06 Wheels10 Undercarriage
PERFORMANCE
14 Chief Executive’s Report
GOVERNANCE
20 Directors & Advisers22 Directors’ Report30 Corporate Governance Statement31 Independent Auditors’ Report
FINANCIAL
32 Consolidated Income Statement33 Consolidated Statement of Comprehensive Income34 Consolidated Balance Sheet35 Consolidated Statement of Changes in Equity36 Consolidated Cash Flow Statement37 Reconciliation of Cash Flow to Net Debt38 Notes to the Consolidated Financial Statements81 Independent Auditors’ Report82 Company Balance Sheet83 Movements in Shareholders’ Funds84 Notes to the Company Financial Statements
TITAN EUROPE Plc
à A world leading engineering group designing, developing, manufacturing and distributing products and services for the global construction, agricultural and mining machinery markets
à Recognised as a technical innovator and leading provider of integrated solutions. Focused on its markets and customers, Titan Europe delivers products to global OEM customers and their associated aftermarkets
à Titan Europe's objective is to excel at supporting customers through local production and distribution locations, a strategy which helps to differentiate the business from many of its competitors
à Titan Europe currently has two distinct product ranges, organised into two divisions, Wheels and Undercarriage
17643TITANEU cvr(spine).indd 217643TITANEU cvr(spine).indd 2 25/05/2010 10:1525/05/2010 10:15

17643 25/05/10 Proof 6 17643 25/05/10 Proof 6
Titan Europe Plc Annual Report &
Accounts 2009
Titan Europe PlcAnnual Report & Accounts 2009
Titan Europe PlcTitan Europe HeadquartersBridge Road, CookleyKidderminster, WorcestershireDY10 3SDUnited Kingdom
Tel: +44 (0)1562 850561Fax: +44 (0)1562 852554
Registered in England No. 3018340
17643TITANEU cvr(spine).indd 117643TITANEU cvr(spine).indd 1 25/05/2010 10:1525/05/2010 10:15


