Page 1
Research Manuscript Template Page 1 of 37
FRONT MATTER Titanium hydride nanoplates enable 5 wt% of reversible hydrogen storage by sodium
alanate below 80 °C
Zhuanghe Ren,1 Xin Zhang,
1 Hai-Wen Li,
2 Zhenguo Huang,
3 Jianjiang Hu,*,
4 Mingxia
Gao,1 Hongge Pan,*
,1,5 Yongfeng Liu*
,1,5
1State Key Laboratory of Silicon Materials and School of Materials Science and
Engineering, Zhejiang University, Hangzhou 310027, China. 2Hefei General Machinery Research Institute, Hefei 230031, China.
3School of Civil & Environmental Engineering, University of Technology Sydney, 81
Broadway, Ultimo, NSW, 2007, Australia. 4School of Chemistry and Chemical Engineering, Yantai University, Yantai 264005,
China. 5Institute of Science and Technology for New Energy, Xi’an Technological University,
Xi’an, 710021, China.
Correspondence should be addressed to [email protected] (Y.F.L.), [email protected]
(J.J.H.), [email protected] (H.G.P.)
Abstract
Sodium alanate (NaAlH4) with 5.6 wt% of hydrogen capacity suffers seriously from the
sluggish kinetics for reversible hydrogen storage. Ti-based dopants such as TiCl4, TiCl3,
TiF3, TiO2, etc, are prominent in enhancing the dehydrogenation kinetics and hence
reducing the operation temperature. The tradeoff, however, is a considerable decrease of
the reversible hydrogen capacity, which largely lowers the practical value of NaAlH4.
Here we successfully synthesized a new Ti-dopant, i.e. TiH2 as nanoplates with ~50 nm in
lateral size and ~15 nm in thickness by an ultrasound-driven metathesis reaction between
TiCl4 and LiH in THF with graphene as supports (denoted as NP-TiH2@G). Doping of 7
wt% NP-TiH2@G enables a full dehydrogenation of NaAlH4 at 80 ºC and re-
hydrogenation at 30 ºC under 100 atm H2 with a reversible hydrogen capacity of 5 wt%,
superior to all literature results reported so far. This indicates that nanostructured TiH2 is
Page 2
Research Manuscript Template Page 2 of 37
much more effective than Ti-dopants in improving the hydrogen storage performance of
NaAlH4. Our finding not only pushes the practical application of NaAlH4 forward greatly,
but also opens up new opportunities to tailor the kinetics with the minimal capacity loss.
1. Introduction
Hydrogen storage, bridging hydrogen generation and hydrogen application, plays a crucial
role in a future hydrogen energy society [1-4]. Distinct from the matured technologies of
compressed and liquefied hydrogen, solid state hydrides can realize higher hydrogen
density under moderate pressures and temperature. Metal complex hydrides have attracted
tremendous attention as the most promising hydrogen storage candidates because of their
high gravimetric and volumetric hydrogen densities [5-8]. Sodium alanate, NaAlH4, is a
typical complex hydride possessing 7.4 wt% of hydrogen capacity and favorable
thermodynamics [9-12]. However, the sluggish kinetics results in high operation
temperature and poor reversibility for hydrogen storage in NaAlH4, therefore limiting its
practical on-board applications.
Catalyst doping has been proved a feasible approach to help reducing the kinetic
barriers of hydrogen storage reactions in metal hydrides. Transition metals and their
compounds, especially Ti-based dopants, were found to have the ability to promote fast
dissociation and recombination of hydrogen molecules [12-14]. In this respect,
Bogdanović and co-worker contributed an important breakthrough by introducing a few
millimoles of Ti(OBu)4 or TiCl3 into NaAlH4, which enabled reversible hydrogen storage
with NaAlH4 at moderate conditions [15]. After that, a variety of Ti-based species have
been explored and evaluated, including halides, oxides, nitrides, borides, carbides,
hydrides, alloys and elemental metals (Figure 1) [16-31]. In most cases, the Ti-species
tends to react with NaAlH4 to form TixAly, which shows significant catalytic effect on the
Page 3
Research Manuscript Template Page 3 of 37
de-/re-hydrogenation. Although most of the Ti-based species exhibit positive effects on
the improvement of kinetics, the reduced hydrogen capacity becomes another important
issue, especially for the heavy dopants [32]. More importantly, dopants with high valent
Ti are readily reduced to the low valence and even to metal state of zero-valence during
ball milling with NaAlH4, while the anions tend to combine with Na+ to form hydrogen
inert compounds, consequently further lowering the available hydrogen capacity of the
whole composite [16,33,34]. As a result, the reversible hydrogen capacity remains only 3-
4 wt% for Ti-doped NaAlH4 system [35-37]. This is far from 5.6 wt% of theoretical value
while NaAlH4 decomposes to NaH and Al. Therefore, it is in great need to tackle the
abovementioned trade-off issue between reaction temperature and hydrogen capacity of
NaAlH4-based hydrogen storage materials.
Titanium hydride, TiH2, with Ti being already in low valent state and containing
hydrogen itself, is expected to be a better candidate of dopant in comparison with other Ti-
based compounds. More encouragingly, considerable studies show that the in-situ formed
TiH2 is a catalytic active phase in the Ti-based compound-modified NaAlH4 systems [38-
43]. For example, Gross et al. observed the conversion of NaH/Al to NaAlH4 at 130 ºC
and 82 atm H2 with the presence of TiH2, indicating a remarkable improvement of
hydrogenation properties [38]. Wang et al. reported the in-situ generation of TiH2 after
mechanical milling of metallic Ti powder with NaH/Al mixture under H2 atmosphere [39].
A similar phenomenon was also observed during hydrogenation of the TiO2-modified
NaAlH4 system [40]. Moreover, theoretical predications supported the creation of Ti-H
bonds via extracting hydrogen atoms from the accessible AlH4/AlH3 groups [41-43].
However, introduction of commercial TiH2 into NaAlH4 seemed not very effective (only
releasing 3.3 wt% H2 within 10 h at 150 ºC), which may be due to the large TiH2 particle
and thus the catalytic interactions between TiH2 and NaAlH4 were limited [27]. It is
Page 4
Research Manuscript Template Page 4 of 37
therefore an open question to trigger the high catalytic activity of TiH2 that would reduce
the reaction temperature and keep a high hydrogen capacity of NaAlH4 simultaneously.
In this work, we develop a novel facile sonochemical process for the fabrication of
two-dimensional (2D) TiH2 nanoplates. Ultrasound was used to drive the formation of
nanometer TiH2 on graphene by reacting TiCl4 with LiH in THF solution, thanks to the
high solubility of LiCl. Well-defined TiH2 nanoplates with a lateral size of ~50 nm and
thickness of ~15 nm on graphene (denoted as NP-TiH2@G) were successfully obtained.
Outstanding catalytic activity for hydrogen storage reaction of NaAlH4 was found to be
related to the significantly enhanced surface area and excellent dispersibility in
comparison with commercial TiH2 in microscale. Full dehydrogenation and
rehydrogenation were achieved, respectively at 80 ºC and 30 ºC, with a practical capacity
of 5 wt% for NaAlH4 doped with 7 wt% NP-TiH2@G. To the best of our knowledge, this
is the first example that NaAlH4 can reversibly store hydrogen in the working temperature
range of proton exchange membrane fuel cell (PEMFC) with the highest capacity (Figure
1). Such outstanding hydrogen storage performance of NaAlH4 meets the requirement for
on-board hydrogen storage application.
2. Results
2.1 Preparation of TiH2 nanoplates.
The process for the preparation of TiH2 nanoplates was developed, as illustrated
schematically in Figure 2, based on the following chemical reaction.
4 2 2T iC l 4 LiH T iH + 4LiC l+ H
T H F
U ltrason ifica tion (1)
All sample handling was conducted in an Ar-filled glove box. Firstly, stoichiometric
titanium tetrachloride (TiCl4) and lithium hydride (LiH) along with a certain amount of
graphene were added to tetrahydrofuran (THF) solution. Subsequently, the sonochemical
Page 5
Research Manuscript Template Page 5 of 37
process was conducted for 4 h at 40 kHz with continuous stirring. Finally, the solid-state
product was obtained after filtrating, washing and drying.
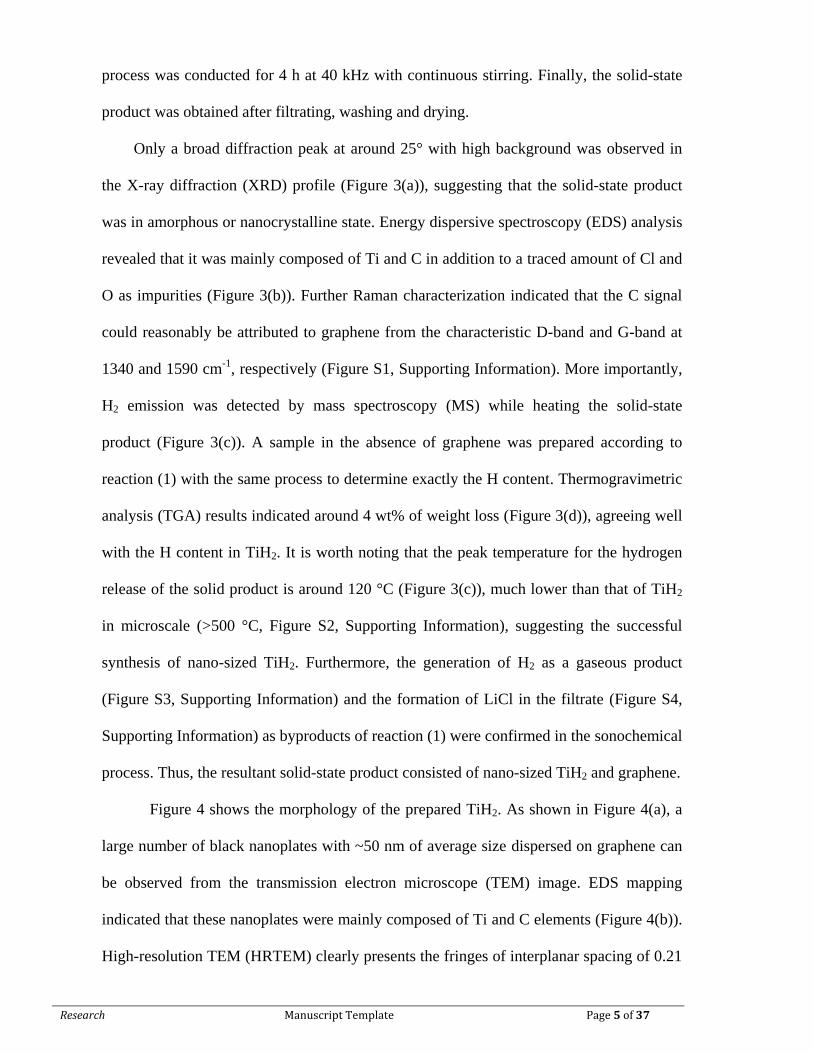
Only a broad diffraction peak at around 25° with high background was observed in
the X-ray diffraction (XRD) profile (Figure 3(a)), suggesting that the solid-state product
was in amorphous or nanocrystalline state. Energy dispersive spectroscopy (EDS) analysis
revealed that it was mainly composed of Ti and C in addition to a traced amount of Cl and
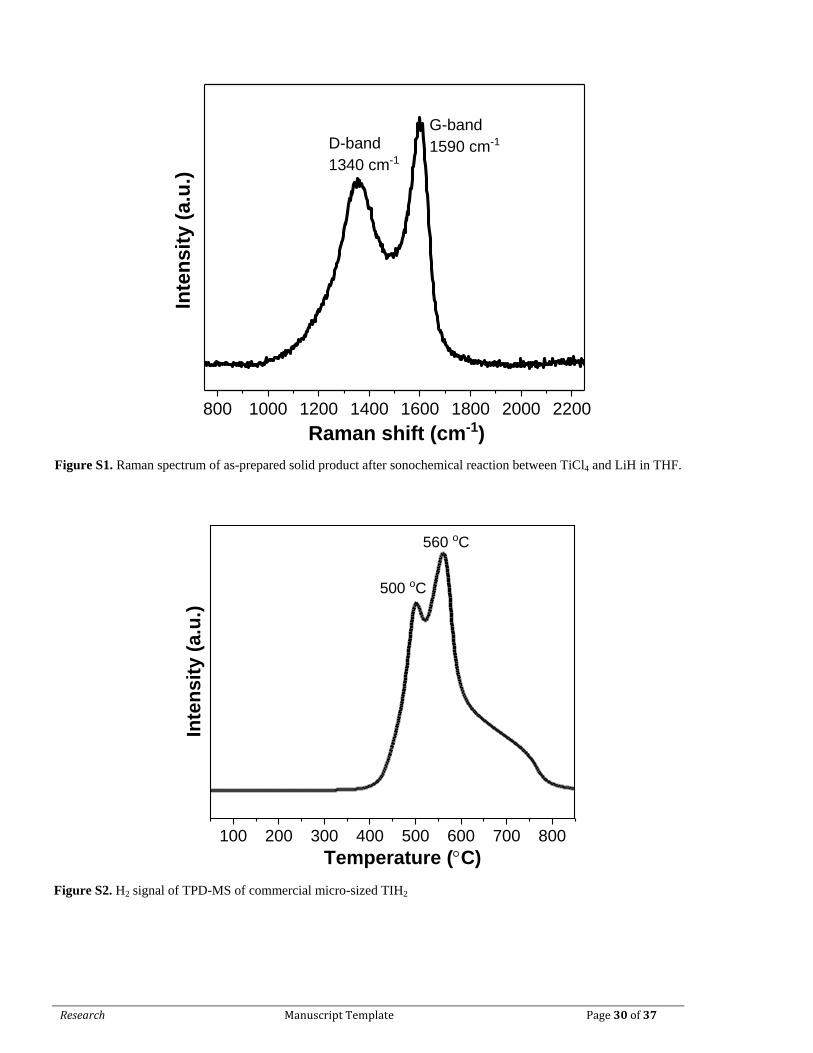
O as impurities (Figure 3(b)). Further Raman characterization indicated that the C signal
could reasonably be attributed to graphene from the characteristic D-band and G-band at
1340 and 1590 cm-1
, respectively (Figure S1, Supporting Information). More importantly,
H2 emission was detected by mass spectroscopy (MS) while heating the solid-state
product (Figure 3(c)). A sample in the absence of graphene was prepared according to
reaction (1) with the same process to determine exactly the H content. Thermogravimetric
analysis (TGA) results indicated around 4 wt% of weight loss (Figure 3(d)), agreeing well
with the H content in TiH2. It is worth noting that the peak temperature for the hydrogen
release of the solid product is around 120 °C (Figure 3(c)), much lower than that of TiH2
in microscale (>500 °C, Figure S2, Supporting Information), suggesting the successful
synthesis of nano-sized TiH2. Furthermore, the generation of H2 as a gaseous product
(Figure S3, Supporting Information) and the formation of LiCl in the filtrate (Figure S4,
Supporting Information) as byproducts of reaction (1) were confirmed in the sonochemical
process. Thus, the resultant solid-state product consisted of nano-sized TiH2 and graphene.
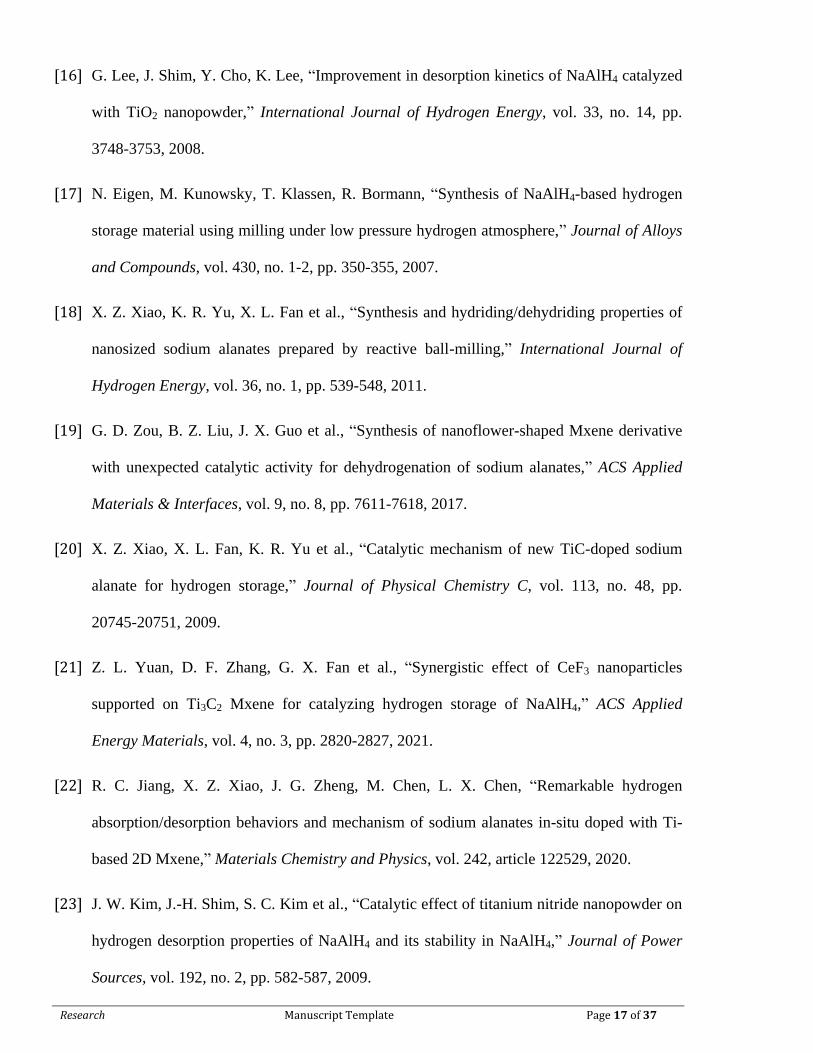
Figure 4 shows the morphology of the prepared TiH2. As shown in Figure 4(a), a
large number of black nanoplates with ~50 nm of average size dispersed on graphene can
be observed from the transmission electron microscope (TEM) image. EDS mapping
indicated that these nanoplates were mainly composed of Ti and C elements (Figure 4(b)).
High-resolution TEM (HRTEM) clearly presents the fringes of interplanar spacing of 0.21
Page 6
Research Manuscript Template Page 6 of 37
nm (Figure 4(c)), which corresponds to the (002) planes of TiH2. The TEM observations,
therefore, strongly prove the successful synthesis of graphene-supported TiH2 nanoplates
(denoted as NP-TiH2@G hereinafter) by a newly developed sonochemical process. The
thickness of the prepared TiH2 nanoplates was determined as ~15 nm by atomic force
microscope (AFM) measurement (Figure 4(d)).
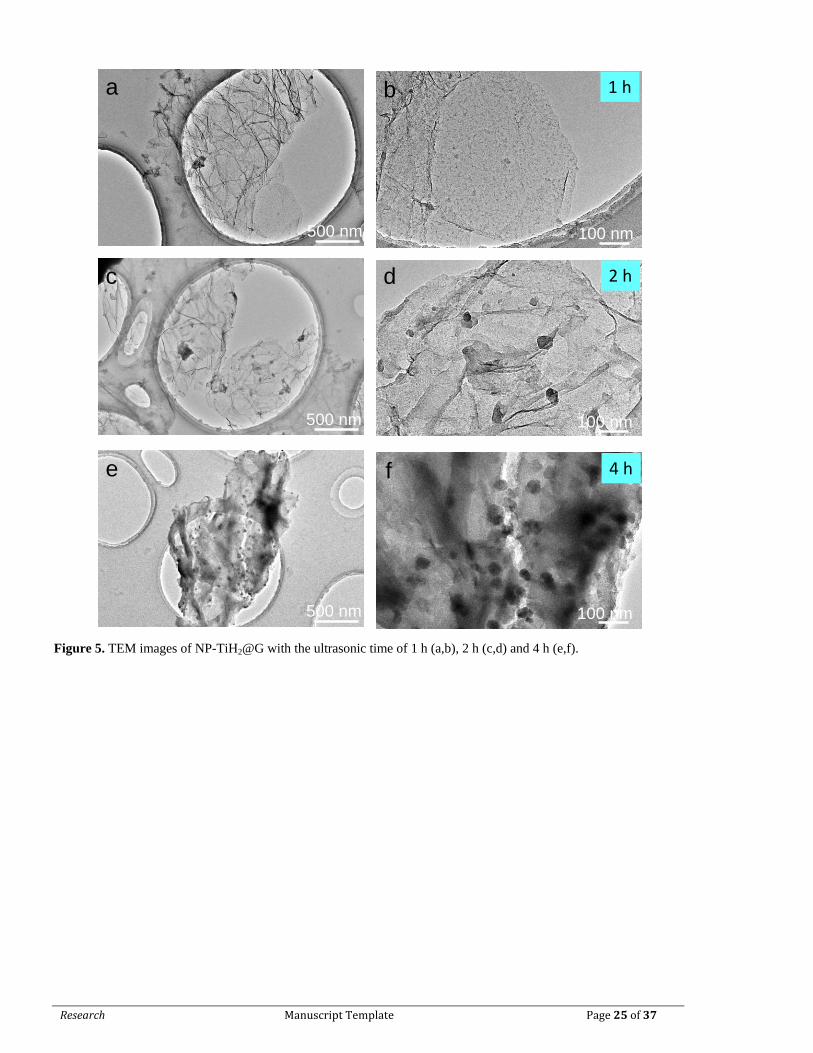
A time-dependence of growth of TiH2 nanoplates was also clearly observed by means
of TEM, as shown in Figure 5. For comparison, the pristine graphene with a clean surface
is shown in Figure S5 (Supporting Information). After 1 h of ultrasonic treatment, a large
number of ~10 nm-sized black sheets cover on the graphene (Figure 5(a, b)). Extending
the time to 2 h, some nanoplates grew up to ~50 nm (Figure 5(c, d)). Further extending to
4 h, the ~50 nm-sized nanoplates were largely increased in quantity along with the
disappearance of small nanosheets (Figure 5(e, f)). The loading amount of TiH2 was
determined to be ~70% in weight by inductively coupled plasma spectroscopy (ICP)
examination, which is distinctly higher than that obtained previously by a solvothermal
process (~ 46%) [44]. Thus, higher catalytic activity was expected. In a strong contrast,
only coarse particles with ~500 nm in size were obtained via the same sonochemical
process without graphene as support (Figure S6, Supporting Information). This fact
unambiguously indicates the critical important role played by graphene as a hard template
governing the morphology of TiH2 nanoplate, attributed to the very similarity in lattice
spacings (2.10 Å for the (002) planes of TiH2 and 2.13 Å for the (100) planes of graphene)
[44].
2.2 Catalytic activity of TiH2 nanoplates.
The 4 h-sonicated NP-TiH2@G was selected to mix with NaAlH4 by ball milling in order
to evaluate its catalytic effectiveness because it took 4 h to complete the conversion of
Page 7
Research Manuscript Template Page 7 of 37
TiH2 from TiCl4 as indicated by the thorough disappearance of the characteristic
reflections of LiH in the XRD profile after 4 h of sonification (Figure S7, Supporting
Information). Six samples of NaAlH4-xNP-TiH2@G with x = 0, 1, 3, 5, 7 and 9 wt% were
examined. A remarkable reduction in the dehydrogenation temperature of NaAlH4 was
observed as NP-TiH2@G increasing from 1 wt% to 7 wt%, as shown in Figure 6(a). For
the 7 wt% NP-TiH2@G-containing sample, the release of hydrogen started from 80 ºC and
completed at 160 ºC with an usable hydrogen capacity of 5 wt%. The on-set and end
temperatures of dehydrogenation were reduced by 115 and 180 ºC, respectively, compared
to those of the pristine NaAlH4. Further increase of NP-TiH2@G to 9 wt% caused an
obvious loss of hydrogen capacity without obvious reduction in the dehydrogenation
temperature. Therefore, 7 wt% was the optimal amount for NP-TiH2@G by taking into
account of the hydrogen capacity and the dehydrogenation temperature.
The dehydrogenated sample was subsequently subjected to hydrogenation with
ramped temperatures under 100 atm of H2 pressure, as shown in Figure 6(b). The 7 wt%
NP-TiH2@G-containg sample showed superior rehydrogenation properties to those of
pristine NaAlH4 and NaAlH4 doped with the commercial TiH2. Specifically, 7 wt% NP-
TiH2@G-containg sample absorbed 5 wt% H2 from 25 ºC to 105 ºC. It is worth
emphasizing that the 7 wt% NP-TiH2@G-containing sample started to absorb hydrogen at
a temperature as low as 25 ºC and more than 90% of the rehydrogenation can be
completed below 90 ºC, which is close to the working temperature of PEMFC. Such
significant improvement of the rehydrogenation by the addition of 7 wt% NP-TiH2@G
demonstrated for the first time that high reversible capacity coupled with the
dehydrogenation temperature of NaAlH4 can be achieved simultaneously by a proper
dopant, which can be mainly attributed to the highly homogenous dispersion of the
prepared NP-TiH2@G (Figure 6(c)) than that of the commercial TiH2 (Figure 6(d)) in
Page 8
Research Manuscript Template Page 8 of 37
NaAlH4. The Ti-rich area was clearly observed in NaAlH4 doped with the commercial
TiH2, probably due to the large particle size of TiH2 (Figure S8, Supporting Information).
More importantly, most of the NP-TiH2 was converted to Al-Ti species after 24 h ball
milling with NaAlH4, whereas only small amount of Al-Ti species can be detected in the
commercial TiH2 (Figure S9, Supporting Information). This suggests that the reduced
particle size of TiH2 facilitates the formation of Al-Ti species, which possess high
catalytic activity for the dehydrogenation and rehydrogenation of NaAlH4 [9,34,40].
Further XRD characterization indicated that the reversible hydrogen capacity still
originated from the decomposition and reformation of NaAlH4, as shown in Figure S10
(Supporting Information).
Moreover, the dehydrogenation temperature was further reduced by ~10 ºC in the
follow-up 2nd cycle (Figure S11, Supporting Information). It can be clearly seen that the
particle size of Ti-containing species reduced largely to around 5 nm from the aberration-
corrected scanning transmission electron microscope (STEM) observation and EDS
mapping analyses, as shown in Figure 7. From the relative content analyses, the Al-Ti
species changed from Al85Ti15 for the as-milled sample to Al58Ti42 for the cycled sample,
close to Al50Ti50, suggesting the reconstruction or optimization of the local atomic
structure of Al-Ti species during cycling. This is further evidenced by the slight low-angle
shift of the characteristic reflection of Al-Ti species in the XRD profiles because of the
incorporation of more Ti (Figure S12, Supporting Information). According to the density
functional theory (DFT) calculation, the kinetic barrier of the transfer of H atom from
NaAlH4 to the surface of Al is largely reduced from 0.47 eV (Figure S13a, Supporting
Information) to 0.14 eV (Figure S13b, Supporting Information) with the present of one Ti
atom. This process can even proceed spontaneously when two Ti atoms are introduced
into the surface of Al in the near-nearest-neighbor mode (Figure S13c, Supporting
Page 9
Research Manuscript Template Page 9 of 37
Information). This suggests that the Al-Ti species are of great importance for the
significant improvement of dehydrogenation kinetics of NaAlH4, which agrees well with
the previous reports [40,45].
2.3 Hydrogen storage kinetics of NP-TiH2@G-containing NaAlH4.
Figure 8(a) and (b) show the isothermal dehydrogenation behaviors of NaAlH4-7 wt% NP-
TiH2@G sample after 1 dehydrogenation/rehydrogenation cycle, measured by volumetric
and thermogravimetric (TG) methods, respectively. Isothermal volumetric
dehydrogenation indicates that the full dehydrogenation of 5 wt% of hydrogen was
achieved within 30 min at 140 ºC. At 120 ºC, it took around 200 min to complete. Even at
100 ºC, the major part of hydrogen (around 3.2 wt%) can be released within 30 min and
the dehydrogenation completed within 500 min. The time for the full dehydrogenation was
reduced to only 250 min at TG measurement (Figure 8(b)), which is attributed to the
absence of blocking effect from hydrogen back pressure. More encouragingly, the full
dehydrogenation can be achieved even at 80 ºC, which is the lowest dehydrogenation
temperature for NaAlH4 reported so far.
The full isothermal rehydrogenation (~ 5 wt% of hydrogen) of dehydrogenated
NaAlH4-7 wt% NP-TiH2@G completed within only 25 min at 100 ºC, as shown in Figure
8(c). Amazingly, the full rehydrogenation was also achieved even at 30 ºC. This is the first
complex hydride system that is able to work at the target temperature range proposed by
US DOE with 5 wt% of reversible hydrogen capacity, although the
dehydrogenation/rehydrogenation rates need to be further improved [46].
The apparent activation energy of dehydrogenation reactions of NaAlH4-7 wt% NP-
TiH2@G was calculated based on the Kissinger’s plots (Figure 8(d)), in which the peak
temperatures and the heating rates were obtained from temperature programmed
Page 10
Research Manuscript Template Page 10 of 37
desorption (TPD) curves shown in Figure S14 (Supporting Information). The apparent
activation energies for each step are 80 ± 3.3 and 70 ± 2.8 kJ mol-1
, respectively. These
values are reduced by ~40% compared to those of the pristine NaAlH4 [47], and even
remarkably lower than those of other catalyst-modified NaAlH4 systems (Table S1) [48-
54], indicating the significant reduction of the dehydrogenation kinetic barriers induced by
the newly-formed Al-Ti catalytic species. In contrast, the addition of 7 wt% NP-TiH2@G
did not affect much the thermodynamic properties of NaAlH4 as indicated by the nearly
unchanged desorption enthalpy change, which were determined to be approximately
36.5/47.4 and 36.3/47.0 kJ/mol-H2 for pristine sample and 7 wt% NP-TiH2@G-containing
sample, respectively, by analyzing the differential scanning calorimetry (DSC) results
(Figure S15, Supporting Information).
2.4 Dehydrogenation/rehydrogenation cycling of NP-TiH2@G-containing NaAlH4.
Dehydrogenation/rehydrogenation cycling performance of the NaAlH4-7 wt% NP-
TiH2@G sample is shown in Figure 9(a). Here, dehydrogenation was operated at 140 ºC
under initial vacuum and rehydrogenation at 100 ºC/100 atm H2. No obvious degradation
was observed after 50 cycles. The hydrogen capacity was 4.8 wt% at the 50th cycle, which
means a capacity retention of 96% based on the initial capacity of 5.0 wt%. The cycling
performance demonstrates a stable cyclability of the NP-TiH2@G-containing NaAlH4.
To shed light on the stable cycling behavior of NP-TiH2@G-containing NaAlH4, the
particle size, distribution and chemical states of catalytic species were examined and
analyzed. TEM observation displayed that the catalytic species remained as ultrafine
particles of ~5 nm in size without obvious agglomeration (Figure 9(b)). EDS mapping
analyses (Figure 9(c, d)) indicated the homogenous distribution of Ti element on NaAlH4
matrix even after 50 cycles. In addition, high resolution XPS spectra of Ti 2p showed a
Page 11
Research Manuscript Template Page 11 of 37
stable chemical state from 2 - 50 cycles for the nearly unchanged 2p3/2-2p1/2 spin–orbit
doublet at 453.2/458.1 eV (Figure 9e) [55]. As a result, we believe that the small particle
size, homogenous dispersion and stable chemical state are of critical importance for the
long-term cyclability of NP-TiH2@G-containing NaAlH4. This finding provides important
insights and greatly encourages the further development of the catalysis-promoted
complex hydrides for practical on-board applications.
3. Discussion
Two-dimensional TiH2 nanoplates with a lateral size of 50 nm and a thickness of 15 nm
were successfully synthesized by using graphene as support, based on a novel facile
sonhochemical process. The graphene played a critical role in the nucleation and growth
of TiH2 nanoplates. The prepared TiH2 nanoplates displayed superior catalytic activity
than the commercial TiH2 of microscale for hydrogen storage in NaAlH4. The 7 wt% NP-
TiH2@G-containing NaAlH4 started releasing hydrogen at 80 ºC, which was lowered by
115 ºC in comparison with pristine sample. In TG measurement, full dehydrogenation was
achieved with 5.0 wt% of practical hydrogen capacity even at 80 ºC. It is worth
emphasizing that the rehydrogenation can complete at 30 ºC under 100 atm of H2.
Operating at 140 ºC/initial vacuum for dehydrogenation and 100 ºC/100 atm H2 for
rehydrogenation, a stable cyclability was confirmed, as only 0.2 wt% of capacity loss after
50 cycles. Mechanistic studies revealed the active catalytic species was converted from
TiH2 to Al85Ti15 during ball milling and further to Al50Ti50 after the first de-/hydrogenation
cycle, which remained stable in the subsequent cycling. DFT calculations reveal that the
kinetic barrier of the transfer of H atom from NaAlH4 to the surface of Al is largely
reduced by the formation of Al-Ti species. The small particle, homogenous dispersion and
Page 12
Research Manuscript Template Page 12 of 37
stable chemical state of active catalytic species are responsible for the long-term
cyclability of NP-TiH2@G-containing NaAlH4. The findings presented in this work make
NaAlH4 step closer towards practical on-board hydrogen storage applications.
4. Materials and Methods
4.1. Materials Synthesis. All reagents and solvents were purchased and used as received
without further purification. TiH2 nanoplates supported on graphene (NP-TiH2@G) were
synthesized by a newly developed sonochemical process [56] under argon atmosphere
using titanium chloride (TiCl4, 99.9%, Aladdin), lithium hydride (LiH, 99.4%, Alfa Aesar)
and graphene (97%, Aladdin) as the raw materials. In a typical procedure, TiCl4 (2 mmol),
LiH (8 mmol) and graphene (20 mg) were sequentially added to 70 mL THF in a flask-3-
neck which was irradiated by ultrasonic waves (40 kHz, W-600D, Shanghai Ultrasonic
Instrument, Shanghai, China) for 4 h under mechanical stirring. A black precipitate of NP-
TiH2@G was separated from the THF solution by filtration, washed twice with THF and
finally dried at 70 °C under dynamic vacuum. The obtained NP-TiH2@G was mixed with
NaAlH4 on a planetary ball mill (Nanjing, China). The ball milling was conducted at 500
rpm for 24 h in the milling jar filled with 50 atm H2 at the ball-to-sample weight ratio of
approximately 120 : 1. The doping amounts of NP-TiH2@G were set to be x = 0, 1, 3, 5, 7
and 9 wt%.
4.2. Characterization. The structure information was collected on a MiniFlex 600 X-ray
diffractometer (XRD) (Rigaku, Japan) with Cu Kα radiation (λ = 0.15406 nm) operated at
40 kV and 15 mA. The 2θ range was set at 10-90° with a 0.05° step increment. A custom-
designed container with a window covered by Scotch tape was used to prevent air and
moisture exposure of the sample. The sample morphology and microstructure were
Page 13
Research Manuscript Template Page 13 of 37
observed with scanning electron microscope (SEM) (Hitachi S-4800), aberration-corrected
scanning transmission electron microscope (STEM) (Titan G2 80-200 Chemi STEM FEI,
200 kV) and TEM (Tecnai G2 F20 S-TWIN FEI, 200 kV). For SEM observation, the
sample was transferred quickly to the SEM facility under Ar protection. For STEM and
TEM examinations, the sample was protected with a double-tilt vacuum transfer holder
(Gatan 648, USA). Atomic force microscope (AFM) characterization was performed on
Bruker Dimension Icon under the tapping mode, with samples prepared by dropping
freshly diluted sample solutions onto silicon substrates. X-ray photoelectron spectroscopy
(XPS) analyses were carried out using a Thermo Scientific ESCALAB 250Xi
spectrometer with a monochromatic Al Ka X-ray source at a base pressure of 6.8 × 10⁻⁹
Torr. The Ti content of samples were determined by inductively coupled plasma (ICP)
spectroscopy on a PE Optima 8000 instrument.
4.3. Property Measurements. A home-built temperature programmed desorption (TPD)
system attached to a mass spectrometer (MS) was employed to characterize the
temperature-dependent dehydrogenation behavior using Ar as a carrier gas with a flow rate
of 20 mL min-1
. For each test, approximately 40 mg sample was heated up from room
temperature to desired temperatures at 2 °C min-1
. Quantitative
dehydrogenation/hydrogenation properties were measured using a Sieverts-type apparatus
under isothermal and non-isothermal conditions and the sample loading was
approximately 70 mg sample. The non-isothermal data were acquired by gradually heating
the sample from room temperature to a preset temperature at an average rate of 2 °C min-1
under primary vacuum (-10-3
Torr) for dehydrogenation and 1 °C min-1
with 100 atm H2
for hydrogenation. The isothermal measurements were conducted by rapidly heating the
sample to a desired temperature and then dwelling during the entire test. The temperature
and pressure were monitored and recorded simultaneously, and the amounts of hydrogen
Page 14
Research Manuscript Template Page 14 of 37
released/uptaken were calculated based upon the ideal gas law. Thermogravimetric
analysis (TGA) was carried out on a Netzsch TG 209 F3 instrument under an argon
atmosphere at a ramping rate of 2 °C min-1
. Differential scanning calorimetry (DSC)
experiments were performed with a NETZSCH DSC 200F3 unit at 2 °C min-1
of heating
rate. Approximately 2 mg of sample was placed in an Al2O3 crucible for measurement.
4.4. Theoretical calculation. Density functional theory (DFT) calculations were conducted
in the Vienna Ab initio Simulation Package (VASP). The generalized gradient
approximation (GGA) with Perdew-Burke-Ernzerhof (PBE) model was taken as the
exchange-correlation functional [57]. Projector augmented wave pseudopotentials (PAWs)
were employed to model the ionic potentials [58]. The precession setting of “PREC =
Accurate” was used. All atoms were fully relaxed until the force on them was less than
0.05 eV Å−1
. The Brillouin zone integration was performed with gamma centred sampling
of 3×3×1. The minimum-energy pathway was computed using the climbing-image nudged
elastic band (CI-NEB) method [59]. Al(111) surface was selected because it has the
lowest surface free energy and then is most likely exposed. A six-layer slab containing 96
atoms was constructed to simulate the surface with the lowest two layers fixed to represent
the bulk. The thickness of vacuum layer was set as 20 Å to avoid interaction between
neighbouring images.
Conflicts of Interest
The authors declare no competing financial interest.
Author Contributions
Z.H.R. and X.Z. contributed equally to this work.
Acknowledgments
Page 15
Research Manuscript Template Page 15 of 37
We gratefully acknowledge the financial support received from the Natural Science
Foundation of Zhejiang Province (LD21E010002), the National Outstanding Youth
Foundation of China (52125104), the National Natural Science Foundation of China
(52071285, 52001277), the National Key R&D Program of China (2018YFB1502102),
the Fundamental Research Funds for the Central Universities (2021FZZX001-09) and the
National Youth Top-Notch Talent Support Program.
Data Availability
The data used to support the findings of this study are included within the article and
supplementary information files and/or may be requested from the authors.
References
[1] L. Schlapbach, A. Züttel, “Hydrogen-storage materials for mobile applications,” Nature,
vol. 414, no. 6861, pp. 353-358, 2001.
[2] J. Zheng, C.-G. Wang, H. Zhou et al., "Current research trends and perspectives on solid-
state nanomaterials in hydrogen storage," Research, vol. 41, pp. 69-107, 2021.
[3] C. G. Lang, Y. Jia, X. D. Yao, “Recent advances in liquid-phase chemical hydrogen
storage,” Energy Storage Materials, vol. 26, pp. 290-312, 2020.
[4] T. He, P. Pachfule, H. Wu, Q. Xu, P. Chen, “Hydrogen carriers,” Nature Reviews Materials,
vol. 1, no. 12, article 16067, 2016.
[5] S.-i. Orimo, Y. Nakamori, J. R. Eliseo, A. Züttel, C. M. Jensen, “Complex hydrides for
hydrogen storage,” Chemical Reviews, vol. 107, no. 10, pp. 4111-4132, 2007.
[6] L. Z. Ouyang, K. Chen, J. Jiang, X. S. Yang, M. Zhu, “Hydrogen storage in light-metal
based systems: A review,” Journal of Alloys and Compounds, vol. 829, article 154597,
2020.
[7] L. Li, Y. K. Huang, C. H. An, Y. J. Wang, “Lightweight hydrides nanocomposites for
hydrogen storage: Challenges, progress and prospects,” Science China-Materials, vol. 62,
no. 11, pp. 1597-1625, 2019.
Page 16
Research Manuscript Template Page 16 of 37
[8] X. B. Yu, Z. W. Tang, D. L. Sun, L. Z. Ouyang, M. Zhu, “Recent advances and remaining
challenges of nanostructured materials for hydrogen storage applications,” Progress in
Materials Science, vol. 88, pp. 1-48, 2017.
[9] T. J. Frankcombe, “Proposed mechanisms for the catalytic activity of Ti in NaAlH4,”
Chemical Reviews, vol. 112, no. 4, pp. 2164-2178, 2012.
[10] B. Bogdanović, M. Felderhoff, A. Pommerin, F. Schüth, N. Spielkamp, “Advanced
hydrogen-storage materials based on Sc-, Ce-, and Pr-doped NaAlH4,” Advanced Materials,
vol. 18, no. 9, pp. 1198-1201, 2006.
[11] N. A. Ali, M. Ismail, “Modification of NaAlH4 properties using catalysts for solid-state
hydrogen storage: A review,” International Journal of Hydrogen Energy, vol. 46, no. 1, pp.
766-782, 2021.
[12] Y. F. Liu, Z. H. Ren, X. Zhang et al., “Development of catalyst-enhanced sodium alanate as
an advanced hydrogen-storage material for mobile applications,” Energy Technology, vol.
6, no. 3, pp. 487-500, 2018.
[13] X. L. Zhang, Y. F. Liu, X. Zhang et al., “Empowering hydrogen storage performance of
MgH2 by nanoengineering and nanocatalysis,” Materials Today Nano, vol. 9, article
100064, 2020.
[14] W. X. Zhang, X. Zhang, Z. G. Huang et al., “Recent development of lithium borohydride-
based materials for hydrogen storage,” Advanced Energy and Sustainability Research, vol.
2, article 2100073, 2021.
[15] B. Bogdanović, M. Schwickardi, “Ti-doped alkali metal aluminium hydrides as potential
novel reversible hydrogen storage materials,” Journal of Alloys and Compounds, vol. 253,
pp. 1-9, 1997.
Page 17
Research Manuscript Template Page 17 of 37
[16] G. Lee, J. Shim, Y. Cho, K. Lee, “Improvement in desorption kinetics of NaAlH4 catalyzed
with TiO2 nanopowder,” International Journal of Hydrogen Energy, vol. 33, no. 14, pp.
3748-3753, 2008.
[17] N. Eigen, M. Kunowsky, T. Klassen, R. Bormann, “Synthesis of NaAlH4-based hydrogen
storage material using milling under low pressure hydrogen atmosphere,” Journal of Alloys
and Compounds, vol. 430, no. 1-2, pp. 350-355, 2007.
[18] X. Z. Xiao, K. R. Yu, X. L. Fan et al., “Synthesis and hydriding/dehydriding properties of
nanosized sodium alanates prepared by reactive ball-milling,” International Journal of
Hydrogen Energy, vol. 36, no. 1, pp. 539-548, 2011.
[19] G. D. Zou, B. Z. Liu, J. X. Guo et al., “Synthesis of nanoflower-shaped Mxene derivative
with unexpected catalytic activity for dehydrogenation of sodium alanates,” ACS Applied
Materials & Interfaces, vol. 9, no. 8, pp. 7611-7618, 2017.
[20] X. Z. Xiao, X. L. Fan, K. R. Yu et al., “Catalytic mechanism of new TiC-doped sodium
alanate for hydrogen storage,” Journal of Physical Chemistry C, vol. 113, no. 48, pp.
20745-20751, 2009.
[21] Z. L. Yuan, D. F. Zhang, G. X. Fan et al., “Synergistic effect of CeF3 nanoparticles
supported on Ti3C2 Mxene for catalyzing hydrogen storage of NaAlH4,” ACS Applied
Energy Materials, vol. 4, no. 3, pp. 2820-2827, 2021.
[22] R. C. Jiang, X. Z. Xiao, J. G. Zheng, M. Chen, L. X. Chen, “Remarkable hydrogen
absorption/desorption behaviors and mechanism of sodium alanates in-situ doped with Ti-
based 2D Mxene,” Materials Chemistry and Physics, vol. 242, article 122529, 2020.
[23] J. W. Kim, J.-H. Shim, S. C. Kim et al., “Catalytic effect of titanium nitride nanopowder on
hydrogen desorption properties of NaAlH4 and its stability in NaAlH4,” Journal of Power
Sources, vol. 192, no. 2, pp. 582-587, 2009.
Page 18
Research Manuscript Template Page 18 of 37
[24] L. Li, F. Qiu, Y. Wang et al., “Tin catalyst for the reversible hydrogen storage performance
of sodium alanate system,” Journal of Materials Chemistry, vol. 22, no. 27, pp. 13782,
2012.
[25] L. Li, F. Y. Qiu, Y. J. Wang et al., “Crystalline TiB2: An efficient catalyst for synthesis and
hydrogen desorption/absorption performances of NaAlH4 system,” Journal of Materials
Chemistry, vol. 22, no. 7, pp. 3127-3132, 2012.
[26] X. Z. Xiao, L. X. Chen, X. H. Wang et al., “Reversible hydrogen storage properties and
favorable co-doping mechanism of the metallic Ti and Zr co-doped sodium aluminum
hydride,” International Journal of Hydrogen Energy, vol. 33, no. 1, pp. 64-73, 2008.
[27] P. Wang, C. M. Jensen, “Preparation of Ti-doped sodium aluminum hydride from
mechanical milling of NaH/Al with off-the-shelf Ti powder,” Journal of Physical Chemistry
B, vol. 108, no. 40, pp. 15827-15829, 2004.
[28] M. P. Pitt, P. E. Vullum, M. H. Sørby et al., “Hydrogen absorption kinetics and structural
features of NaAlH4 enhanced with transition-metal and Ti-based nanoparticles,”
International Journal of Hydrogen Energy, vol. 37, no. 20, pp. 15175-15186, 2012.
[29] X. Zhang, X. L. Zhang, Z. H. Ren et al., “Amorphous-carbon-supported ultrasmall TiB2
nanoparticles with high catalytic activity for reversible hydrogen storage in NaAlH4,”
Frontiers in Chemistry, vol. 8, article 419, 2020.
[30] X. Zhang, Z. H. Ren, Y. H. Lu et al., “Facile synthesis and superior catalytic activity of
nano-TiN@N-C for hydrogen storage in NaAlH4,” ACS Applied Materials & Interfaces,
vol. 10, no. 18, pp. 15767-15777, 2018.
[31] R. Y. Wu, H. F. Du, Z. Y. Wang et al., “Remarkably improved hydrogen storage properties
of NaAlH4 doped with 2D titanium carbide,” Journal of Power Sources, vol. 327, pp. 519-
525, 2016.
Page 19
Research Manuscript Template Page 19 of 37
[32] F. Schüth, B. Bogdanović, M. Felderhoff, “Light metal hydrides and complex hydrides for
hydrogen storage,” Chemical Communications, no. 20, pp. 2249-2258, 2004.
[33] S. Zhang, C. Lu, N. Takeichi, T. Kiyobayashi, N. Kuriyama, “Reaction stoichiometry
between TiCl3 and NaAlH4 in Ti-doped alanate for hydrogen storage: The fate of the
titanium species,” International Journal of Hydrogen Energy, vol. 36, no. 1, pp. 634-638,
2011.
[34] A. Leon, D. Schild, M. Fichtner, “Chemical state of Ti in sodium alanate doped with TiCl3
using X-ray photoelectron spectroscopy,” Journal of Alloys and Compounds, vol. 404, pp.
766-770, 2005.
[35] P. Wang, X. D. Kang, H. M. Cheng, “Improved hydrogen storage of TiCl3-doped NaAlH4,”
Chemphyschem, vol. 6, no. 12, pp. 2488-2491, 2005.
[36] L. Li, F. Y. Qiu, Y. J. Wang et al., “Improved dehydrogenation performances of TiB2-doped
sodium alanate,” Materials Chemistry and Physics, vol. 134, no. 2-3, pp. 1197-1202, 2012.
[37] T. Wang, J. Wang, A. D. Ebner, J. A. Ritter, “Reversible hydrogen storage properties of
NaAlH4 catalyzed with scandium,” Journal of Alloys and Compounds, vol. 450, no. 1-2, pp.
293-300, 2008.
[38] K. J. Gross, E. H. Majzoub, S. W. Spangler, “The effects of titanium precursors on
hydriding properties of alanates,” Journal of Alloys and Compounds, vol. 356, pp. 423-428,
2003.
[39] X. D. Kang, P. Wang, H. M. Cheng, “In situ formation of Ti hydride and its catalytic effect
in doped NaAlH4 prepared by milling NaH/Al with metallic Ti powder,” International
Journal of Hydrogen Energy, vol. 32, no. 14, pp. 2943-2948, 2007.
[40] X. Zhang, Y. F. Liu, K. Wang, M. X. Gao, H. G. Pan, “Remarkably improved hydrogen
storage properties of nanocrystalline TiO2-modified NaAlH4 and evolution of Ti-containing
Page 20
Research Manuscript Template Page 20 of 37
species during dehydrogenation/hydrogenation,” Nano Research, vol. 8, no. 2, pp. 533-545,
2015.
[41] G. K. P. Dathara, D. S. Mainardi, “Structure and dynamics of Ti–Al–H compounds in Ti-
doped NaAlH4,” Molecular Simulation, vol. 34, no. 2, pp. 201-210, 2008.
[42] G. K. P. Dathar, D. S. Mainardi, “Kinetics of hydrogen desorption in NaAlH4 and Ti-
containing NaAlH4,” Journal of Physical Chemistry C, vol. 114, no. 17, pp. 8026-8031,
2010.
[43] J. Íñiguez, T. Yildirim, “First-principles study of Ti-doped sodium alanate surfaces,”
Applied Physics Letters, vol. 86, no. 10, pp. 103109, 2005.
[44] Z. H. Ren, X. Zhang, Z. G. Huang et al., “Controllable synthesis of 2D TiH2 nanoflakes
with superior catalytic activity for low-temperature hydrogen cycling of NaAlH4,”
Chemical Engineering Journal, vol. 427, article 131546, 2022.
[45] X. Zhang, Z. H. Ren, X. L. Zhang et al., “Triggering highly stable catalytic activity of
metallic titanium for hydrogen storage in NaAlH4 by preparing ultrafine nanoparticles,”
Journal of Materials Chemistry A, vol. 7, no. 9, pp. 4651-4659, 2019.
[46] US Department of Energy, “DOE Technical Targets for Onboard Hydrogen Storage for
Light-Duty Vehicles. https://www.energy.gov/eere/ fuelcells/doe-technical-targets-onboard-
hydrogen-storage-light-duty-vehicles,” US Washington DC, 2016.
[47] X. Zhang, R. Y. Wu, Z. Y. Wang et al., “Preparation and catalytic activity of a novel
nanocrystalline ZrO2@C composite for hydrogen storage in NaAlH4,” Chemistry-An Asian
Journal, vol. 11, no. 24, pp. 3541-3549, 2016.
[48] Y. F. Liu, C. Liang, H. Zhou et al., “A novel catalyst precursor K2TiF6 with remarkable
synergetic effects of K, Ti and F together on reversible hydrogen storage of NaAlH4,”
Chemical Communications, vol. 47, no. 6, pp. 1740-1742, 2011.
Page 21
Research Manuscript Template Page 21 of 37
[49] L. Li, Y. Wang, F. Y. Qiu et al., “Reversible hydrogen storage properties of NaAlH4
enhanced with TiN catalyst,” Journal of Alloys and Compounds, vol. 566, pp. 137-141,
2013.
[50] N. H. Idris, A. S. K. Anuar, N. A. Ali, M. Ismail, “Effect of K2NbF7 on the hydrogen
release behaviour of NaAlH4,” Journal of Alloys and Compounds, vol. 851, article 156686,
2021.
[51] J. F. Mao, Z. P. Guo, H. K. Liu, “Improved hydrogen sorption performance of NbF5-
catalysed NaAlH4,” International Journal of Hydrogen Energy, vol. 36, no. 22, pp. 14503-
14511, 2011.
[52] N. S. Mustafa, M. S. Yahya, N. Sazelee, N. A. Ali, M. Ismail, “Dehydrogenation properties
and catalytic mechanism of the K2NiF6-doped NaAlH4 system,” ACS Omega, vol. 3, no. 12,
pp. 17100-17107, 2018.
[53] N. Sazelee, N. S. Mustafa, M. S. Yahya, M. Ismail, “Enhanced dehydrogenation
performance of NaAlH4 by the addition of spherical SrTiO3,” International Journal of
Energy Research, vol. 45, no. 6, pp. 8648-8658, 2021.
[54] X. L. Fan, X. Z. Xiao, L. X. Chen et al., “Hydriding-dehydriding kinetics and the
microstructure of La- and Sm-doped NaAlH4 prepared via direct synthesis method,”
International Journal of Hydrogen Energy, vol. 36, no. 17, pp. 10861-10869, 2011.
[55] D. E. Mencer, T. R. Hess, T. Mebrahtu, D. L. Cocke, D. G. Naugle, “Surface reactivity of
titanium–aluminum alloys: Ti3Al, TiAl, and TiAl3,” Journal of Vacuum Science &
Technology A: Vacuum, Surfaces, and Films, vol. 9, no. 3, pp. 1610-1615, 1991.
[56] X. Zhang, Y. F. Liu, Z. H. Ren et al., “Realizing 6.7 wt% reversible storage of hydrogen at
ambient temperature with non-confined ultrafine magnesium hydrides,” Energy &
Environmental Science, vol. 14, no. 4, pp. 2302-2313, 2021.
Page 22
Research Manuscript Template Page 22 of 37
[57] J. P. Perdew, K. Burke, M. Ernzerhof, “Generalized gradient approximation made simple,”
Physical Review Letters, vol. 77, no. 18, pp. 3865-3868, 1996.
[58] P. E. Blochl, “Projector augmented-wave method,” Physical Review B, vol. 50, no. 24, pp.
17953-17979, 1994.
[59] G. Henkelman, B. P. Uberuaga, H. Jónsson, “A climbing image nudged elastic band method
for finding saddle points and minimum energy paths,” Journal of Chemical Physics, vol.
113, pp. 9901-9904, 2000.
Figure 1. Comparison of hydrogen desorption (a) and absorption (b) performance of NaAlH4 doped with various Ti-
based catalysts.
a b
80 100 120 140 160 1802.5
3.0
3.5
4.0
4.5
5.0
TiN[30]
TiB2[29]
Ti3C2[31]
TiB2[29]
Ti[45]
TiB2[36]
TiCl3[35]
Ti[39]
This work
TiB2[25]
TiO2[19]
Ti3C2[21]
Ti3C2[22]
TiCl4[17]
TiB2[25]
TiN[24]
TiO2[19]
TiN[23]
TiB2[23]
TiCl3[16]
TiF3[18]
Ti[26]
TiH2[27]
TiC[20]H2 c
ap
ac
ity
(w
t%)
Desorption temperature (C)
TiN[30]
Ti3C2[31]
20 40 60 80 100 120 140 1603.0
3.5
4.0
4.5
5.0 TiB2[29]
TiN[30]
Ti3C2[31]
TiO2[40]
Ti[45]
TiO2[16]
TiC[28]
TiH2[39]
Ti[39]
TiCl3[35]
TiF3[35]
TiF3[35]
This work
TiN[28]
TiC[20]
TiN[23]
Ti3C2[22]
Al3Ti[28]
TiO2[28]
Ti[28]
TiCl3[16]
TiCl4[17]
TiF3[18]
TiB2[23]
H2 c
ap
ac
ity
(w
t%)
Absorption temperature (C)
Page 23
Research Manuscript Template Page 23 of 37
Figure 2. Schematic illustration for the preparation process of TiH2 nanoplates.
Figure 3. (a) XRD pattern, (b) EDS spectrum, (c) TPD-MS signal and (d) TGA curve of as-prepared solid products
of the sonochemical reaction between TiCl4 and LiH in THF.
Raw materials
Ultrasonication
Filtration
TiCl4LiH
TiH2
LiCl
THF
Drying
40 80 120 160 200 240
96
97
98
99
100
Tempreture (C)
Weig
ht
loss (
wt
%)
100 200 300 400 500
Temperature (C)
Inte
nsit
y (
a.u
.)
H2-signal
10 20 30 40 50 60 70 80 90
Inte
nsit
y (
a.u
.)
2()
a
d
b
c
0 1 2 3 4 5 6 70
2000
4000
6000
8000
10000
12000
14000
Co
un
ts
Energy (keV)
Ti
ClTi
Ti
C
O
Page 24
Research Manuscript Template Page 24 of 37
Figure 4. (a) TEM image, (b) EDS mapping, (c) HRTEM image and (d) AFM image of NP-TiH2@G. Inset on (a) is
the corresponding particle size distribution.
200 nm
5 nm
250 nm
20 40 60 80 1000
5
10
15
20
25
30
35
Fra
cti
on
(%
)
Size (nm)
Mean size = 48 nmTi
C TiC
a b
c d
17 nm
13 nm
Page 25
Research Manuscript Template Page 25 of 37
Figure 5. TEM images of NP-TiH2@G with the ultrasonic time of 1 h (a,b), 2 h (c,d) and 4 h (e,f).
500 nm 100 nm
500 nm 100 nm
500 nm 100 nm
1 ha b
c 2 h
4 hfe
d
Page 26
Research Manuscript Template Page 26 of 37
Figure 6. (a) Volumetric release curves of NaAlH4 doped with NP-TiH2@G, (b) non-isothermal hydrogenation
curves and (c, d) SEM and corresponding EDS mapping of NaAlH4 mixed with 7 wt% (c) TiH2 nanoplates and (d)
commercial TiH2.
Figure 7. STEM and corresponding EDS mapping of as-milled (a) and activated (b) NaAlH4-7 wt% NP-TiH2@G
samples. The rectangular areas in (a) and (b) are taken for composition analysis.
50 100 150 200 250 300 350-6
-5
-4
-3
-2
-1
0
NaAlH4
+ 1 wt%
+ 3 wt%
+ 5 wt%
+ 7 wt%
+ 9 wt%
H/M
(w
t%)
Temperature (C)
a b
10 μm
TiAl
Nac
10 μm
TiAl
Nad
20 40 60 80 100 120
0
1
2
3
4
5 NaAlH4
+ 7 wt% (commercial TiH2 + G)
+ 7 wt% NP-TiH2@G
H/M
(w
t%)
Temperature (C)
20 nm
20 nm
a
b
Page 27
Research Manuscript Template Page 27 of 37
Figure 8. (a) Isothermal dehydrogenation curves, (b) isothermal TG curves, (c) isothermal hydrogenation curves and
(d) Kissinger's plots of activated NaAlH4-7 wt% NP-TiH2@G sample.
0 10 20-3
-2
-1
0
H/M
(w
t%)
Time (min)
0 100 200 300 400 500
95
96
97
98
99
100
Weig
ht
Lo
ss
(w
t%)
Time (min)
80 C
100 C
0 100 200 300 400 500 600 700 800
0
1
2
3
4
5
30 C
50 C
100 C
H/M
(w
t%)
Time (min)
0 100 200 300 400 500
-5
-4
-3
-2
-1
0 100 C
120 C
140 C
H/M
(w
t%)
Time (min)
a b
c d
2.30 2.35 2.40 2.45 2.50 2.55 2.60 2.65 2.70
-12.0
-11.5
-11.0
-10.5
-10.0
ln(
/Tm
2)
1000/Tm (K-1)
1st step
y=-9.62x+15.86
R2=0.997
Ea=80 3.3 kJ/mol
2nd step
y=-8.42x+10.32
R2=0.997
Ea=70 2.8 kJ/mol
Page 28
Research Manuscript Template Page 28 of 37
Figure 9. (a) Cycling tests operated at 140 ºC for dehydrogenation and 100 ºC/100 atm H2 for hydrogenation of
NaAlH4-7 wt% NP-TiH2@G, (b) TEM image, (c) STEM and corresponding EDS mapping images, (d) SEM and
corresponding images and (e) Ti 2p XPS spectra of NaAlH4-7 wt% NP-TiH2@G sample after 50 cycles.
462 460 458 456 454 452 450
Deh 51
Reh 50
Deh 02
Reh 01
Inte
nsit
y (
a.u
.)
Binding Energy (eV)
Ti 2p1/2
Ti 2p3/2
20 nm
20 nm 20 nm
Ti
20 nm
Al
20 nm
Na
10 μm
b c
d e
0 200 400 600 800 1000 1200 1400 1600 1800
5
4
3
2
1
0
H/M
(w
t%)
Dehydrogenation Hydrogenation
Time (min)
a
TiAl
Na
Page 29
Research Manuscript Template Page 29 of 37
Supplementary Materials
Titanium hydride nanoplates enable 5 wt% of reversible hydrogen storage by sodium
alanate below 80 °C
Zhuanghe Ren,1†
Xin Zhang,1†
Hai-Wen Li,2 Zhenguo Huang,
3 Jianjiang Hu,*,
4 Mingxia
Gao,1 Hongge Pan,*
,1,5 Yongfeng Liu*
,1,5
1State Key Laboratory of Silicon Materials and School of Materials Science and
Engineering, Zhejiang University, Hangzhou 310027, China. 2Hefei General Machinery Research Institute, Hefei 230031, China.
3School of Civil & Environmental Engineering, University of Technology Sydney, 81
Broadway, Ultimo, NSW, 2007, Australia. 4School of Chemistry and Chemical Engineering, Yantai University, Yantai 264005,
China. 5Institute of Science and Technology for New Energy, Xi’an Technological University,
Xi’an, 710021, China.
†These authors contributed equally to this work.
*Corresponding author. Email: [email protected] (Y.F.L.), [email protected] (J.J.H.),
[email protected] (H.G.P.)
Page 30
Research Manuscript Template Page 30 of 37
Figure S1. Raman spectrum of as-prepared solid product after sonochemical reaction between TiCl4 and LiH in THF.
Figure S2. H2 signal of TPD-MS of commercial micro-sized TIH2
800 1000 1200 1400 1600 1800 2000 2200
G-band
1590 cm-1D-band
1340 cm-1
Inte
ns
ity
(a
.u.)
Raman shift (cm-1)
100 200 300 400 500 600 700 800
Inte
nsit
y (
a.u
.)
Temperature (C)
560 oC
500 oC
Page 31
Research Manuscript Template Page 31 of 37
Figure S3. MS signal of gaseous product of reaction of TiCl4 with LiH in THF under ultrasonic treatment.
Figure S4. XRD profile of the solid obtained by drying the filtrate of reaction of TiCl4 with LiH in THF under
ultrasonic treatment.
0 10 20 30 40 50
Inte
ns
ity
(a
.u.)
m/Z
H2
Ar
THF
Ar
THF
10 20 30 40 50 60 70 80 90
LiCl
Inte
nsit
y (
a.u
.)
2()
Page 32
Research Manuscript Template Page 32 of 37
Figure S5. TEM image of pristine graphene.
Figure S6. SEM image of TiH2 prepared by sonochemical reaction of TiCl4 and LiH without graphene as support.
100 nm
200 nm
Page 33
Research Manuscript Template Page 33 of 37
Figure S7. XRD profiles of NaAlH4 doped by 7 wt% NF-TiH2@G prepared by different ultrasonic times.
Figure S8. SEM image of commercial TiH2.
10 20 30 40 50 60 70 80 90
1 h
2 h
Inte
ns
ity
(a
.u.)
2()
LiH
4 h
25 μm
Page 34
Research Manuscript Template Page 34 of 37
Figure S9. Ti 2p XPS spectra of NaAlH4 mixed with commercial TiH2 and TiH2 nanoplates.
Figure S10. XRD profiles of 7 wt% NF-TiH2@G-containing NaAlH4 after different treatments.
462 460 458 456 454 452 450
Ti-Al
Ti-Al
Inte
ns
ity
(a
.u.)
microscale TiH2
Binding Energy (eV)
TiH2
NP-TiH2@G
Ti-Al
10 20 30 40 50 60 70 80 90
*
*
* **
rehydrogenated sample
dehydrogenated sample
as-milled sample
Inte
ns
ity
(a
.u.)
2()
NaAlH4 NaH *Al
Page 35
Research Manuscript Template Page 35 of 37
Figure S11. The volumetric dehydrogenation curves of activated NaAlH4-7 wt% NP-TiH2@G sample.
Figure S12. XRD profiles of NaAlH4-7 wt% NP-TiH2@G sample after ball milling and 1st de/rehydrogenation cycle
(2θ: 39-44°).
40 60 80 100 120 140 160
-5
-4
-3
-2
-1
0
1st Dehydrogenation
2nd Dehydrogenation
3rd Dehydrogenation
H/M
(w
t%)
Temperature (C)
39 40 41 42 43 44
Inte
ns
ity
(a
.u.)
2()
Al-Ti
BM
Reh
Page 36
Research Manuscript Template Page 36 of 37
Figure S13. Energy barriers of H atom transferring from NaAlH4 molecule to Al surface (a) and single-Ti-substituted
Al surface (b) and relaxed geometry of NaAlH4 molecule placed on two-Ti-substituted Al surface (c).
Figure S14. TPD curves of activated NaAlH4-7 wt% NP-TiH2@G sample with different heating rates.
-0.4
-0.2
0.0
0.2
0.4
0.6
FS
TS (0.47)
En
erg
y (
eV
)
IS
-0.4
-0.2
0.0
0.2
0.4
0.6
En
erg
y (
eV
)
IS
TS (0.14)
FS
a bNa Al H Ti
c
50 75 100 125 150 175 200 225
Inte
ns
ity
(a
.u.)
Temperature (C)
8 C/min
4 C/min
2 C/min
1 C/min
Page 37
Research Manuscript Template Page 37 of 37
Figure S15. DSC curves of pristine NaAlH4 and NaAlH4-7 wt% NP-TiH2@G samples.
Table S1. Comparison of activation energy (Ea) of NaAlH4 doped with different catalysts.
Catalysts 1st-step Ea (kJ/mol) 2nd-step Ea (kJ/mol) References
K2TiF6 99.8 88.0 48
TiN 91.7 99.9 49
K2NbF7 84.6 75.1 50
NbF5 88.2 102.9 51
K2NiF6 89.9 99.6 52
SrTiO3 79 92 53
LaCl3 86.4 96.1 54
La3Al11 93.0 99.3 54
SmCl3 89.0 96.8 54
SmAl3 91.9 98.9 54
TiH2 nanoplates 80 70 This work
150 175 200 225 250 275 3004.0
3.5
3.0
2.5
2.0
1.5
1.0
0.5
0.0
-0.5e
nd
o
pristine NaAlH4
melting
2nd step
1st step
DS
C (
mW
/mg
)
Tempreture (C)50 75 100 125 150 175 200
0.8
0.6
0.4
0.2
0.0
1st step
2nd step
NaAlH4+7 wt%NP-TiH2@G
Tempreture (C)
en
do
DS
C (
mW
/mg
)
a b