TITANIUM OXIDE NANOTUBES DECORATED WITH RUTHENIUM OXIDE NANOPARTICLES FOR PHOTODEGRADATION OF MALACHITE GREEN, METHYLENE BLUE, AND INDIGO CARMINE by Jonathan Daniel Buford APPROVED BY SUPERVISORY COMITTTEE: Kenneth J. Balkus, Jr., Chair John P. Ferraris Paul Pantano
Transcript
TITANIUM OXIDE NANOTUBES DECORATED WITH RUTHENIUM OXIDE NANOPARTICLES FOR
PHOTODEGRADATION OF MALACHITE GREEN, METHYLENE BLUE, AND INDIGO CARMINE
by
Jonathan Daniel Buford
APPROVED BY SUPERVISORY COMITTTEE:
Kenneth J. Balkus, Jr., Chair
John P. Ferraris
Paul Pantano
Copyright 2018
Jonathan Daniel Buford
All Rights Reserved
I dedicate this to my family and friends who have loved and supported me
TITANIUM OXIDE NANOTUBES DECORATED WITH RUTHENIUM OXIDE NANOPARTICLES FOR
PHOTODEGRADATION OF MALACHITE GREEN, METHYLENE BLUE, AND INDIGO CARMINE
by
Jonathan Daniel Buford, BS
THESIS
Presented to the Faculty of
The University of Texas at Dallas
in Partial Fulfillment
of the Requirements
for the Degree of
MASTER OF SCIENCE IN
CHEMISTRY
THE UNIVERSITY OF TEXAS AT DALLAS
December 2018
v
ACKNOWLEDGEMENTS
I would like to thank my research supervisor, Dr. Kenneth J. Balkus Jr., for his guidance
throughout my graduate student career. The knowledge that he has imparted to me, as well as
the learning environment, has allowed me to understand chemistry. The knowledge that I was
able to obtain in his lab not only helped to further my comprehension of chemistry, but my
understanding of how it applies to the real world. I am grateful for the advice he has given me
and to have been a part of his lab during my time at UTD. I would also like to express my
appreciation for Dr. John P. Ferraris for also advancing my knowledge by providing another
perspective for my research and results. While here, he has also helped immensely by allowing
me to use his instruments and facilities to conduct my experiments. I would like to express
thanks to Dr. Duck J. Yang and Dr. Paul Pantano for providing helpful suggestions during
meetings that have guided me.
Another group of people I would like to thank are the members of the Balkus lab, who have
during my time at UTD helped me via consulting for research projects, while also being
supportive and making my time in the lab memorable. My appreciation also goes out to Betty
Maldonado, Dr. George D. McDonald, and Dr. Winston Layne of the chemistry department
staff. Lastly, I would like to thank my mother Sherry Buford, my father Richard Buford, and my
brother Landon Buford for their love and support.
November 2018
vi
TITANIUM OXIDE NANOTUBES DECORATED WITH RUTHENIUM OXIDE NANOPARTICLES FOR
PHOTODEGRADATION OF MALACHITE GREEN, METHYLENE BLUE, AND INDIGO CARMINE
Jonathan Daniel Buford, MS
The University of Texas at Dallas, 2018
Supervising Professor: Kenneth J. Balkus, Jr. Titanium dioxide (TiO2) is the most widely studied material for photodegradation of organic
contaminants thanks to its activity as well as the abundance, low-cost, and multiple
nanostructures (particles, rods, and tubes). TiO2 nanotubes are of interest because of their high
surface area and have been modified with many metal-based nanoparticles to increase
photocatalytic activity. In this thesis TiO2 nanotubes decorated with 1-5nm diameter ruthenium
oxide (RuO2) nanoparticles were investigated. TiO2 nanotubes decorated with green ruthenium
oxide nanoparticles were successfully synthesized. The interaction between the RuO2
nanoparticles and TiO2 nanotubes (TNTs) shifted the XPS Ti 2p3/2 peak spectra to a lower
binding energy, supporting that the nanoparticles were bound to the TNTs. The RuO2-decorated
TNTs were tested as photocatalysts for the photodegradation of three dyes: malachite green
(cationic dye), methylene blue (cationic dye), and indigo carmine (anionic dye). The malachite
green and methylene blue dyes adsorbed well to the surface of the RuO2-decorated TNTs and
vii
were degraded in 120 min and 240 min respectively. The indigo carmine dye did not display
significant adsorption for the RuO2-decorated TNTs, which had slower photodegradation than
the bare TNTs, due to the anionic nature of the dye. The indigo carmine was only degraded to
about 40% after 240 min. Overall the RuO2 decorated TNTs performed best in cationic dyes
where superior adsorption was displayed compared to the bare TNTs and previously reported
RuO2 decorated TiO2 nanoparticles, but lower photodegradation rates were observed.
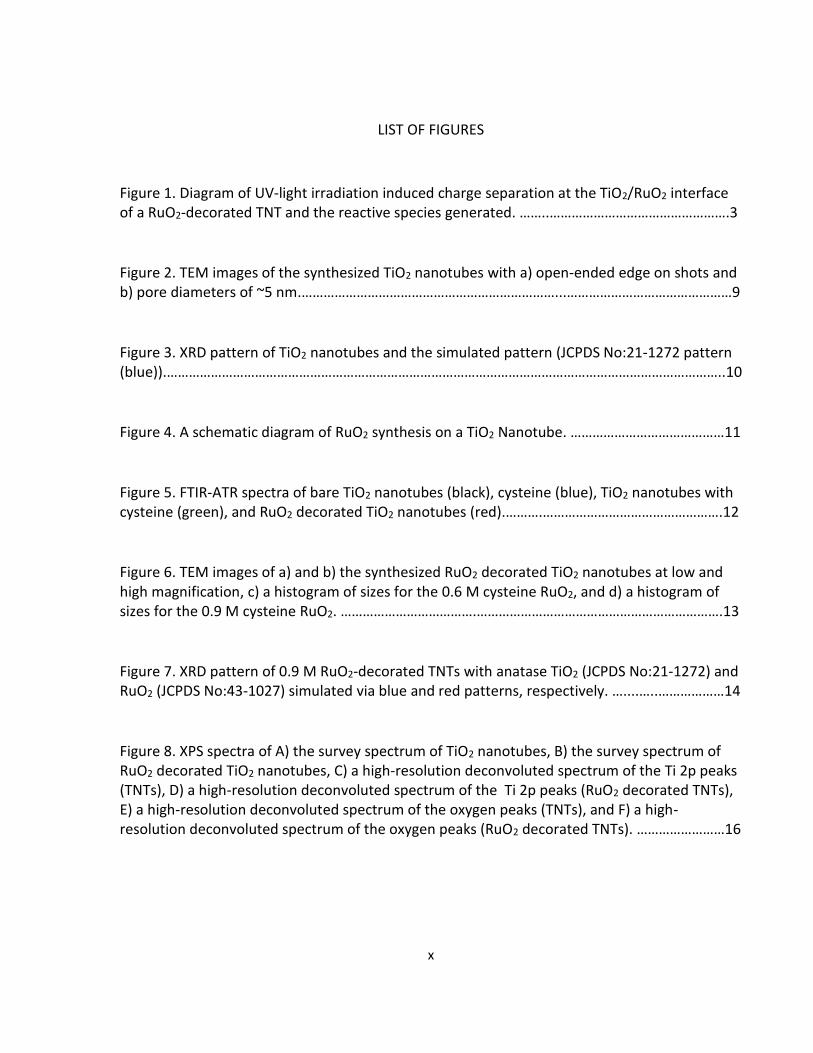
Figure 1. Diagram of UV-light irradiation induced charge separation at the TiO2/RuO2 interface of a RuO2-decorated TNT and the reactive species generated. ……..………………………………………….3
Figure 2. TEM images of the synthesized TiO2 nanotubes with a) open-ended edge on shots and b) pore diameters of ~5 nm.……………………………………………………………...………………………………………9
Figure 3. XRD pattern of TiO2 nanotubes and the simulated pattern (JCPDS No:21-1272 pattern (blue)).……………………………………………………………………………………………………………………………………..10
Figure 4. A schematic diagram of RuO2 synthesis on a TiO2 Nanotube. ……………………………………11
Figure 5. FTIR-ATR spectra of bare TiO2 nanotubes (black), cysteine (blue), TiO2 nanotubes with cysteine (green), and RuO2 decorated TiO2 nanotubes (red).……….………………………………………….12
Figure 6. TEM images of a) and b) the synthesized RuO2 decorated TiO2 nanotubes at low and high magnification, c) a histogram of sizes for the 0.6 M cysteine RuO2, and d) a histogram of sizes for the 0.9 M cysteine RuO2. ……………………………….………………………………………………………….13
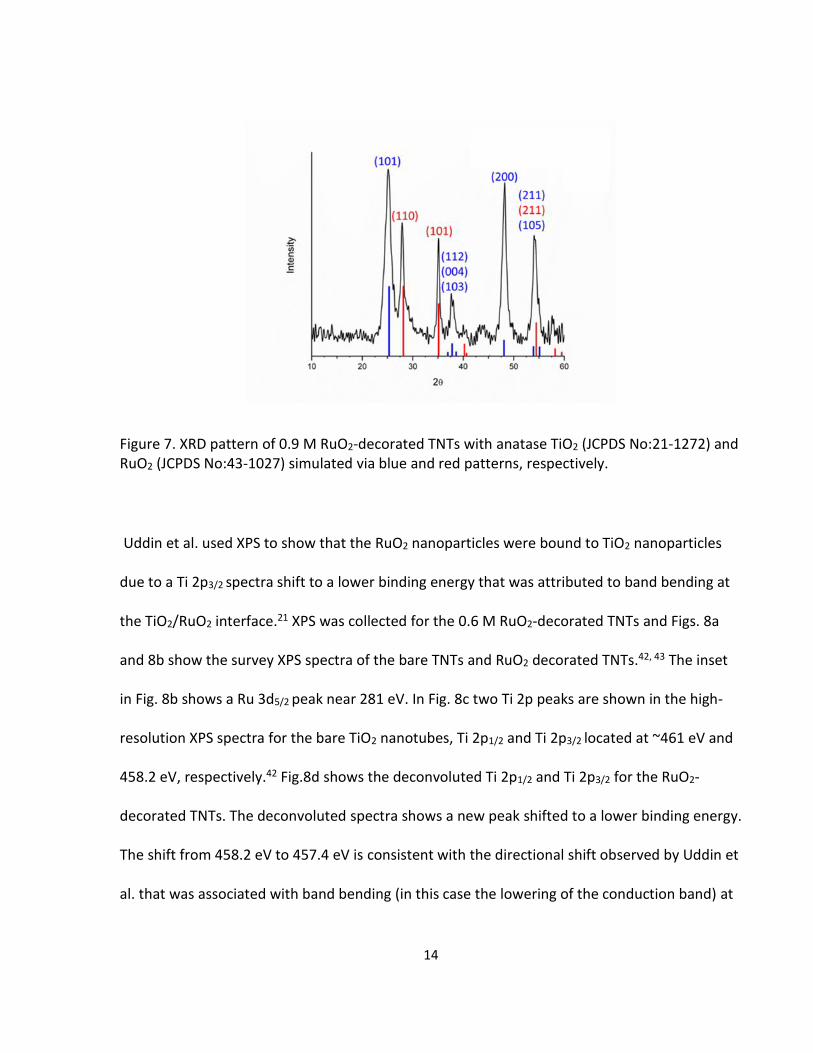
Figure 7. XRD pattern of 0.9 M RuO2-decorated TNTs with anatase TiO2 (JCPDS No:21-1272) and RuO2 (JCPDS No:43-1027) simulated via blue and red patterns, respectively. …....…..………………14
Figure 8. XPS spectra of A) the survey spectrum of TiO2 nanotubes, B) the survey spectrum of RuO2 decorated TiO2 nanotubes, C) a high-resolution deconvoluted spectrum of the Ti 2p peaks (TNTs), D) a high-resolution deconvoluted spectrum of the Ti 2p peaks (RuO2 decorated TNTs), E) a high-resolution deconvoluted spectrum of the oxygen peaks (TNTs), and F) a high-resolution deconvoluted spectrum of the oxygen peaks (RuO2 decorated TNTs). ……………………16
xi
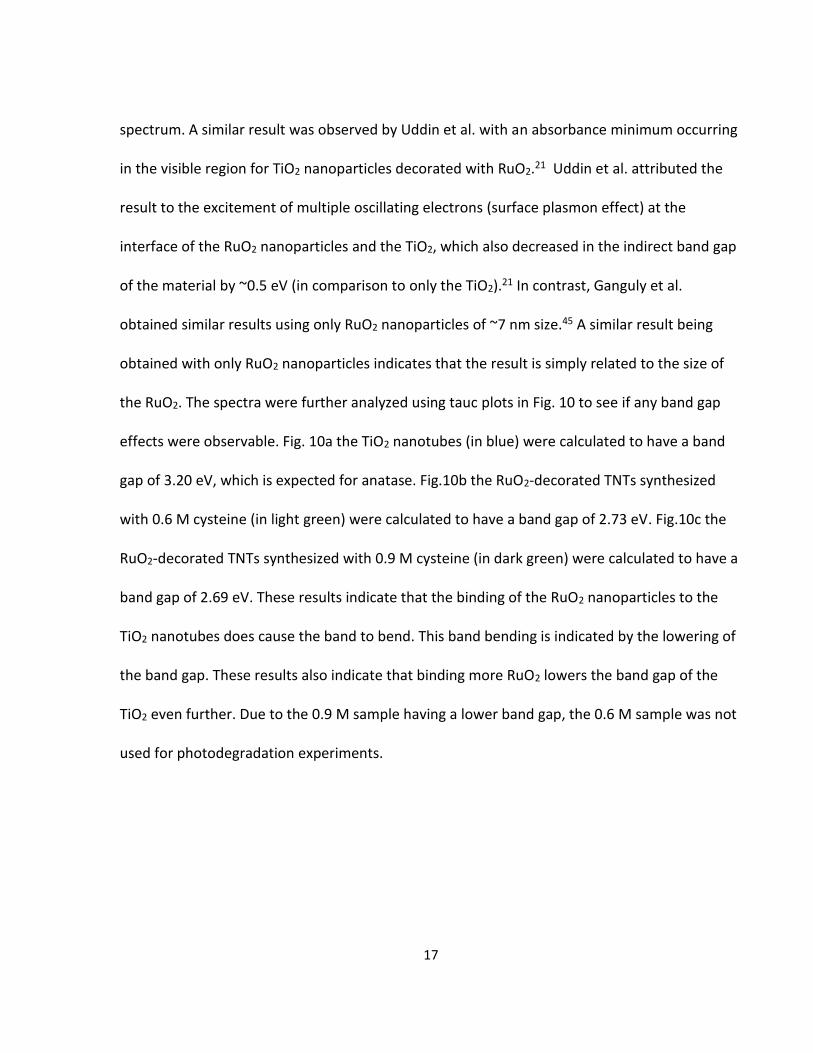
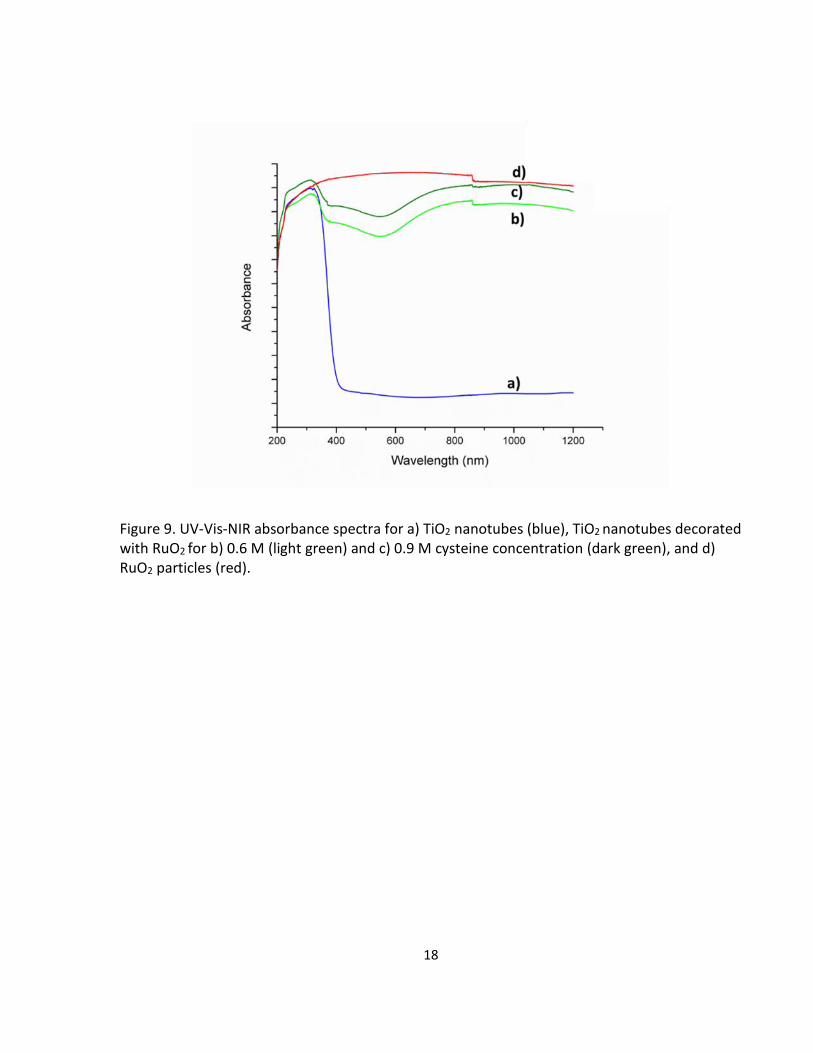
Figure 9. UV-Vis-NIR absorbance spectra for a) TiO2 nanotubes (blue), TiO2 nanotubes decorated with RuO2 for b) 0.6 M (light green) and c) 0.9 M (dark green) cysteine concentration, and d) RuO2 particles (red). ………………………………………………..………………….……………………………….18
Figure 10. Tauc plot modeling the band gaps of a) TiO2 nanotubes, b) TNTs-decorated with RuO2 nanoparticles synthesized with 0.6 M cysteine concentration, and c) TNTs-decorated with RuO2 nanoparticles synthesized with 0.9 M cysteine concentration. ………………..……………………………..19
Figure 11. Plot displaying the dye concentration vs. irradiation time for the degradation of malachite green (inset) with TiO2 nanotubes and TiO2 nanotubes decorated with RuO2. ….…….20
Figure 12. Plot displaying the dye concentration vs. irradiation time for the degradation of 50 ppm methylene blue (inset) with TiO2 nanotubes and TiO2 nanotubes decorated with RuO2. …22
Figure 13. Plot displaying the dye concentration vs irradiation time for the degradation of indigo carmine with TiO2 nanotubes and TiO2 nanotubes decorated with RuO2. ……………………………….24
The amount of fresh water available on the planet is only about 2.5% of the total water
amount, therefore the purification of contaminated water is an important area of research.1
Organic dyes from textiles and water-treatments are common types of pollutants that are
released into the environment as wastewater.2-3 Many organic dyes are a threat to the health
of plants, animals, and people.2-3 A widely used method to treat various organic contaminants is
photocatalysis.4-6 Titanium dioxide has been the most studied material for photocatalysis since
the splitting of water was detected on TiO2 electrodes by Fujishima and Honda.7 When TiO2 is
irradiated by UV-light, electrons and holes are produced which act as reductants and oxidants,
respectively.7-11 This results in the formation of reactive oxygen species such as the hydroxyl
radical (OH•), singlet oxygen (1O2) and the superoxide anion (O2•-), which breakdown organic
contaminants.9-10 TiO2 is favored for photocatalysis due to its resistance to photocorrosion,
abundance, low-toxicity, and low cost. The ability to separate electron-hole pairs depends on
the nature of the band gap. TiO2 has multiple crystalline phases. The most common crystalline
phases are rutile and anatase. Rutile has a direct band gap of 3.0 eV while anatase has an
indirect band gap of 3.2 eV which makes anatase the preferred crystalline phase.11-14 Different
TiO2 morphologies including nanoparticles, nanorods, and nanotubes have been studied to
increase the surface area and photocatalytic activity.11, 15-16 Nanotubes have the highest surface
area of the three morphologies (~345 m2/g) allowing for more reactive surfaces to be
2
available.11, 13, 17 Although TiO2 has many benefits for photocatalysis it also has shortcomings.
The large band gap makes it difficult to utilize sunlight energy.8, 18-21
In order to enhance the photocatalytic performance of TiO2 the attachment of various types of
nanoparticles have been studied.18-19, 21-23 One of the more interesting nanoparticle materials
that has been studied is ruthenium oxide.24-25 Ruthenium oxide is known to be an efficient
water oxidation catalyst.26-27 Ruthenium oxide was recently shown to improve the performance
of the TiO2 by serving as a metal-like material heightening charge separation, which helps
generate more radical species.21 The improved charge separation occurs because of bending
energy bands caused by electron transfer between TiO2 and RuO2 to balance the Fermi level.21
RuO2 has a low band gap of 2.2 eV, which absorbs in the visible light region.28 Upon UV
irradiation the RuO2 would form additional reactive species because of the transfer of
photogenerated holes from the TiO2, as shown in Fig. 1.21 These photogenerated holes are
produced from electrons excited from the TiO2 valence band (Evb) to the conduction band (Ecb)
near the fermi level. Uddin et al. reported TiO2 nanoparticles decorated with RuO2 to degrade
methylene blue.21 Bavykin et al also used RuO2-decorated TNTs to degrade alcohols.24 Our
study will center on photocatalysis of dye based contaminants that have not been tested using
TNTs-decorated with RuO2 nanoparticles. Our expectations of improved catalytic activity and
the overall scarcity of studies on TNTs paired with RuO2 nanoparticles prompted our research of
using TiO2 nanotubes decorated with RuO2 nanoparticles for photocatalysis of other dyes
focusing on differences in size and charge, as it has not been researched yet with these types of
materials.24-25
3
Figure 1. Diagram of UV-light irradiation induced charge separation at the TiO2/RuO2 interface of a RuO2-decorated TNT and the reactive species generated.
The cationic dyes that were tested included malachite green and methylene blue (Table 1).
Malachite green is used as a fungicide, an ectoparasiticide, and has a max absorption
wavelength near 616 nm.2, 29-30 Methylene blue, which is used as a textile dye, has a max
absorption wavelength near 660 nm.19, 31-37 In addition to the two cationic dyes of malachite
green and methylene blue one anionic dye indigo carmine was tested. Indigo carmine is used as
a food dye and has a max absorption wavelength at about 610 nm (Table 1).38 All of the dyes
will be in between pH 8 and pH 6 in order to mimic polluted waste streams.39 The hydroxyl
radicals are more common at neutral and high pH levels; while positively charged holes are
more prevalent at low pH levels.33, 40 Controlling the pH is also important because the pH of the
dye solution affects the surface chemistry of the TiO2. If the pH of the solution is above the
4
isoelectric point (pI) the surface of the TiO2 will be negatively charged, while the surface will be
positively charged if the solution’s pH is below the pI.19 As shown in equations (1) and (2):
(1) pH > pI: Ti-OH + OH- ↔TiO- + H2O
(2) pH < pI: Ti-OH + H+ ↔TiOH2+
Equation (1) and (2) refer to basic and acidic media respectively.19 The pI of TiO2 is typically
around 6, but TiO2 nanotubes have been shown to have negatively charged surfaces at the
same pH and lower.33, 36, 40 The pI for RuO2 is 5.2, so the RuO2 is expected to be negatively
charged while in the dye solutions.41 The charge state of TiO2 and RuO2 will be highly influential
on the effectiveness of the RuO2-decorated TNT catalyst in the cationic and anionic dyes.
5
CHAPTER 2
MATERIALS AND METHODS
2.1 Materials
All reagents were utilized as received without additional purification. Titanium oxide, Aeroxide®
P25 was purchased from Acros Organics. The sodium hydroxide pellets were purchased from
Macron. The 12M hydrochloric acid was purchased from Fisher Scientific. The cysteine (≥97%)
was purchased from SAFC. The ruthenium (III) chloride hydrate was purchased from Pressure
Chemical Company. The malachite green oxalate (>90%) was purchased from Avocado Research
Chemicals. The methylene blue was purchased from Allied Chemical. The indigo carmine (98%)
was purchased from Sigma-Aldrich.
2.2 TiO2 Nanotube Synthesis
0.5 g of TiO2/P25 was dispersed in 30 mL of DI water. Once a homogenous solution was
obtained 10.5 g of NaOH were added to the solution. The solution was poured into a 40 ml
Teflon liner and sealed in an autoclave for 24 h at 150 °C. The sample was then washed with DI
water to a pH ~ 8.5 and then washed with 0.1 M HCl. The sample was dried at 85 °C in air and
then annealed at 280 °C for 80 min.
2.3 Cysteine Treatment
3.2713 g of cysteine are dispersed in 30 mL of DI water to obtain a concentration of 0.9M. 0.25
grams of TiO2 nanotubes are then added to the solution and stirred for 1 h in the dark. The
6
solution is centrifuged and washed with DI water three times to remove excess cysteine. The
sample was then dried in air at 85°C. The same procedure was followed for the 0.6 M sample,
2.1809 g of cysteine are used.
2.4 Attachment of RuO2 Nanoparticles
0.0188 g of RuCl3∙nH2O were dissolved in 20 mL of DI water and stirred at room temperature for
30 min. 0.125 g of cysteine-treated TiO2 nanotubes were added to solution and stirred for 2 h.
The solution was centrifuged and washed with DI water 3 times to remove unbound ruthenium.
The ruthenium-treated TiO2 nanotubes were mixed with 3 mL of a 1 M solution of NaOH and
stirred for 2 h. The solution was centrifuged and washed again and dried in air at 85 °C. The
sample was annealed at 250 °C for 80 min in air.
2.5 Dye Degradation
A 25 ppm solution was prepared by dissolving 0.025 g of each dye in 1 L of deionized water. For
the photodegradation experiments 0.020 g of catalyst and 100 mL of dye solution were used for
each trial. The reaction vessel was a 250-mL quartz round-bottom flask that was 20 cm from the
light source. The experiment was done in a dark box with a water-cooled 450-W Hanovia quartz
mercury UV-lamp. The solutions were irradiated for at most 240 min., with time zero being
after the catalyst had been stirred in the dye solution for 1 h.
7
Table 1. Dye Solution Properties
Dye λmax
(nm)
Conc.
(ppm)
in
water
Initial pH
Malachite Green
616 25 6.22
Methylene Blue
660 25 6.02
Indigo Carmine
610 25 7.60
8
2.6 Characterizations
X-ray powder diffraction (XRD) was conducted on a Rigaku Ultima IV utilizing copper K-alpha
radiation. The transmission electron microscopy (TEM) images were taken on a FEI CM200 FEG
transmission electron microscope operating at 200 kV. Infrared spectra were obtained via
Fourier transform infrared attenuated total reflection spectroscopy (FTIR-ATR) with a
Nicolet380 FT-IR SmartOrbit ATR model spectrometer. X-ray photoelectron spectroscopy was
conducted using a Perkin-Elmer PHI System equipped with an Al K-alpha X-ray source at a
chamber base pressure of 1.5 × 10⁻⁹ Torr. The spectra were recorded with a 16-channel
detector using a hemispherical analyzer. A Perkin-Elmer Lambda 900 UV-Vis-NIR
spectrophotometer was used for the collection of the UV-vis-NIR reflectance spectra.
9
CHAPTER 3
RESULTS AND DISCUSSION
3.1 Characterization of TiO2 nanotubes and RuO2-decorated TiO2 nanotubes
Fig. 2a shows TEM images of the as-synthesized TiO2 nanotubes that are ~10 nm in diameter as
well as, having a hollow-core with open ends. The TiO2 nanotubes are multi-walled with pores
of ~5 nm as shown by the TEM image in Fig.2b.
Figure 2. TEM images of the synthesized TiO2 nanotubes at low and high magnification.
The lattice fringes in corresponding to the TiO2 nanotubes TEM images show the ordered
nature of the TiO2 nanotubes confirmed by the X-ray diffraction in Fig.3 which shows the
10
nanotubes are anatase. The crystalline peaks match with the simulated pattern (JCPDS No:21-
1272) indicating the anatase crystalline phase. N2 adsorption results in a Brunauer–Emmett–
Teller (BET) surface area of 285 m2/g. TiO2/P25 nanoparticles have a surface area of ~70 m2/g.21
Figure 3. XRD pattern of TiO2 nanotubes and the simulated pattern (JCPDS No:21-1272 pattern (blue)).
In order to control the size of the RuO2 nanoparticles a cysteine linker is first bound to the TiO2
nanotubes as shown in Fig.4. This method was implemented by Ratanatawanate et al. to
control the sizes of PbS and CuS nanoparticles with more cysteine yielding bigger
nanoparticles.18-19
11
Figure 4. A schematic diagram of RuO2 synthesis on a TiO2 nanotube.
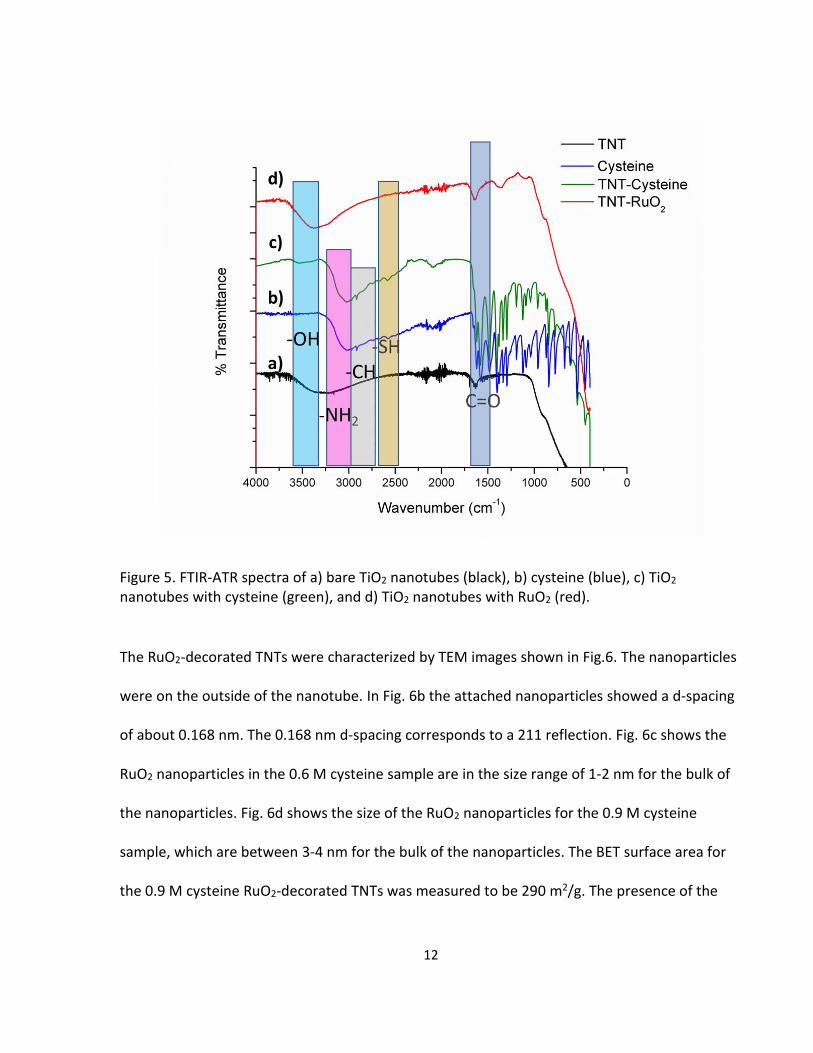
The spectrum in Fig. 5a shows is for bare TiO2 nanotubes with a band near 3300cm-1 which is
characteristic of hydroxyl groups from water. The spectrum in Fig. 5b shows bands near 3023
cm-1, 2915 cm-1, 2578 cm-1, and 1619 cm-1 which represent amine, methylene, thiol, and
carbonyl groups, respectively, that are characteristic of cysteine.18 The spectrum in Fig. 5c is for
TiO2 nanotubes with bound 0.6 M cysteine which shows similar bands to the pure cysteine
spectrum indicating the cysteine is bound, with the addition of a band near 3417 cm-1. This
band characteristic of a hydroxyl group and is being caused by water present on the TiO2
nanotubes.18 The red spectrum in Fig.5d is for 0.9 M RuO2-decorated TNTs and shows a
hydroxyl band near 3485 cm-1, which is associated with water.
12
Figure 5. FTIR-ATR spectra of a) bare TiO2 nanotubes (black), b) cysteine (blue), c) TiO2 nanotubes with cysteine (green), and d) TiO2 nanotubes with RuO2 (red).
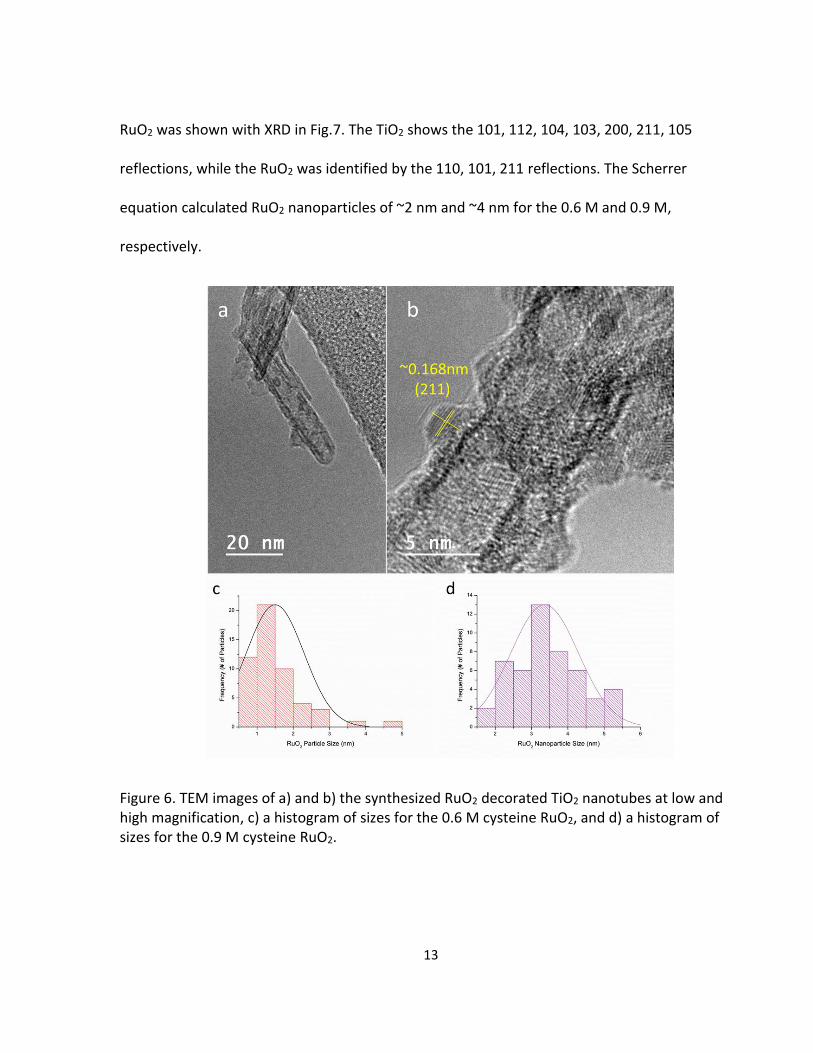
The RuO2-decorated TNTs were characterized by TEM images shown in Fig.6. The nanoparticles
were on the outside of the nanotube. In Fig. 6b the attached nanoparticles showed a d-spacing
of about 0.168 nm. The 0.168 nm d-spacing corresponds to a 211 reflection. Fig. 6c shows the
RuO2 nanoparticles in the 0.6 M cysteine sample are in the size range of 1-2 nm for the bulk of
the nanoparticles. Fig. 6d shows the size of the RuO2 nanoparticles for the 0.9 M cysteine
sample, which are between 3-4 nm for the bulk of the nanoparticles. The BET surface area for
the 0.9 M cysteine RuO2-decorated TNTs was measured to be 290 m2/g. The presence of the
13
RuO2 was shown with XRD in Fig.7. The TiO2 shows the 101, 112, 104, 103, 200, 211, 105
reflections, while the RuO2 was identified by the 110, 101, 211 reflections. The Scherrer
equation calculated RuO2 nanoparticles of ~2 nm and ~4 nm for the 0.6 M and 0.9 M,
respectively.
Figure 6. TEM images of a) and b) the synthesized RuO2 decorated TiO2 nanotubes at low and high magnification, c) a histogram of sizes for the 0.6 M cysteine RuO2, and d) a histogram of sizes for the 0.9 M cysteine RuO2.
14
Figure 7. XRD pattern of 0.9 M RuO2-decorated TNTs with anatase TiO2 (JCPDS No:21-1272) and RuO2 (JCPDS No:43-1027) simulated via blue and red patterns, respectively.
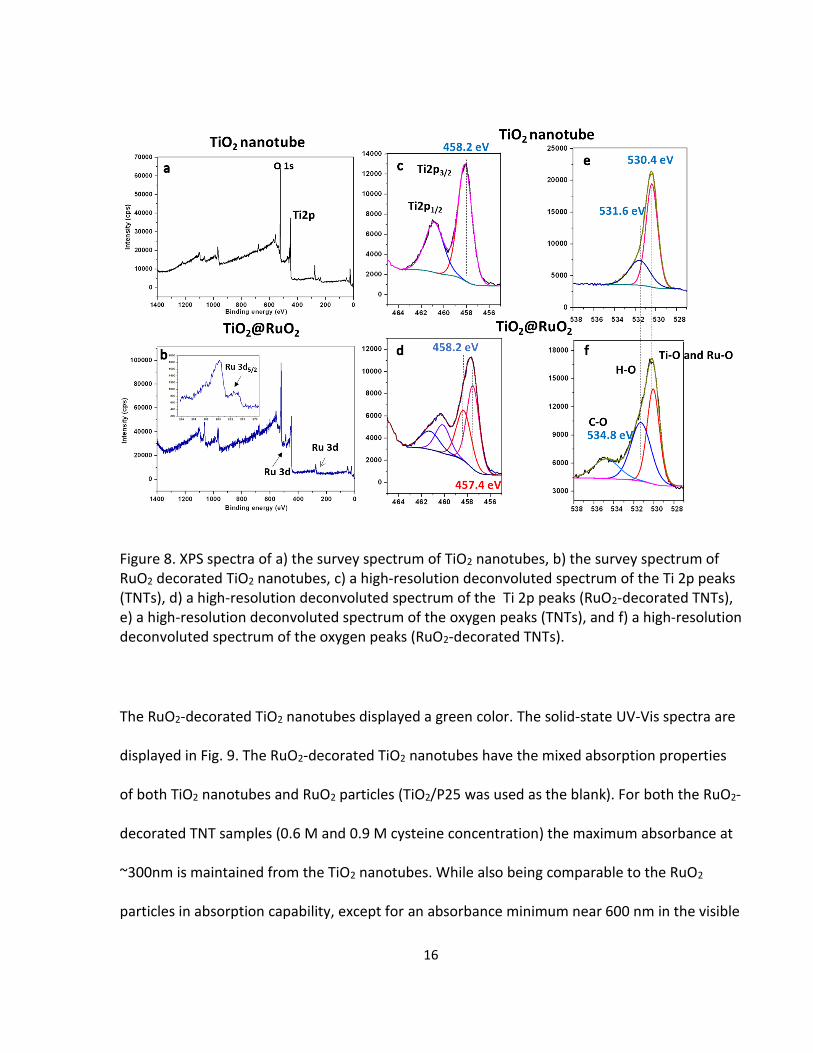
Uddin et al. used XPS to show that the RuO2 nanoparticles were bound to TiO2 nanoparticles
due to a Ti 2p3/2 spectra shift to a lower binding energy that was attributed to band bending at
the TiO2/RuO2 interface.21 XPS was collected for the 0.6 M RuO2-decorated TNTs and Figs. 8a
and 8b show the survey XPS spectra of the bare TNTs and RuO2 decorated TNTs.42, 43 The inset
in Fig. 8b shows a Ru 3d5/2 peak near 281 eV. In Fig. 8c two Ti 2p peaks are shown in the high-
resolution XPS spectra for the bare TiO2 nanotubes, Ti 2p1/2 and Ti 2p3/2 located at ~461 eV and
458.2 eV, respectively.42 Fig.8d shows the deconvoluted Ti 2p1/2 and Ti 2p3/2 for the RuO2-
decorated TNTs. The deconvoluted spectra shows a new peak shifted to a lower binding energy.
The shift from 458.2 eV to 457.4 eV is consistent with the directional shift observed by Uddin et
al. that was associated with band bending (in this case the lowering of the conduction band) at
15
the RuO2/TiO2 heterojunction, meaning the RuO2 nanoparticles are bound to the TiO2
nanotubes (a potential Ru-O-Ti bond).21 The heterojunction is a result of the TiO2 and RuO2
having different band gaps.21 This may result in charge transfer between their conduction
bands.19, 21 Fig.8e and 8f represent the oxygen present in both the bare TNTs and the RuO2
decorated TNTs. The TiO2 and RuO2 oxygen groups are both represented by the deconvoluted
peak at the 530.4 eV binding energy and the adsorbed water is represented by the
deconvoluted peak at the 531.6 eV binding energy for both Figs. 8e and 8f.42-43 In Fig. 8f a third
deconvoluted peak was at 534.8 eV which corresponds to a carbonyl group, this peak is either
the result of contamination or it is residual carbon from the cysteine.44
16
Figure 8. XPS spectra of a) the survey spectrum of TiO2 nanotubes, b) the survey spectrum of RuO2 decorated TiO2 nanotubes, c) a high-resolution deconvoluted spectrum of the Ti 2p peaks (TNTs), d) a high-resolution deconvoluted spectrum of the Ti 2p peaks (RuO2-decorated TNTs), e) a high-resolution deconvoluted spectrum of the oxygen peaks (TNTs), and f) a high-resolution deconvoluted spectrum of the oxygen peaks (RuO2-decorated TNTs).
The RuO2-decorated TiO2 nanotubes displayed a green color. The solid-state UV-Vis spectra are
displayed in Fig. 9. The RuO2-decorated TiO2 nanotubes have the mixed absorption properties
of both TiO2 nanotubes and RuO2 particles (TiO2/P25 was used as the blank). For both the RuO2-
decorated TNT samples (0.6 M and 0.9 M cysteine concentration) the maximum absorbance at
~300nm is maintained from the TiO2 nanotubes. While also being comparable to the RuO2
particles in absorption capability, except for an absorbance minimum near 600 nm in the visible
17
spectrum. A similar result was observed by Uddin et al. with an absorbance minimum occurring
in the visible region for TiO2 nanoparticles decorated with RuO2.21 Uddin et al. attributed the
result to the excitement of multiple oscillating electrons (surface plasmon effect) at the
interface of the RuO2 nanoparticles and the TiO2, which also decreased in the indirect band gap
of the material by ~0.5 eV (in comparison to only the TiO2).21 In contrast, Ganguly et al.
obtained similar results using only RuO2 nanoparticles of ~7 nm size.45 A similar result being
obtained with only RuO2 nanoparticles indicates that the result is simply related to the size of
the RuO2. The spectra were further analyzed using tauc plots in Fig. 10 to see if any band gap
effects were observable. Fig. 10a the TiO2 nanotubes (in blue) were calculated to have a band
gap of 3.20 eV, which is expected for anatase. Fig.10b the RuO2-decorated TNTs synthesized
with 0.6 M cysteine (in light green) were calculated to have a band gap of 2.73 eV. Fig.10c the
RuO2-decorated TNTs synthesized with 0.9 M cysteine (in dark green) were calculated to have a
band gap of 2.69 eV. These results indicate that the binding of the RuO2 nanoparticles to the
TiO2 nanotubes does cause the band to bend. This band bending is indicated by the lowering of
the band gap. These results also indicate that binding more RuO2 lowers the band gap of the
TiO2 even further. Due to the 0.9 M sample having a lower band gap, the 0.6 M sample was not
used for photodegradation experiments.
18
Figure 9. UV-Vis-NIR absorbance spectra for a) TiO2 nanotubes (blue), TiO2 nanotubes decorated with RuO2 for b) 0.6 M (light green) and c) 0.9 M cysteine concentration (dark green), and d) RuO2 particles (red).
19
Figure 10. Tauc plot modeling the band gaps of a) TiO2 nanotubes, b) TNTs-decorated with RuO2 nanoparticles synthesized with 0.6 M cysteine concentration, and c) TNTs-decorated with RuO2 nanoparticles synthesized with 0.9 M cysteine concentration.
3.2 Photocatalytic Activity
Figs. 11-13 show the results of the photodegradation and the 25 ppm degradation rates are
shown in Table 2 of the malachite green, methylene blue, and indigo carmine dyes at room
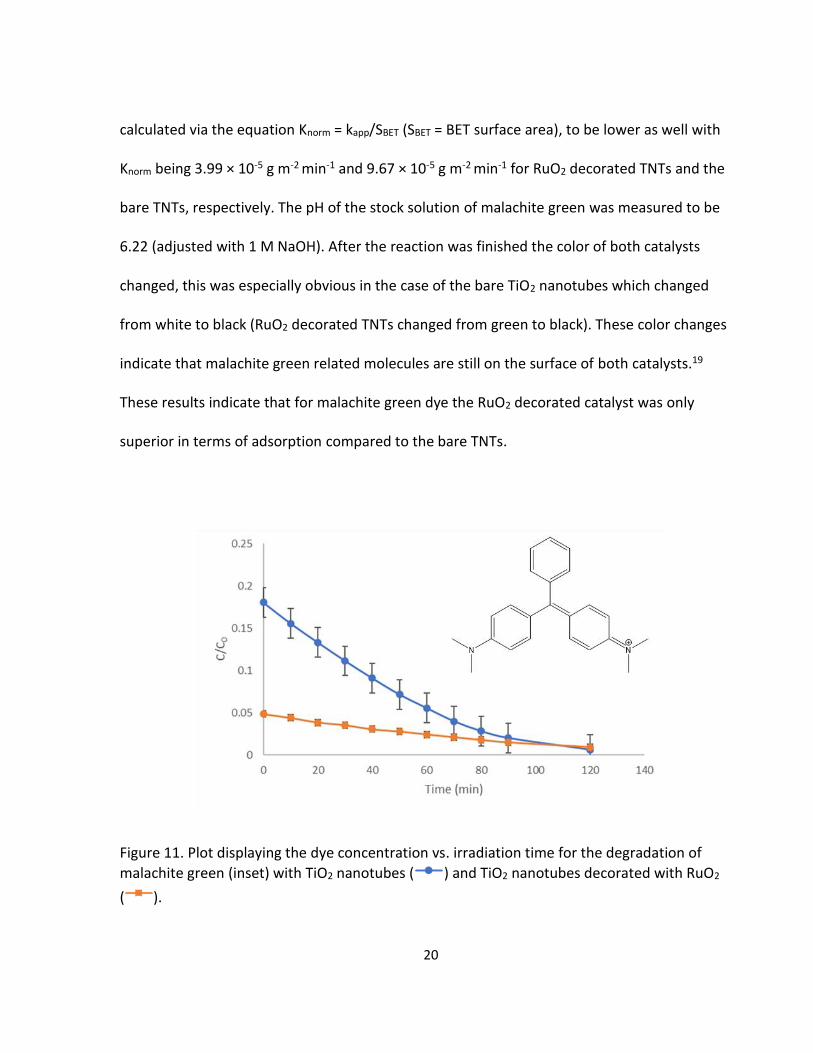
temperature. From Fig. 11, it is clear that after stirring in darkness for one hour the
concentration of the malachite green dye is nearly 15% less for the RuO2-decorated TNT
catalyst. This difference in dye concentration is attributed to the adsorption quality of the RuO2
decorated TNT catalyst. The bare TNT and RuO2-decorated TNT catalyst degraded the malachite
green dye by more than 95% after two hours. However, the applied reaction rate constant (kapp)
for the RuO2 decorated TNTs was 1.16 × 10⁻² min-1 and 2.76 × 10⁻² min-1 for the bare TNTs. The
lower kapp for the RuO2 decorated TNTs also makes the normalized reaction rate (Knorm),
20
calculated via the equation Knorm = kapp/SBET (SBET = BET surface area), to be lower as well with
Knorm being 3.99 × 10⁻⁵ g m-2 min-1 and 9.67 × 10⁻⁵ g m-2 min-1 for RuO2 decorated TNTs and the
bare TNTs, respectively. The pH of the stock solution of malachite green was measured to be
6.22 (adjusted with 1 M NaOH). After the reaction was finished the color of both catalysts
changed, this was especially obvious in the case of the bare TiO2 nanotubes which changed
from white to black (RuO2 decorated TNTs changed from green to black). These color changes
indicate that malachite green related molecules are still on the surface of both catalysts.19
These results indicate that for malachite green dye the RuO2 decorated catalyst was only
superior in terms of adsorption compared to the bare TNTs.
Figure 11. Plot displaying the dye concentration vs. irradiation time for the degradation of
malachite green (inset) with TiO2 nanotubes ( ) and TiO2 nanotubes decorated with RuO2
( ).
21
The superiority of the RuO2-decorated TNTs vs. the bare TNTs persist in 25 ppm methylene blue
photodegradation (not shown) where the dye concentration is about 0.80 lower than the bare
TNTs after stirring in darkness. The dye concentration percent is about the same as the
malachite green dye than what was shown in Fig. 11, despite the smaller size of methylene blue
molecules in comparison to the malachite green molecules. This indicates that the size of the
dye does not affect the adsorption of the dye significantly. The RuO2-decorated TNTs and bare
TNTs seemed to degrade the methylene blue to about zero after 2 hours. The trend of the
RuO2-decorated TNTs having lower reaction rates continued from the malachite green
degradation with the kapp for the methylene blue being 1.46 × 10⁻² min-1 and 3.4 × 10⁻³ min-1
(bare TNTs and RuO2-decorated TNTs respectively), while the Knorm reaction rates were
measured to be 5.12 × 10⁻⁵ g m-2 min-1 and 1.77 × 10⁻⁵ g m-2 min-1 (bare TNTs and RuO2-
decorated TNTs respectively). The pH of the stock solution of methylene blue was 6.02
(adjusted with 0.1 M HCl). In order to obtain a better photodegradation rate, due to the high
adsorbance demonstrated by the RuO2-decorated TNTs, another methylene blue degradation
Fig. 12 was conducted at a 50 ppm concentration for 240 min at pH 7.02 (not shown). The
percent dye concentration of the bare TNTs began at about 0.53 and was 0.51 after 240 min.,
while the RuO2-decorated TNTs began at about 0.32 and was 0.21 after 240 min. The RuO2-
decorated TNTs showed a higher photodegradation rate with a kapp of 1.7 × 10⁻³ min-1 and a
Knorm of 5.84 × 10⁻⁶ g m-2 min-1, while the bare TNTs had a kapp of 2 × 10⁻⁴ min-1 and a Knorm of
7.01 × 10⁻⁷ g m-2 min-1. This photodegradation data again confirmed that the RuO2-decorated
TNTs were an improved catalyst to the bare TNTs for the methylene blue dye in terms of
22
adsorption. Similar to the malachite green molecules, some of the methylene blue molecules
also remained on the surface of the catalyst after the UV-treatment was finished. These
remaining molecules can potentially be products such as phenols and benzene rings that are
toxic.31, 46 This is visually observed by the color of the catalysts changing to black.
Figure 12. Plot displaying the dye concentration vs. irradiation time for the degradation of
50 ppm methylene blue (inset) with TiO2 nanotubes ( ) and TiO2 nanotubes decorated with
RuO2 ( ).
The results of Fig. 13 feature the effects of the bare TNTs and the RuO2-decorated TNTs with an
anionic dye, indigo carmine. Neither of the catalyst seemed to have any significant effect on the
dye concentration while stirring in darkness, but the bare TNTs adsorbed about 10% dye
concentration. This is due to the negatively-charged surface of the TiO2-based catalysts
23
hindering surface adsorption by repelling the negatively charged indigo carmine, while an
attractive effect was observed in the cationic dyes.35-36 The concentration of indigo carmine
only decreased during UV-irradiation, meaning no significant adsorption occurred. The dye
degradation rate for the bare TNTs seems to be more efficient than the RuO2-decorated TNTs,
with the bare TNTs completing the photodegradation of the indigo carmine (pH=7.60) after 60
minutes, which was faster than the time that was required for the malachite green and
methylene blue dyes. The RuO2-decorated TNTs only degraded the indigo carmine to about
40% after 4 hours, which was slower than the time needed to remove ~95% of the cationic
malachite green and methylene blue dyes. The kapp for the bare TNTs was 5.2 × 10⁻² min-1 and
3.9 × 10⁻³ min-1 for the RuO2-decorated TNTs, while the Knorm for the bare TNTs was 1.82 × 10⁻⁴ g
m-2 min-1and 1.34 × 10⁻⁵ g m-2 min-1 for the RuO2-decorated TNTs. This slower photodegradation
time for the indigo carmine maybe due to its anionic nature. The slow photodegradation rate is
most likely caused by the fact that the anionic indigo carmine is not adsorbing to the surface of
the catalysts like malachite green and methylene blue do. The idea of a lack of dye molecules
on the surface of the catalyst is supported by the fact that no color change is observed for
either catalyst after the reaction (TNTs remained white and RuO2-decorated TNTs remained
green). The surface being occupied by less dye molecules would allow the catalyst to be better
stimulated by the UV-light to produce more radical species. This reaction result displayed that
RuO2 nanoparticles hinder the performance of photodegradation for anionic dyes.
24
Figure 13. Plot displaying the dye concentration vs irradiation time for the degradation of indigo
carmine with TiO2 nanotubes ( ) and TiO2 nanotubes decorated with RuO2( ).
25
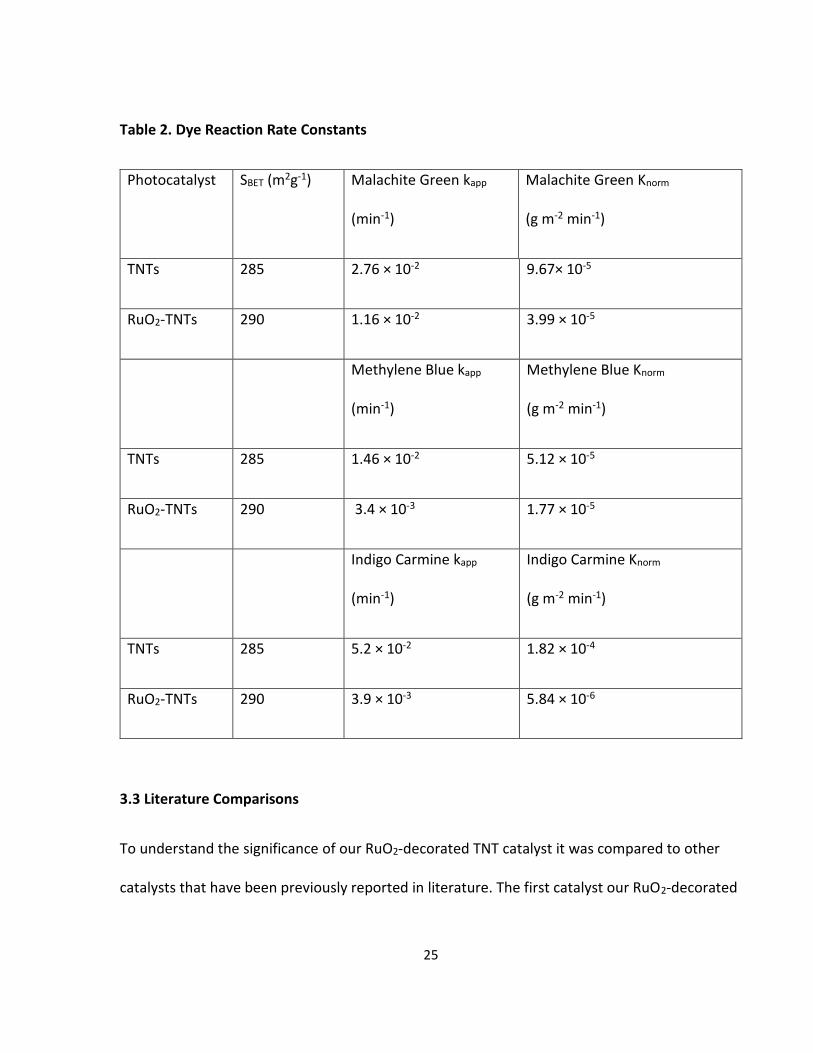
Table 2. Dye Reaction Rate Constants
Photocatalyst SBET (m2g-1) Malachite Green kapp
(min-1)
Malachite Green Knorm
(g m-2 min-1)
TNTs 285 2.76 × 10⁻² 9.67× 10⁻⁵
RuO2-TNTs 290 1.16 × 10⁻² 3.99 × 10⁻⁵
Methylene Blue kapp
(min-1)
Methylene Blue Knorm
(g m-2 min-1)
TNTs 285 1.46 × 10⁻² 5.12 × 10⁻⁵
RuO2-TNTs 290 3.4 × 10⁻³ 1.77 × 10⁻⁵
Indigo Carmine kapp
(min-1)
Indigo Carmine Knorm
(g m-2 min-1)
TNTs 285 5.2 × 10⁻² 1.82 × 10⁻⁴
RuO2-TNTs 290 3.9 × 10⁻³ 5.84 × 10⁻⁶
3.3 Literature Comparisons
To understand the significance of our RuO2-decorated TNT catalyst it was compared to other
catalysts that have been previously reported in literature. The first catalyst our RuO2-decorated
26
TNTs were compared to was RuO2-decorated TiO2 nanoparticles synthesized by Uddin et al.21
Uddin et al. loaded TiO2 nanoparticles (size ~18 nm) with 2-5 nm RuO2 nanoparticles at loadings
of 1%, 2.5%, and 5%.21 The BET surface areas for all the loading of the RuO2-decorated catalyst
were ~70 m2g-1.21 The photodegradation was performed on a methylene blue solution in water
of 10 mg/L.21 0.1 g of photocatalyst was dispersed in 100 mL of dye solution at a pH of 7.21 The
1% loaded sample preformed the best with a kapp of 2.39 × 10⁻¹ min-1 and a Knorm of
3.57 × 10-3.21 The dye was fully degraded in 20 min.21 The kapp and Knorm of the 1% RuO2-
decorated TiO2 nanoparticles were superior to the kapp and Knorm for our RuO2-decorated TNTs
3.4 × 10⁻³ and 1.77 × 10⁻⁵, respectively. Two big factors for the differences in the degradation
rate could be Uddin et al. uses five times more catalyst and that the pH of our solution is only
6.22, while theirs is 7. Regardless, our RuO2-decorated TNTs show superior adsorption despite
that our solution is more concentrated (25 mg/L). This superior adsorption is due to our use of
the higher surface area TiO2 nanotubes.37 The second catalyst that was compared against our
RuO2-decorated TNTs were CuS-decorated TNTs synthesized by Ratanatawanate et al.18
Ratanatawanate et al. loaded TNTs with 2-6 nm CuS nanoparticles.18 The photodegradation was
performed on a 0.3mM malachite green solution in water at pH 6.2.18 25 mg of photocatalyst
was dispersed in 100 mL of the malachite green dye solution.18 The CuS-decorated TNTs
degraded the solution to ~40% in 120 min.18 Due to the fact Ratanatawanate et al. used ~5
times as much malachite green and degraded more dye in the same time span, the CuS-
decorated TNTs show better photocatalytic activity.18 Once more the only benefit provided by
the RuO2-decorated TNTs are their adsorption capabilities. The last catalyst that was compared
27
to our RuO2-decorated TNTs were PbS-decorated TNTs synthesized by Ratanatawanate et al.20
Ratanatawanate et al. loaded TNTs with 4-5 nm PbS nanoparticles.19 The photodegradation was
performed on an indigo carmine solution in water (25 mg/L) at pH 5.7.19 25 mg of photocatalyst
was added to the 100 mL of the dye solution and the solution was irradiated for 120 min.19 The
PbS-decorated TNTs degraded the solution to ~10%, which was better than our RuO2-decorated
TNTs that degraded the solution to ~40% in 240 min.19 This shows that the PbS-decorated TNTs
have superior photocatalytic activities, in addition the adsorption capabilities of both catalysts
were negligible. Overall the main benefit of the RuO2-decorated TNTs, when compared to
similar catalyst, was their adsorption capabilities for cationic dyes.
28
CHAPTER 4
CONCLUSIONS
Titanium dioxide nanotubes decorated with 1-5 nm ruthenium oxide nanoparticles of sizes
were synthesized. A RuO2/TiO2 heterojunction was indicated by the XPS results in which band
bending of the conduction band occurred (indicating a Ru-O-Ti bond). Band bending was further
supported by the tauc plots with 0.6 M and 0.9 M cysteine synthesized RuO2-decorated TNTs
being calculated to have lowered band gaps of 2.73 eV and 2.69 eV, respectively. The RuO2
nanoparticles decorated TiO2 nanotubes displayed activity for the entire spectrum of 200-1200
nm with a max near 300 nm, and a minimum near 600 nm. The cationic dyes proved to be well
adsorbed before irradiation with UV-light for the RuO2-decorated TNTs, while the adsorption of
anionic dyes seemed to be adversely affected by the presence of the RuO2 nanoparticles on the
titanium oxide nanotubes. Overall RuO2-decorated TNTs not only performed as a superior
adsorbent catalyst than the bare TNTs in the cationic dyes of malachite green and methylene
blue, in addition they behaved better than RuO2-decorated TiO2 nanoparticles.
29
REFERENCES
1. Diop, S., Vital Water Graphics: An Overview of the State of the World's Fresh and Marine Waters. UNEP/Earthprint: 2002; Vol. 1. 2. Alderman, D. J., Malachite Green: A Review. Journal of Fish Diseases 1985, 8 (3), 289-298. 3. Han, F.; Kambala, V. S. R.; Srinivasan, M.; Rajarathnam, D.; Naidu, R., Tailored Titanium Dioxide Photocatalysts for the Degradation of Organic Dyes in Wastewater Treatment: A Review. Applied Catalysis A: General 2009, 359 (1-2), 25-40. 4. Berberidou, C.; Kitsiou, V.; Lambropoulou, D. A.; Antoniadis, A.; Ntonou, E.; Zalidis, G. C.; Poulios, I., Evaluation of An Alternative Method for Wastewater Treatment Containing Pesticides using Solar Photocatalytic Oxidation and Constructed Wetlands. J Environ Manage 2017, 195 (Pt 2), 133-139. 5. Sacco, O.; Vaiano, V.; Rizzo, L.; Sannino, D., Photocatalytic Activity of a Visible Light Active Structured Photocatalyst Developed for Municipal Wastewater Treatment. Journal of Cleaner Production 2018, 175, 38-49. 6. Dong, H.; Zeng, G.; Tang, L.; Fan, C.; Zhang, C.; He, X.; He, Y., An Overview on Limitations of TiO2-Based Particles for Photocatalytic Degradation of Organic Pollutants and the Corresponding Countermeasures. Water Res 2015, 79, 128-46. 7. Fujishima, A.; Honda, K., Electrochemical Photolysis of Water at a Semiconductor Electrode. Nature 1972, 238 (5358), 37-38. 8. Linsebigler, A. L.; Lu, G.; Yates, J. T., Photocatalysis on TiO2 Surfaces: Principles, Mechanisms, and Selected Results. Chemical Reviews 1995, 95 (3), 735-758. 9. Konaka, R.; Kasahara, E.; Dunlap, W. C.; Yamamoto, Y.; Chien, K. C.; Inoue, M., Irradiation of Titanium Dioxide Generates Both Singlet Oxygen and Superoxide Anion. Free Radic. Biol. Med. 1999, 27 (3-4), 294-300. 10. Murakami, Y.; Kenji, E.; Nosaka, A. Y.; Nosaka, Y., Direct Detection of OH Radicals Diffused to the Gas Phase from the UV-Irradiated Photocatalytic TiO2 Surfaces by Means of Laser-Induced Fluorescence Spectroscopy. J Phys Chem B 2006, 110 (34), 16808-11. 11. Sekino, T., Synthesis and Applications of Titanium Oxide Nanotubes. Topics in Applied Physics Inorganic and Metallic Nanotubular Materials 2010, 117, 17-32.
30
12. Chen, X.; Mao, S. S., Titanium Dioxide Nanomaterials: Synthesis, Properties, Modifications, and Applications. Chem Rev 2007, 107 (7), 2891-959. 13. Liu, N.; Chen, X.; Zhang, J.; Schwank, J. W., A Review on TiO2-Based Nanotubes Synthesized via Hydrothermal Method: Formation Mechanism, Structure Modification, and Photocatalytic Applications. Catalysis Today 2014, 225, 34-51. 14. Roy, P.; Berger, S.; Schmuki, P., TiO2 nanotubes: Synthesis and Applications. Angew Chem Int Ed Engl 2011, 50 (13), 2904-39. 15. Sadegh, H.; Ali, G. A. M.; Gupta, V. K.; Makhlouf, A. S. H.; Shahryari-ghoshekandi, R.; Nadagouda, M. N.; Sillanpää, M.; Megiel, E., The Role of Nanomaterials as Effective Adsorbents and Their Applications in Wastewater Treatment. Journal of Nanostructure in Chemistry 2017, 7 (1), 1-14. 16. Nakata, K.; Fujishima, A., TiO2 Photocatalysis: Design and Applications. Journal of Photochemistry and Photobiology C: Photochemistry Reviews 2012, 13 (3), 169-189. 17. Nian, J. N.; Teng, H. S., Hydrothermal Synthesis of Single-Crystalline Anatase TiO2 Nanorods with Nanotubes as the Precursor. J Phys Chem B 2006, 110 (9), 4193-4198. 18. Ratanatawanate, C.; Bui, A.; Vu, K.; Balkus, K. J., Low-Temperature Synthesis of Copper(II) Sulfide Quantum Dot Decorated TiO2 Nanotubes and Their Photocatalytic Properties. The Journal of Physical Chemistry C 2011, 115 (14), 6175-6180. 19. Ratanatawanate, C.; Tao, Y.; Balkus, K. J., Photocatalytic Activity of PbS Quantum Dot/TiO2 Nanotube Composites. J Phys Chem C 2009, 113 (24), 10755-10760. 20. Ratanatawanate, C.; Xiong, C.; Balkus, K. J., Fabrication of PbS Quantum Dot Doped TiO2 Nanotubes. ACS Nano 2008, 2 (8), 1682-1688. 21. Uddin, M. T.; Nicolas, Y.; Olivier, C.; Toupance, T.; Müller, M. M.; Kleebe, H.-J.; Rachut, K.; Ziegler, J.; Klein, A.; Jaegermann, W., Preparation of RuO2/TiO2 Mesoporous Heterostructures and Rationalization of Their Enhanced Photocatalytic Properties by Band Alignment Investigations. The Journal of Physical Chemistry C 2013, 117 (42), 22098-22110. 22. Belhadj, H.; Hamid, S.; Robertson, P. K. J.; Bahnemann, D. W., Mechanisms of Simultaneous Hydrogen Production and Formaldehyde Oxidation in H2O and D2O Over Platinized TiO2. ACS Catalysis 2017, 7 (7), 4753-4758.
31
23. Du, P.; Chang, J.; Zhao, H.; Liu, W.; Dang, C.; Tong, M.; Ni, J.; Zhang, B., Sea-Buckthorn-Like MnO2 Decorated Titanate Nanotubes with Oxidation Property and Photocatalytic Activity for Enhanced Degradation of 17β-Estradiol under Solar Light. ACS Applied Energy Materials 2018, 1 (5), 2123-2133. 24. Bavykin, D.; Lapkin, A.; Plucinski, P.; Friedrich, J.; Walsh, F., TiO2 Nanotube-Supported Ruthenium(III) Hydrated Oxide: A Highly Active Catalyst for Selective Oxidation of Alcohols by Oxygen. Journal of Catalysis 2005, 235 (1), 10-17. 25. Lačnjevac, U. Č.; Radmilović, V. V.; Radmilović, V. R.; Krstajić, N. V., RuOx Nanoparticles Deposited on TiO2 Nanotube Arrays by Ion-Exchange Method as Electrocatalysts for the Hydrogen Evolution Reaction in Acid Solution. Electrochimica Acta 2015, 168, 178-190. 26. Tilley, S. D.; Schreier, M.; Azevedo, J.; Stefik, M.; Graetzel, M., Ruthenium Oxide Hydrogen Evolution Catalysis on Composite Cuprous Oxide Water-Splitting Photocathodes. Advanced Functional Materials 2014, 24 (3), 303-311. 27. Trasatti, S., Electrocatalysis: Understanding the Success of DSA®. Electrochimica Acta 2000, 45 (15-16), 2377-2385. 28. Patake, V. D.; Lokhande, C. D., Chemical Synthesis of Nano-Porous Ruthenium Oxide (RuO2) Thin Films for Supercapacitor Application. Applied Surface Science 2008, 254 (9), 2820-2824. 29. Chen, C. C.; Lu, C. S.; Chung, Y. C.; Jan, J. L., UV Light Induced Photodegradation of Malachite Green on TiO2 Nanoparticles. J Hazard Mater 2007, 141 (3), 520-528. 30. Taniguchi, M.; Lindsey, J. S., Database of Absorption and Fluorescence Spectra of >300 Common Compounds for use in PhotochemCAD. Photochem Photobiol 2018, 94 (2), 290-327. 31. Houas, A., Photocatalytic Degradation Pathway of Methylene Blue in Water. Applied Catalysis B: Environmental 2001, 31 (2), 145-157. 32. Kang, X.; Chen, S., Photocatalytic Reduction of Methylene Blue by TiO2 Nanotube Arrays: Effects of TiO2 Crystalline Phase. Journal of Materials Science 2010, 45 (10), 2696-2702. 33. Lachheb, H.; Puzenat, E.; Houas, A.; Ksibi, M.; Elaloui, E.; Guillard, C.; Herrmann, J.-M., Photocatalytic Degradation of Various Types of Dyes (Alizarin S, Crocein Orange G, Methyl Red, Congo Red, Methylene Blue) in Water by UV-Irradiated Titania. Applied Catalysis B: Environmental 2002, 39 (1), 75-90.
32
34. Natarajan, T. S.; Bajaj, H. C.; Tayade, R. J., Preferential Adsorption Behavior of Methylene Blue Dye onto Surface Hydroxyl Group Enriched TiO2 Nanotube and its Photocatalytic Regeneration. J Colloid Interface Sci 2014, 433, 104-114. 35. Sandoval, A.; Hernández-Ventura, C.; Klimova, T. E., Titanate Nanotubes for Removal of Methylene Blue Dye by Combined Adsorption and Photocatalysis. Fuel 2017, 198, 22-30. 36. Xiong, L.; Sun, W.; Yang, Y.; Chen, C.; Ni, J., Heterogeneous Photocatalysis of Methylene Blue Over Titanate Nanotubes: Effect of Adsorption. J Colloid Interface Sci 2011, 356 (1), 211-6. 37. Xiong, L.; Yang, Y.; Mai, J.; Sun, W.; Zhang, C.; Wei, D.; Chen, Q.; Ni, J., Adsorption Behavior of Methylene Blue onto Titanate Nanotubes. Chemical Engineering Journal 2010, 156 (2), 313-320. 38. Zanoni, T. B.; Cardoso, A. A.; Zanoni, M. V. B.; Ferreira, A. A. P., Exploratory Study on Sequestration of Some Essential Metals by Indigo Carmine Food Dye. Brazilian Journal of Pharmaceutical Sciences 2010, 46 (4), 723-730. 39. Morrison, G.; Fatoki, O. S.; Persson, L.; Ekberg, A., Assessment of the Impact of Point Source Pollution from the Keiskammahoek Sewage Treatment Plant on the Keiskamma River - pH, Electrical Conductivity, Oxygen- Demanding Substance (COD) and Nutrients. Water SA 2001, 27 (4), 475-480. 40. Akpan, U. G.; Hameed, B. H., Parameters Affecting the Photocatalytic Degradation of Dyes Using TiO2-Based Photocatalysts: A Review. J Hazard Mater 2009, 170 (2-3), 520-9. 41. Luxton, T. P.; Eick, M. J.; Scheckel, K. G., Characterization and Dissolution Properties of Ruthenium Oxides. J Colloid Interface Sci 2011, 359 (1), 30-39. 42. Erdem, B.; Hunsicker, R. A.; Simmons, G. W.; Sudol, E. D.; Dimonie, V. L.; El-Aasser, M. S., XPS and FTIR Surface Characterization of TiO2 Particles Used in Polymer Encapsulation. Langmuir 2001, 17 (9), 2664-2669. 43. Rochefort, D.; Dabo, P.; Guay, D.; Sherwood, P. M. A., XPS Investigations of Thermally Prepared RuO2 Electrodes in Reductive Conditions. Electrochimica Acta 2003, 48 (28), 4245-4252. 44. Jürgensen, A.; Raschke, H.; Esser, N.; Hergenröder, R., An In situ XPS Study of L-cysteine Co-Adsorbed with Water on Polycrystalline Copper and Gold. Applied Surface Science 2018, 435, 870-879.
33
45. Ganguly, B. N.; Maity, B.; Maity, T. K.; Manna, J.; Roy, M.; Mukherjee, M.; Debnath, S.; Saha, P.; Shilpa, N.; Rana, R. K., L-Cysteine-Conjugated Ruthenium Hydrous Oxide Nanomaterials with Anticancer Active Application. Langmuir 2018, 34 (4), 1447-1456. 46. Prado, A. G.; Costa, L. L., Photocatalytic Decouloration of Malachite Green Dye by Application of TiO2 Nanotubes. J Hazard Mater 2009, 169 (1-3), 297-301.
34
BIOGRAPHICAL SKETCH
Jonathan Daniel Buford was born in Seattle, Washington in 1993. He moved to Richardson,
Texas in 1999. He obtained his Bachelor of Science in Chemistry with a minor in mathematics
from Texas Tech University in 2015. In fall 2015, he entered The University of Texas at Dallas to
pursue his graduate studies under the instruction of Dr. Kenneth J. Balkus, Jr. His research
focused on metal oxide materials and their applications.