+ All Categories
Home > Documents > Title: Adapting NEMO for use as a surge forecasting model · Adapting NEMO for use as the UK...

Title: Adapting NEMO for use as a surge forecasting model · Adapting NEMO for use as the UK...

Date post: 07-May-2018
Category:
Upload: duongdieu
View: 215 times
Download: 1 times
Share this document with a friend
26
Adapting NEMO for use as the UK operational storm surge forecasting model – initial tidal results Rachel Furner, Jane Williams, Kevin Horsburgh, Andy Saulter 1. Introduction The United Kingdom is an area vulnerable to storm surges, particularly the East Coast which has been impacted by two severe events in the past century. The North Sea storm surge of 1953 led to water levels locally exceeding 5.6 metres, caused damage valued at over £1.2 billion at today’s prices and led to the loss of over 300 lives in the UK (Met Office, 2014). Storm Xaver hit UK and European coastlines on 5 th and 6 th December 2013 causing a storm surge which travelled down the East coast causing widespread damage. Water levels exceeded 4m in many places and measured 5.8m locally at Hull (EA, 2014). Within the UK damage was again estimated at over £1 billion, however, in contrast to the 1953 event when no operational storm surge forecasting capability existed, the risk of the 2013 surge was indicated 7 days ahead. Alongside flood defence schemes established since the 1953 event, accurate and timely warnings based on an ensemble forecasting system led to a far greater level of preparedness and not a single life was lost due to this storm surge. Accurate forecasting of storm surge events for this region is crucial to enable government agencies to assess the risk of overtopping of coastal defences so they can respond appropriately, minimising risk to life and infrastructure. The UK is situated in a highly tidal area, including the Bristol Channel, which experiences some of the largest tides in the world. Correctly representing the interaction between tide and surge is therefore critical to the success of the forecasting system. The interaction between tides and storm surges in the Thames region is well described in Rossiter (1961) and the statistical occurrence of surge residuals in relation to the phase of the tide is described by Horsburgh and Wilson (2007). Storm surges act to advance the tide due to increased water depth increasing the speed of the shallow water wave. Similarly the effect of wind stress is inversely dependent on water depth, such that the size of a storm surge will be dependant on the timing of the storm in relation to the state of the tide. These non-linear interactions mean storm surge models for the UK must include a reasonable representation of tides, both in terms of phase and amplitude. The importance of timing with respect to the diurnal high and low, as well as various other tidal constituents such as the spring and neap cycle, means the model needs to take into account not just a large variety of atmospheric forcing conditions but also a large variety of timing possibilities with respect to the tide. As such the UK storm surge forecasting system uses a real-time tide plus surge model. 1.1 The UK Storm Surge Forecasting System A storm surge forecast service for this region has been operational since 1978, using a numerical model developed by the National Oceanography Centre (NOC) and run at the UK Met Office. The numerical scheme of this CS3X model is described in Flather (1994). The model is used to produce surge residual forecasts, which are added to tidal forecasts obtained from harmonic analysis of tide gauge observations at key ports around the UK coast (see also section 3.2). The resulting total water level values are used in determining whether advisories of coastal flood risk are issued. This method is used because the tides forecast from a harmonic method are in general more accurate than those obtainable from a model, since the model will be limited by grid resolution. The surge model is run both with full meteorological and tide forcing, and then in tide only mode, with the difference between these runs providing the storm surge residual. The model tide therefore needs to be
Transcript

Adapting NEMO for use as the UK operational storm surge forecasting model – initial tidal results Rachel Furner, Jane Williams, Kevin Horsburgh, Andy Saulter 1. Introduction The United Kingdom is an area vulnerable to storm surges, particularly the East Coast which has been impacted by two severe events in the past century. The North Sea storm surge of 1953 led to water levels locally exceeding 5.6 metres, caused damage valued at over £1.2 billion at today’s prices and led to the loss of over 300 lives in the UK (Met Office, 2014). Storm Xaver hit UK and European coastlines on 5th and 6th December 2013 causing a storm surge which travelled down the East coast causing widespread damage. Water levels exceeded 4m in many places and measured 5.8m locally at Hull (EA, 2014). Within the UK damage was again estimated at over £1 billion, however, in contrast to the 1953 event when no operational storm surge forecasting capability existed, the risk of the 2013 surge was indicated 7 days ahead. Alongside flood defence schemes established since the 1953 event, accurate and timely warnings based on an ensemble forecasting system led to a far greater level of preparedness and not a single life was lost due to this storm surge. Accurate forecasting of storm surge events for this region is crucial to enable government agencies to assess the risk of overtopping of coastal defences so they can respond appropriately, minimising risk to life and infrastructure. The UK is situated in a highly tidal area, including the Bristol Channel, which experiences some of the largest tides in the world. Correctly representing the interaction between tide and surge is therefore critical to the success of the forecasting system. The interaction between tides and storm surges in the Thames region is well described in Rossiter (1961) and the statistical occurrence of surge residuals in relation to the phase of the tide is described by Horsburgh and Wilson (2007). Storm surges act to advance the tide due to increased water depth increasing the speed of the shallow water wave. Similarly the effect of wind stress is inversely dependent on water depth, such that the size of a storm surge will be dependant on the timing of the storm in relation to the state of the tide. These non-linear interactions mean storm surge models for the UK must include a reasonable representation of tides, both in terms of phase and amplitude. The importance of timing with respect to the diurnal high and low, as well as various other tidal constituents such as the spring and neap cycle, means the model needs to take into account not just a large variety of atmospheric forcing conditions but also a large variety of timing possibilities with respect to the tide. As such the UK storm surge forecasting system uses a real-time tide plus surge model. 1.1 The UK Storm Surge Forecasting System A storm surge forecast service for this region has been operational since 1978, using a numerical model developed by the National Oceanography Centre (NOC) and run at the UK Met Office. The numerical scheme of this CS3X model is described in Flather (1994). The model is used to produce surge residual forecasts, which are added to tidal forecasts obtained from harmonic analysis of tide gauge observations at key ports around the UK coast (see also section 3.2). The resulting total water level values are used in determining whether advisories of coastal flood risk are issued. This method is used because the tides forecast from a harmonic method are in general more accurate than those obtainable from a model, since the model will be limited by grid resolution. The surge model is run both with full meteorological and tide forcing, and then in tide only mode, with the difference between these runs providing the storm surge residual. The model tide therefore needs to be

sufficiently accurate to generate interaction effects which modify the surge (for more information on this see Smith and Flather, 1995). Due to the chaotic nature of the atmosphere during high energy storm development, an ensemble forecast system is used to provide the driving weather predictions. The ensemble enables early warning of low probability high impact events, as well as providing useful indications of confidence in the surge prediction at shorter lead times. The present ensemble storm surge forecast system and its benefits are described by Flowerdew et al. (2010). Running an ensemble system requires a large amount of computing resources, so having an efficient storm surge model, both in terms of run time and memory use, is a necessity. Therefore a mesoscale resolution model (12km horizontal grid cells and a single barotropic level) is run, in order to concentrate on simulating the surge development over the wider continental shelf. The operational ensemble storm surge forecasting system runs a 24 member lagged ensemble twice daily, with ensemble atmospheric forcing coming from the MOGREPS online atmospheric forecast model (Bowler et al., 2008). Whilst accurate and computationally efficient at present, the age of the CS3X model limits its ability to ensure efficient use of future supercomputer architecture and makes traceable pull-through of new scientific developments difficult. The Nucleus for European Modelling of the Ocean (NEMO) code described in Madec (2014) is an example of a more modern code that is widely used by the ocean modelling community. This code is developed as part of a large international consortium, with many developers improving various aspects of NEMO. Developing a NEMO configuration for storm surge modelling will enable the model to be supported and updated in an ongoing fashion, incorporating developments from the wider scientific community and ensuring suitability for future supercomputing architecture. It also enables synergy with existing models used by both the Met Office and NOC and allows access to many other NEMO developments, such as data assimilation and coupling. Implementing a storm surge configuration of NEMO involves both adapting NEMO to add functionality, such as allowing the drying out of ocean cells, and changes allowing NEMO to run efficiently as a two-dimensional, barotropic model. Thus far, a 2-d barotropic version of NEMO has been developed and is being tested for its tidal simulation capabilities. Changes from the original NEMO codebase, preliminary results and comparisons to the existing storm surge model, CS3X, are discussed within this paper. The NEMO model set up, including a brief description of changes required for efficient running as a storm surge model, is described in section 2. Section 3 describes a series of tide propagation tests carried out for a UK continental shelf configuration, including a short description of the observations used for comparisons and a description of the CS3X model to which we are comparing. Results from these comparisons are in section 4, and finally conclusions and a discussion of further work planned as part of this project is provided in section 5. 2. Model set up and developments NEMO is a state of the art ocean model used for both regional and global modelling, short term forecasting and longer climate scale studies. This is possible through the large variety of options available in NEMO. The storm surge code is based on version 3.6 of NEMO, but with local modifications that enable the model to run using a single vertical level assuming barotropic flow. The changes involved removing calls to vertical processes such as vertical diffusion and vertical advection (using a pre-compile key),

as well as the introduction of a simple horizontal pressure gradient scheme designed for use with a single terrain following coordinate. In order to further improve run efficiency, unnecessary processes were removed. For example, thermohaline expansion is typically of a very small order, compared to the magnitude of tides and storm surges, and thermohaline circulation is again negligible when compared to the tidally driven and wind driven circulation. As such modelling of tracers was removed by removing the calls for lateral tracer diffusion, tracer advection, bottom heat fluxes, surface heat and evaporation/precipitation fluxes, and tracer damping (again, using a pre-compile key). Other code developments focus on improving process representation within the model. In order to improve the representation of tides within NEMO additional tidal harmonics have been added; the boundary is now forced with data from 26 tidal constituents (matching those used in CS3X). A parameterisation of gravitational tidal effects within the domain is already included in NEMO and is implemented within this configuration. The charnock parameterisation for wind stress described in Charnock (1955) has also been added as part of this project.

Figure 1: Bathymetry of CS3X model (left) and NEMO model (right)

2.2 UK Storm Surge Model Configuration O’Dea et al (2012) gives a detailed explanation of a coastal ocean NEMO configuration used at the Met Office and NOC for short term forecasting. This configuration provided the basis of the storm surge system. The model is run using bathymetry as shown in figure 1. This is the NOOS bathymetry (NOOS system, 2015) interpolated onto a 7km grid with some manual edits applied to preserve features such as islands and narrow channels which were lost during the interpolation. A 6m minimum depth is applied over the majority of the domain, with 10m in the Bristol Channel and the Gulf of St Malo, this ensures the height of the model level does not become too small in the event of low tides and negative surge.

Within NEMO various bottom friction parameterisations are available. Due to the overall simplicity of this model it was felt the non-linear parameterisation as described in Madec (2014) was most appropriate. This scheme assumes the flux due to bottom friction is proportional to the velocity of the bottom layer (the barotropic velocity in our 1 layer model) using the equation 𝑓 = 𝑟

ℎ𝑼

Where 𝑟 is a drag coefficient and ℎ is the height of the bottom box (the height of the entire water column in this 1 layer set up). We use a non linear formulation for bed stress such that 𝑟 is correlated to current speed by the equation 𝑟 = 𝐴√𝑢2 + 𝑣2 Where 𝐴 is a user defined coefficient. In the tests below 𝐴 is set as 0.0025, as it is in CS3X, however this parameter will be tuned in later versions of this configuration. 3. Tidal model comparisons 3.1 Comparison Method Testing of the tidal propagation properties of the NEMO surge configuration has been carried out, and compared to the CS3X model, tide gauge and altimeter data (described below). This testing involved running NEMO and CS3X in tide only mode for 2004. Comparisons were then based on harmonic analyses of sea surface height values from each of the model runs, resulting in a set of 50 harmonic constants for each point in the model grid. 3.2 Tide gauge observations

The UK National Tide Gauge Network of (so-called Class A) sea level gauges was established after violent storms in the North Sea in 1953 resulted in serious flooding in the Thames Estuary. The network is run by the Tide Gauge Inspectorate at NOC on behalf of the Environment Agency (EA), recording tidal elevations at 44 locations around the UK coast. Data from the UK National Tide Gauge Network are quality controlled and archived by the British Oceanographic Data Centre. Logging and telemetry systems transfer data to the Met Office and then to the EA in near real-time. Harmonic analysis of these data over a period of 19-years gives a set of harmonic constants for each port from which tidal predictions can be calculated, and against which our models are validated. Figure 2 shows the locations of all gauges in the UK tide gauge network. More information can be found in UK National Tidal and Sea Level Facility (2013). For tide gauge comparisons the amplitude and phase of 14 main constituents were extracted at 42 model points corresponding to the tide gauge locations.

Model points in NEMO were based on the nearest neighbour to the tide gauge location. For the majority of CS3X points the same method is used, however for some gauges a different point is chosen based on a local point best representing the observation. The model values were compared

Figure 2: UK Class A tide gauge locations

with values of amplitude and phase derived from harmonic analyses of observed sea levels recorded at tide gauges. The following parameters were calculated for each location:

1. Hm-Ho i.e. the difference between the computed and observed elevation (in cm). 2. Gm-Go i.e. the difference between the computed and observed phase (in degrees). 3. DHPm the difference in elevation given as a percentage error of the computed value. 4. Hs is the error in the complex plane and is defined as Hs =(h1

2+h22)½

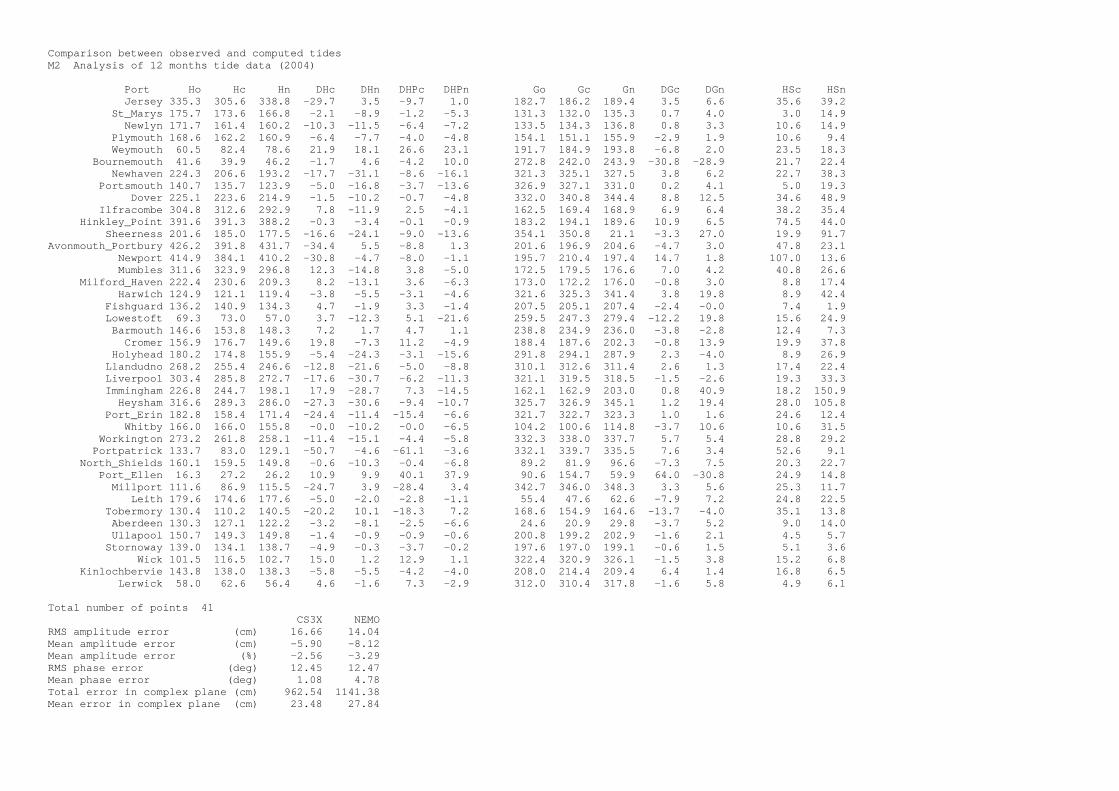
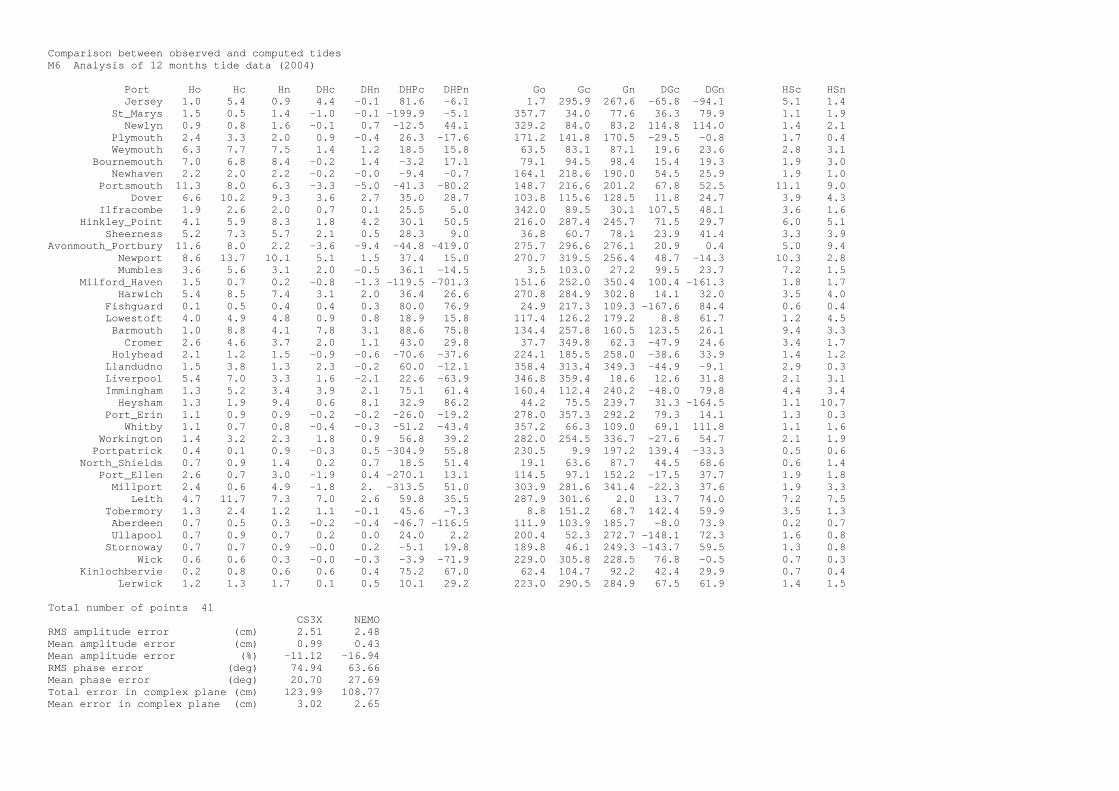
Where h1=Hmcos(Gm)-Hocos(Go) and h2=Hmsin(Gm)-Hosin(Go) From these site specific values, overall statistics of RMS error in amplitude and phase error were obtained. 3.3 Altimeter observations Data corresponding to tidal amplitudes for the components M2, S2, K1 and O1 were derived from 17 years of Topex/Poseidon and Jason altimetry. Each data record is the result of an independent tidal analysis, done point-by-point along the tracks (Richard Ray, pers. comm.). Whilst satellite altimeter is accurate in deep ocean regions, tide gauges are still considered more reliable in coastal waters. In particular altimeter observations in small sea regions, close to coastlines on all sides, should be used with caution. The errors, particularly how these differ between shallow and deep water are discussed in chapter 8 of Coastal Altimetry (Vignudelli et al, 2011). In deep water errors are approximated at around 1cm for the M2, S2, and O1 tidal constituents, and somewhat larger, at 2.11cm, for the K1 constituent. In shallow water these errors are thought to be increased, however it should be noted that amplitudes are larger there too. For comparison of tidal performance in deeper waters plots of the amplitude over a subset of the domain is shown for 4 main constituents (M2, S2, K1, O1) for both NEMO and CS3X. Values of tidal amplitude from satellite altimetry are overplotted to allow visual comparison. 3.4 CS3X model The current UK operational storm surge model, CS3X, is a 12km depth-averaged tide surge model. CS3X is forced by 26 tidal constituents at the open boundaries and, when run in surge mode, mean sea level pressure and 10m winds from the Met Office’s Global atmospheric model. The tidal forcing come from a larger domain tide-surge model covering the North-East Atlantic (Flather, 1981) which was run in tide-only mode for a 12-month period. A harmonic analysis produced 26 constituents which were then interpolated to the CS3X grid. A non-linear bottom friction parameterisation, similar to that used in NEMO is applied in CS3X, with a coefficient of 0.0025. The model bathymetry and domain extent is shown in figure 1. The main contrast between the CS3X and NEMO configurations can be found in the northern extent of the model. 4. Results Table 1 shows comparisons against tide gauge observations for both the CS3X model and the NEMO model. The RMS error in amplitude and the mean error in phase, calculated by comparing results of harmonic analysis of model output and model data, over the full set of Class A tide gauges is given, for the 14 main constituents. The ‘best’ results are shaded green. The full results, including gauge by gauge comparisons are given in appendix A. These results show NEMO does a good job of representing tidal amplitudes for the locations assessed. With the exception of the M4 constituent, tidal amplitudes from NEMO are comparable or better than those from CS3X. For tidal phases NEMO does not perform as well, with mean phase errors for many constituents being larger than

those from the CS3X model. For RMS errors in phase (not shown here, see appendix A) NEMO gives better results than CS3X for 8 of the 14 constituents, indicating that NEMO phase errors are on a similar scale to those of CS3X but are subject to a more systematic bias. The details of this result need further assessment.

Name NEMO RMS

amplitude (cm) CS3X RMS amplitude (cm)

NEMO phase error (deg)

CS3X phase error (deg)

Q1 0.69 0.50 8.76 -6.77 O1 1.13 1.64 10.94 5.77 P1 0.52 0.46 0.70 -9.57 K1 1.47 1.01 -0.33 -5.02 2N2 2.08 2.27 -14.61 -11.27 MU2 2.70 3.72 10.90 4.68 N2 3.38 4.12 8.11 3.89 NU2 0.82 0.77 -2.00 1.43 M2 14.04 16.66 4.78 1.08 S2 5.15 6.46 7.59 1.83 K2 1.65 2.45 7.20 2.25 M4 9.34 5.82 36.43 22.85 MS4 6.74 4.46 32.6 2.82 M6 2.48 2.51 27.69 20.70

Table 1: Statistics for RMS amplitude errors and phase errors for 14 tidal constituents

Figure 3: Differences between model and tide gauge harmonic analysis output plotted at tide gauge locations

The systematic bias in NEMO phase characteristics is confirmed by Figure 3, which shows the errors in phase for the M2 constituent for each tide gauge. Whilst some ports which are located near amphidromes or in estuaries give large errors, this plot shows NEMO consistently overestimates phase down the East Coast of the UK, with errors worsening as the tidal wave propagates south. This picture is similar for other constituents.

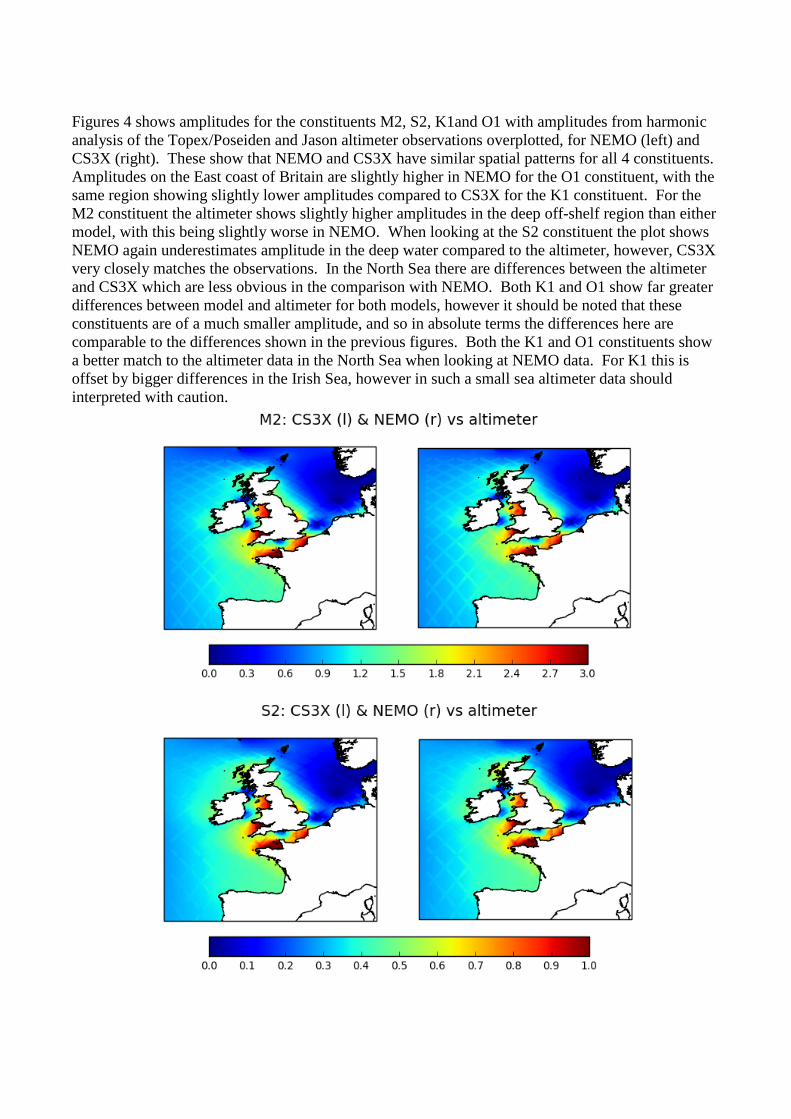
Figures 4 shows amplitudes for the constituents M2, S2, K1and O1 with amplitudes from harmonic analysis of the Topex/Poseiden and Jason altimeter observations overplotted, for NEMO (left) and CS3X (right). These show that NEMO and CS3X have similar spatial patterns for all 4 constituents. Amplitudes on the East coast of Britain are slightly higher in NEMO for the O1 constituent, with the same region showing slightly lower amplitudes compared to CS3X for the K1 constituent. For the M2 constituent the altimeter shows slightly higher amplitudes in the deep off-shelf region than either model, with this being slightly worse in NEMO. When looking at the S2 constituent the plot shows NEMO again underestimates amplitude in the deep water compared to the altimeter, however, CS3X very closely matches the observations. In the North Sea there are differences between the altimeter and CS3X which are less obvious in the comparison with NEMO. Both K1 and O1 show far greater differences between model and altimeter for both models, however it should be noted that these constituents are of a much smaller amplitude, and so in absolute terms the differences here are comparable to the differences shown in the previous figures. Both the K1 and O1 constituents show a better match to the altimeter data in the North Sea when looking at NEMO data. For K1 this is offset by bigger differences in the Irish Sea, however in such a small sea altimeter data should interpreted with caution.

Figure 4: Amplitude from harmonic analysis of model data with amplitude derived from harmonic analysis of satellite data

overplotted, for 4 constituents, M2, S2, O1 and K1

5. Summary and Discussion Following a limited number of code modifications, the NEMO model has been configured for operation as a single level (barotropic) storm surge model. An assessment of an initial configuration for the UK shows the model has some skill at replicating tides within the domain. In comparison to the existing operational storm surge model CS3X, the NEMO based model does very well at replicating tidal amplitudes at tide gauge locations. Comparison with altimeter data shows that throughout the domain it also captures the spatial pattern well with results comparable to that of CS3X. When looking at the phase in the model NEMO does not perform as well as CS3X, with a positive bias for most tidal constituents. This indicates further work is required to better represent the speed of the tide within the domain. It should be noted that CS3X has been optimised over many years of development both in terms of the bottom friction used, the coastal mask and bathymetry (Kevin Horsburgh, pers. comm.). Tuning of bottom friction coefficients, detailed modification of bathymetry, and an assessment of the most

representative location for comparison to tide gauges is yet to be completed for NEMO. Sensitivity testing of the model indicates that substantial improvements in tidal performance can be achieved following this work. Tests are underway to assess the impact of various tuning activities. The experiments described above use a bottom friction coefficient of 0.0025 to match that used in CS3X. Preliminary tests with an alternate value of 0.002 for this coefficient show improvements in both phase and amplitude of tidal predictions, with mean phase errors of 2.64 degrees for the M2 constituent (previously 4.78 degrees), and RMS amplitude errors of 10.95cm (previously 14.04cm). Further experiments to fine tune this parameter will be undertaken. Currently a single parameter is used throughout the domain, however the use of a 2-d varying coefficient will also be considered, either within this initial phase or later within this project. The bathymetry being used is interpolated from the NOOS bathymetry with minimal changes applied. As the bathymetry is a major factor in the speed of travel of the shallow water tidal wave, further assessment will be undertaken, with tests against alternative sources, such as the EMODnet bathymetry (emodnet.eu 2015). To test sensitivity to bathymetry changes the model was run with an amended bathymetry, manually edited to closer match the CS3X bathymetry in the Southern North Sea, where phase errors become large. This showed improvements in the region, for example the phase error at Sheerness for the M2 constituent drops from 27.0 degrees to 11.9 degrees, implying a large sensitivity to local bathymetry. The assessment described here is based on a preliminary choice of model comparison point, chosen a priori based on proximity to tide gauge location. The suitability of these locations will be further assessed within this project. Currently a minimum depth is applied in the model to prevent numerical stability issues when grid boxes would otherwise become very small, however this falsely changes the bathymetry, and thus may be introducing errors. A wetting and drying scheme, as currently exists in CS3X, is being developed for NEMO. This will remove the need for a minimum depth and likely improve tidal representation in the model. Once the tidal version of the model is well tuned, assessment of the configuration as a storm surge model being forced by atmospheric fluxes will begin. Initially this will assess use of the Charnock wind drag parameterisation. This assessment will look particularly at the winter of 2013-2014 which saw many storms and surge events in the north west European shelf region. In the longer term use of the NEMO code base enables many future upgrades and developments to be picked up. These include both computational developments to ensure the system makes best use of current and future supercomputer architecture, but also scientific improvements. Longer term plans for this model are to assess the impacts of data assimilation, and coupling, both of which have been developed outside of this project as part of the larger NEMO consortium. Acknowledgements Along track values of tidal amplitude derived from satellite data were kindly provided to the Met Office by Richard Ray of NASA

Bibliography Bowler, N. E., Arribas, A., Mylne, K. R., Robertson, K. B. and Beare, S. E. (2008), The MOGREPS short-range ensemble prediction system. Q.J.R. Meteorol. Soc., 134: 703–722. doi:10.1002/qj.234 Charnock, H. (1955). Wind stress on a water surface. Quarterly Journal of the Royal Meteorological Society, 81(350), 639-640. Emodnet.eu, (2015). Bathymetry | Emodnet. [online] Available at: http://www.emodnet.eu/bathymetry [Accessed 2 Nov. 2015]. Environment Agency (2014), December 2013 surge event - internal summary Flather. R. A. (1976) A Tidal Model of the North-West European Continental Shelf. Memoires Societe Royale des Sciences de Liege, 6e serie, tome X, pp 141-164. Flather, R. A. (1981). "Results from a model of the north east Atlantic relating to the Norwegian Coastal Current". 427-458 in, The Norwegian Coastal Current (Proceedings from the...symposium, Geilo, 9-12September 1980). Saetre, R. and M. Mork, Eds. Bergen: Bergen University, Volume 2. Flather, R.A. (1994). A Storm Surge Prediction Model for the Northern Bay of Bengal with Application to the Cyclone Disaster in April 1991. Journal of Physical Oceanography, Vol 224, No. 1, January 1994. Pp 172-190. Flowerdew, J., Horsburgh, K., Wilson, C., & Mylne, K. (2010). Development and evaluation of an ensemble forecasting system for coastal storm surges.Quarterly Journal of the Royal Meteorological Society, 136(651), 1444-1456. Horsburgh, K. J., & Wilson, C. (2007). Tide‐surge interaction and its role in the distribution of surge residuals in the North Sea. Journal of Geophysical Research: Oceans (1978–2012), 112(C8). Madec G. 2014: NEMO ocean engine (Draft edition r5171). Note du Pôle de modélisation, Institut Pierre-Simon Laplace (IPSL), France, No 27 ISSN No 1288-1619.

Met Office (2014), 1953 east coast flood - 60 years on. [online] Available at: http://www.metoffice.gov.uk/news/in-depth/1953-east-coast-flood [Accessed 2 Nov. 2015] NOOS system. (2015). NOOS North-West Shelf Operational Oceanographic System | Projects | in-NOOS | Modelling. [online] Noos.cc. Available at: http://www.noos.cc/index.php?id=173 [Accessed 2 Nov. 2015]. O’Dea, E. J., Arnold, A. K., Edwards, K. P., Furner, R., Hyder, P., Martin, M. J., ... & Liu, H. (2012). An operational ocean forecast system incorporating NEMO and SST data assimilation for the tidally driven European North-West shelf. Journal of Operational Oceanography, 5(1), 3-17. Rossiter, J. R. (1961). Interaction between tide and surge in the Thames. Geophysical Journal International, 6(1), 29-53. Smith, J. A. and R. A. Flather 1995. Evaluation of the accuracy of total water levels produced by the operational storm surge model. Proudman Oceanographic Laboratory, Internal Document, No 83, 16pp. & figs.

UK National Tidal and Sea Level Facility 2013. Annual Report for 2012. Liverpool: Proudman Oceanographic Laboratory and British Oceanographic Data Centre. http://www.bodc.ac.uk/data/online_delivery/ntslf/reports/documents/2012annualreport.pdf Vignudelli, S., Kostianoy, A.G., Cipollini, P., Benveniste, J. (Eds.) (2011) Coastal Altimetry, Heidelberg: Springer

Appendix A. Data for individual tide gauges plus summary statistics Ho is amplitude from observations Go is phase from observations Hc is amplitude from CS3X model Hn is amplitude from NEMO model Gc is phase from CS3X model Gn is phase from NEMO model DHc = Hc-Ho DHn = Hn-Ho DGc = Gc-Go DGn = Gn-Go DHPc = 100*(Hc-Ho)/Hc DHPn = 100*(Hn-Ho)/Hn HSc (error in complex plane) = �(𝐻𝐻 ∗ cos(𝐺𝐻) − 𝐻𝐻 ∗ cos (𝐺𝐻))2 + (𝐻𝐻 ∗ 𝑆𝑆𝑆(𝐺𝐻) − 𝐻𝐻 ∗ sin (𝐺𝐻)2 HSn (error in complex plane) = �(𝐻𝑆 ∗ cos(𝐺𝑆) − 𝐻𝐻 ∗ cos (𝐺𝐻))2 + (𝐻𝑆 ∗ 𝑆𝑆𝑆(𝐺𝑆) − 𝐻𝐻 ∗ sin (𝐺𝐻)2

Comparison between observed and computed tides Q1 Analysis of 12 months tide data (2004) Port Ho Hc Hn DHc DHn DHPc DHPn Go Gc Gn DGc DGn HSc HSn Jersey 2.2 2.6 2.2 0.4 -0.0 14.2 -2.1 306.2 303.9 321.8 -2.3 15.6 0.4 0.6 St_Marys 1.7 1.6 1.4 -0.1 -0.3 -3.9 -22.3 290.8 285.8 304.1 -4.9 13.4 0.2 0.5 Newlyn 1.6 1.5 1.2 -0.1 -0.4 -10.0 -31.2 290.0 292.8 308.2 2.8 18.2 0.2 0.6 Plymouth 1.4 1.6 1.3 0.2 -0.1 9.9 -8.2 297.5 303.0 319.5 5.6 22.0 0.2 0.5 Weymouth 1.0 1.4 1.1 0.4 0.1 29.5 10.2 303.0 323.1 341.9 20.1 38.8 0.6 0.7 Bournemouth 0.8 1.3 1.0 0.5 0.2 36.0 18.8 308.7 333.9 352.1 25.3 43.4 0.6 0.7 Newhaven 0.3 1.0 0.8 0.7 0.5 71.3 61.4 110.6 21.0 43.4 -89.6 -67.1 1.1 0.7 Portsmouth 0.2 1.0 0.8 0.8 0.6 80.6 74.2 344.4 3.5 25.0 19.1 40.6 0.8 0.6 Dover 2.2 2.0 1.8 -0.2 -0.4 -7.5 -23.9 117.9 84.8 112.6 -33.1 -5.4 1.2 0.5 Ilfracombe 2.1 2.0 1.6 -0.1 -0.5 -6.9 -27.3 295.9 296.3 312.8 0.4 16.8 0.1 0.7 Hinkley_Point 2.1 2.0 1.7 -0.1 -0.4 -5.1 -22.6 303.9 307.8 322.4 3.9 18.5 0.2 0.7 Sheerness 4.3 3.6 3.2 -0.7 -1.1 -21.1 -36.2 132.9 113.2 145.5 -19.8 12.5 1.5 1.4 Avonmouth_Portbury 2.0 2.0 1.7 -0.0 -0.3 -0.4 -17.0 313.9 308.6 331.0 -5.3 17.1 0.2 0.6 Newport 2.1 1.9 1.7 -0.2 -0.4 -11.9 -22.4 311.6 315.6 326.5 4.0 15.0 0.3 0.6 Mumbles 2.0 2.0 1.7 -0.0 -0.3 -1.3 -20.7 305.4 301.0 315.9 -4.4 10.4 0.2 0.5 Milford_Haven 2.1 1.9 1.6 -0.2 -0.5 -10.1 -30.5 303.1 298.1 315.5 -5.0 12.4 0.3 0.6 Harwich 4.3 3.6 3.3 -0.7 -1.0 -20.1 -29.5 117.9 100.4 121.3 -17.5 3.5 1.4 1.0 Fishguard 2.5 2.3 1.9 -0.2 -0.6 -9.2 -29.5 316.6 315.8 329.4 -0.8 12.8 0.2 0.8 Lowestoft 4.6 3.7 3.4 -0.9 -1.2 -23.3 -33.5 106.0 86.8 107.1 -19.1 1.2 1.6 1.2 Barmouth 2.1 2.6 2.1 0.5 0.0 19.5 1.4 326.1 325.6 335.6 -0.6 9.4 0.5 0.3 Cromer 5.4 4.3 4.1 -1.1 -1.3 -24.9 -33.2 78.0 58.9 77.2 -19.0 -0.7 1.9 1.3 Holyhead 3.4 3.1 2.5 -0.3 -0.9 -11.4 -38.2 337.0 335.9 345.0 -1.2 7.9 0.4 1.0 Llandudno 3.6 3.3 2.7 -0.3 -0.9 -8.9 -31.7 342.0 341.4 351.0 -0.5 9.0 0.3 1.0 Liverpool 3.4 3.4 2.8 -0.0 -0.6 -0.0 -21.7 345.6 344.8 354.3 -0.7 8.8 0.0 0.8 Immingham 5.6 4.5 3.9 -1.1 -1.7 -24.6 -44.8 63.6 47.3 76.9 -16.3 13.3 1.8 2.0 Heysham 3.6 3.4 2.7 -0.2 -0.9 -6.2 -35.5 346.2 347.6 10.6 1.3 24.3 0.2 1.6 Port_Erin 3.1 3.1 2.6 0.0 -0.5 1.0 -20.1 342.9 344.1 354.6 1.2 11.7 0.1 0.8 Whitby 4.9 4.1 4.0 -0.8 -0.9 -19.5 -22.5 36.8 17.8 34.1 -18.9 -2.6 1.7 0.9 Workington 3.3 3.3 2.7 0.0 -0.6 0.7 -20.8 346.7 350.2 0.5 3.5 13.8 0.2 0.9 Portpatrick 3.3 3.0 2.5 -0.3 -0.8 -9.9 -30.2 341.2 341.6 352.7 0.4 11.5 0.3 1.0 North_Shields 4.7 3.9 3.8 -0.8 -0.9 -19.7 -22.1 31.4 10.1 26.6 -21.2 -4.7 1.8 0.9 Port_Ellen 2.9 2.8 2.3 -0.1 -0.6 -2.8 -27.2 334.7 332.5 344.5 -2.2 9.7 0.1 0.8 Millport 3.3 3.1 2.5 -0.2 -0.8 -7.8 -30.8 342.8 342.9 352.2 0.2 9.4 0.2 0.9 Leith 4.9 3.9 3.9 -1.0 -1.0 -26.0 -25.0 15.3 355.3 12.2 -20.0 -3.0 1.8 1.0 Tobermory 2.7 2.5 2.1 -0.2 -0.6 -6.6 -28.1 320.5 327.9 324.4 7.4 3.9 0.4 0.6 Aberdeen 4.3 3.5 3.5 -0.8 -0.8 -22.7 -21.8 359.2 344.3 356.8 -14.9 -2.3 1.3 0.8 Ullapool 2.6 2.4 2.5 -0.2 -0.1 -9.0 -2.3 295.3 286.3 298.0 -9.0 2.7 0.4 0.1 Stornoway 3.3 3.0 2.9 -0.3 -0.4 -8.5 -13.5 296.4 290.9 297.9 -5.6 1.5 0.4 0.4 Wick 3.8 3.3 3.2 -0.5 -0.6 -15.1 -18.4 335.8 320.9 333.3 -14.9 -2.5 1.0 0.6 Kinlochbervie 2.7 2.9 2.6 0.2 -0.1 5.5 -4.3 288.8 280.4 294.6 -8.4 5.8 0.4 0.3 Lerwick 2.7 2.6 2.5 -0.1 -0.2 -4.5 -6.5 339.6 322.2 332.2 -17.4 -7.5 0.8 0.4 Total number of points 41 CS3X NEMO RMS amplitude error (cm) 0.50 0.69 Mean amplitude error (cm) -0.20 -0.52 Mean amplitude error (%) -2.22 -16.81 RMS phase error (deg) 18.88 18.77 Mean phase error (deg) -6.77 8.76 Total error in complex plane (cm) 27.38 32.00 Mean error in complex plane (cm) 0.67 0.78

Comparison between observed and computed tides O1 Analysis of 12 months tide data (2004) Port Ho Hc Hn DHc DHn DHPc DHPn Go Gc Gn DGc DGn HSc HSn Jersey 8.1 7.7 8.5 -0.4 0.4 -5.6 4.5 346.7 355.0 353.7 8.3 7.0 1.2 1.1 St_Marys 5.6 4.8 5.3 -0.8 -0.3 -16.4 -5.6 340.3 344.7 346.6 4.4 6.3 0.9 0.7 Newlyn 5.4 4.6 5.2 -0.8 -0.2 -16.6 -4.3 341.4 350.3 351.3 8.9 10.0 1.1 0.9 Plymouth 5.7 5.1 5.8 -0.6 0.1 -12.5 1.9 346.2 356.5 356.3 10.3 10.1 1.2 1.0 Weymouth 4.9 4.7 5.5 -0.2 0.6 -3.3 11.3 348.2 7.9 4.8 19.7 16.7 1.7 1.6 Bournemouth 4.1 4.2 5.0 0.1 0.9 2.1 18.8 346.5 13.6 7.8 27.0 21.2 1.9 1.9 Newhaven 1.1 2.2 2.6 1.1 1.5 50.9 57.7 325.1 46.6 16.5 81.5 51.4 2.3 2.1 Portsmouth 2.7 3.1 3.7 0.4 1.0 11.5 27.4 343.1 30.5 17.0 47.4 33.9 2.3 2.1 Dover 5.8 4.9 4.4 -0.9 -1.4 -18.4 -32.8 178.9 158.3 187.6 -20.7 8.6 2.1 1.6 Ilfracombe 6.7 5.7 6.2 -1.0 -0.5 -16.7 -8.7 348.6 354.4 357.3 5.9 8.8 1.2 1.1 Hinkley_Point 7.2 6.1 6.5 -1.1 -0.7 -17.6 -10.6 354.8 4.0 3.9 9.3 9.1 1.5 1.3 Sheerness 13.2 11.1 12.5 -2.1 -0.7 -19.2 -5.9 189.2 184.4 210.0 -4.8 20.8 2.4 4.7 Avonmouth_Portbury 7.4 6.1 6.6 -1.3 -0.8 -21.5 -12.5 2.6 5.1 9.3 2.4 6.7 1.3 1.2 Newport 7.4 6.0 6.5 -1.4 -0.9 -23.1 -13.1 1.1 11.2 6.8 10.1 5.7 1.8 1.1 Mumbles 6.9 5.8 6.2 -1.1 -0.7 -18.5 -11.1 350.7 359.1 0.5 8.3 9.8 1.4 1.3 Milford_Haven 6.6 5.6 6.0 -1.0 -0.6 -18.7 -10.5 354.4 357.9 2.3 3.5 7.9 1.1 1.1 Harwich 13.2 10.9 12.2 -2.3 -1.0 -21.0 -8.0 174.7 170.6 185.3 -4.0 10.6 2.4 2.5 Fishguard 7.8 6.5 6.8 -1.3 -1.0 -20.4 -15.5 9.7 15.1 17.7 5.4 8.1 1.5 1.5 Lowestoft 13.7 11.5 12.8 -2.2 -0.9 -19.0 -6.7 159.4 156.1 170.3 -3.3 10.9 2.3 2.7 Barmouth 8.1 7.3 7.4 -0.8 -0.7 -10.7 -9.8 21.1 24.1 25.0 2.9 3.9 0.9 0.9 Cromer 16.1 13.4 15.2 -2.7 -0.9 -20.5 -6.0 132.9 126.9 140.0 -6.0 7.1 3.1 2.1 Holyhead 10.0 8.4 8.2 -1.6 -1.8 -19.7 -21.7 29.1 35.6 36.7 6.5 7.6 1.9 2.2 Llandudno 10.8 9.0 9.1 -1.8 -1.7 -19.5 -18.6 35.9 42.1 44.3 6.2 8.4 2.1 2.2 Liverpool 11.4 9.3 9.3 -2.1 -2.1 -22.2 -22.0 41.2 45.0 47.4 3.8 6.2 2.2 2.3 Immingham 17.3 14.7 16.4 -2.6 -0.9 -17.4 -5.6 113.7 111.6 137.8 -2.2 24.1 2.6 7.1 Heysham 11.2 9.4 9.8 -1.8 -1.4 -19.5 -14.4 42.4 48.4 62.9 6.1 20.5 2.1 4.0 Port_Erin 10.1 8.3 8.4 -1.8 -1.7 -22.3 -19.6 41.6 46.9 50.2 5.3 8.6 2.0 2.2 Whitby 14.7 12.1 14.3 -2.6 -0.4 -21.1 -3.0 87.4 81.8 93.9 -5.7 6.4 2.9 1.7 Workington 10.9 9.1 9.2 -1.8 -1.7 -19.9 -18.0 45.1 52.8 55.8 7.7 10.7 2.2 2.5 Portpatrick 9.9 7.5 8.1 -2.4 -1.8 -31.6 -22.4 42.0 48.1 53.1 6.1 11.0 2.5 2.5 North_Shields 14.0 11.7 13.8 -2.3 -0.2 -20.0 -1.6 81.0 73.6 85.7 -7.3 4.7 2.8 1.2 Port_Ellen 8.2 6.3 6.7 -1.9 -1.5 -29.8 -22.0 39.7 39.8 52.8 0.1 13.1 1.9 2.3 Millport 9.7 7.6 8.0 -2.1 -1.7 -27.4 -21.4 43.8 50.0 55.8 6.2 11.9 2.3 2.5 Leith 14.4 11.8 14.4 -2.6 0.0 -22.3 0.3 65.3 58.5 70.1 -6.8 4.9 3.0 1.2 Tobermory 6.2 4.9 4.0 -1.3 -2.2 -27.2 -55.6 22.8 35.3 24.2 12.5 1.5 1.8 2.2 Aberdeen 12.8 10.4 12.7 -2.4 -0.1 -23.1 -1.0 50.3 47.3 55.4 -3.0 5.1 2.5 1.1 Ullapool 7.8 6.6 9.1 -1.2 1.3 -17.8 14.5 345.3 338.3 351.0 -7.0 5.7 1.5 1.6 Stornoway 9.3 7.9 10.2 -1.4 0.9 -17.0 9.2 349.7 351.1 358.1 1.4 8.4 1.4 1.7 Wick 11.5 9.7 11.5 -1.8 -0.0 -18.4 -0.0 27.4 24.1 31.7 -3.3 4.2 1.9 0.8 Kinlochbervie 8.2 8.5 9.8 0.3 1.6 3.4 15.9 340.2 338.1 349.4 -2.1 9.2 0.4 2.1 Lerwick 7.9 7.2 8.5 -0.7 0.6 -10.5 7.5 31.3 27.1 32.8 -4.2 1.5 0.9 0.7 Total number of points 41 CS3X NEMO RMS amplitude error (cm) 1.64 1.13 Mean amplitude error (cm) -1.37 -0.52 Mean amplitude error (%) -15.56 -5.83 RMS phase error (deg) 16.98 14.14 Mean phase error (deg) 5.77 10.94 Total error in complex plane (cm) 76.72 78.60 Mean error in complex plane (cm) 1.87 1.92

Comparison between observed and computed tides P1 Analysis of 12 months tide data (2004) Port Ho Hc Hn DHc DHn DHPc DHPn Go Gc Gn DGc DGn HSc HSn Jersey 3.2 3.0 4.0 -0.2 0.8 -7.7 20.9 90.5 92.0 100.4 1.5 9.9 0.2 1.0 St_Marys 1.9 1.8 2.2 -0.1 0.3 -3.3 13.7 94.2 88.3 92.0 -5.9 -2.2 0.2 0.3 Newlyn 2.1 2.0 2.3 -0.1 0.2 -3.8 9.1 101.7 96.5 104.8 -5.2 3.1 0.2 0.2 Plymouth 2.7 2.4 3.0 -0.3 0.3 -11.1 9.3 106.4 99.3 110.7 -7.1 4.3 0.4 0.3 Weymouth 3.2 2.8 3.7 -0.4 0.5 -15.3 13.7 106.6 104.0 119.6 -2.6 13.0 0.4 0.9 Bournemouth 3.1 2.7 3.8 -0.4 0.7 -13.5 17.9 103.4 105.7 122.4 2.3 19.0 0.4 1.3 Newhaven 2.7 2.1 3.3 -0.6 0.6 -30.3 18.7 100.1 99.8 121.7 -0.2 21.7 0.6 1.3 Portsmouth 3.1 2.6 3.8 -0.5 0.7 -20.3 17.8 106.8 107.6 128.9 0.8 22.1 0.5 1.5 Dover 2.0 1.6 1.6 -0.4 -0.4 -27.7 -28.8 26.1 355.6 51.3 -30.5 25.1 1.0 0.9 Ilfracombe 2.3 2.1 2.4 -0.2 0.1 -9.0 2.4 117.8 110.8 113.2 -7.1 -4.6 0.3 0.2 Hinkley_Point 2.6 2.2 2.5 -0.4 -0.1 -15.6 -4.5 124.2 123.4 124.9 -0.8 0.7 0.4 0.1 Sheerness 4.1 4.6 4.6 0.5 0.5 11.7 11.8 355.2 337.4 8.2 -17.8 13.0 1.5 1.1 Avonmouth_Portbury 2.5 2.2 2.5 -0.3 0.0 -12.1 1.8 129.8 125.4 135.7 -4.4 5.9 0.3 0.3 Newport 2.6 2.2 2.5 -0.4 -0.1 -20.3 -3.5 131.5 131.6 130.3 0.2 -1.1 0.4 0.1 Mumbles 2.4 2.1 2.4 -0.3 -0.0 -11.8 -1.4 121.8 116.0 116.7 -5.8 -5.1 0.3 0.2 Milford_Haven 2.1 2.0 2.3 -0.1 0.2 -3.1 7.6 125.8 112.3 116.1 -13.5 -9.7 0.5 0.4 Harwich 3.8 4.4 4.3 0.6 0.5 14.3 11.8 337.0 324.0 345.3 -13.0 8.3 1.1 0.8 Fishguard 2.7 2.4 2.6 -0.3 -0.1 -13.1 -4.7 146.7 135.9 134.6 -10.8 -12.1 0.6 0.6 Lowestoft 4.2 4.6 4.5 0.4 0.3 9.2 7.7 318.7 306.1 327.2 -12.7 8.5 1.1 0.7 Barmouth 3.3 2.8 2.9 -0.5 -0.4 -17.6 -12.3 161.3 146.5 144.6 -14.9 -16.8 0.9 1.0 Cromer 4.7 5.3 5.3 0.6 0.6 11.0 11.8 289.8 274.1 295.5 -15.7 5.7 1.5 0.8 Holyhead 3.7 3.2 3.2 -0.5 -0.5 -14.1 -14.9 170.0 161.1 156.4 -8.9 -13.6 0.7 0.9 Llandudno 4.3 3.7 3.7 -0.6 -0.6 -17.0 -16.1 177.5 168.8 165.6 -8.6 -11.8 0.9 1.0 Liverpool 4.2 3.8 3.8 -0.4 -0.4 -9.9 -9.2 184.3 172.3 169.5 -12.0 -14.8 0.9 1.1 Immingham 5.0 5.5 6.1 0.5 1.1 9.7 17.4 267.9 253.8 288.5 -14.1 20.6 1.4 2.2 Heysham 4.3 3.9 4.2 -0.4 -0.1 -10.7 -3.0 185.7 176.4 187.5 -9.3 1.8 0.8 0.2 Port_Erin 3.9 3.2 3.3 -0.7 -0.6 -20.9 -18.5 183.8 172.1 170.2 -11.7 -13.5 1.0 1.0 Whitby 3.9 4.2 4.2 0.3 0.3 6.1 8.2 237.6 220.7 241.7 -16.9 4.1 1.2 0.5 Workington 4.2 3.8 3.8 -0.4 -0.4 -11.1 -10.7 189.5 180.2 178.6 -9.4 -11.0 0.8 0.9 Portpatrick 3.7 2.8 3.0 -0.9 -0.7 -31.5 -23.8 185.5 174.7 173.3 -10.8 -12.2 1.1 1.0 North_Shields 3.6 4.0 4.0 0.4 0.4 9.7 10.6 228.6 209.8 231.0 -18.8 2.4 1.3 0.5 Port_Ellen 2.9 2.0 2.0 -0.9 -0.9 -44.5 -43.1 184.8 164.3 173.1 -20.5 -11.7 1.2 1.0 Millport 3.7 2.9 2.9 -0.8 -0.8 -27.9 -26.4 186.1 177.0 177.3 -9.1 -8.8 1.0 0.9 Leith 3.8 4.1 4.3 0.3 0.5 7.2 11.0 205.5 189.5 208.4 -16.0 3.0 1.1 0.5 Tobermory 1.6 1.2 1.4 -0.4 -0.2 -29.1 -16.1 162.9 154.7 101.1 -8.2 -61.8 0.4 1.5 Aberdeen 3.4 3.7 3.8 0.3 0.4 7.9 9.7 191.1 177.2 193.3 -14.0 2.2 0.9 0.4 Ullapool 3.2 3.2 4.2 -0.0 1.0 -0.4 23.9 115.2 104.5 127.1 -10.7 11.9 0.6 1.3 Stornoway 3.9 3.4 4.2 -0.5 0.3 -16.2 8.0 125.3 118.3 135.0 -7.0 9.7 0.7 0.8 Wick 3.3 3.8 3.7 0.5 0.4 12.1 10.4 163.0 150.9 164.7 -12.1 1.7 0.9 0.4 Kinlochbervie 3.7 3.8 4.5 0.1 0.8 2.1 17.1 113.0 110.1 129.6 -2.9 16.5 0.2 1.4 Lerwick 2.2 2.6 2.9 0.4 0.7 16.8 22.8 148.4 140.5 153.9 -7.9 5.5 0.6 0.7 Total number of points 41 CS3X NEMO RMS amplitude error (cm) 0.46 0.52 Mean amplitude error (cm) -0.17 0.14 Mean amplitude error (%) -8.56 1.89 RMS phase error (deg) 11.63 15.01 Mean phase error (deg) -9.57 0.70 Total error in complex plane (cm) 30.58 32.30 Mean error in complex plane (cm) 0.75 0.79

Comparison between observed and computed tides K1 Analysis of 12 months tide data (2004) Port Ho Hc Hn DHc DHn DHPc DHPn Go Gc Gn DGc DGn HSc HSn Jersey 9.3 8.8 9.3 -0.5 0.0 -5.3 0.3 98.2 106.7 108.3 8.6 10.1 1.4 1.6 St_Marys 5.8 5.7 5.6 -0.1 -0.2 -1.7 -3.6 101.3 102.1 101.7 0.8 0.4 0.1 0.2 Newlyn 6.3 6.0 5.7 -0.3 -0.6 -5.0 -11.1 109.3 111.3 113.5 1.9 4.1 0.4 0.8 Plymouth 7.6 6.9 7.0 -0.7 -0.6 -9.4 -9.2 112.5 114.8 119.2 2.2 6.7 0.7 1.1 Weymouth 8.9 7.6 8.1 -1.3 -0.8 -16.9 -9.5 112.4 120.2 128.3 7.8 15.9 1.7 2.5 Bournemouth 8.8 7.4 8.2 -1.4 -0.6 -18.3 -7.6 113.2 122.0 130.9 8.8 17.8 1.8 2.7 Newhaven 7.4 5.6 7.0 -1.8 -0.4 -33.3 -5.7 104.6 119.2 130.6 14.6 26.0 2.5 3.3 Portsmouth 8.7 6.9 7.9 -1.8 -0.8 -27.0 -10.5 113.0 124.6 137.1 11.6 24.1 2.4 3.6 Dover 5.0 3.2 3.2 -1.8 -1.8 -55.0 -58.3 40.6 7.0 60.0 -33.6 19.4 2.9 2.3 Ilfracombe 6.5 6.3 5.8 -0.2 -0.7 -3.2 -11.2 125.3 122.1 121.5 -3.1 -3.8 0.4 0.8 Hinkley_Point 7.0 6.5 6.0 -0.5 -1.0 -6.9 -16.0 134.3 134.3 130.2 0.0 -4.1 0.5 1.1 Sheerness 11.3 11.5 10.4 0.2 -0.9 2.2 -8.9 11.2 355.9 26.2 -15.3 15.0 3.1 3.0 Avonmouth_Portbury 6.9 6.5 6.1 -0.4 -0.8 -5.5 -13.1 143.4 135.7 136.7 -7.7 -6.7 1.0 1.1 Newport 6.9 6.4 6.1 -0.5 -0.8 -7.2 -13.5 140.9 141.9 133.7 1.0 -7.2 0.5 1.2 Mumbles 6.6 6.4 5.9 -0.2 -0.7 -3.3 -12.0 131.3 127.6 125.2 -3.7 -6.1 0.5 1.0 Milford_Haven 6.5 6.2 5.8 -0.3 -0.7 -4.1 -11.3 131.4 124.5 125.0 -6.9 -6.4 0.8 1.0 Harwich 11.0 11.3 9.6 0.3 -1.4 2.3 -14.8 348.6 338.1 354.7 -10.4 6.1 2.0 1.8 Fishguard 7.7 7.2 6.6 -0.5 -1.1 -7.3 -16.2 152.5 146.2 141.9 -6.3 -10.6 1.0 1.7 Lowestoft 11.9 12.4 10.4 0.5 -1.5 4.1 -14.1 330.9 318.9 334.4 -11.9 3.6 2.6 1.6 Barmouth 8.2 8.2 7.3 0.0 -0.9 0.2 -12.2 165.6 158.3 151.8 -7.3 -13.8 1.0 2.1 Cromer 14.8 15.1 13.0 0.3 -1.8 1.7 -14.0 300.8 287.7 302.1 -13.1 1.3 3.4 1.9 Holyhead 10.5 9.6 8.3 -0.9 -2.2 -9.5 -26.8 176.8 171.6 162.8 -5.2 -14.1 1.3 3.2 Llandudno 11.8 10.6 9.2 -1.2 -2.6 -11.8 -28.0 185.2 179.8 172.5 -5.4 -12.7 1.6 3.5 Liverpool 12.1 11.0 9.5 -1.1 -2.6 -10.1 -26.8 190.7 183.9 176.9 -6.8 -13.8 1.8 3.6 Immingham 15.5 16.2 14.3 0.7 -1.2 4.5 -8.5 281.3 271.1 302.0 -10.2 20.7 2.9 5.5 Heysham 12.2 11.1 10.2 -1.1 -2.0 -9.8 -20.1 192.2 187.4 193.7 -4.8 1.5 1.5 2.1 Port_Erin 10.8 9.5 8.4 -1.3 -2.4 -13.5 -28.1 189.0 183.2 176.7 -5.9 -12.4 1.6 3.1 Whitby 12.8 13.2 11.7 0.4 -1.1 3.2 -9.3 251.1 237.1 250.0 -14.1 -1.1 3.2 1.1 Workington 12.1 10.9 9.6 -1.2 -2.5 -11.3 -26.6 194.7 191.2 185.0 -3.5 -9.7 1.4 3.1 Portpatrick 10.7 8.7 7.9 -2.0 -2.8 -23.3 -35.3 190.5 184.7 178.8 -5.8 -11.7 2.2 3.4 North_Shields 12.0 12.5 11.1 0.5 -0.9 4.4 -8.1 242.6 226.6 239.7 -16.1 -2.9 3.5 1.1 Port_Ellen 9.1 7.1 6.1 -2.0 -3.0 -28.4 -49.0 187.6 174.3 175.0 -13.3 -12.6 2.7 3.4 Millport 10.7 9.0 7.9 -1.7 -2.8 -19.2 -36.3 192.2 186.9 181.9 -5.4 -10.4 2.0 3.3 Leith 12.3 12.7 11.6 0.4 -0.7 3.3 -6.0 220.9 206.4 218.9 -14.5 -2.1 3.2 0.8 Tobermory 6.3 5.2 4.6 -1.1 -1.7 -20.0 -36.4 167.6 167.7 128.2 0.1 -39.5 1.1 4.0 Aberdeen 11.3 11.6 10.6 0.3 -0.7 2.8 -7.0 204.8 193.9 202.3 -10.9 -2.5 2.2 0.9 Ullapool 11.0 10.6 12.0 -0.4 1.0 -3.6 8.6 128.2 120.7 134.0 -7.4 5.8 1.5 1.6 Stornoway 13.1 11.8 12.7 -1.3 -0.4 -11.2 -2.9 135.4 134.1 140.4 -1.3 5.0 1.4 1.2 Wick 10.9 11.8 10.4 0.9 -0.5 7.7 -4.8 175.9 166.3 173.5 -9.6 -2.5 2.1 0.7 Kinlochbervie 12.2 13.1 12.8 0.9 0.6 6.7 4.7 125.5 125.9 135.2 0.3 9.7 0.9 2.2 Lerwick 7.5 8.4 8.2 0.9 0.7 11.1 8.0 164.5 160.4 164.2 -4.1 -0.3 1.1 0.7 Total number of points 41 CS3X NEMO RMS amplitude error (cm) 1.01 1.47 Mean amplitude error (cm) -0.51 -1.12 Mean amplitude error (%) -7.98 -14.91 RMS phase error (deg) 9.94 12.61 Mean phase error (deg) -5.02 -0.33 Total error in complex plane (cm) 69.76 84.26 Mean error in complex plane (cm) 1.70 2.06

Comparison between observed and computed tides 2N2 Analysis of 12 months tide data (2004) Port Ho Hc Hn DHc DHn DHPc DHPn Go Gc Gn DGc DGn HSc HSn Jersey 8.8 8.1 9.0 -0.7 0.2 -8.4 2.4 148.8 115.5 114.5 -33.3 -34.3 4.9 5.3 St_Marys 4.7 5.2 4.7 0.5 0.0 8.9 0.9 91.6 75.1 80.1 -16.5 -11.5 1.5 0.9 Newlyn 4.4 5.1 4.8 0.7 0.4 14.5 9.1 94.1 72.3 78.3 -21.8 -15.8 1.9 1.3 Plymouth 4.2 4.9 4.7 0.7 0.5 14.8 10.5 122.4 77.0 83.4 -45.4 -39.0 3.6 3.0 Weymouth 2.1 1.4 1.1 -0.7 -1.0 -51.2 -86.6 172.1 76.4 83.9 -95.7 -88.2 2.6 2.4 Bournemouth 1.7 0.8 0.8 -0.9 -0.9 -104.4 -119.1 218.3 274.6 272.6 56.4 54.3 1.4 1.4 Newhaven 5.4 7.6 7.0 2.2 1.6 29.1 23.0 278.9 259.5 264.0 -19.4 -14.9 3.1 2.3 Portsmouth 3.6 5.0 4.6 1.4 1.0 28.5 21.9 282.1 268.1 275.5 -13.9 -6.6 1.8 1.1 Dover 5.1 9.0 8.5 3.9 3.4 43.6 40.2 286.6 271.2 276.1 -15.4 -10.5 4.3 3.6 Ilfracombe 7.5 9.4 8.2 1.9 0.7 20.3 8.1 126.4 100.3 99.9 -26.1 -26.5 4.2 3.6 Hinkley_Point 9.2 13.7 12.4 4.5 3.2 32.9 26.1 152.7 112.0 104.7 -40.7 -47.9 9.0 9.3 Sheerness 4.2 9.0 8.7 4.8 4.5 53.1 52.0 304.3 277.0 299.3 -27.3 -5.0 5.6 4.6 Avonmouth_Portbury 9.4 13.9 15.6 4.5 6.2 32.6 39.8 172.6 114.8 109.2 -57.7 -63.4 12.0 14.2 Newport 9.3 15.0 13.9 5.7 4.6 37.8 32.9 167.6 125.8 108.2 -41.8 -59.5 10.1 12.2 Mumbles 7.8 10.0 8.5 2.2 0.7 22.0 8.0 134.9 108.8 107.1 -26.1 -27.8 4.6 4.0 Milford_Haven 5.8 6.6 5.6 0.8 -0.2 11.5 -4.0 135.1 110.0 115.3 -25.1 -19.8 2.8 2.0 Harwich 2.6 6.2 5.7 3.6 3.1 57.9 54.3 269.4 259.0 270.8 -10.4 1.4 3.6 3.1 Fishguard 3.9 3.2 2.8 -0.7 -1.1 -23.3 -38.5 168.8 150.6 157.7 -18.2 -11.1 1.3 1.3 Lowestoft 1.9 3.3 2.7 1.4 0.8 43.0 30.5 205.2 201.5 227.6 -3.7 22.4 1.4 1.2 Barmouth 3.8 3.3 3.4 -0.5 -0.4 -13.9 -12.9 197.3 184.8 196.2 -12.5 -1.1 0.9 0.4 Cromer 4.0 6.7 5.3 2.7 1.3 40.5 24.9 142.4 128.9 138.7 -13.5 -3.7 3.0 1.4 Holyhead 4.8 6.1 5.4 1.3 0.6 21.1 10.7 243.5 248.4 247.3 4.9 3.8 1.4 0.7 Llandudno 6.8 8.9 8.7 2.1 1.9 23.7 21.9 262.9 258.9 259.6 -4.0 -3.3 2.2 2.0 Liverpool 7.5 9.8 9.5 2.3 2.0 23.4 21.3 276.4 262.9 264.1 -13.5 -12.3 3.1 2.7 Immingham 5.5 9.7 9.5 4.2 4.0 43.3 42.0 120.4 92.1 121.7 -28.3 1.4 5.5 4.0 Heysham 7.9 10.1 10.9 2.2 3.0 21.6 27.5 278.3 269.1 277.3 -9.1 -1.0 2.6 3.0 Port_Erin 4.6 6.3 6.6 1.7 2.0 26.4 30.0 269.1 273.5 274.6 4.4 5.5 1.7 2.0 Whitby 4.3 6.1 5.2 1.8 0.9 29.5 18.0 56.8 48.1 55.6 -8.7 -1.2 2.0 1.0 Workington 6.9 9.6 9.3 2.7 2.4 27.8 26.2 284.3 280.7 280.8 -3.6 -3.5 2.7 2.5 Portpatrick 3.3 4.0 5.3 0.7 2.0 17.3 37.9 279.1 280.3 281.0 1.2 2.0 0.7 2.0 North_Shields 4.2 5.8 5.0 1.6 0.8 28.0 16.1 42.5 30.9 38.8 -11.6 -3.8 1.9 0.9 Port_Ellen 0.2 0.7 1.0 0.5 0.8 73.1 79.7 86.6 220.9 292.4 134.3 -154.2 0.9 1.2 Millport 2.7 4.3 4.9 1.6 2.2 36.6 44.4 288.8 284.1 286.5 -4.8 -2.4 1.6 2.2 Leith 4.7 6.2 5.7 1.5 1.0 24.2 18.0 8.9 358.4 2.9 -10.5 -6.0 1.8 1.2 Tobermory 3.6 2.5 3.9 -1.1 0.3 -41.8 7.9 128.8 118.5 124.4 -10.4 -4.4 1.2 0.4 Aberdeen 3.6 4.5 3.9 0.9 0.3 20.3 6.9 338.4 334.1 336.0 -4.3 -2.4 1.0 0.3 Ullapool 4.1 4.5 4.6 0.4 0.5 8.4 10.5 158.1 162.6 164.3 4.5 6.2 0.5 0.7 Stornoway 3.8 4.0 4.2 0.2 0.4 4.1 9.9 155.3 161.1 160.9 5.8 5.7 0.4 0.6 Wick 2.8 4.0 3.1 1.2 0.3 29.9 10.8 282.5 274.6 268.9 -8.0 -13.7 1.3 0.8 Kinlochbervie 4.0 4.2 4.3 0.2 0.3 5.6 6.8 164.3 178.6 171.0 14.4 6.7 1.1 0.6 Lerwick 1.7 1.8 1.3 0.1 -0.4 3.4 -32.2 271.9 265.3 258.2 -6.7 -13.7 0.2 0.5 Total number of points 41 CS3X NEMO RMS amplitude error (cm) 2.27 2.08 Mean amplitude error (cm) 1.56 1.32 Mean amplitude error (%) 17.45 13.12 RMS phase error (deg) 33.98 35.32 Mean phase error (deg) -11.27 -14.61 Total error in complex plane (cm) 117.35 107.49 Mean error in complex plane (cm) 2.86 2.62

Comparison between observed and computed tides MU2 Analysis of 12 months tide data (2004) Port Ho Hc Hn DHc DHn DHPc DHPn Go Gc Gn DGc DGn HSc HSn Jersey 22.0 13.5 18.8 -8.5 -3.2 -62.4 -16.9 198.2 219.0 225.2 20.8 27.0 10.5 10.0 St_Marys 4.7 2.9 3.5 -1.8 -1.2 -62.7 -33.4 141.7 158.1 148.4 16.5 6.8 2.1 1.3 Newlyn 5.3 4.0 3.5 -1.3 -1.8 -31.5 -51.0 168.9 195.4 177.9 26.5 9.0 2.5 1.9 Plymouth 12.1 8.5 8.2 -3.6 -3.9 -42.6 -47.8 190.8 202.7 200.8 11.9 10.0 4.2 4.3 Weymouth 11.0 9.4 8.9 -1.6 -2.1 -16.8 -24.1 192.4 197.1 200.2 4.7 7.8 1.8 2.5 Bournemouth 7.1 6.2 6.1 -0.9 -1.0 -13.9 -16.1 191.9 188.1 193.8 -3.9 1.9 1.0 1.0 Newhaven 6.8 7.8 6.8 1.0 0.0 12.3 0.2 19.5 60.9 58.5 41.4 39.0 5.2 4.5 Portsmouth 2.1 3.4 3.1 1.3 1.0 39.1 31.4 28.6 85.1 90.0 56.5 61.4 2.9 2.8 Dover 8.9 11.1 9.7 2.2 0.8 20.0 8.4 50.2 80.0 79.5 29.8 29.2 5.6 4.8 Ilfracombe 13.8 12.5 13.1 -1.3 -0.7 -10.2 -5.3 196.7 224.9 209.8 28.3 13.1 6.5 3.1 Hinkley_Point 33.2 30.1 32.3 -3.1 -0.9 -10.2 -2.9 235.1 259.7 241.9 24.5 6.8 13.8 4.0 Sheerness 12.9 13.8 14.8 0.9 1.9 6.8 13.1 91.3 98.1 112.7 6.8 21.5 1.8 5.5 Avonmouth_Portbury 48.4 30.5 50.3 -17.9 1.9 -58.9 3.8 258.8 264.2 257.7 5.4 -1.1 18.3 2.1 Newport 43.3 35.1 39.6 -8.2 -3.7 -23.3 -9.3 252.9 283.2 251.0 30.3 -1.9 21.9 3.9 Mumbles 14.0 14.2 13.4 0.2 -0.6 1.4 -4.1 215.0 238.7 221.3 23.7 6.4 5.8 1.6 Milford_Haven 7.9 6.0 6.6 -1.9 -1.3 -31.5 -20.0 187.2 208.1 197.6 20.9 10.4 3.1 1.9 Harwich 7.0 9.0 7.5 2.0 0.5 22.2 6.4 78.9 96.8 105.6 17.9 26.7 3.2 3.4 Fishguard 7.2 5.5 6.3 -1.7 -0.9 -31.5 -14.7 187.8 197.5 193.0 9.6 5.1 2.0 1.1 Lowestoft 2.5 3.3 3.3 0.8 0.8 24.9 23.9 95.5 86.6 120.1 -8.9 24.6 0.9 1.5 Barmouth 4.6 6.5 6.5 1.9 1.9 29.5 29.7 205.4 221.8 201.0 16.4 -4.4 2.5 2.0 Cromer 1.8 2.8 1.1 1.0 -0.7 35.9 -70.2 202.7 314.5 247.8 111.8 45.1 3.9 1.3 Holyhead 3.4 3.2 4.0 -0.2 0.6 -6.9 15.6 180.3 165.3 178.8 -14.9 -1.5 0.9 0.6 Llandudno 0.9 2.5 1.9 1.6 1.0 63.4 52.4 98.8 100.9 110.0 2.1 11.2 1.6 1.0 Liverpool 4.5 3.4 2.6 -1.1 -1.9 -31.9 -73.7 31.2 61.9 66.8 30.7 35.6 2.3 2.8 Immingham 8.2 11.1 15.6 2.9 7.4 26.2 47.5 222.3 243.3 282.9 20.9 60.6 4.5 13.6 Heysham 2.1 4.4 14.7 2.3 12.6 52.0 85.7 59.9 72.8 67.9 12.9 8.0 2.4 12.6 Port_Erin 3.3 5.0 4.0 1.7 0.7 34.6 18.2 160.3 158.2 158.2 -2.1 -2.1 1.8 0.7 Whitby 1.5 2.5 1.5 1.0 -0.0 39.9 -0.0 61.1 310.2 26.1 -111.0 -35.0 3.3 0.9 Workington 1.8 5.0 4.2 3.2 2.4 63.7 57.5 75.7 112.4 94.6 36.7 18.9 3.7 2.6 Portpatrick 3.2 5.5 4.5 2.3 1.3 41.3 29.4 136.0 143.4 142.9 7.4 6.8 2.3 1.4 North_Shields 1.4 2.7 1.8 1.3 0.4 48.1 23.4 44.8 300.1 5.6 -104.7 -39.1 3.3 1.2 Port_Ellen 3.5 5.2 4.1 1.7 0.6 32.4 14.9 111.2 133.5 124.8 22.3 13.6 2.4 1.1 Millport 3.6 6.1 5.1 2.5 1.5 41.3 28.9 119.6 144.6 132.7 25.0 13.2 3.2 1.8 Leith 2.0 2.9 2.0 0.9 0.0 31.8 1.7 3.3 281.2 16.4 -82.1 13.1 3.3 0.5 Tobermory 5.7 4.9 5.4 -0.8 -0.3 -17.1 -6.3 133.8 134.2 137.9 0.4 4.1 0.8 0.5 Aberdeen 2.1 2.7 2.8 0.6 0.7 22.0 24.7 314.8 265.2 311.0 -49.6 -3.8 2.1 0.7 Ullapool 5.7 5.3 5.8 -0.4 0.1 -7.6 1.7 146.8 142.0 151.6 -4.8 4.8 0.6 0.5 Stornoway 5.6 5.1 5.7 -0.5 0.1 -9.9 2.6 143.4 142.5 149.0 -0.9 5.6 0.5 0.6 Wick 2.0 2.0 2.6 -0.0 0.6 -2.5 22.7 306.2 228.5 284.9 -77.8 -21.4 2.5 1.0 Kinlochbervie 5.5 5.3 5.5 -0.2 -0.0 -4.3 -0.9 148.6 150.4 152.3 1.8 3.7 0.3 0.4 Lerwick 2.3 2.3 2.8 0.0 0.5 0.6 17.0 270.5 259.0 276.8 -11.5 6.3 0.5 0.5 Total number of points 41 CS3X NEMO RMS amplitude error (cm) 3.72 2.70 Mean amplitude error (cm) -0.53 0.37 Mean amplitude error (%) 5.22 4.00 RMS phase error (deg) 40.43 22.54 Mean phase error (deg) 4.68 10.90 Total error in complex plane (cm) 161.83 109.56 Mean error in complex plane (cm) 3.95 2.67

Comparison between observed and computed tides N2 Analysis of 12 months tide data (2004) Port Ho Hc Hn DHc DHn DHPc DHPn Go Gc Gn DGc DGn HSc HSn Jersey 65.8 57.2 63.4 -8.6 -2.4 -15.0 -3.7 165.9 170.3 174.2 4.4 8.3 9.8 9.6 St_Marys 34.5 33.0 31.9 -1.5 -2.6 -4.7 -8.1 111.2 113.7 117.3 2.5 6.1 2.1 4.4 Newlyn 33.0 29.9 30.1 -3.1 -2.9 -10.2 -9.5 113.6 116.6 119.0 3.0 5.4 3.5 4.1 Plymouth 31.8 29.7 29.8 -2.1 -2.0 -7.2 -6.6 138.2 136.1 140.7 -2.1 2.5 2.4 2.4 Weymouth 13.5 16.7 16.3 3.2 2.8 19.2 16.9 185.0 175.6 183.3 -9.4 -1.7 4.0 2.8 Bournemouth 10.8 9.7 10.9 -1.1 0.1 -11.0 0.5 247.1 224.4 225.9 -22.7 -21.2 4.2 4.0 Newhaven 42.3 36.8 34.6 -5.5 -7.7 -14.9 -22.1 299.7 305.6 308.0 5.9 8.3 6.8 9.5 Portsmouth 27.5 24.9 22.7 -2.6 -4.8 -10.6 -21.4 303.9 306.2 309.8 2.3 5.8 2.8 5.5 Dover 40.9 39.2 38.0 -1.7 -2.9 -4.4 -7.5 309.5 320.1 324.3 10.6 14.8 7.6 10.6 Ilfracombe 57.7 56.0 53.5 -1.7 -4.2 -3.0 -7.9 144.3 153.1 153.0 8.8 8.7 8.9 9.5 Hinkley_Point 71.6 67.7 69.2 -3.9 -2.4 -5.7 -3.4 168.3 180.7 176.7 12.5 8.5 15.6 10.7 Sheerness 34.2 31.5 30.3 -2.7 -3.9 -8.5 -12.7 329.9 328.3 1.5 -1.5 31.7 2.8 18.0 Avonmouth_Portbury 75.7 67.5 76.5 -8.2 0.8 -12.2 1.0 188.0 183.5 194.2 -4.5 6.2 9.9 8.2 Newport 74.3 64.9 72.8 -9.4 -1.5 -14.4 -2.1 182.4 197.9 185.5 15.5 3.1 20.9 4.3 Mumbles 58.4 57.7 53.9 -0.7 -4.5 -1.2 -8.3 154.4 163.3 160.7 8.9 6.3 9.0 7.6 Milford_Haven 43.2 42.5 39.2 -0.7 -4.0 -1.5 -10.3 153.5 154.6 158.9 1.1 5.4 1.1 5.6 Harwich 21.4 20.9 20.9 -0.5 -0.5 -2.4 -2.6 295.1 299.0 316.7 3.9 21.6 1.5 7.9 Fishguard 28.1 26.8 26.0 -1.3 -2.1 -4.9 -8.0 188.5 189.4 191.6 0.9 3.1 1.4 2.5 Lowestoft 13.3 14.9 11.6 1.6 -1.7 10.5 -14.4 230.4 221.2 251.3 -9.2 20.8 2.7 4.8 Barmouth 29.2 29.7 29.2 0.5 0.0 1.7 0.0 218.6 220.6 219.4 2.0 0.8 1.1 0.4 Cromer 30.2 34.4 29.6 4.2 -0.6 12.1 -2.0 164.6 165.7 181.3 1.2 16.8 4.2 8.7 Holyhead 35.8 34.2 30.8 -1.6 -5.0 -4.8 -16.4 267.0 273.6 267.1 6.6 0.1 4.3 5.0 Llandudno 51.6 48.3 46.7 -3.3 -4.9 -6.8 -10.5 286.0 292.6 291.1 6.6 5.1 6.6 6.6 Liverpool 57.9 53.8 51.3 -4.1 -6.6 -7.7 -12.9 298.3 300.4 298.9 2.0 0.6 4.6 6.6 Immingham 42.4 46.4 36.4 4.0 -6.0 8.6 -16.5 140.7 144.9 188.4 4.2 47.7 5.2 32.3 Heysham 60.4 54.0 51.3 -6.4 -9.1 -11.9 -17.8 301.8 307.5 329.2 5.8 27.4 8.6 27.9 Port_Erin 35.3 30.6 32.8 -4.7 -2.5 -15.3 -7.5 295.4 298.1 300.2 2.7 4.8 4.9 3.8 Whitby 32.3 33.6 31.5 1.3 -0.8 3.7 -2.4 80.1 77.5 92.9 -2.6 12.8 1.9 7.2 Workington 52.2 48.4 47.9 -3.8 -4.3 -7.9 -9.0 308.1 316.8 317.1 8.8 9.0 8.6 9.0 Portpatrick 25.6 14.8 23.9 -10.8 -1.7 -73.5 -7.0 305.6 305.2 309.0 -0.4 3.4 10.8 2.2 North_Shields 31.2 32.5 30.5 1.3 -0.7 3.9 -2.4 65.2 59.0 74.8 -6.3 9.6 3.7 5.2 Port_Ellen 2.5 7.9 1.7 5.4 -0.8 68.5 -44.9 81.2 167.6 61.9 86.4 -19.3 8.2 1.0 Millport 21.0 15.1 20.3 -5.9 -0.7 -39.4 -3.4 315.7 309.7 319.1 -5.9 3.5 6.2 1.4 Leith 35.0 35.8 36.2 0.8 1.2 2.2 3.2 31.8 25.5 42.6 -6.3 10.8 4.0 6.8 Tobermory 26.4 23.0 29.0 -3.4 2.6 -14.6 9.1 148.0 147.1 153.9 -0.9 5.9 3.4 3.9 Aberdeen 25.9 26.6 25.5 0.7 -0.4 2.5 -1.5 1.1 359.0 8.9 -2.1 7.8 1.2 3.5 Ullapool 30.4 32.4 32.4 2.0 2.0 6.3 6.2 178.6 185.1 189.0 6.5 10.4 4.1 6.0 Stornoway 28.2 29.4 30.3 1.2 2.1 4.2 7.0 175.7 183.6 185.6 7.8 9.9 4.1 5.5 Wick 20.3 24.6 21.8 4.3 1.5 17.5 6.8 302.1 301.3 307.7 -0.7 5.6 4.3 2.5 Kinlochbervie 29.2 30.5 30.2 1.3 1.0 4.3 3.2 185.4 199.0 194.5 13.6 9.1 7.2 4.8 Lerwick 12.0 13.6 12.1 1.6 0.1 11.8 1.2 291.5 291.0 298.6 -0.4 7.2 1.6 1.5 Total number of points 41 CS3X NEMO RMS amplitude error (cm) 4.12 3.38 Mean amplitude error (cm) -1.61 -1.95 Mean amplitude error (%) -3.33 -6.04 RMS phase error (deg) 15.29 13.76 Mean phase error (deg) 3.89 8.11 Total error in complex plane (cm) 226.09 283.81 Mean error in complex plane (cm) 5.51 6.92

Comparison between observed and computed tides NU2 Analysis of 12 months tide data (2004) Port Ho Hc Hn DHc DHn DHPc DHPn Go Gc Gn DGc DGn HSc HSn Jersey 11.6 12.0 14.5 0.4 2.9 3.0 20.2 150.1 152.6 150.0 2.5 -0.1 0.6 2.9 St_Marys 7.3 7.4 7.6 0.1 0.3 1.4 3.7 106.7 105.7 104.1 -1.0 -2.5 0.2 0.4 Newlyn 7.2 7.1 7.5 -0.1 0.3 -1.1 3.8 106.5 106.0 104.9 -0.5 -1.6 0.1 0.4 Plymouth 6.7 7.0 7.5 0.3 0.8 4.3 10.6 118.2 117.0 118.2 -1.3 -0.1 0.3 0.8 Weymouth 1.5 2.8 3.0 1.3 1.5 46.8 49.5 140.7 139.9 145.9 -0.8 5.2 1.3 1.5 Bournemouth 1.3 0.9 1.3 -0.4 -0.0 -39.6 -0.8 279.5 229.9 216.3 -49.6 -63.2 1.0 1.4 Newhaven 9.3 9.3 9.3 -0.0 -0.0 -0.4 -0.0 291.3 294.2 292.8 2.9 1.5 0.5 0.2 Portsmouth 5.8 6.0 5.9 0.2 0.1 3.6 1.6 299.3 298.6 299.2 -0.7 -0.0 0.2 0.1 Dover 10.1 10.4 10.8 0.3 0.7 3.3 6.5 301.5 309.2 308.9 7.8 7.4 1.4 1.5 Ilfracombe 12.4 13.5 13.1 1.1 0.7 8.1 5.7 132.2 138.6 132.8 6.5 0.7 1.8 0.8 Hinkley_Point 16.7 17.7 17.8 1.0 1.1 5.9 6.2 142.0 157.2 147.0 15.1 5.0 4.6 1.9 Sheerness 10.5 9.6 10.4 -0.9 -0.1 -9.5 -1.2 320.9 316.7 338.2 -4.2 17.2 1.2 3.1 Avonmouth_Portbury 19.7 17.9 19.6 -1.8 -0.1 -9.9 -0.3 150.8 159.8 156.2 9.0 5.4 3.4 1.8 Newport 17.7 18.4 18.8 0.7 1.1 3.8 6.1 149.9 170.4 152.4 20.6 2.5 6.5 1.4 Mumbles 13.0 14.1 13.4 1.1 0.4 8.1 3.3 140.5 148.3 140.3 7.8 -0.2 2.2 0.4 Milford_Haven 9.0 9.7 9.3 0.7 0.3 7.7 3.4 145.5 143.7 142.3 -1.8 -3.2 0.8 0.6 Harwich 6.5 6.4 6.7 -0.1 0.2 -2.1 3.5 296.0 298.1 306.9 2.1 10.9 0.3 1.3 Fishguard 4.9 5.5 5.5 0.6 0.6 10.3 10.7 182.5 177.0 174.4 -5.5 -8.1 0.8 0.9 Lowestoft 3.3 3.1 2.9 -0.2 -0.4 -6.1 -12.7 249.8 231.1 256.6 -18.8 6.8 1.1 0.5 Barmouth 4.6 5.8 5.9 1.2 1.3 20.2 22.3 215.4 209.5 206.4 -5.9 -9.1 1.3 1.6 Cromer 6.1 7.3 6.9 1.2 0.8 16.7 12.1 166.3 159.6 167.7 -6.6 1.4 1.4 0.9 Holyhead 7.6 7.5 6.9 -0.1 -0.7 -1.9 -9.4 273.5 272.8 262.4 -0.7 -11.1 0.2 1.5 Llandudno 11.7 11.2 11.5 -0.5 -0.2 -4.9 -1.8 288.3 288.7 282.7 0.4 -5.6 0.6 1.2 Liverpool 13.3 12.5 12.7 -0.8 -0.6 -6.2 -4.3 297.1 294.7 289.0 -2.4 -8.1 0.9 1.9 Immingham 9.7 10.6 11.1 0.9 1.4 8.7 12.4 133.5 128.3 158.2 -5.2 24.7 1.3 4.6 Heysham 13.6 12.7 13.9 -0.9 0.3 -7.3 1.9 302.0 301.3 308.7 -0.6 6.8 0.9 1.6 Port_Erin 8.1 7.1 8.1 -1.0 0.0 -13.9 0.5 301.5 301.5 296.4 0.0 -5.1 1.0 0.7 Whitby 6.8 6.8 7.3 0.0 0.5 0.4 6.2 83.7 76.4 82.4 -7.3 -1.3 0.9 0.5 Workington 12.0 11.8 12.3 -0.2 0.3 -1.8 2.3 309.0 312.8 307.0 3.8 -2.0 0.8 0.5 Portpatrick 6.3 4.1 6.4 -2.2 0.1 -52.7 1.4 310.3 315.7 306.8 5.4 -3.5 2.2 0.4 North_Shields 6.5 6.5 7.0 0.0 0.5 0.4 6.5 69.5 58.7 64.9 -10.8 -4.6 1.2 0.7 Port_Ellen 0.5 0.6 1.2 0.1 0.7 12.0 57.1 337.0 136.8 3.1 159.8 26.1 1.1 0.7 Millport 5.5 4.4 5.9 -1.1 0.4 -25.4 6.3 317.1 320.9 316.4 3.9 -0.7 1.2 0.4 Leith 7.3 7.0 8.2 -0.3 0.9 -4.3 10.6 37.5 25.3 31.2 -12.2 -6.3 1.5 1.2 Tobermory 4.7 4.2 6.0 -0.5 1.3 -13.0 21.9 150.2 132.1 137.7 -18.2 -12.5 1.5 1.8 Aberdeen 5.3 5.0 5.5 -0.3 0.2 -5.1 4.2 7.8 359.3 359.2 -8.5 -8.6 0.8 0.8 Ullapool 5.6 5.8 6.6 0.2 1.0 4.2 14.8 184.0 177.6 176.4 -6.4 -7.6 0.7 1.3 Stornoway 5.1 5.3 6.1 0.2 1.0 2.9 16.3 181.1 175.4 172.8 -5.7 -8.3 0.5 1.3 Wick 4.2 4.6 4.7 0.4 0.5 8.5 11.3 303.9 298.3 294.2 -5.6 -9.7 0.6 0.9 Kinlochbervie 5.4 5.4 6.1 0.0 0.7 0.0 11.5 191.6 192.6 182.6 1.0 -8.9 0.1 1.1 Lerwick 2.2 2.3 2.5 0.1 0.3 4.9 10.8 295.1 285.4 283.4 -9.6 -11.6 0.4 0.5 Total number of points 41 CS3X NEMO RMS amplitude error (cm) 0.77 0.82 Mean amplitude error (cm) 0.02 0.52 Mean amplitude error (%) -0.49 8.16 RMS phase error (deg) 27.24 13.16 Mean phase error (deg) 1.43 -2.00 Total error in complex plane (cm) 49.41 48.22 Mean error in complex plane (cm) 1.21 1.18

Comparison between observed and computed tides M2 Analysis of 12 months tide data (2004) Port Ho Hc Hn DHc DHn DHPc DHPn Go Gc Gn DGc DGn HSc HSn Jersey 335.3 305.6 338.8 -29.7 3.5 -9.7 1.0 182.7 186.2 189.4 3.5 6.6 35.6 39.2 St_Marys 175.7 173.6 166.8 -2.1 -8.9 -1.2 -5.3 131.3 132.0 135.3 0.7 4.0 3.0 14.9 Newlyn 171.7 161.4 160.2 -10.3 -11.5 -6.4 -7.2 133.5 134.3 136.8 0.8 3.3 10.6 14.9 Plymouth 168.6 162.2 160.9 -6.4 -7.7 -4.0 -4.8 154.1 151.1 155.9 -2.9 1.9 10.6 9.4 Weymouth 60.5 82.4 78.6 21.9 18.1 26.6 23.1 191.7 184.9 193.8 -6.8 2.0 23.5 18.3 Bournemouth 41.6 39.9 46.2 -1.7 4.6 -4.2 10.0 272.8 242.0 243.9 -30.8 -28.9 21.7 22.4 Newhaven 224.3 206.6 193.2 -17.7 -31.1 -8.6 -16.1 321.3 325.1 327.5 3.8 6.2 22.7 38.3 Portsmouth 140.7 135.7 123.9 -5.0 -16.8 -3.7 -13.6 326.9 327.1 331.0 0.2 4.1 5.0 19.3 Dover 225.1 223.6 214.9 -1.5 -10.2 -0.7 -4.8 332.0 340.8 344.4 8.8 12.5 34.6 48.9 Ilfracombe 304.8 312.6 292.9 7.8 -11.9 2.5 -4.1 162.5 169.4 168.9 6.9 6.4 38.2 35.4 Hinkley_Point 391.6 391.3 388.2 -0.3 -3.4 -0.1 -0.9 183.2 194.1 189.6 10.9 6.5 74.5 44.0 Sheerness 201.6 185.0 177.5 -16.6 -24.1 -9.0 -13.6 354.1 350.8 21.1 -3.3 27.0 19.9 91.7 Avonmouth_Portbury 426.2 391.8 431.7 -34.4 5.5 -8.8 1.3 201.6 196.9 204.6 -4.7 3.0 47.8 23.1 Newport 414.9 384.1 410.2 -30.8 -4.7 -8.0 -1.1 195.7 210.4 197.4 14.7 1.8 107.0 13.6 Mumbles 311.6 323.9 296.8 12.3 -14.8 3.8 -5.0 172.5 179.5 176.6 7.0 4.2 40.8 26.6 Milford_Haven 222.4 230.6 209.3 8.2 -13.1 3.6 -6.3 173.0 172.2 176.0 -0.8 3.0 8.8 17.4 Harwich 124.9 121.1 119.4 -3.8 -5.5 -3.1 -4.6 321.6 325.3 341.4 3.8 19.8 8.9 42.4 Fishguard 136.2 140.9 134.3 4.7 -1.9 3.3 -1.4 207.5 205.1 207.4 -2.4 -0.0 7.4 1.9 Lowestoft 69.3 73.0 57.0 3.7 -12.3 5.1 -21.6 259.5 247.3 279.4 -12.2 19.8 15.6 24.9 Barmouth 146.6 153.8 148.3 7.2 1.7 4.7 1.1 238.8 234.9 236.0 -3.8 -2.8 12.4 7.3 Cromer 156.9 176.7 149.6 19.8 -7.3 11.2 -4.9 188.4 187.6 202.3 -0.8 13.9 19.9 37.8 Holyhead 180.2 174.8 155.9 -5.4 -24.3 -3.1 -15.6 291.8 294.1 287.9 2.3 -4.0 8.9 26.9 Llandudno 268.2 255.4 246.6 -12.8 -21.6 -5.0 -8.8 310.1 312.6 311.4 2.6 1.3 17.4 22.4 Liverpool 303.4 285.8 272.7 -17.6 -30.7 -6.2 -11.3 321.1 319.5 318.5 -1.5 -2.6 19.3 33.3 Immingham 226.8 244.7 198.1 17.9 -28.7 7.3 -14.5 162.1 162.9 203.0 0.8 40.9 18.2 150.9 Heysham 316.6 289.3 286.0 -27.3 -30.6 -9.4 -10.7 325.7 326.9 345.1 1.2 19.4 28.0 105.8 Port_Erin 182.8 158.4 171.4 -24.4 -11.4 -15.4 -6.6 321.7 322.7 323.3 1.0 1.6 24.6 12.4 Whitby 166.0 166.0 155.8 -0.0 -10.2 -0.0 -6.5 104.2 100.6 114.8 -3.7 10.6 10.6 31.5 Workington 273.2 261.8 258.1 -11.4 -15.1 -4.4 -5.8 332.3 338.0 337.7 5.7 5.4 28.8 29.2 Portpatrick 133.7 83.0 129.1 -50.7 -4.6 -61.1 -3.6 332.1 339.7 335.5 7.6 3.4 52.6 9.1 North_Shields 160.1 159.5 149.8 -0.6 -10.3 -0.4 -6.8 89.2 81.9 96.6 -7.3 7.5 20.3 22.7 Port_Ellen 16.3 27.2 26.2 10.9 9.9 40.1 37.9 90.6 154.7 59.9 64.0 -30.8 24.9 14.8 Millport 111.6 86.9 115.5 -24.7 3.9 -28.4 3.4 342.7 346.0 348.3 3.3 5.6 25.3 11.7 Leith 179.6 174.6 177.6 -5.0 -2.0 -2.8 -1.1 55.4 47.6 62.6 -7.9 7.2 24.8 22.5 Tobermory 130.4 110.2 140.5 -20.2 10.1 -18.3 7.2 168.6 154.9 164.6 -13.7 -4.0 35.1 13.8 Aberdeen 130.3 127.1 122.2 -3.2 -8.1 -2.5 -6.6 24.6 20.9 29.8 -3.7 5.2 9.0 14.0 Ullapool 150.7 149.3 149.8 -1.4 -0.9 -0.9 -0.6 200.8 199.2 202.9 -1.6 2.1 4.5 5.7 Stornoway 139.0 134.1 138.7 -4.9 -0.3 -3.7 -0.2 197.6 197.0 199.1 -0.6 1.5 5.1 3.6 Wick 101.5 116.5 102.7 15.0 1.2 12.9 1.1 322.4 320.9 326.1 -1.5 3.8 15.2 6.8 Kinlochbervie 143.8 138.0 138.3 -5.8 -5.5 -4.2 -4.0 208.0 214.4 209.4 6.4 1.4 16.8 6.5 Lerwick 58.0 62.6 56.4 4.6 -1.6 7.3 -2.9 312.0 310.4 317.8 -1.6 5.8 4.9 6.1 Total number of points 41 CS3X NEMO RMS amplitude error (cm) 16.66 14.04 Mean amplitude error (cm) -5.90 -8.12 Mean amplitude error (%) -2.56 -3.29 RMS phase error (deg) 12.45 12.47 Mean phase error (deg) 1.08 4.78 Total error in complex plane (cm) 962.54 1141.38 Mean error in complex plane (cm) 23.48 27.84

Comparison between observed and computed tides S2 Analysis of 12 months tide data (2004) Port Ho Hc Hn DHc DHn DHPc DHPn Go Gc Gn DGc DGn HSc HSn Jersey 129.7 113.4 125.0 -16.3 -4.7 -14.4 -3.8 232.7 236.5 241.7 3.8 8.9 18.2 20.4 St_Marys 59.9 59.9 57.8 -0.0 -2.1 -0.0 -3.7 173.1 174.8 178.4 1.7 5.3 1.8 5.8 Newlyn 57.3 53.7 53.9 -3.6 -3.4 -6.8 -6.3 177.8 179.6 181.2 1.8 3.4 4.0 4.7 Plymouth 60.3 56.6 56.2 -3.7 -4.1 -6.5 -7.3 207.4 202.9 207.3 -4.6 -0.2 5.9 4.1 Weymouth 31.5 37.0 35.2 5.5 3.7 14.8 10.4 243.4 238.5 246.0 -5.0 2.5 6.2 3.9 Bournemouth 18.5 19.9 21.8 1.4 3.3 7.1 15.2 292.0 274.0 278.8 -18.0 -13.2 6.2 5.7 Newhaven 71.8 64.3 59.9 -7.5 -11.9 -11.7 -19.9 11.4 16.5 18.9 5.1 7.5 9.6 14.7 Portsmouth 43.0 40.8 36.7 -2.2 -6.3 -5.3 -17.1 13.7 15.2 18.6 1.4 4.8 2.4 7.1 Dover 70.6 69.0 66.3 -1.6 -4.3 -2.3 -6.5 23.9 34.3 37.9 10.4 13.9 12.8 17.1 Ilfracombe 110.3 111.1 106.4 0.8 -3.9 0.7 -3.6 209.5 218.4 218.4 8.9 9.0 17.1 17.3 Hinkley_Point 138.6 135.3 140.7 -3.3 2.1 -2.4 1.5 238.1 249.6 246.3 11.5 8.2 27.7 20.1 Sheerness 57.7 53.0 50.3 -4.7 -7.4 -9.0 -14.8 51.1 47.2 82.5 -3.9 31.5 6.0 30.1 Avonmouth_Portbury 149.7 134.5 158.0 -15.2 8.3 -11.3 5.2 261.6 252.6 266.8 -9.0 5.2 27.0 16.2 Newport 145.9 127.6 148.7 -18.3 2.8 -14.3 1.9 254.1 268.4 256.5 14.2 2.3 38.4 6.6 Mumbles 110.6 114.3 106.9 3.7 -3.7 3.3 -3.5 220.3 229.3 226.7 9.0 6.4 18.0 12.7 Milford_Haven 80.6 82.5 75.7 1.9 -4.9 2.3 -6.5 217.5 218.3 222.6 0.8 5.1 2.2 8.5 Harwich 34.3 33.3 33.5 -1.0 -0.8 -2.9 -2.5 13.8 15.2 33.0 1.4 19.2 1.3 11.3 Fishguard 53.1 53.6 51.7 0.5 -1.4 1.0 -2.8 248.5 249.4 251.8 0.9 3.3 1.0 3.3 Lowestoft 20.9 24.1 18.0 3.2 -2.9 13.1 -16.1 298.6 287.4 317.1 -11.2 18.4 5.4 6.9 Barmouth 54.7 59.5 57.2 4.8 2.5 8.0 4.3 277.6 278.9 278.2 1.3 0.6 4.9 2.5 Cromer 52.9 58.9 51.2 6.0 -1.7 10.2 -3.3 235.0 234.8 250.4 -0.3 15.4 6.0 14.0 Holyhead 59.1 58.5 52.9 -0.6 -6.2 -1.0 -11.7 328.5 334.6 327.2 6.1 -1.3 6.3 6.3 Llandudno 85.9 84.3 80.9 -1.6 -5.0 -1.9 -6.1 351.4 356.9 355.6 5.5 4.2 8.3 7.8 Liverpool 97.0 94.8 89.7 -2.2 -7.3 -2.3 -8.1 5.3 5.5 4.2 0.2 -1.2 2.2 7.5 Immingham 74.5 79.7 60.0 5.2 -14.5 6.5 -24.2 212.6 215.2 261.2 2.6 48.6 6.3 56.9 Heysham 102.7 95.1 88.7 -7.6 -14.0 -8.0 -15.8 8.6 13.4 38.1 4.8 29.5 11.2 50.6 Port_Erin 55.2 49.1 53.8 -6.1 -1.4 -12.5 -2.7 1.1 3.2 5.1 2.1 4.0 6.4 4.1 Whitby 55.8 56.3 53.5 0.5 -2.3 0.9 -4.3 146.9 141.6 157.7 -5.4 10.8 5.3 10.5 Workington 86.5 83.6 82.4 -2.9 -4.1 -3.4 -5.0 16.0 24.1 24.8 8.1 8.8 12.4 13.5 Portpatrick 37.3 19.9 36.8 -17.4 -0.5 -87.2 -1.5 16.4 26.0 20.0 9.6 3.7 18.0 2.4 North_Shields 53.7 54.6 51.7 0.9 -2.0 1.6 -3.8 131.1 121.5 138.2 -9.6 7.1 9.1 6.8 Port_Ellen 14.4 18.2 12.8 3.8 -1.6 20.9 -12.7 155.9 196.7 145.8 40.8 -10.1 11.9 2.9 Millport 29.3 20.0 30.7 -9.3 1.4 -46.1 4.6 35.1 35.3 39.3 0.2 4.2 9.3 2.6 Leith 61.1 61.6 63.2 0.5 2.1 0.8 3.4 96.0 85.8 103.8 -10.2 7.8 10.9 8.7 Tobermory 53.0 46.8 57.4 -6.2 4.4 -13.1 7.7 205.3 198.6 208.2 -6.7 2.9 8.5 5.2 Aberdeen 44.1 44.8 43.5 0.7 -0.6 1.6 -1.3 62.8 57.8 68.1 -5.0 5.3 3.9 4.1 Ullapool 58.5 59.6 60.6 1.1 2.1 1.9 3.5 235.2 238.0 242.2 2.8 7.1 3.2 7.6 Stornoway 54.6 54.3 56.8 -0.3 2.2 -0.5 3.9 231.2 235.6 238.0 4.4 6.8 4.2 7.0 Wick 34.8 42.0 37.6 7.2 2.8 17.1 7.4 0.3 357.2 4.2 -3.1 3.8 7.5 3.7 Kinlochbervie 54.9 54.3 55.1 -0.6 0.2 -1.0 0.4 242.1 251.9 247.9 9.9 5.8 9.4 5.6 Lerwick 20.9 23.1 21.0 2.2 0.1 9.3 0.6 347.0 344.5 352.8 -2.6 5.8 2.4 2.1 Total number of points 41 CS3X NEMO RMS amplitude error (cm) 6.46 5.15 Mean amplitude error (cm) -2.00 -2.07 Mean amplitude error (%) -3.48 -3.53 RMS phase error (deg) 9.38 12.77 Mean phase error (deg) 1.83 7.59 Total error in complex plane (cm) 378.66 449.25 Mean error in complex plane (cm) 9.24 10.96

Comparison between observed and computed tides K2 Analysis of 12 months tide data (2004) Port Ho Hc Hn DHc DHn DHPc DHPn Go Gc Gn DGc DGn HSc HSn Jersey 37.1 31.3 35.2 -5.8 -1.9 -18.7 -5.4 231.0 234.4 238.5 3.4 7.4 6.2 5.0 St_Marys 17.2 16.3 16.0 -0.9 -1.2 -5.5 -7.3 171.8 173.6 175.9 1.7 4.0 1.0 1.7 Newlyn 16.5 14.7 15.0 -1.8 -1.5 -12.0 -9.9 175.5 178.6 179.0 3.0 3.5 2.0 1.8 Plymouth 17.4 15.7 15.9 -1.7 -1.5 -10.6 -9.5 205.2 201.1 204.7 -4.1 -0.6 2.1 1.5 Weymouth 8.9 10.2 9.9 1.3 1.0 12.4 10.2 240.4 234.8 241.3 -5.6 0.9 1.6 1.0 Bournemouth 5.2 5.2 5.9 0.0 0.7 0.4 12.4 290.8 269.6 273.3 -21.1 -17.5 1.9 1.8 Newhaven 20.7 17.9 16.9 -2.8 -3.8 -15.6 -22.7 10.2 15.9 17.5 5.8 7.3 3.4 4.5 Portsmouth 12.4 11.2 10.1 -1.2 -2.3 -11.1 -22.6 12.6 15.3 17.5 2.7 4.9 1.4 2.5 Dover 20.5 19.6 19.3 -0.9 -1.2 -4.5 -6.2 22.8 33.3 36.6 10.5 13.8 3.8 4.9 Ilfracombe 31.9 30.4 29.7 -1.5 -2.2 -4.8 -7.3 207.1 216.9 215.5 9.8 8.4 5.5 5.0 Hinkley_Point 40.1 37.4 39.5 -2.7 -0.6 -7.3 -1.4 236.2 247.8 242.7 11.6 6.6 8.3 4.6 Sheerness 16.9 15.6 15.5 -1.3 -1.4 -8.5 -9.3 50.6 46.0 81.4 -4.5 30.8 1.8 8.7 Avonmouth_Portbury 43.5 37.2 44.3 -6.3 0.8 -16.9 1.9 258.5 250.8 262.4 -7.7 3.9 8.3 3.1 Newport 42.2 35.5 41.8 -6.7 -0.4 -18.8 -0.9 252.2 266.5 252.6 14.4 0.4 11.8 0.5 Mumbles 32.5 31.4 29.9 -1.1 -2.6 -3.7 -8.7 218.7 227.8 223.8 9.1 5.1 5.2 3.8 Milford_Haven 23.1 22.5 21.0 -0.6 -2.1 -2.8 -10.0 215.7 216.9 219.9 1.2 4.2 0.8 2.6 Harwich 9.9 9.8 10.3 -0.1 0.4 -1.0 3.8 14.3 13.7 31.1 -0.5 16.9 0.1 3.0 Fishguard 15.3 14.4 14.2 -0.9 -1.1 -6.1 -7.9 246.1 247.9 249.1 1.8 3.0 1.0 1.4 Lowestoft 5.9 7.1 5.7 1.2 -0.2 17.1 -4.4 298.6 287.3 317.4 -11.3 18.8 1.8 1.9 Barmouth 15.5 15.9 15.6 0.4 0.1 2.7 0.9 276.3 277.6 275.9 1.3 -0.3 0.6 0.2 Cromer 14.9 17.3 15.7 2.4 0.8 13.7 5.0 234.7 233.8 249.7 -0.9 15.0 2.4 4.1 Holyhead 16.9 15.9 14.6 -1.0 -2.3 -6.5 -15.7 327.2 334.7 326.0 7.5 -1.2 2.4 2.3 Llandudno 24.7 23.1 22.6 -1.6 -2.1 -7.1 -9.2 350.7 356.8 354.2 6.1 3.4 3.0 2.5 Liverpool 27.9 26.0 25.1 -1.9 -2.8 -7.5 -11.1 4.7 5.3 2.7 0.7 -2.0 2.0 2.9 Immingham 21.5 23.6 19.0 2.1 -2.5 9.0 -13.3 210.6 213.5 260.2 2.9 49.6 2.4 17.1 Heysham 29.5 26.1 25.2 -3.4 -4.3 -13.1 -17.0 7.3 13.2 36.2 5.9 28.9 4.5 14.3 Port_Erin 15.8 13.4 15.0 -2.4 -0.8 -18.0 -5.5 0.4 3.3 3.9 2.9 3.5 2.5 1.2 Whitby 16.0 16.4 16.4 0.4 0.4 2.6 2.3 145.3 139.8 156.0 -5.5 10.7 1.6 3.0 Workington 24.8 22.9 23.1 -1.9 -1.7 -8.3 -7.4 15.3 24.1 23.3 8.8 8.0 4.1 3.8 Portpatrick 10.8 5.4 10.2 -5.4 -0.6 -101.4 -5.8 16.4 24.4 18.2 8.0 1.8 5.5 0.7 North_Shields 15.4 15.9 15.8 0.5 0.4 3.2 2.7 129.6 119.7 136.4 -9.9 6.8 2.8 1.9 Port_Ellen 4.1 5.0 3.5 0.9 -0.6 18.7 -18.0 152.0 199.4 148.4 47.4 -3.6 3.8 0.7 Millport 8.7 5.4 8.4 -3.3 -0.3 -62.2 -3.4 34.5 33.5 36.9 -1.0 2.5 3.3 0.5 Leith 17.4 18.0 19.3 0.6 1.9 3.3 10.0 94.4 83.7 101.8 -10.7 7.4 3.4 3.1 Tobermory 15.1 12.9 16.4 -2.2 1.3 -16.8 8.0 203.3 199.9 207.9 -3.4 4.6 2.3 1.8 Aberdeen 12.6 13.1 13.3 0.5 0.7 3.7 5.4 60.9 55.5 65.8 -5.4 4.9 1.3 1.3 Ullapool 16.7 16.8 17.6 0.1 0.9 0.8 5.3 233.2 238.8 242.1 5.6 8.8 1.6 2.8 Stornoway 15.6 15.4 16.6 -0.2 1.0 -1.3 5.9 229.2 236.5 237.9 7.4 8.8 2.0 2.6 Wick 9.9 12.4 11.6 2.5 1.7 20.0 14.6 357.9 355.0 1.9 -2.9 4.0 2.5 1.8 Kinlochbervie 15.6 15.4 16.1 -0.2 0.5 -1.2 2.9 240.3 252.2 247.5 11.8 7.2 3.2 2.0 Lerwick 5.9 6.8 6.5 0.9 0.6 13.0 9.7 344.1 340.0 348.8 -4.1 4.7 1.0 0.8 Total number of points 41 CS3X NEMO RMS amplitude error (cm) 2.45 1.65 Mean amplitude error (cm) -1.12 -0.70 Mean amplitude error (%) -6.60 -3.40 RMS phase error (deg) 10.45 12.66 Mean phase error (deg) 2.25 7.20 Total error in complex plane (cm) 126.05 130.88 Mean error in complex plane (cm) 3.07 3.19

Comparison between observed and computed tides M4 Analysis of 12 months tide data (2004) Port Ho Hc Hn DHc DHn DHPc DHPn Go Gc Gn DGc DGn HSc HSn Jersey 19.2 11.1 22.3 -8.1 3.1 -72.3 13.9 301.3 335.6 346.6 34.2 45.3 11.8 16.2 St_Marys 5.9 4.4 4.8 -1.5 -1.1 -33.8 -22.1 188.8 218.0 219.6 29.1 30.7 3.0 3.0 Newlyn 11.3 8.7 8.0 -2.6 -3.3 -30.3 -41.6 166.3 179.4 196.7 13.1 30.4 3.5 6.0 Plymouth 13.8 11.8 11.0 -2.0 -2.8 -17.4 -25.9 135.0 154.5 163.6 19.4 28.6 4.8 6.7 Weymouth 14.4 6.3 8.7 -8.1 -5.7 -129.8 -66.1 25.6 81.5 79.4 55.9 53.8 12.1 11.6 Bournemouth 18.5 7.5 10.4 -11.0 -8.1 -148.2 -78.7 20.7 41.6 64.3 20.9 43.6 11.8 13.1 Newhaven 8.7 6.9 5.2 -1.8 -3.5 -26.4 -68.7 249.2 273.2 298.7 24.0 49.5 3.7 6.6 Portsmouth 18.9 9.5 9.5 -9.4 -9.4 -99.5 -98.2 13.4 54.3 84.1 40.9 70.8 13.3 18.1 Dover 26.0 19.2 22.2 -6.8 -3.8 -35.1 -16.9 220.8 250.8 263.7 30.0 42.9 13.4 18.0 Ilfracombe 10.7 2.1 7.9 -8.6 -2.8 -418.4 -36.2 350.9 346.2 36.0 -4.6 45.1 8.6 7.6 Hinkley_Point 9.6 14.1 13.9 4.5 4.3 31.9 30.8 18.9 281.1 18.7 -97.8 -0.2 18.1 4.3 Sheerness 11.6 13.3 25.1 1.7 13.5 12.6 53.8 8.3 304.0 0.9 -64.3 -7.4 13.3 13.7 Avonmouth_Portbury 27.1 9.8 56.0 -17.3 28.9 -175.6 51.6 348.9 303.8 357.4 -45.1 8.5 21.3 29.5 Newport 16.2 20.6 28.1 4.4 11.9 21.3 42.3 354.6 21.1 4.2 26.5 9.6 9.5 12.4 Mumbles 7.0 4.8 7.2 -2.2 0.2 -46.0 3.3 13.9 232.7 58.3 -141.2 44.3 11.1 5.4 Milford_Haven 6.5 4.2 1.7 -2.3 -4.8 -53.7 -273.9 306.1 290.7 323.4 -15.4 17.2 2.7 4.9 Harwich 7.4 5.1 4.8 -2.3 -2.6 -44.9 -54.1 322.2 3.8 27.1 41.5 64.9 4.9 6.9 Fishguard 11.4 8.0 5.5 -3.4 -5.9 -43.4 -108.5 20.4 43.1 34.1 22.7 13.7 5.1 6.2 Lowestoft 4.9 7.8 5.9 2.9 1.0 37.2 17.0 334.6 358.3 40.0 23.7 65.4 3.9 5.9 Barmouth 24.0 22.3 15.3 -1.7 -8.7 -7.5 -56.6 63.7 69.5 55.0 5.8 -8.7 2.9 9.1 Cromer 8.8 11.1 10.0 2.3 1.2 20.8 11.7 281.8 305.5 341.2 23.7 59.4 4.7 9.4 Holyhead 3.3 0.8 2.4 -2.5 -0.9 -336.9 -35.5 26.0 183.7 40.8 157.7 14.8 4.0 1.1 Llandudno 11.2 12.9 8.6 1.7 -2.6 13.0 -30.0 185.2 207.0 181.3 21.8 -3.9 4.8 2.7 Liverpool 23.8 23.6 17.4 -0.2 -6.4 -0.7 -36.6 202.5 208.9 191.0 6.4 -11.5 2.7 7.6 Immingham 2.2 21.8 24.5 19.6 22.3 89.9 91.0 194.1 269.6 357.1 75.5 163.0 21.4 26.6 Heysham 19.8 26.0 56.6 6.2 36.8 23.9 65.0 245.7 232.7 275.9 -12.9 30.2 8.0 40.8 Port_Erin 1.3 2.6 0.9 1.3 -0.4 50.7 -52.0 82.6 44.7 311.9 -37.9 -130.7 1.8 2.0 Whitby 2.9 6.2 5.6 3.3 2.7 53.5 47.9 73.0 77.3 111.9 4.3 38.9 3.4 3.8 Workington 13.3 8.4 15.4 -4.9 2.1 -57.6 13.4 252.2 317.1 283.5 64.9 31.3 12.4 8.0 Portpatrick 0.3 5.1 2.4 4.8 2.1 94.1 87.6 352.1 69.5 70.3 77.4 78.3 5.1 2.4 North_Shields 2.3 5.1 4.4 2.8 2.1 55.0 47.4 108.1 62.8 96.9 -45.3 -11.1 3.9 2.2 Port_Ellen 2.1 1.8 0.2 -0.3 -1.9 -18.3 -888.8 65.2 240.5 76.0 175.2 10.8 3.9 1.9 Millport 8.7 12.3 14.6 3.6 5.9 29.1 40.6 89.8 88.8 109.8 -0.9 20.0 3.6 7.1 Leith 7.5 4.3 5.9 -3.2 -1.6 -73.8 -27.2 184.9 313.0 341.5 128.0 156.6 10.7 13.1 Tobermory 4.4 5.8 5.1 1.4 0.7 24.1 12.9 180.6 230.3 256.3 49.7 75.7 4.5 5.8 Aberdeen 3.2 2.7 2.3 -0.5 -0.9 -20.5 -36.5 167.5 233.0 230.7 65.4 63.2 3.2 3.0 Ullapool 6.4 7.1 10.0 0.7 3.6 9.9 35.9 230.4 274.9 287.0 44.6 56.7 5.2 8.4 Stornoway 6.0 6.6 9.6 0.6 3.6 8.7 37.8 220.6 267.5 278.5 46.9 57.9 5.0 8.2 Wick 3.6 3.5 0.6 -0.1 -3.0 -2.5 -492.9 318.4 220.0 348.5 -98.5 30.1 5.4 3.1 Kinlochbervie 4.3 5.0 6.0 0.7 1.7 14.3 28.0 248.1 282.6 296.1 34.5 48.0 2.8 4.4 Lerwick 1.6 0.7 0.8 -0.9 -0.8 -132.5 -89.5 276.8 53.5 344.9 136.7 68.2 2.2 1.5 Total number of points 41 CS3X NEMO RMS amplitude error (cm) 5.82 9.34 Mean amplitude error (cm) -0.96 1.63 Mean amplitude error (%) -35.00 -46.46 RMS phase error (deg) 66.60 58.11 Mean phase error (deg) 22.85 36.43 Total error in complex plane (cm) 297.09 368.30 Mean error in complex plane (cm) 7.25 8.98

Comparison between observed and computed tides MS4 Analysis of 12 months tide data (2004) Port Ho Hc Hn DHc DHn DHPc DHPn Go Gc Gn DGc DGn HSc HSn Jersey 14.5 7.1 15.5 -7.4 1.0 -104.8 6.6 358.6 26.9 42.0 28.3 43.4 8.9 11.1 St_Marys 3.4 2.3 2.8 -1.1 -0.6 -47.4 -22.3 240.9 269.2 273.5 28.2 32.5 1.7 1.8 Newlyn 7.4 5.2 4.8 -2.2 -2.6 -41.4 -53.6 218.3 229.6 247.9 11.3 29.6 2.5 4.0 Plymouth 9.4 7.9 7.3 -1.5 -2.1 -19.6 -28.8 191.1 209.8 216.8 18.7 25.7 3.2 4.2 Weymouth 8.5 3.1 4.6 -5.4 -3.9 -174.5 -84.1 82.4 152.7 142.0 70.3 59.6 8.0 7.3 Bournemouth 11.6 3.7 5.6 -7.9 -6.0 -217.8 -105.9 76.2 92.4 121.1 16.2 44.8 8.2 8.6 Newhaven 5.5 4.0 3.0 -1.5 -2.5 -37.4 -86.0 306.6 329.5 1.1 22.9 54.5 2.4 4.5 Portsmouth 12.3 5.8 5.8 -6.5 -6.5 -112.2 -113.0 71.5 110.9 142.6 39.4 71.1 8.6 11.8 Dover 16.9 12.5 14.1 -4.4 -2.8 -35.4 -19.5 273.8 302.9 317.1 29.1 43.3 8.5 11.7 Ilfracombe 6.0 1.3 4.2 -4.7 -1.8 -344.5 -43.0 52.4 319.8 109.0 -92.6 56.6 6.2 5.1 Hinkley_Point 3.1 16.5 8.4 13.4 5.3 81.2 63.3 19.4 331.5 53.0 -47.9 33.6 14.6 6.1 Sheerness 4.6 8.2 16.0 3.6 11.4 44.1 71.2 78.5 355.9 56.6 -82.6 -21.9 8.9 11.8 Avonmouth_Portbury 24.8 12.8 49.0 -12.0 24.2 -94.1 49.4 24.7 344.2 47.1 -40.5 22.4 17.2 27.7 Newport 14.6 15.5 22.4 0.9 7.8 6.1 34.9 14.1 56.5 47.4 42.4 33.3 10.9 13.0 Mumbles 3.6 5.8 4.3 2.2 0.7 38.4 16.4 84.1 285.7 137.6 -158.4 53.5 9.3 3.6 Milford_Haven 3.0 2.4 0.8 -0.6 -2.2 -24.0 -287.9 356.7 326.6 318.9 -30.1 -37.8 1.5 2.4 Harwich 4.7 3.3 2.6 -1.4 -2.1 -43.3 -80.2 34.9 65.3 94.5 30.4 59.6 2.5 4.1 Fishguard 5.4 3.9 3.0 -1.5 -2.4 -38.0 -78.9 65.4 93.9 71.4 28.5 6.1 2.7 2.4 Lowestoft 4.0 5.2 4.0 1.2 -0.0 23.1 -0.6 25.9 47.9 92.1 22.0 66.2 2.1 4.4 Barmouth 12.8 11.7 9.5 -1.1 -3.3 -9.8 -35.1 116.5 117.7 94.2 1.2 -22.3 1.2 5.4 Cromer 7.1 7.2 7.1 0.1 -0.0 1.4 -0.4 328.2 348.8 27.0 20.5 58.8 2.6 7.0 Holyhead 1.2 0.8 1.6 -0.4 0.4 -51.2 26.1 45.4 298.9 76.2 -106.4 30.8 1.6 0.9 Llandudno 6.4 7.2 5.8 0.8 -0.6 10.9 -10.4 232.2 255.4 222.5 23.2 -9.8 2.8 1.2 Liverpool 14.4 14.3 12.1 -0.1 -2.3 -1.0 -18.5 245.8 254.7 234.3 8.9 -11.5 2.2 3.5 Immingham 3.4 15.9 16.7 12.5 13.3 78.7 79.7 251.2 318.5 48.4 67.3 157.3 15.0 19.9 Heysham 11.4 15.6 37.9 4.2 26.5 26.8 69.9 296.8 280.4 328.9 -16.4 32.0 5.6 28.9 Port_Erin 1.0 1.8 0.5 0.8 -0.5 42.9 -116.1 133.5 95.6 337.2 -37.9 -156.3 1.1 1.4 Whitby 3.0 4.8 4.7 1.8 1.7 37.9 35.8 100.8 123.6 164.6 22.9 63.8 2.4 4.3 Workington 6.7 3.8 9.0 -2.9 2.3 -76.8 25.5 300.6 10.2 331.1 69.6 30.5 6.4 4.7 Portpatrick 0.8 3.6 1.5 2.8 0.7 77.6 47.7 77.3 119.2 120.1 41.9 42.8 3.0 1.1 North_Shields 1.8 3.7 3.6 1.9 1.8 51.9 49.7 89.2 106.0 143.4 16.7 54.1 2.1 2.9 Port_Ellen 1.3 1.4 0.4 0.1 -0.9 3.7 -220.5 69.2 305.8 38.6 -123.4 -30.6 2.3 1.0 Millport 8.5 9.0 9.8 0.5 1.3 5.6 13.7 118.2 138.5 156.4 20.3 38.3 3.1 6.1 Leith 6.7 3.8 8.1 -2.9 1.4 -77.0 17.0 301.0 354.3 33.6 53.3 92.5 5.4 10.7 Tobermory 3.5 3.7 3.2 0.2 -0.3 4.7 -10.7 289.9 297.2 326.2 7.3 36.3 0.5 2.1 Aberdeen 3.0 1.8 1.9 -1.2 -1.1 -71.0 -59.4 243.7 280.4 299.8 36.8 56.2 1.9 2.5 Ullapool 7.4 5.0 7.6 -2.4 0.2 -49.1 3.1 304.0 331.5 342.7 27.5 38.7 3.8 5.0 Stornoway 7.1 4.6 7.4 -2.5 0.3 -53.9 4.6 296.2 324.9 335.2 28.6 39.0 3.8 4.9 Wick 2.0 1.2 0.4 -0.8 -1.6 -64.3 -458.8 52.0 300.2 73.9 -111.8 21.9 2.7 1.7 Kinlochbervie 4.8 3.5 4.6 -1.3 -0.2 -37.8 -4.5 311.3 334.5 349.2 23.1 37.9 2.1 3.1 Lerwick 1.3 0.4 0.5 -0.9 -0.8 -223.7 -147.3 1.6 108.2 61.8 106.6 60.1 1.5 1.1 Total number of points 41 CS3X NEMO RMS amplitude error (cm) 4.46 6.74 Mean amplitude error (cm) -0.68 1.30 Mean amplitude error (%) -36.95 -35.88 RMS phase error (deg) 56.62 55.80 Mean phase error (deg) 2.82 32.60 Total error in complex plane (cm) 201.13 265.01 Mean error in complex plane (cm) 4.91 6.46

Comparison between observed and computed tides M6 Analysis of 12 months tide data (2004) Port Ho Hc Hn DHc DHn DHPc DHPn Go Gc Gn DGc DGn HSc HSn Jersey 1.0 5.4 0.9 4.4 -0.1 81.6 -6.1 1.7 295.9 267.6 -65.8 -94.1 5.1 1.4 St_Marys 1.5 0.5 1.4 -1.0 -0.1 -199.9 -5.1 357.7 34.0 77.6 36.3 79.9 1.1 1.9 Newlyn 0.9 0.8 1.6 -0.1 0.7 -12.5 44.1 329.2 84.0 83.2 114.8 114.0 1.4 2.1 Plymouth 2.4 3.3 2.0 0.9 -0.4 26.3 -17.6 171.2 141.8 170.5 -29.5 -0.8 1.7 0.4 Weymouth 6.3 7.7 7.5 1.4 1.2 18.5 15.8 63.5 83.1 87.1 19.6 23.6 2.8 3.1 Bournemouth 7.0 6.8 8.4 -0.2 1.4 -3.2 17.1 79.1 94.5 98.4 15.4 19.3 1.9 3.0 Newhaven 2.2 2.0 2.2 -0.2 -0.0 -9.4 -0.7 164.1 218.6 190.0 54.5 25.9 1.9 1.0 Portsmouth 11.3 8.0 6.3 -3.3 -5.0 -41.3 -80.2 148.7 216.6 201.2 67.8 52.5 11.1 9.0 Dover 6.6 10.2 9.3 3.6 2.7 35.0 28.7 103.8 115.6 128.5 11.8 24.7 3.9 4.3 Ilfracombe 1.9 2.6 2.0 0.7 0.1 25.5 5.0 342.0 89.5 30.1 107.5 48.1 3.6 1.6 Hinkley_Point 4.1 5.9 8.3 1.8 4.2 30.1 50.5 216.0 287.4 245.7 71.5 29.7 6.0 5.1 Sheerness 5.2 7.3 5.7 2.1 0.5 28.3 9.0 36.8 60.7 78.1 23.9 41.4 3.3 3.9 Avonmouth_Portbury 11.6 8.0 2.2 -3.6 -9.4 -44.8 -419.0 275.7 296.6 276.1 20.9 0.4 5.0 9.4 Newport 8.6 13.7 10.1 5.1 1.5 37.4 15.0 270.7 319.5 256.4 48.7 -14.3 10.3 2.8 Mumbles 3.6 5.6 3.1 2.0 -0.5 36.1 -14.5 3.5 103.0 27.2 99.5 23.7 7.2 1.5 Milford_Haven 1.5 0.7 0.2 -0.8 -1.3 -119.5 -701.3 151.6 252.0 350.4 100.4 -161.3 1.8 1.7 Harwich 5.4 8.5 7.4 3.1 2.0 36.4 26.6 270.8 284.9 302.8 14.1 32.0 3.5 4.0 Fishguard 0.1 0.5 0.4 0.4 0.3 80.0 76.9 24.9 217.3 109.3 -167.6 84.4 0.6 0.4 Lowestoft 4.0 4.9 4.8 0.9 0.8 18.9 15.8 117.4 126.2 179.2 8.8 61.7 1.2 4.5 Barmouth 1.0 8.8 4.1 7.8 3.1 88.6 75.8 134.4 257.8 160.5 123.5 26.1 9.4 3.3 Cromer 2.6 4.6 3.7 2.0 1.1 43.0 29.8 37.7 349.8 62.3 -47.9 24.6 3.4 1.7 Holyhead 2.1 1.2 1.5 -0.9 -0.6 -70.6 -37.6 224.1 185.5 258.0 -38.6 33.9 1.4 1.2 Llandudno 1.5 3.8 1.3 2.3 -0.2 60.0 -12.1 358.4 313.4 349.3 -44.9 -9.1 2.9 0.3 Liverpool 5.4 7.0 3.3 1.6 -2.1 22.6 -63.9 346.8 359.4 18.6 12.6 31.8 2.1 3.1 Immingham 1.3 5.2 3.4 3.9 2.1 75.1 61.4 160.4 112.4 240.2 -48.0 79.8 4.4 3.4 Heysham 1.3 1.9 9.4 0.6 8.1 32.9 86.2 44.2 75.5 239.7 31.3 -164.5 1.1 10.7 Port_Erin 1.1 0.9 0.9 -0.2 -0.2 -26.0 -19.2 278.0 357.3 292.2 79.3 14.1 1.3 0.3 Whitby 1.1 0.7 0.8 -0.4 -0.3 -51.2 -43.4 357.2 66.3 109.0 69.1 111.8 1.1 1.6 Workington 1.4 3.2 2.3 1.8 0.9 56.8 39.2 282.0 254.5 336.7 -27.6 54.7 2.1 1.9 Portpatrick 0.4 0.1 0.9 -0.3 0.5 -304.9 55.8 230.5 9.9 197.2 139.4 -33.3 0.5 0.6 North_Shields 0.7 0.9 1.4 0.2 0.7 18.5 51.4 19.1 63.6 87.7 44.5 68.6 0.6 1.4 Port_Ellen 2.6 0.7 3.0 -1.9 0.4 -270.1 13.1 114.5 97.1 152.2 -17.5 37.7 1.9 1.8 Millport 2.4 0.6 4.9 -1.8 2. -313.5 51.0 303.9 281.6 341.4 -22.3 37.6 1.9 3.3 Leith 4.7 11.7 7.3 7.0 2.6 59.8 35.5 287.9 301.6 2.0 13.7 74.0 7.2 7.5 Tobermory 1.3 2.4 1.2 1.1 -0.1 45.6 -7.3 8.8 151.2 68.7 142.4 59.9 3.5 1.3 Aberdeen 0.7 0.5 0.3 -0.2 -0.4 -46.7 -116.5 111.9 103.9 185.7 -8.0 73.9 0.2 0.7 Ullapool 0.7 0.9 0.7 0.2 0.0 24.0 2.2 200.4 52.3 272.7 -148.1 72.3 1.6 0.8 Stornoway 0.7 0.7 0.9 -0.0 0.2 -5.1 19.8 189.8 46.1 249.3 -143.7 59.5 1.3 0.8 Wick 0.6 0.6 0.3 -0.0 -0.3 -3.9 -71.9 229.0 305.8 228.5 76.8 -0.5 0.7 0.3 Kinlochbervie 0.2 0.8 0.6 0.6 0.4 75.2 67.0 62.4 104.7 92.2 42.4 29.9 0.7 0.4 Lerwick 1.2 1.3 1.7 0.1 0.5 10.1 29.2 223.0 290.5 284.9 67.5 61.9 1.4 1.5 Total number of points 41 CS3X NEMO RMS amplitude error (cm) 2.51 2.48 Mean amplitude error (cm) 0.99 0.43 Mean amplitude error (%) -11.12 -16.94 RMS phase error (deg) 74.94 63.66 Mean phase error (deg) 20.70 27.69 Total error in complex plane (cm) 123.99 108.77 Mean error in complex plane (cm) 3.02 2.65


Recommended