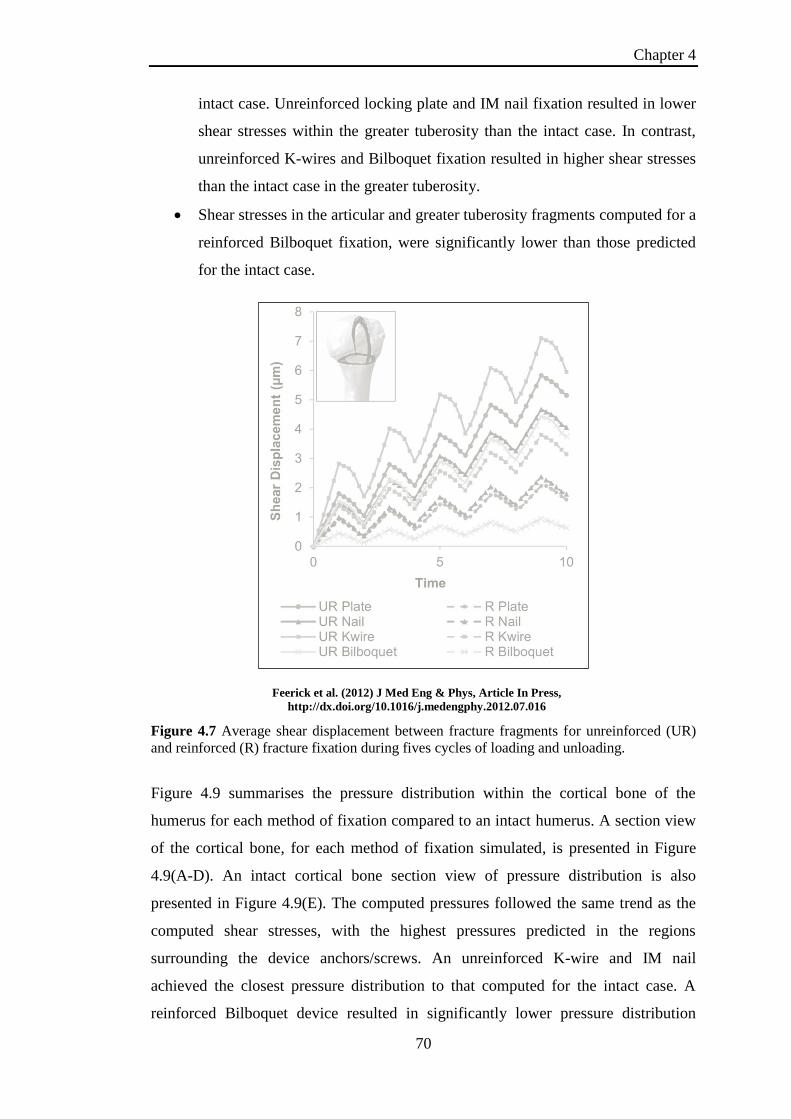
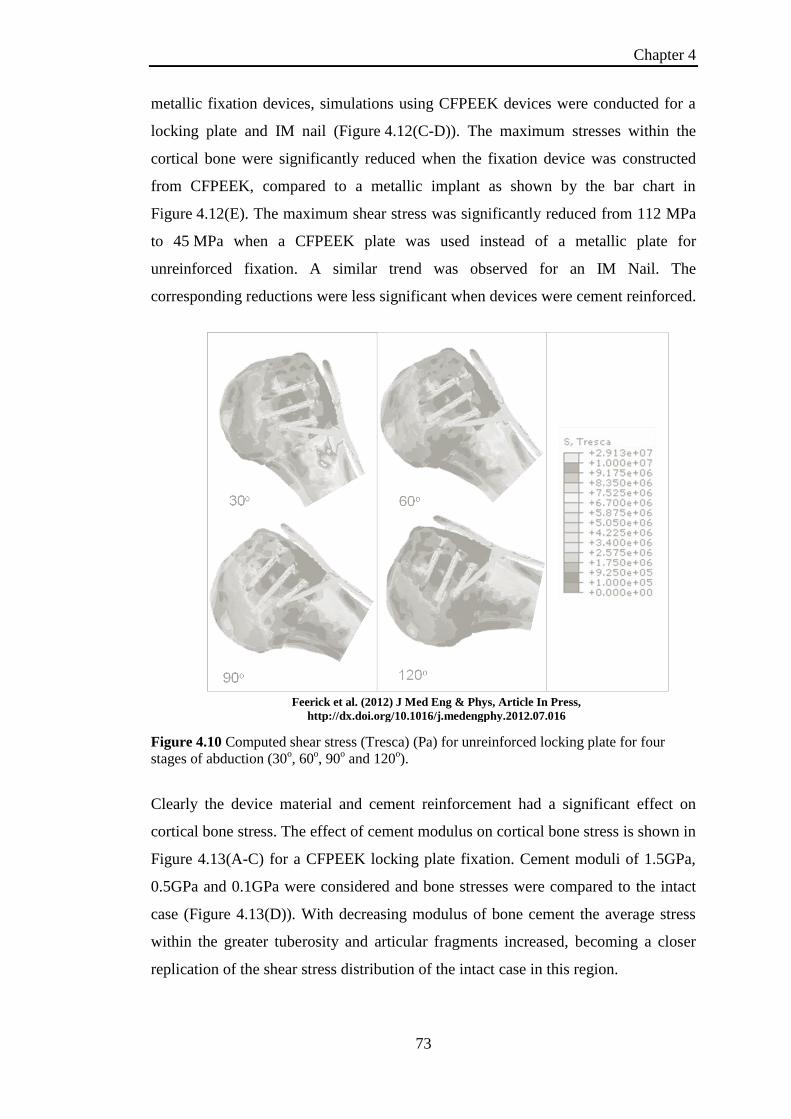
Page 1
Provided by the author(s) and NUI Galway in accordance with publisher policies. Please cite the published
version when available.
Downloaded 2022-03-20T14:18:23Z
Some rights reserved. For more information, please see the item record link above.
Title Cortical Bone Fracture and Orthopaedic Fixation Devices: AnExperimental and Computational Investigation
Author(s) Feerick, Emer M
PublicationDate 2012-09-28
Item record http://hdl.handle.net/10379/3359
Page 2
Cortical Bone Fracture and
Orthopaedic Fixation Devices:
An Experimental and Computational Investigation
Emer M. Feerick B.E. (2008)
A thesis submitted to the National University of Ireland as fulfilment of the
requirements for the Degree of Doctor of Philosophy
September 2012
Mechanical and Biomedical Engineering
College of Engineering and Informatics
National University of Ireland, Galway
Supervisor of Research: Dr. Patrick McGarry
Page 3
II
Abstract
An experimental and computational investigation of cortical bone failure
mechanisms has been conducted in this thesis. Firstly, a computational comparison
of four methods of proximal humeral fracture fixation was conducted. Peak stresses
were predicted at the screw cortical bone interface. Carbon fibre reinforced PEEK
(CFPEEK) devices were proposed as an alternative to existing metallic devices. It
was demonstrated that CFPEEK devices lowered stresses at the screw cortical bone
interface, thus lowering the risk of screw pullout/pushout. Next, a novel
experimental test rig was developed, so that crack patterns during screw pullout
could be identified in real time as the screw was removed from the cortical bone.
Pullout tests were conducted with; (i) osteons aligned parallel to the central axis of
the screw (longitudinal pullout) and (ii) osteons aligned perpendicular to the central
axis of the screw (transverse pullout). This experimental study uncovered for the first
time, the relationship between the microstructural alignment of cortical bone, the
pullout strength and the crack patterns. Two methods of computational modelling
were subsequently developed to capture the relationship uncovered during the
experimental screw pullout study. The first method of element deletion required the
use of a phenomenological biphasic multi-layered composite model. This model
accurately predicted both the pullout force and crack patterns for longitudinal and
transverse pullout. The element deletion method was limited to 2D simulations
therefore an alternate method with a lower computational expense was investigated.
The second method involved the development of anisotropic damage initiation
criteria in conjunction with the extended finite element method (XFEM). In this case,
it was not necessary to explicitly represent the geometric microstructure of bone thus
lowering the computational demand. This model accurately predicted the
relationship between the osteon alignment, failure forces and crack propagation
orientation for mode I, mode II and mixed mode loading. Application, of this fully
calibrated anisotropic damage XFEM predictive framework, to screw pullout and 3D
simulations of proximal humeral fracture repair, highlighted the potential future
application of this method in the field of orthopaedic device design.
Page 4
III
Acknowledgements
First and foremost I would like to acknowledge the Irish Research Council for
Science, Engineering & Technology (IRCSET) for funding the work of this thesis.
Without financial support the studies of this thesis would not have been undertaken.
I would like to extend my sincere gratitude to my Ph.D. supervisor Dr. Patrick
McGarry. Firstly, for his assistance in securing the aforementioned funding and
additionally for his guidance, technical insight and the hours he dedicated to the
studies and publication of the work of this thesis.
Special thanks to my fellow Ph.D. students in particular the “McGarry Group”
members; Nicola, Enda, Eamonn, Will, Paul, Noel and Dave. It has been a great
experience from the day to day to conference trips, made all the better by the
individuals of the group and also all the other Ph.D. students in the department.
Thanks to the Irish Centre for High End Computing (ICHEC) for the provision of
computational hours for the simulations presented in this thesis. I would also like to
extend thanks to Mr. Hannan Mullet, Dr. Jim Kennedy and Dr. David FitzPatrick for
their contributions in the orthopaedic device evaluation studies of this thesis.
I also must acknowledge the time dedicated by Prof. Sean Leen, Prof. Peter
McHugh, Dr. Laoise McNamara and Dr. Mark Bruzzi to annual GRC meetings over
the years. A special thanks to all of the technicians and staff members of the
department particularly Mr. Patrick Kelly, Mr. William Kelly, Mr. Bonaventure
Kennedy and Mr. William Brennan. Thanks to all staff members of the department
of Mechanical and Biomedical engineering for their help over the years.
Last, but not least I would like to thank my family; my parents Mary and PJ and my
sisters Susan and Claire, for their support and help throughout the course of my
studies. Without their continued support during the whole process it would have
been a much more difficult undertaking. This support is not something that gets
documented, but I certainly won’t forget it!
Page 5
IV
Table of Contents
Chapter 1
Introduction .................................................................................................... 1
Chapter 2
Background ................................................................................................... 10
2.1 Bone Mechanics .................................................................................... 10
2.1.1 Bone Structure ............................................................................... 11
2.1.2 Mechanical Properties of Cortical Bone ....................................... 13
2.1.3 Mechanical Properties of Cancellous Bone .................................. 18
2.1.4 Animal and Synthetic Bone .......................................................... 19
2.2 The Shoulder: Anatomy, Fracture and Repair ...................................... 21
2.2.1 The Glenohumeral Shoulder Joint ................................................ 21
2.2.2 Proximal Humeral Fractures ......................................................... 23
2.2.3 Non Operative ............................................................................... 25
2.2.4 Percutaneous Fixation (K-wires/Sutures) ..................................... 25
2.2.5 Plate Fixation ................................................................................ 25
2.2.6 Intramedullary Fixation ................................................................. 27
2.2.7 Hemiarthroplasty ........................................................................... 28
2.3 Finite Element Modelling of the Humerus ........................................... 28
2.4 Orthopaedic Screws .............................................................................. 29
2.5 Biomaterials .......................................................................................... 33
2.6 References ............................................................................................. 36
Chapter 3
Theory ........................................................................................................... 42
3.1 Introduction ........................................................................................... 42
3.2 Deformation (Measuring Stress and Strain) .......................................... 43
3.3 Elasto-Plasticity .................................................................................... 45
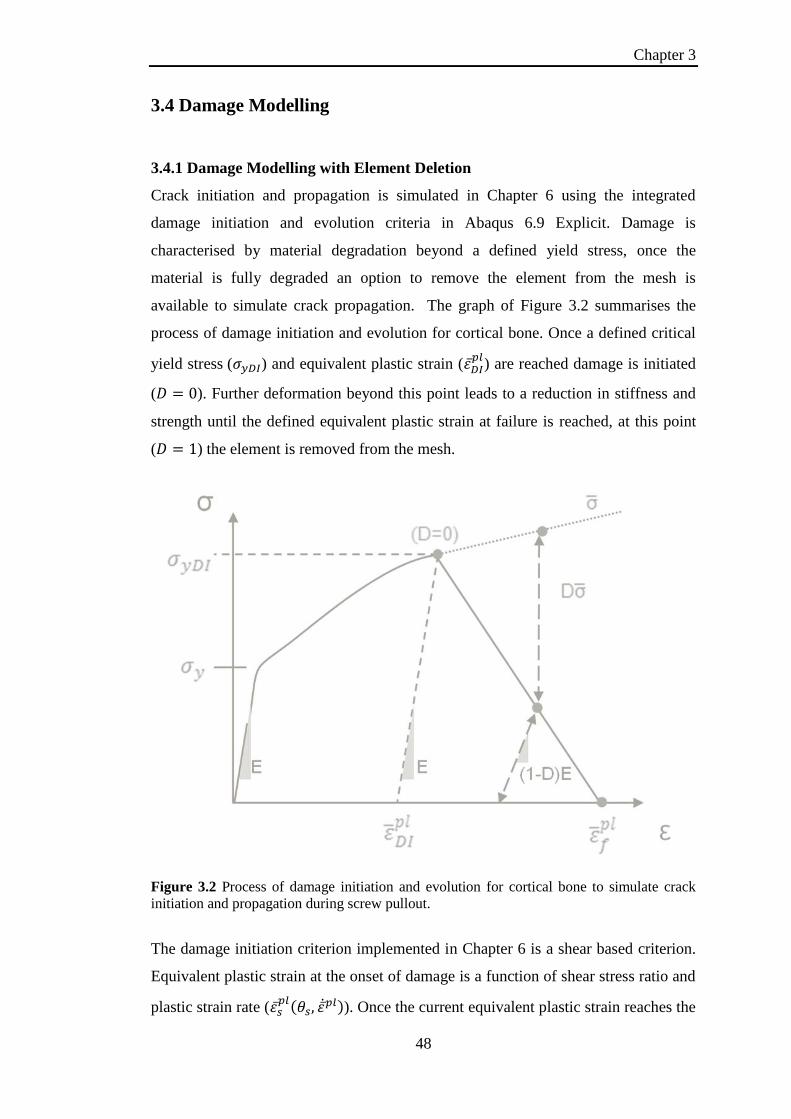
3.4 Damage Modelling ................................................................................ 48
3.4.1 Damage Modelling with Element Deletion .................................. 48
3.4.2 Damage Modelling with XFEM ................................................... 50
3.5 Abaqus Standard (Implicit) vs Explicit Modelling ............................... 52
3.5.1 Implicit Modelling ........................................................................ 52
3.5.2 Explicit Modelling ........................................................................ 54
3.6 References ............................................................................................. 57
Page 6
V
Chapter 4
Investigation of metallic and carbon fibre PEEK fracture fixation
devices for three-part proximal humeral fractures .................................. 58
4.1 Introduction ........................................................................................... 58
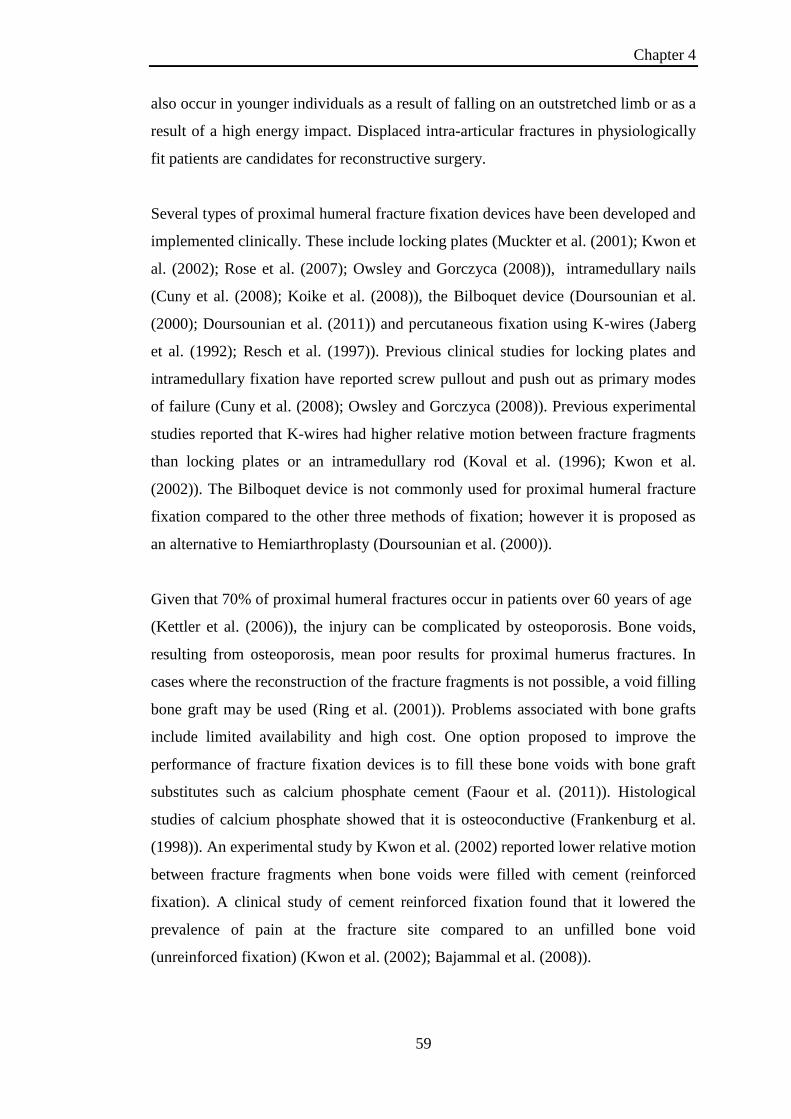
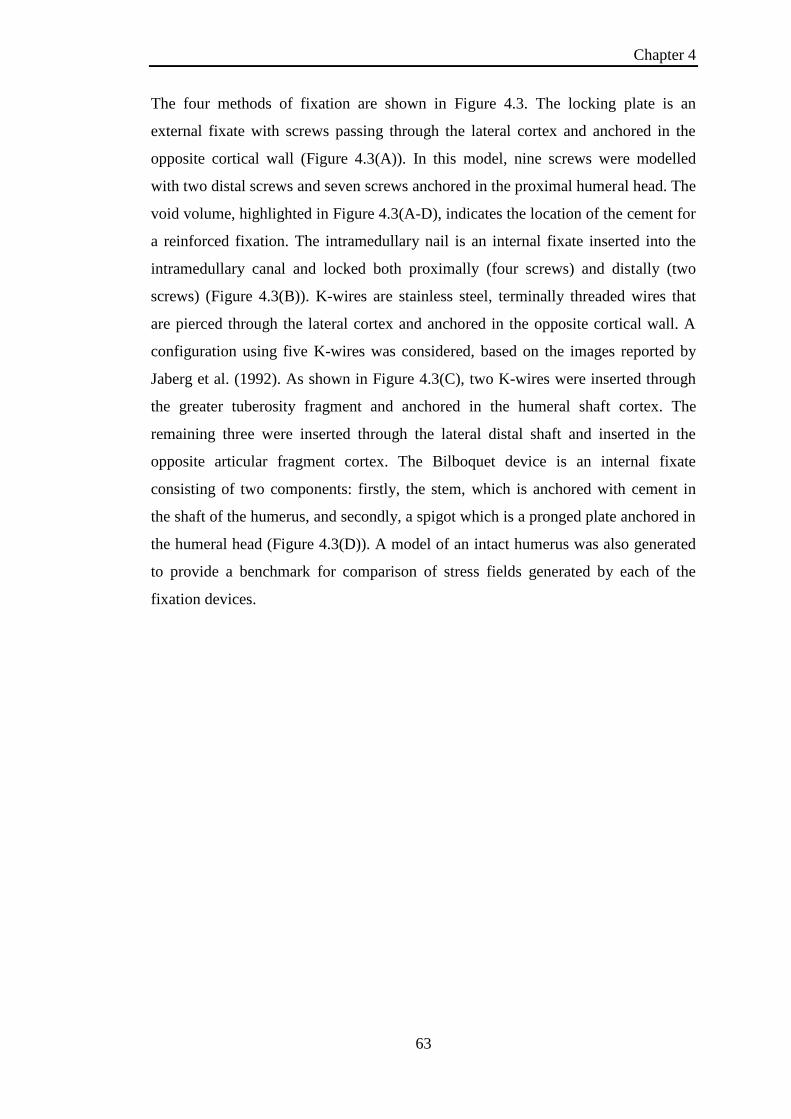
4.2 Materials & Methods ............................................................................ 60
4.2.1 Experimental ................................................................................. 60
4.2.2 Computational: .............................................................................. 61
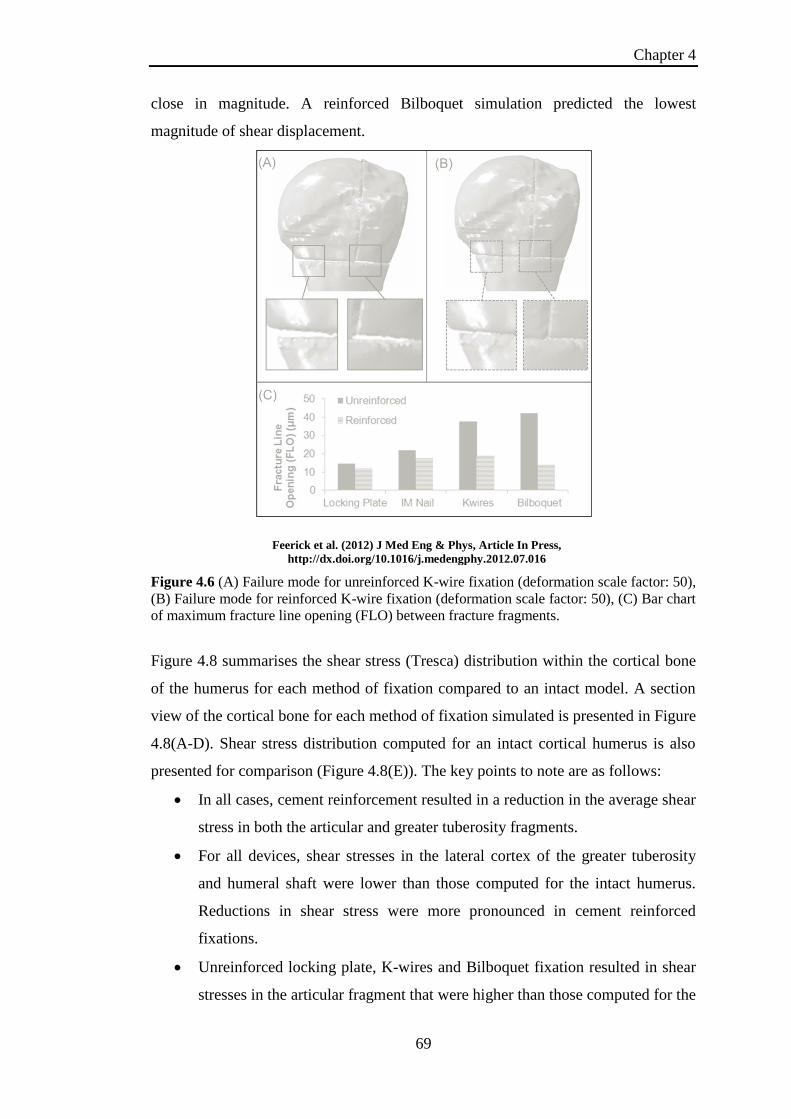
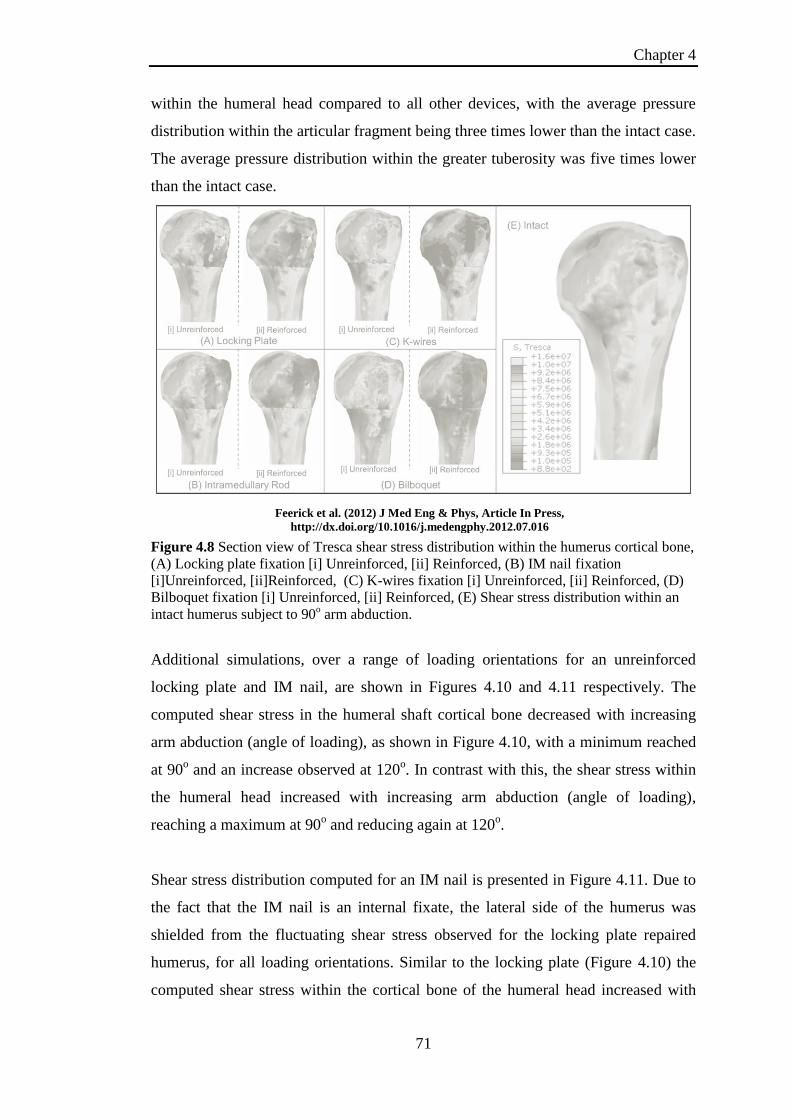
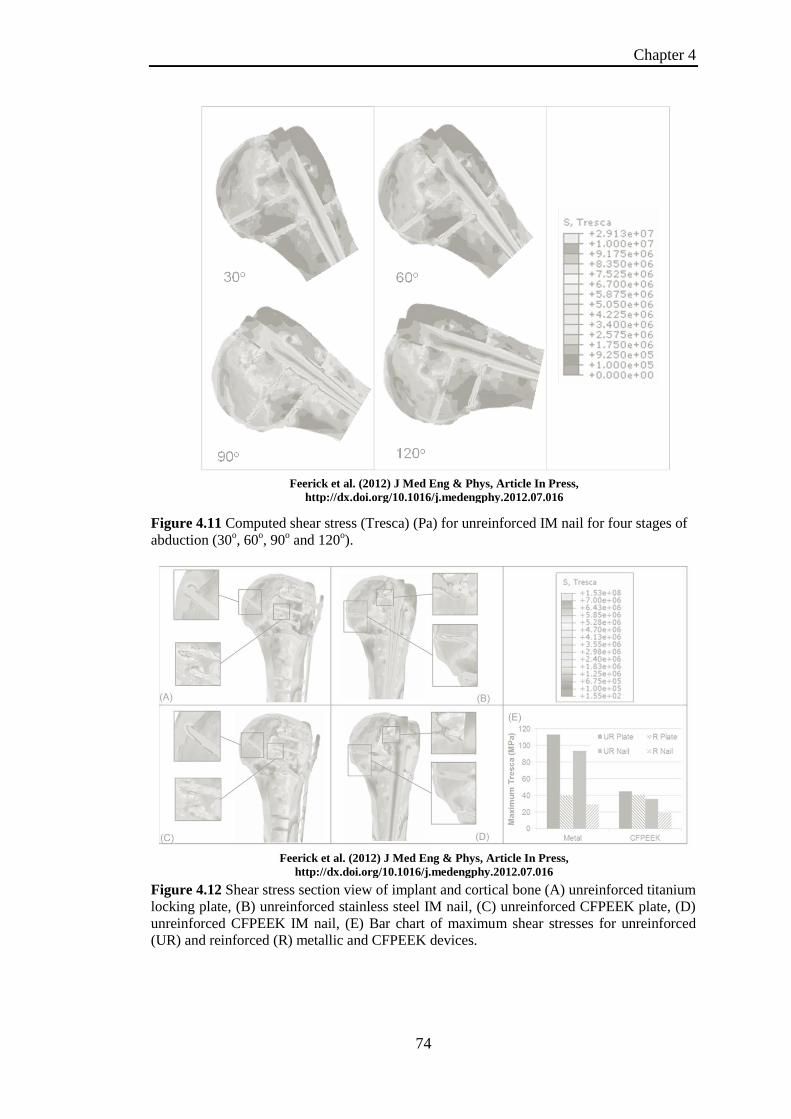
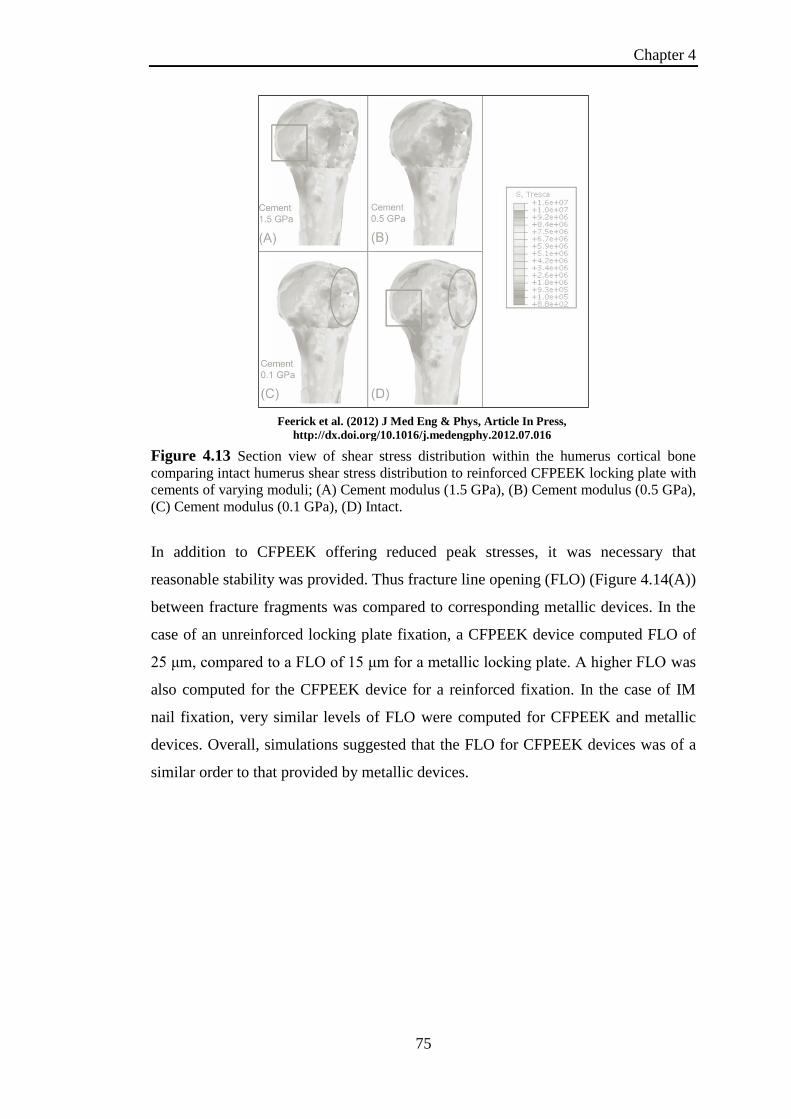
4.3 Results .................................................................................................. 67
4.3.1 Experimental: ................................................................................ 67
4.3.2 Computational: .............................................................................. 67
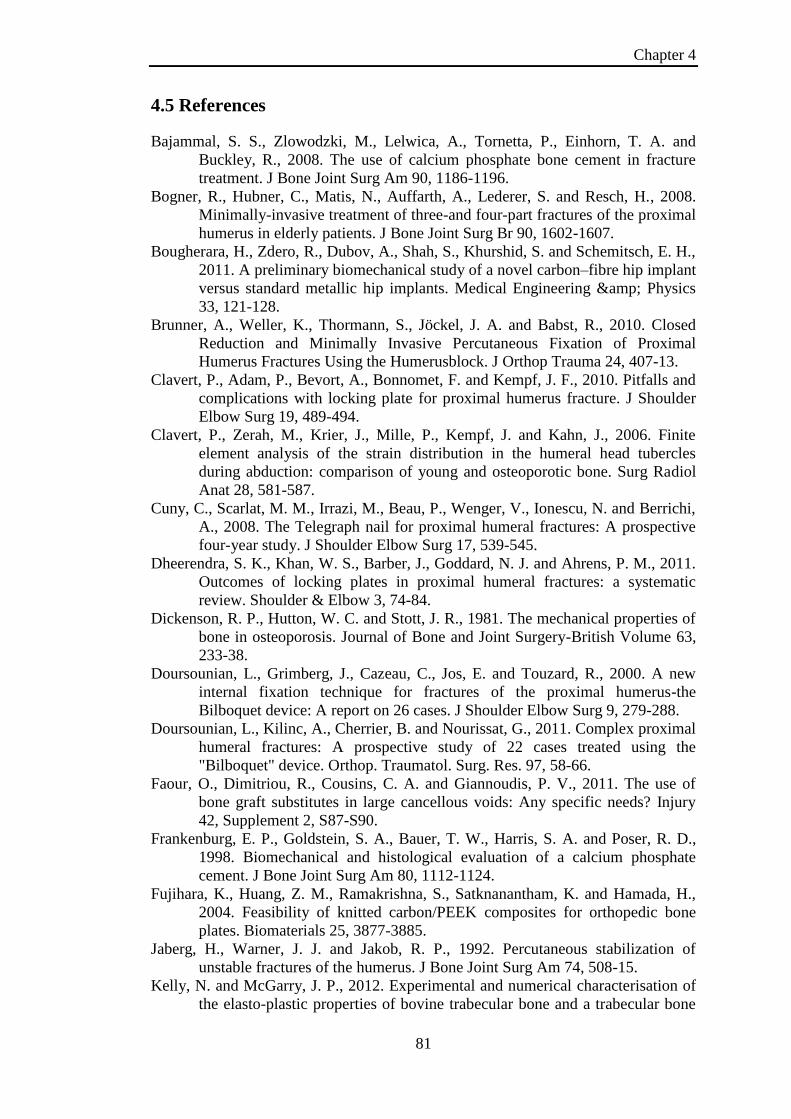
4.4 Discussion ............................................................................................. 76
4.5 References ............................................................................................. 81
4.6 Appendix 4A ......................................................................................... 84
Chapter 5
Experimental Study of Cortical Bone Screw Pullout................................ 85
5.1 Introduction ........................................................................................... 85
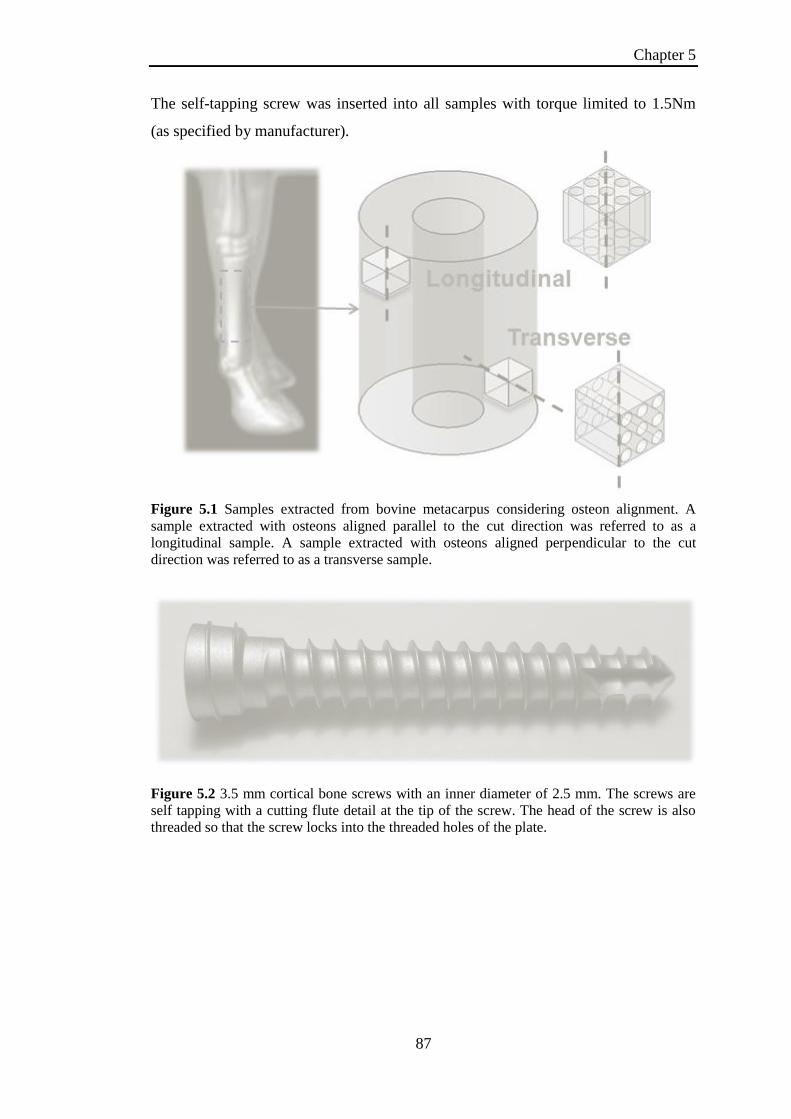
5.2 Materials and Methods .......................................................................... 86
5.2.1 Sample preparation........................................................................ 86
5.2.2 Orthopaedic Cortical Bone Screws ............................................... 86
5.2.3 Standard Pullout Tests .................................................................. 88
5.2.4 Screw Pullout Damage Visualisation Test (SPDV) ...................... 89
5.2.5 Comparison of Standard Pullout and SPDV Tests ........................ 91
5.2.6 SPDV Test Image Capture ............................................................ 92
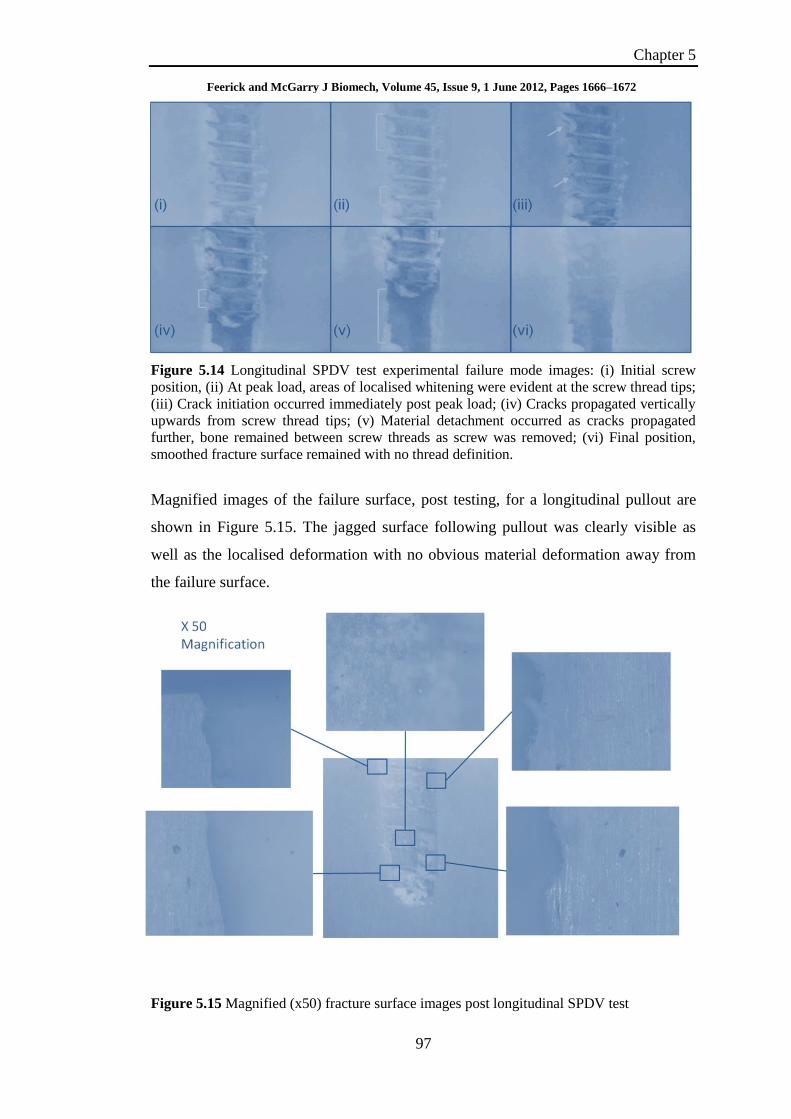
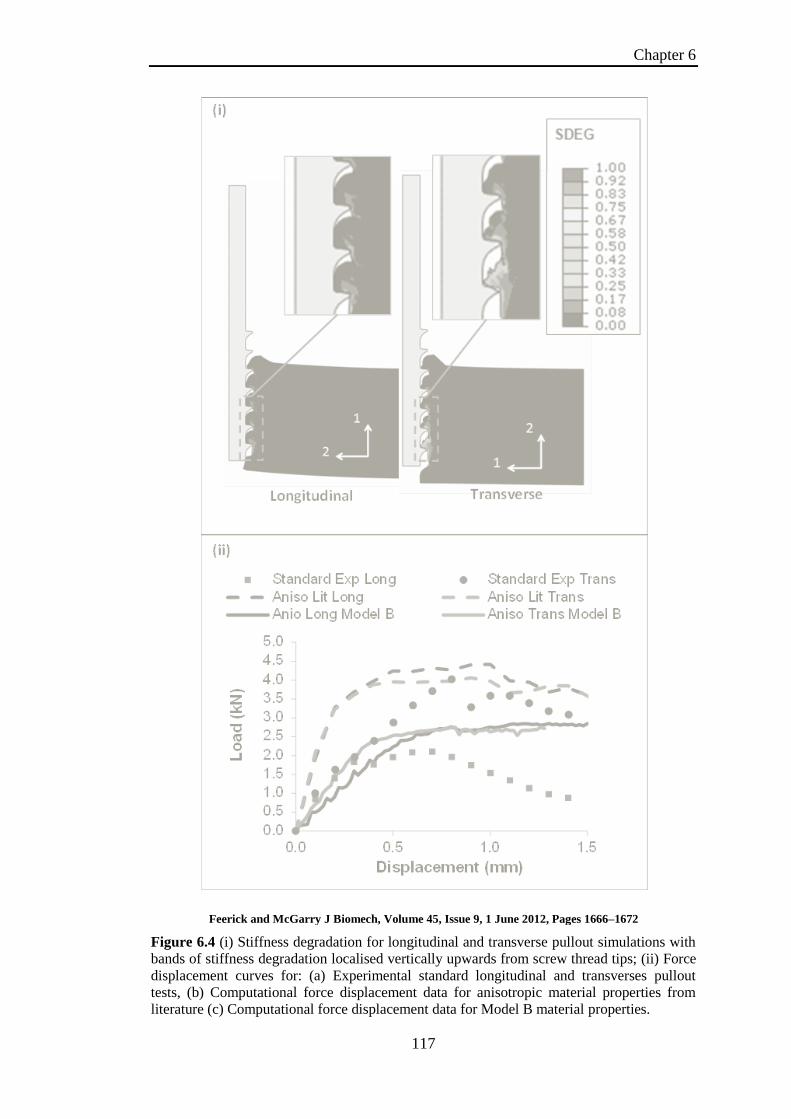
5.3 Results ................................................................................................... 92
5.3.1 Complete Pullout ........................................................................... 93
5.3.1.1 Longitudinal Pullout Results .................................................... 93
5.3.1.2 Transverse Pullout Results ....................................................... 94
5.3.2 Screw Pullout Damage Visualisation ............................................ 96
5.3.2.1 SPDV Longitudinal Pullout Results ........................................ 96
5.3.2.2 SPDV Transverse Pullout Results ............................................ 98
5.4 Discussion ........................................................................................... 100
5.5 References ........................................................................................... 102
5.6 Appendix 5A: Test Rig CAD Assembly Drawings ............................ 103
5.7 Appendix 5B: Computational Assessment of SPDV Test .................. 105
Page 7
VI
Chapter 6
Computational Study of Cortical Bone Screw Pullout using Element
Deletion........................................................................................................ 111
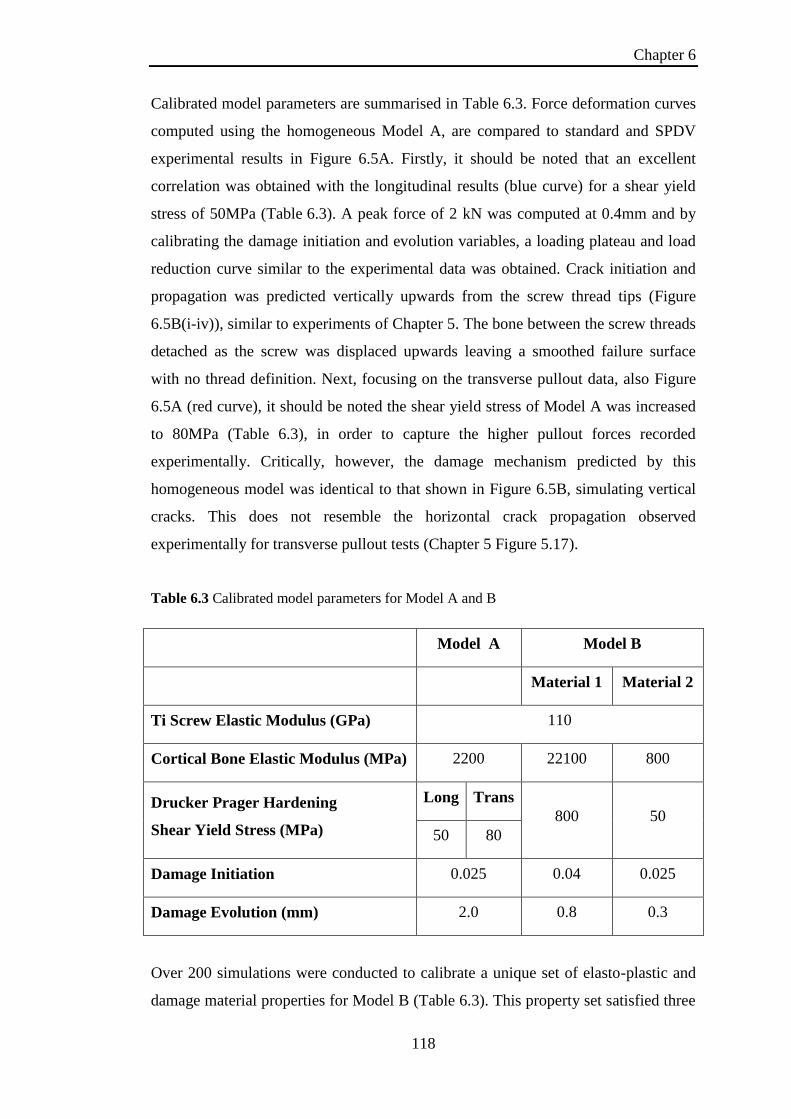
6.1 Introduction ......................................................................................... 111
6.2 Materials and Methods ........................................................................ 112
6.3 Results ................................................................................................. 114
6.4 Discussion ........................................................................................... 123
6.5 References ........................................................................................... 126
6.6 Appendix 6A: Model B Calibration .................................................... 128
Chapter 7
Anisotropic Mode Dependent Damage of Cortical Bone using the
Extended Finite Element Method (XFEM).............................................. 134
7.1 Introduction ......................................................................................... 134
7.2 Materials & Methods .......................................................................... 136
7.2.1 Cortical Bone Failure Criteria ..................................................... 136
7.2.2 Material Parameter Longitudinal Calibration ............................. 138
7.2.3 Material Parameter Transverse/Longitudinal Calibration ........... 138
7.2.4 XFEM Application: 2D and 3D Screw Pullout .......................... 141
7.3 Results ................................................................................................. 141
7.3.1 Material Parameter Longitudinal/Transverse Calibration ........... 141
7.3.2 2D application: Screw pullout ..................................................... 145
7.4 XFEM Application: 3D Proximal Humeral Fracture Fixation ........... 147
7.4.1 Materials and Methods ................................................................ 147
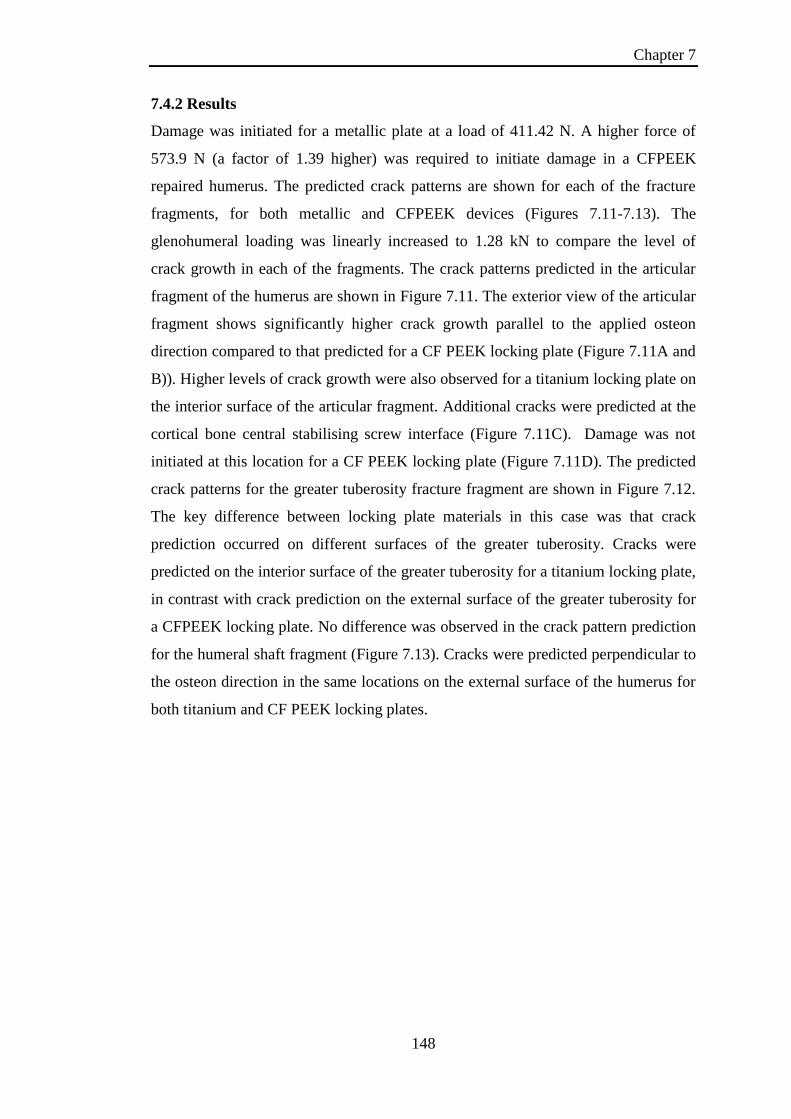
7.4.2 Results ......................................................................................... 148
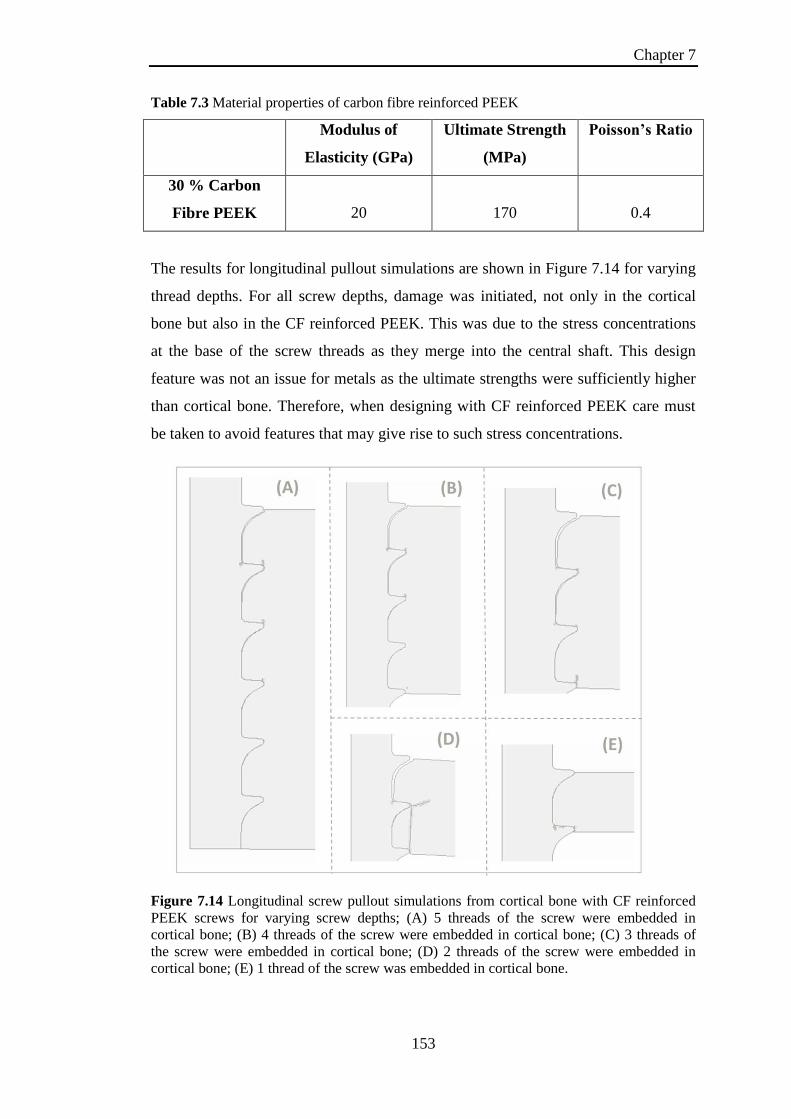
7.5 XFEM Application: CF PEEK orthopaedic screws ............................ 152
7.6 Discussion ........................................................................................... 154
7.7 References ........................................................................................... 158
7.8 Appendix 7A: Mesh Sensitivity .......................................................... 160
7.9 Appendix 7B: XFEM Observations .................................................... 160
7.10 Appendix 7C: 2D FORTRAN User Subroutine................................ 162
7.11 Appendix 7D: 3D FORTRAN User Subroutine ............................... 164
Chapter 8
Concluding Remarks ................................................................................. 167
Page 8
Chapter 1
1
Chapter 1
Introduction
Orthopaedic fracture fixation encompasses a broad range of fracture types. Currently
an orthopaedic surgeon may select from a wide array of commercially available
devices for the surgical repair of a given fracture type. Selection of a fracture
fixation device is seldom biomechanically motivated, but is more generally based on
the experience/preferred practice of the surgeon, on publications of clinical outcomes
for large patient populations, or restriction to hospital approved medical device
vendors. Proximal humeral fractures are the third most common fracture after hip
and wrist fractures. The complexity of a humerus fracture repair increases with the
number of fracture fragments that result from the injury, and with the level of
displacement of these fragments. Several types of proximal humeral fracture fixation
devices have been developed and implemented clinically. However, to date an
optimal repair device is yet to be identified as a function of the number and
displacement of fracture fragments, with a high rate of device failure being reported.
Commonly reported failures of screw anchored devices include screw
pullout/pushout (43% of patients over 60 years of age (Owsley and Gorczyca
(2008))). One such example is shown in Figure 1.1, in which the screw has
penetrated the cortical bone of the humerus, making contact with the glenoid surface.
In order to progress towards an optimal device design with sufficient life span and
reversion to intact functionality, it is important to identify the key device design
features that dictate the success or failure of a fracture device. In addition to this, a
complete understanding of the material properties of bone and the failure
mechanisms that occur during the failure of these devices is paramount.
The overall aim of this thesis is to gain a better fundamental understanding of the
failure mechanisms of cortical bone, with a specific focus on screw pullout and
proximal humeral fracture repair.
Page 9
Chapter 1
2
The specific objectives of this thesis are;
Analysis of proximal humeral fracture fixation techniques to identify
potential failures in terms of fracture fragment stability and stress distribution
within the cortical bone of a three part fracture repaired humerus.
Investigation of cortical bone failure mechanisms during screw pullout by
developing a novel damage visualisation test rig to capture failure
mechanisms of cortical bone during pullout.
Development of a phenomenological biphasic multi-layered composite model
as a representation of cortical bone microstructure and use this in conjunction
with the damage evolution method of element deletion to predict the pullout
strength and crack patterns during cortical bone screw pullout (as observed
experimentally).
Development of an anisotropic elastic homogeneous continuum
representation of cortical bone coupled with anisotropic damage initiation
criteria using the extended finite element method (XFEM). Therefore,
lowering computational expense compared to the phenomenological biphasic
multi-layered composite model.
Application of the anisotropic elastic homogeneous continuum representation
of cortical bone coupled with anisotropic damage initiation criteria to 2D and
3D single screw pullout as well as 3D locking plate repair of a three part
proximal humeral fracture fixation.
Figure 1.1 X-ray images of locking plate, with screw penetration highlighted at the
glenohumeral interface. Image obtained from Owsley and Gorczyca (2008)
Content
Removed Due to
Copyright
Page 10
Chapter 1
3
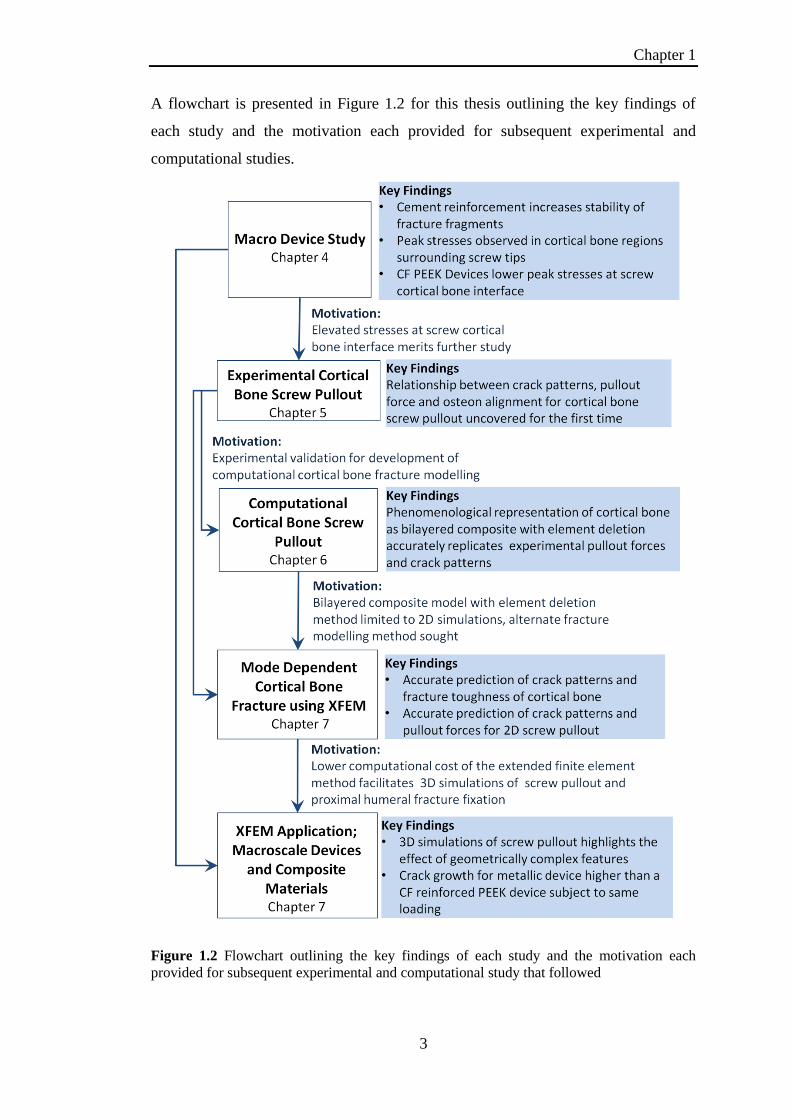
A flowchart is presented in Figure 1.2 for this thesis outlining the key findings of
each study and the motivation each provided for subsequent experimental and
computational studies.
Figure 1.2 Flowchart outlining the key findings of each study and the motivation each
provided for subsequent experimental and computational study that followed
Page 11
Chapter 1
4
The research work presented in this thesis began in the area of fracture fixation of
the proximal humerus. For the first time, a detailed computational assessment of four
proximal humeral fraction fixation techniques was conducted. The initial focus of
this study was comparison of the performance of metallic fracture fixation devices,
in terms of stability of fracture fragments and stress distribution within the humerus.
These results provided some clinically relevant outcomes, such as, cement reinforced
devices offer greater stability by lowering the micro motion between fracture
fragments. Furthermore, a more significant observation were pressure and shear
stress concentrations at the screw cortical bone interface, highlighting potential
locations of failure at the screw cortical bone interface. This was due to the
significantly higher stiffness of metallic implants, compared to the cortical bone in
which they were implanted. The magnitude of these stress concentrations were in the
range of osteoporotic cortical bone ultimate strength (Dickenson et al. (1981)).
Therefore, an alternate material (carbon fibre reinforced PEEK (CFPEEK)) was
proposed for the locking plate and intramedullary rod devices that had a modulus
similar to that of cortical bone. This material offered similar stability to that of its
metallic counterparts. Notably, a significant reduction in peak shear stresses at the
screw tip bone interface was observed for a CFPEEK device. However, the trend of
stress concentrations in the cortical bone surrounding screw tips remained,
explaining clinically observed device failure (Figure 1.1). It is paramount for future
device designs and configurations that the mechanisms leading to pullout and
pushout are fully understood.
Following the key and most interesting finding of the fracture fixation analyses,
stress concentrations predicted at the screw cortical bone interface, an experimental
study of single screw pullout from cortical bone was conducted. Previous
experimental screw pullout studies conducted tests according to ASTM standards.
This type of test provides load displacement data but provides little enlightenment
with regard to failure mechanisms in the material that lead to screw pullout. Due to
the fact that cortical bone is highly anisotropic (Reilly and Burstein (1975); Cowin
(2001)) with a distinct aligned microstructure (Rho et al. (1998); Kutz (2003)) the
pullout strength and fracture patterns were expected to be related to the orientation of
this microstructure. A novel test rig was developed which is referred to a screw
pullout damage visualisation (SPDV) test. This novel test rig was used to investigate
Page 12
Chapter 1
5
cortical bone failure mechanisms in real time as the screw was removed from the
cortical bone. Standard pullout tests were also conducted; load data from the
standard pullout tests was used to validate the load data recorded during an SPDV
test. The experimental SPDV test successfully uncovered for the first time, the
relationship between osteon alignment, crack patterns and failure force for cortical
bone screw pullout (Alternate pullout strengths were previously reported by Seebeck
et al. (2004), however no failure mechanisms were uncovered). Pullout force was
highest for osteons aligned perpendicular to the pullout direction (transverse
pullout). Large deformation and significant crack growth perpendicular to the central
axis of the screw was observed during transverse pullout. Pullout force was
significantly lower for osteons aligned parallel to the direction of pullout
(longitudinal). Localised crack patterns parallel to the central axis of the screw were
observed with material between screw threads removed during longitudinal pullout.
Such significant findings provided motivation for the development of a
computational model capable of replicating the phenomena observed experimentally.
The development of a validated computational model for cortical bone fracture
potentially offers a powerful design evaluation tool for a range of orthopaedic
devices.
Initial computational simulations of cortical bone screw pullout were conducted
using a homogeneous anisotropic elasto-plastic material coupled with the crack
propagation method of element deletion. Despite the significantly different material
properties assigned in the directions parallel and perpendicular to the osteon
directions, the same crack patterns were predicted for both a longitudinal and
transverse simulation. This was due to the fact that the element removal technique
utilises isotropic damage evolution and the removal of an element had no associated
directionality. This critical finding motivated the development of a
phenomenological representation of the cortical bone microstructure to capture the
key differences between longitudinal and transverse pullout forces and failure
mechanisms. A biphasic multi-layered composite model was developed as a
phenomenological representation of the microstructure of cortical bone. 2D
axisymmetric simulations of cortical bone screw pullout (based on the geometry of
the screws used in the experimental study) were conducted. The calibrated biphasic
multi-layered composite model developed is capable of predicting (i) Higher pullout
Page 13
Chapter 1
6
forces for transverse pullout; (ii) Horizontal crack paths perpendicular to screw axis
for transverse pullout, whereas vertical crack paths were computed for longitudinal
pullout. This provides a useful paradigm that can be used to evaluate screw thread
design for application specific fracture fixation. However, it emerged that application
of the biphasic multi-layered composite model with element deletion to 3D
simulations raised computational demand beyond a viable threshold. This limited the
biphasic multi-layered composite model to 2D simulations. Many orthopaedic
devices contain unsymmetrical or geometrically complex features that cannot be
fully evaluated in 2D. For example, self tapping orthopaedic screws have
unsymmetrical features such as a helical design and a cutting flute at the screw tip
that aids insertion. Therefore, it was clear that an alternate method of fracture
modelling with a lower computational demand was required in order to conduct 3D
simulations of screw pullout or whole bone fracture fixation.
One such crack propagation technique that was identified was the extended finite
element method (XFEM). For this method, cracks propagate through a mesh by
splitting elements instead of removing them from the mesh. Explicit representation
of cortical bone microstructure was not necessary; instead it is simply modelled as an
anisotropic homogeneous elastic continuum. In order to capture experimentally
observed crack propagation direction and mode dependent fracture toughness,
anisotropic damage initiation criteria were developed based on a known osteon
orientation. The anisotropic damage initiation criteria were developed for XFEM
prediction of crack initiation and direction of crack propagation. Interestingly, this
highlights the critical role of the anisotropic damage initiation criteria with definition
of crack direction via XFEM. The anisotropic elasto-plastic homogeneous modelling
that was implemented in conjunction with the element deletion method (mentioned
previously) failed to capture differences between crack patterns and failure forces.
This was due to the fact that the element deletion technique utilises isotropic damage
evolution and the removal of an element had no associated directionality. A unique
set of parameters were calibrated using data reported by previous experimental
studies of cortical bone fracture toughness (Norman et al. (1996); Zimmermann et al.
(2009)). The proposed homogenised representation of cortical bone coupled with
anisotropic damage initiation criteria in conjunction with XFEM predict; (i) the
relationship between fracture energy and osteon alignment; (ii) the alternate crack
Page 14
Chapter 1
7
patterns for both varying osteon orientations and loading angle. Application of the
calibrated XFEM model to 2D screw pullout resulted in accurate prediction of; (i)
distinctive patterns of crack propagation during screw pullout for longitudinal and
transverse screw pullout; (ii) alternate pullout strengths, with transverse pullout
requiring significantly higher pullout force than longitudinal simulations. Both of
these findings accurately replicate the experimental findings of single screw pullout.
Due to the lower computational expense of XFEM, application of the calibrated
material properties to 3D models was possible. 3D simulations of single screw
pullout were conducted revealing the influence of helical screw design and cutting
flute of self tapping orthopaedic screws. Furthermore, the calibrated material model
with XFEM was then applied to unreinforced locking plate fixation of the proximal
humerus using the 3D models generated as part of the initial work of this thesis.
Simulations revealed that the level of crack growth for a metallic device was
significantly higher than that of a CF reinforced PEEK device for the same loading
magnitude. Critical locations of crack initiation are also identified. This concluding
application of the methodologies developed in this thesis for cortical bone fracture
modelling highlights the huge potential for their application to future designing of
orthopaedic fracture fixation devices.
The structure of this thesis is presented as follows. Chapter 2 outlines the important
background literature relevant to the work of the present thesis to provide an
introduction to bone mechanics, proximal humeral fractures, fixation devices and
biomaterials. It is important to note that additional relevant literature for each of the
experimental and computational studies is also presented at the beginning of each
chapter as an introduction to that study. Chapter 3 outlines the important relevant
computational theory on finite element techniques, material formulations and
damage techniques used in the computational analyses of Chapters 4, 6 and 7.
Chapter 4 contains the initial work providing significant motivation for the primary
application focus of this thesis, namely cortical bone screw pullout. Chapter 5
contains the experimental study of single screw pullout from bovine cortical bone.
The experimental results of Chapter 5 provide validation of the computational
models of cortical bone screw pullout outlined in Chapters 6 and 7. The 2D
Page 15
Chapter 1
8
computational models developed for cortical bone screw pullout using the element
deletion method (based on the experimentally observed data) are presented in
Chapter 6. The anisotropic homogeneous elastic continuum models of cortical bone
coupled with anisotropic damage initiation criteria and evolution via XFEM are
presented in Chapter 7. The additional application of XFEM to 2D and 3D screw
pullout as well as 3D macroscale simulations of locking plate fixation, of a 3 part
proximal humeral fracture, are contained in Chapter 7. Concluding remarks and
suggested future work are outlined in Chapter 8 of this thesis.
Page 16
Chapter 1
9
References
Cowin, S. C., 2001. Bone mechanics handbook, CRC press USA.
Dickenson, R. P., Hutton, W. C. and Stott, J. R., 1981. The mechanical properties of
bone in osteoporosis. Journal of Bone and Joint Surgery-British Volume 63,
233-38.
Kutz, M., 2003. Standard Handbook of Biomedical Engineering and Design,
McGraw-Hill. 8.1-8.23.
Norman, T. L., Nivargikar, S. V. and Burr, D. B., 1996. Resistance to crack growth
in human cortical bone is greater in shear than in tension. Journal of
Biomechanics 29, 1023-1031.
Owsley, K. C. and Gorczyca, J. T., 2008. Displacement/Screw Cutout After Open
Reduction and Locked Plate Fixation of Humeral Fractures. J Bone Joint
Surg Am 90, 233-240.
Reilly, D. T. and Burstein, A. H., 1975. The elastic and ultimate properties of
compact bone tissue. Journal of Biomechanics 8, 393-396, IN9-IN11, 397-
405.
Rho, J.-Y., Kuhn-Spearing, L. and Zioupos, P., 1998. Mechanical properties and the
hierarchical structure of bone. Medical Engineering & Physics 20, 92-
102.
Seebeck, J., Goldhahn, J., Städele, H., Messmer, P., Morlock, M. M. and Schneider,
E., 2004. Effect of cortical thickness and cancellous bone density on the
holding strength of internal fixator screws. Journal of Orthopaedic Research
22, 1237-1242.
Zimmermann, E. A., Launey, M. E., Barth, H. D. and Ritchie, R. O., 2009. Mixed-
mode fracture of human cortical bone. Biomaterials 30, 5877-5884.
Page 17
Chapter 2
10
Chapter 2
Background
The sections of this chapter provide an introduction to the relevant subject areas of
this thesis. Bone structure, mechanics and experimentally reported material
properties are summarised for human, animal and synthetic bone. The anatomy of
the shoulder is introduced with a specific focus on the glenohumeral joint. Proximal
humeral fracture classification is also introduced in addition to some of repair
options that are investigated as part of this thesis. The relevant biomaterials
associated with proximal humeral fracture repair and screw pullout are also
discussed. In addition to the background literature provided in this chapter, critically
relevant literature to each of the studies of Chapter 4-7 is provided as an introduction
within that chapter.
2.1 Bone Mechanics
The skeletal system provides structure and shape for the body while also protecting
vital internal organs. Movement of the body is also facilitated through the
contracting of muscles that are anchored to the bones of the skeletal system. As the
skeletal system performs these functions, bone undergoes a range of loading
configurations both cyclically and statically. Bone is an ever growing tissue with the
ability to adapt to its loading environment. The two main types of bone tissue are
cortical and trabecular bone. Cortical bone is the dense tough skin forming the outer
morphology of bone. Cancellous bone is less dense, consisting of a porous network
of trabeculae that form the spongy bone located under the outer layers of cortical
bone (Rho et al. (1998); Kutz (2003); Liebschner (2004)). A summary of the
microstructure of cortical and cancellous bone is shown in Figure 2.1
Page 18
Chapter 2
11
Figure 2.1 Cortical and cancellous bone microstructure and location within a typical long
bone at a multiscale level; image obtained from Liebschner and Keller (2005)
2.1.1 Bone Structure
Cortical bone is a naturally occurring composite. The constituents can be classified
as organic and inorganic phases and water. The organic phase consists of impure
hydroxyapatite, while the inorganic phase consists mainly of collagen (90% type I
collagen) (Currey (2002); Kutz (2003)). The organisation of these constituents is
shown in Figure 2.2. At the micro-scale concentric stacks of collagen sheets with a
central Haversian canal form osteons. Volkmann’s canals run perpendicular to
Haversian canals interconnecting neighbouring haversian canals with the periosteum.
The periosteum is the membrane covering the surface of all bones consisting of a
network of dense fibrous tissue providing the blood supply and nourishment to the
bone. Osteons are embedded in an interstitial matrix of hydroxyapatite, as illustrated
in Figure 2.2 as the regions between neighbouring osteons. In long whole bones,
osteons are aligned parallel to the central axis of the bone (Rho et al. (1998); Kutz
(2003)).
Content Removed Due to Copyright
Page 19
Chapter 2
12
Figure 2.2 Cortical bone microstructure; image obtained from Weatherholt et al. (2012)
Two categories of bone exist for cortical bone, woven or lamellar bone. Primary
bone or early life bone is referred to as woven bone (An and Draughn (1999)).
Woven bone is formed at birth with no distinct arrangement of osteons in the
microstructure. Collagen fibres are arranged at random within woven bone. Due to
the random arrangement of the microstructure of woven bone it has a much lower
strength than lamellar bone. Lamellar or secondary bone is the structure outlined in
Figure 2.2. It is formed with age as woven bone is remodelled and the structured
alignment of collagen shown in Figure 2.2 is formed (McNamara (2011)). The
alignment of the fibres of the stacked collagen sheets shown in Figure 2.2B can also
vary as shown in Figure 2.3 (An and Draughn (1999)).
Cancellous bone is a porous structure that has significantly lower density and higher
porosity than cortical bone (Kutz (2003)). It is located in the medulla of the bone in
the epiphysis and metaphysic regions of long bones (An and Draughn (1999)). The
microstructure of cancellous bone consists of a network of rods and plates or
trabeculae producing a spongy porous structure (An and Draughn (1999))
Content Removed Due to Copyright
Page 20
Chapter 2
13
(Figure 2.1). Interdigitated between the pores of cancellous bone is a fluid of bone
marrow (McNamara (2011)).
Figure 2.3 Illustration of three types of osteons. Transversal (T), alternate (A) and
longitudinal (L) osteon. Image obtained from An and Draughn (1999)
This combined architecture of cortical and cancellous bone provides the unique
material properties recorded for bone. Additionally, the microstructure is responsible
for the complex stress distribution within whole bones as they undergo single and
multiaxial loadings both statically and cyclically during daily activities.
2.1.2 Mechanical Properties of Cortical Bone
The mechanical properties of cortical bone have been experimentally investigated by
several research groups at multiple scales using a range of experimental test
methods. Some of the reported material properties are summarised in Table 2.1.
It is clear from Table 2.1 that cortical bone is an anisotropic material. It exhibits
different strengths under tension and compression, with highest strength in the latter.
Additionally, from the data of Table 2.1, the size of the cortical bone samples has an
Content Removed Due to Copyright
Page 21
Chapter 2
14
effect on the elastic modulus, as the modulus for single osteons is consistently lower
than larger macroscale samples used by Reilly and Burstein (1975). The size
dependency of cortical bone samples relative to elastic modulus was investigated by
Choi et al. (1990). A range of sample sizes were investigated with heights of 100-
1000 µm. The relationship between sample size and modulus observed by Choi et al.
(1990) is shown in Figure 2.4.
Figure 2.4 Size dependency of cortical bone modulus relative to the surface area to volume
ratio. Image taken from Choi et al. (1990).
The age related properties of cortical bone have also been investigated (Burstein et
al. (1976); Dickenson et al. (1981); Zioupos and Currey (1998)). The most
significant age related change reported by Burstein et al. (1976) for healthy
specimens was the reduction in plastic strain before failure. Therefore there was an
increase in instances of brittle failure with age. Dickenson et al. (1981) reported the
altered mechanical properties of healthy (normal) bone compared to that of
osteoporotic bone aged 67-91 years. Osteoporosis is a disease that leaches bone mass
and leads to thinning bone microstructures. This is due to defective bone remodelling
activity. This disease is predominantly associated with postmenopausal women
(McNamara (2011)). The altered mechanical properties of cortical bone as a result of
osteoporosis are shown in Figure 2.5.
Content Removed Due to Copyright
Page 22
Chapter 2
15
Table 2.1 Modulus of Elasticity of Cortical bone
Study
Ori
enta
tio
n
Specimen Origin Modulus
(GPa)
Standard
Deviation
(SD)
Ultimate
Strength
(MPa)
Mechanical Test: Tension
Reilly and Burstein (1975) L Human Femur 17.9 (3.9) 133
Reilly and Burstein (1975) T Human Femur 10.1 (2.4) 51
Ascenzi and Bonucci
(1968)
L Single Osteon Human
Femur
11.7 (5.8)
Ascenzi and Bonucci
(1968)
A Single Osteon Human
Femur
5.5 (2.6)
Ko (1953) L Human Humerus 17.2
Ko (1953) L Human Radius 18.5
Mechanical Test: Compression
Reilly and Burstein (1975) L Human Femur 18.2 (0.85) 193
Reilly and Burstein (1975) T Human Femur 11.7(1.01) 133
Ascenzi and Bonucci
(1968)
L Single Osteon Human
Femur
6.3 (1.8)
Ascenzi and Bonucci
(1968)
A Single Osteon Human
Femur
7.4 (1.6)
Ascenzi and Bonucci
(1968)
T Single Osteon Human
Femur
9.3 (1.6)
Mechanical Test: Bending
Reilly and Burstein (1975) Human Femur 3.28 (0.38)
Ascenzi et al. (1990) L Single Osteon Human
Femur
2.32 (1.20)
Ascenzi et al. (1990) A Single Osteon Human
Femur
2.69 (0.93)
Page 23
Chapter 2
16
Figure 2.5 Stress strain curve for healthy and osteoporotic cortical bone aged 67-91 years.
Image taken from Dickenson et al. (1981)
Asymmetric yielding is a material characteristic reported for cortical bone (Bayraktar
et al. (2004); Mercer et al. (2006)). Cortical bone has a higher yield and ultimate
strength in compression than in tension. The yielding response of cortical bone has
been compared to that of a soil, with previous studies implementing the Drucker
Prager plasticity model to simulate the cortical bone plasticity behaviour observed
experimentally (Drucker and Prager (1952); Mercer et al. (2006); Mullins et al.
(2009)).
Cortical bone also exhibits anisotropic fracture toughness. Several experimental
studies have investigated the fracture toughness of cortical bone for longitudinally
and transversely aligned cortical bone (Norman et al. (1996); Feng et al. (2000);
Zimmermann et al. (2009); Zimmermann et al. (2010); Olvera et al. (2012)). Cortical
bone exhibits the lowest fracture toughness when the applied loading is parallel to
the direction of the osteon alignment. Fracture toughness of cortical bone is highest
when the applied loading is perpendicular to the direction of osteon alignment as
reported by Zimmermann et al. (2009). The relationship between fracture toughness
and microstructural alignment are shown in Figure 2.6.
Content Removed Due to Copyright
Page 24
Chapter 2
17
Figure 2.6 Fracture toughness of cortical bone defined in terms of strain energy release rate
as a function of phase angle for transversely and longitudinally aligned cortical bone. Image
taken from Zimmermann et al. (2009)
In addition to the relationship of fracture toughness of cortical bone to microstructure
alignment, the microstructure of cortical bone also influences the crack trajectories
during fracture (Nalla et al. (2003); Nalla et al. (2004); Ritchie et al. (2006); Budyn
and Hoc (2010)) (Figure 2.7).
Figure 2.7 Illustrations of the toughening mechanisms of cortical bone, with the crack
trajectories altered by the microstructure of cortical bone. (a) crack deflection due to osteons,
(b) crack bridging by collagen fibres, (c) uncracked ligament bridging and (d) micro
cracking. Image taken from Ritchie et al. (2006)
Content Removed Due to Copyright
Content Removed Due to Copyright
Page 25
Chapter 2
18
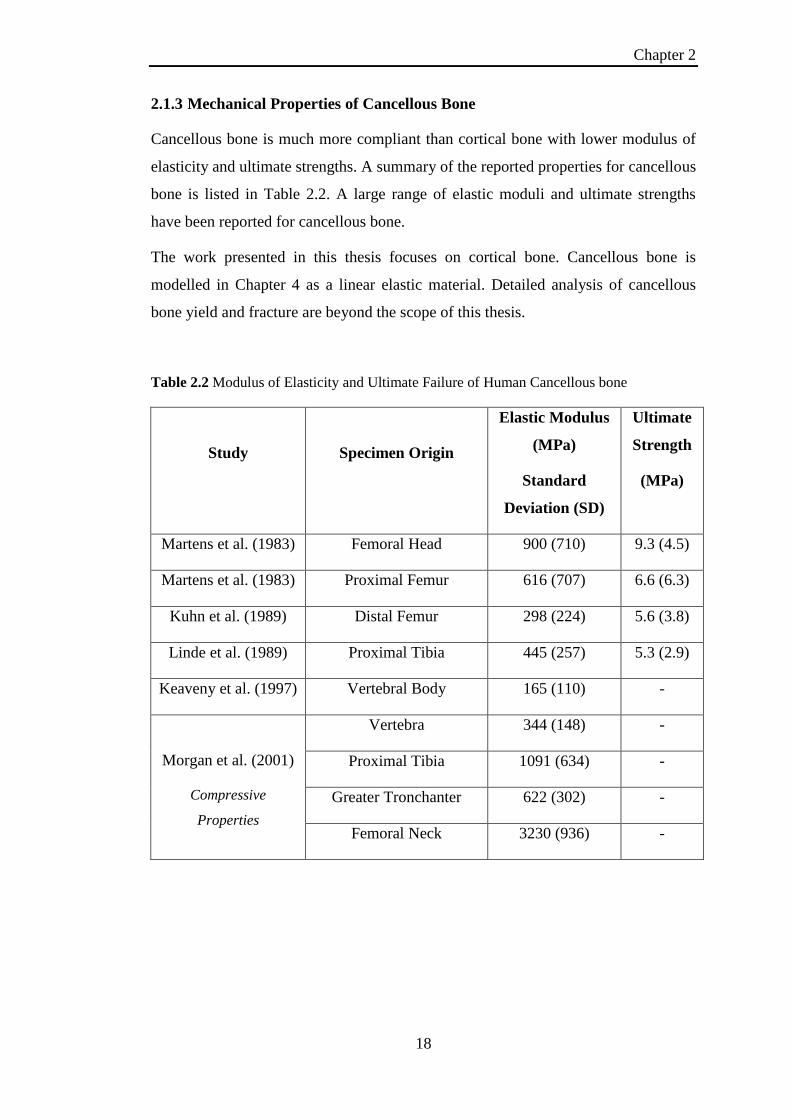
2.1.3 Mechanical Properties of Cancellous Bone
Cancellous bone is much more compliant than cortical bone with lower modulus of
elasticity and ultimate strengths. A summary of the reported properties for cancellous
bone is listed in Table 2.2. A large range of elastic moduli and ultimate strengths
have been reported for cancellous bone.
The work presented in this thesis focuses on cortical bone. Cancellous bone is
modelled in Chapter 4 as a linear elastic material. Detailed analysis of cancellous
bone yield and fracture are beyond the scope of this thesis.
Table 2.2 Modulus of Elasticity and Ultimate Failure of Human Cancellous bone
Study
Specimen Origin
Elastic Modulus
(MPa)
Standard
Deviation (SD)
Ultimate
Strength
(MPa)
Martens et al. (1983) Femoral Head 900 (710) 9.3 (4.5)
Martens et al. (1983) Proximal Femur 616 (707) 6.6 (6.3)
Kuhn et al. (1989) Distal Femur 298 (224) 5.6 (3.8)
Linde et al. (1989) Proximal Tibia 445 (257) 5.3 (2.9)
Keaveny et al. (1997) Vertebral Body 165 (110) -
Morgan et al. (2001)
Compressive
Properties
Vertebra 344 (148) -
Proximal Tibia 1091 (634) -
Greater Tronchanter 622 (302) -
Femoral Neck 3230 (936) -
Page 26
Chapter 2
19
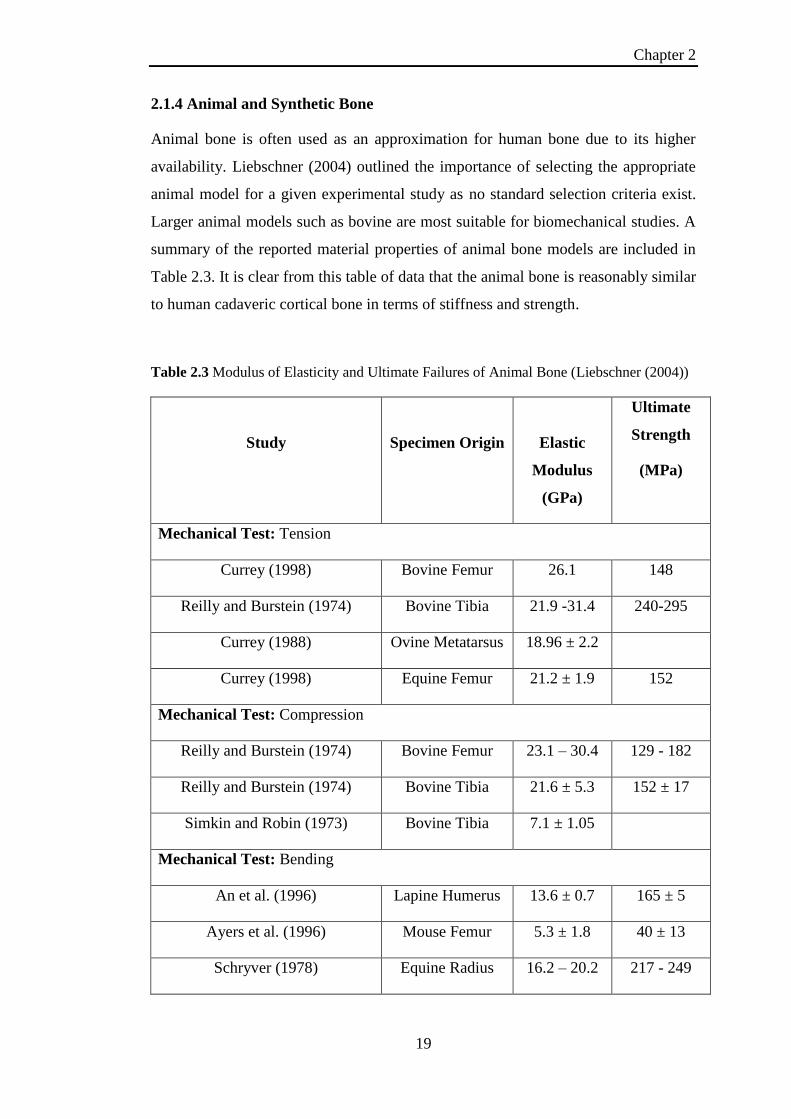
2.1.4 Animal and Synthetic Bone
Animal bone is often used as an approximation for human bone due to its higher
availability. Liebschner (2004) outlined the importance of selecting the appropriate
animal model for a given experimental study as no standard selection criteria exist.
Larger animal models such as bovine are most suitable for biomechanical studies. A
summary of the reported material properties of animal bone models are included in
Table 2.3. It is clear from this table of data that the animal bone is reasonably similar
to human cadaveric cortical bone in terms of stiffness and strength.
Table 2.3 Modulus of Elasticity and Ultimate Failures of Animal Bone (Liebschner (2004))
Study
Specimen Origin
Elastic
Modulus
(GPa)
Ultimate
Strength
(MPa)
Mechanical Test: Tension
Currey (1998) Bovine Femur 26.1 148
Reilly and Burstein (1974) Bovine Tibia 21.9 -31.4 240-295
Currey (1988) Ovine Metatarsus 18.96 ± 2.2
Currey (1998) Equine Femur 21.2 ± 1.9 152
Mechanical Test: Compression
Reilly and Burstein (1974) Bovine Femur 23.1 – 30.4 129 - 182
Reilly and Burstein (1974) Bovine Tibia 21.6 ± 5.3 152 ± 17
Simkin and Robin (1973) Bovine Tibia 7.1 ± 1.05
Mechanical Test: Bending
An et al. (1996) Lapine Humerus 13.6 ± 0.7 165 ± 5
Ayers et al. (1996) Mouse Femur 5.3 ± 1.8 40 ± 13
Schryver (1978) Equine Radius 16.2 – 20.2 217 - 249
Page 27
Chapter 2
20
Synthetic bones (polyurethane foam), such as the commercially available Sawbones,
(Sawbones, Malmö, Sweden) is commonly used as a replacement for animal or
human bone for the biomechanical assessment of orthopaedic devices
(Agneskirchner et al. (2006); Roberts et al. (2007); Grover et al. (2011)). Synthetic
bone is available in several forms for biomechanical testing. Whole synthetic bones
are available for a range of long bone types. A synthetic humerus is shown in
Figure 2.8. Synthetic whole bones consist of a short fibre filled epoxy outer skin to
represent cortical bone. The inner volume of the synthetic bone is filled with solid
rigid polyurethane foam (PU) to represent cancellous bone. Individual test blocks of
synthetic cortical or cancellous bone area also available for the various grades listed
in Table 2.4.
Figure 2.8 Whole bone synthetic humerus used in the experimental testing of Chapter 4; (A)
Side view of synthetic humerus, (B) Section cut of synthetic humerus showing the short
fibre filled epoxy skin representing the cortical shell and the inner solid rigid polyurethane
foam representing cancellous bone.
Synthetic bone offers a consistent test material for device evaluation studies
eliminating the inter specimen variability associated with animal or cadaveric bone
(20-200 times lower inter specimen variability observed for synthetic bone versus
cadaveric specimens Cristofolini et al. (1996)). Samples are easy to prepare, readily
available and easy to handle. The use of synthetic bone has been validated as a test
material for human bone. (Cristofolini et al. (1996); Cristofolini and Viceconti
(2000)). However one clear disadvantage of synthetic bone is that the materials used
(A) (B)
Short Fibre filled
epoxy
representing
cortical shell
Solid Rigid PU
foam representing
cancellous bone
Page 28
Chapter 2
21
are homogeneous and isotropic. Natural bone, on the other hand, is highly
anisotropic, due to spatial variations in density and a highly aligned microstructure.
Hence, while synthetic bone may offer similar elastic properties to natural bone, their
reliability as a model of inelastic behaviour and fracture of bone is questionable. In
the current thesis it will be shown that the aligned microstructure of natural bone
results in complex fracture properties. The range of mechanical properties reported
for synthetic Sawbone representations of cortical bone and varying densities of
cancellous bone are summarised in Table 2.4.
Table 2.4 Sawbone compressive properties (PacificResearchLaboratories (2012))
Material Modulus Strength
(MPa)
Short Fibre Reinforced Epoxy (Cortical Shell) 16.7 GPa 157
Solid Rigid Foam (Cancellous Bone) 16–1148 MPa 0.6 - 48
Cellular Rigid Foam (Cancellous Bone) 12.4–137 MPa 1.4 – 5.4
Open Cell Rigid Foam (Cancellous Bone) 6.2–270 MPa 0.11 – 3.2
2.2 The Shoulder: Anatomy, Fracture and Repair
The bony anatomy of the shoulder joint is introduced in this section. Fracture
classification of the humerus is introduced and the fixation options currently
available are outlined highlighting previously reported clinical outcomes.
2.2.1 The Glenohumeral Shoulder Joint
The shoulder is a complex joint constructed by a network of muscles, tendons and
ligaments. The shoulder facilitates the largest range of motion of any joint in the
body. A healthy fully functional shoulder is held in a state of equilibrium by three
joints;
1. The Glenohumeral joint
2. The Acromioclavicular joint
3. The Sternoclavicular joint
Page 29
Chapter 2
22
Figure 2.9 Shoulder joint bony anatomy. Image obtained from Agur and Dalley (2008)
The work presented on the shoulder in this thesis is focused on the humerus bone
and the loading at the glenohumeral joint. The main bones of the shoulder are the
humerus and the scapula which create the glenohumeral joint (Figure 2.9). The
proximal humerus has three ossification centres; one for the head of the humerus,
one for the greater tuberosity and one for the lesser tuberosity. The humeral head is a
bony structure and its curvature is one third of a sphere. The scapula more
commonly referred to as the shoulder blade is a thin sheet of bone with variable
thickness across the surface. The bone serves as an attachment site for various
Content Removed Due to Copyright
Page 30
Chapter 2
23
muscles as well as the glenoid. The humeral head sits into the glenoid, a shallow
concave curved groove of the scapula cushioned by a layer of articular cartilage
(Figure 2.10). The curved mating of the humerus and the glenoid facilitates a large
range of motion. However the humeral head is much larger than the glenoid,
stability of the joint is maintained by tissue surrounding the glenoid cavity (labrum),
muscle and ligaments. Thus the potential for instability can be easily understood.
Figure 2.10 Lateral view of shoulder joint (scapula) highlighting glenoid cavity. Image
obtained from Agur and Dalley (2008)
2.2.2 Proximal Humeral Fractures
Proximal humeral fractures are the second most common fracture to the upper
extremity after the wrist (Johnell and Kanis (2006); Kettler et al. (2006)). This type
of fracture can occur as a result of falling on an outstretched limb or as a result of a
high energy impact. Women are also subject to higher incidence of the injury due to
greater bone mass loss over the course of their lifetime (Johnell and Kanis (2006).
The Neer classification chart is used to summarise the main types of proximal
humeral fractures that occur. The classification chart is shown in Figure 2.11. The
Content Removed Due to
Copyright
Page 31
Chapter 2
24
fracture can be classified as a 2, 3 or 4 part fracture with different anatomical sites
forming the third and fourth fragments. The fracture type focussed on in this thesis
(Chapter 4) is a three part fracture of the proximal humerus with the greater
tuberosity forming the third fragment.
Figure 2.11 Neer Classification of proximal humeral fractures; (A) Complete Neer
classification chart, (B) Three part fracture with greater tuberosity forming third fragment
(this fracture type is the focus of Chapter 4 of this thesis). Image obtained from
http://faculty.washington.edu/alexbert/MEDEX/Winter/ch263fg10.jpg
Several methods of fixation exist for proximal humeral fractures; these include both
internal and external fixation as well as the option of open or closed reduction.
Clinical and experimental studies have been conducted on many of the orthopaedic
devices to examine their performance and success rate in patients.
Fracture management includes:
• Non-operative treatment,
• Percutaneous fixation,
• Open reduction internal fixation (ORIF) using various devices
• Humeral head replacement
Content Removed Due to Copyright
Page 32
Chapter 2
25
2.2.3 Non Operative
Treatment of non displaced fractures involves a combination of protection and
gradual mobilization. This would involve placing the arm in a sling and beginning
physiotherapy as soon as possible (Koval et al. (1997)). Elderly patients with
reduced physical demands are more likely to accept a stiff shoulder. Elderly patients
are also more likely to be poor rehabilitation candidates thus suited to non operative
treatment. This option is less appropriate for younger patients or those that wish to
return to a full range of motion.
2.2.4 Percutaneous Fixation (K-wires/Sutures)
Percutaneous fixation is a closed reduction option (Figure 2.12); it is a minimally
invasive procedure with minor scarring. This type of fixation has a reduced risk of
avascular necrosis. Hägg and Lundberg (1984) reported that the risk of avascular
necrosis is doubled when open reduction is selected. The risk is further increased
when plating is selected for fixation. Resch et al. (1997) reported good functional
outcome for percutaneous fixation of three and four part fractures where all patients
returned to work or continued their normal activities. These results were achieved in
younger patients with higher quality bone stock which may be the reason for the
success of this type of fixation. This study reported that for older patients with
osteoporosis the use of hemi prosthesis was advised. An experimental study by
Koval et al. (1996) reported that K-wire fixation was unable to provide a fixation as
strong as plate and screws or internal nails. Kwon et al. (2002) also reported a
significant reduction in stability when K-wire fixation was compared to plate
fixation.
2.2.5 Plate Fixation
Plate fixation is an open reduction internal fixation (Figure 2.13). Several types of
plates have been developed including a cloverleaf plate, angle blade plate and
locking plates. Rose et al. (2007) reported good functional outcomes for plate
fixation however 25% of the fractures failed to heal. Koval et al. (1996) reported that
T plate fixation offered the strongest fixation for 2 part fractures occurring at the
metaphysic region. Kwon et al. (2002) conducted a study that compared three
Page 33
Chapter 2
26
fixation methods where no significant difference was reported between the
stabilisation offered by the cloverleaf plate and the angular blade plate. High union
rates and good functional outcomes were achieved with a locking plate system
according to Muckter et al. (2001). However with these systems a high rate of screw
cut out was found into the glenoid fossa in patients with weaker osteoporotic bone,
this was shown by Owsley and Gorczyca (2008).
Figure 2.12 X-ray of percutaneous k-wire fixation. Image obtained from Kwon et al. (2002)
Figure 2.13 X-ray of plate fixation. Image obtained from Kwon et al. (2002)
Content Removed Due to Copyright
Content Removed Due to Copyright
Page 34
Chapter 2
27
2.2.6 Intramedullary Fixation
Several types of intramedullary devices have been developed and clinically
evaluated (Figure 2.14). The cannulated titanium Polarus nail was evaluated by
Koike et al. (2008) in 54 patients. 79% had satisfactory to excellent results. The
success of this device was attributed to its usage in patients with a high bone stock,
thus patients with severe osteoporosis may not be appropriate candidates for this
fixation. Cuny et al. (2008) reported use of a straight telegraph nail with locking
screws in 64 patients which achieved stabilisation and early mobilisation. However
several weaknesses were identified with this type of fixation. These include possible
rotator cuff damage due to insertion point as the nail transfixes the rotator cuff.
Screw penetration is a common problem which requires early removal of device. The
Bilboquet device was reviewed by Doursounian et al. (2000). It is a titanium internal
fixation that can be converted to a humeral head replacement if complications arise.
The device consists of two parts, a circular staple that is inserted into the humeral
head and placed on top of a stem following its insertion into the humeral shaft. The
study reported good results in 26 patients and proposed the Bilboquet as a viable
alternative to hemiarthroplasty.
Figure 2.14 (A) X-ray of telegraph nail, (B) Illustration of telegraph nail. Images A-B
obtained from Cuny et al. (2008). (C) X-ray of implanted Bilboquet device, (D) Image of
Bilboquet two components pre implantation. Images C-D obtained from Doursounian et al.
(2000)
Content Removed Due to Copyright
Page 35
Chapter 2
28
2.2.7 Hemiarthroplasty
Hemiarthroplasty is one option in cases where it is not possible to salvage the
humeral head (Figure 2.15). It offers good results for pain relief but there is a large
variation in success rate with functional outcome depending on surgical positioning.
A 15 year follow up by Sperling et al. (2004) revealed glenoid erosion in 72% of the
cases and loosening in 34% of the cases. Thus hemiarthroplasty is recommended for
older patients with low functional requirements.
Figure 2.15 (A) X-ray of patient with rheumatoid arthritis prior to procedure, (B) X-ray of
implant immediately after procedure, (C) X-ray of implant 20 years after procedure. Image
taken from Sperling et al. (2004)
2.3 Finite Element Modelling of the Humerus
Few finite element studies of the humerus/ shoulder joint are reported in the
literature. Finite element analysis has been somewhat underutilised for modelling of
intact, fractured and repaired humeri. Previous studies have simplified representation
of the distal humerus to a cylinder (Johnson (2007)). Studies that have modelled
more complex bone geometry have focused on 2 part neck fractures of the humerus.
This type of fracture has been modelled by Maldonado et al. (2003) considering a
locking plate fracture fixation. This study concluded that the maximum strains in the
humerus occurred at 90o arm abduction. The bone properties were assigned
according to apparent density extracted from DEXA scans. The loading applied to
the model represented 15 muscles of the shoulder as well as compression loading.
However, the fracture line was simply modelled as an area of very low modulus,
rather than modelling individual fragments. Therefore, contact and micro-motion
between fracture fragments was not correctly simulated. Detailed 3D modelling of
Content Removed Due to Copyright
Page 36
Chapter 2
29
the muscles of the shoulder joint reported by Webb et al. (2012) illustrated that the
complex interaction between neighbouring muscles, large attachment areas of
muscle to bone and complex muscle trajectories could not simply be represented by
point load representation of muscles as conducted by Maldonado et al. (2003).
A 3D finite element study by Buchler et al. (2004) investigated the benefits of
anatomical reconstruction of the humeral head for shoulder arthroplasty. This study
highlighted the importance of replicating the anatomical geometry of each patient in
order to ensure appropriate load transfer between the humerus and the glenoid. This
would prevent altered stress distribution within the glenoid post operatively. This
conclusion provides support for fracture fixation surgeries that salvage the fracture
fragments of the humerus, as investigated in this thesis.
Clavert et al. (2006) developed a 3D model of an intact humerus including the
muscles of the rotator cuff to identify the pathology of fractures of the proximal
humerus. Simulations were conducted using the finite element solver NASTRAN.
This study reported that peak stresses occurred in the cortical bone at 90o arm
abduction.
2.4 Orthopaedic Screws
A large number of experimental test studies have been reported for pedicle screw
pullout for spinal applications (Kincaid et al. (2007); Tan et al. (2007); Wen-Chi et
al. (2009); Erkan et al. (2010)). Chapman et al. (1996) conducted an experimental
study of screw pullout for twelve different orthopaedic screws (Figure 2.16). Both
cannulated and non-cannulated screws were included with varying diameters and
pitch. The testing was conducted on polyurethane foam to ensure consistent
properties between test specimens. This study reported high correlation between the
pullout strength of bone screws and machine screws. The following factors govern
screw pullout:
• Major diameter of the screw
• Length of engagement of the thread
• Shear strength of the material the screw is inserted into
• Thread shape factor (pitch and thread depth parameters)
Page 37
Chapter 2
30
The major diameter of the screw and thread shape are factors that can be altered by
designers to increase the contact area between the screws and the material in which it
is embedded, hence increasing pullout strength. Length of engagement and shear
strength of the material in which the screw is embedded are limiting factors for
designers depending on the anatomical location. Chapman et al. (1996) was
supported by the study of Gausepohl et al. (2001) which compared maximum
holding power of fine versus coarse screw threads in both polyurethane foam and
bovine bone (Figure 2.17). Due to the fact that orthopaedic implants are usually
implanted into osteoporotic bone the question of tapping a hole prior to screw
insertion is a concern. A pre-tapped hole will ensure correct screw placement but
leads to a higher percentage of bone removal than self tapping screws. Self tapping
screws will compact the bone around the threads as it is inserted thus increasing the
pullout strength (Chapman et al. (1996)). Battula et al. (2006) compared the holding
power of self tapping screws in both normal and osteoporotic bone in an attempt to
identify the necessary depth at which screws must be inserted to achieve maximum
pullout strength. This study reported that in normal bone the screw tip should
protrude 1 mm beyond the far cortex and this should be increased to 2 mm for
osteoporotic bone (referred to as a bicortical fixation). Screws protruding from the
cortical bone of the humerus are possible in the distal region. However, screws
protruding through the humeral head would damage the glenoid and labrum which
would lead to further shoulder complications.
Page 38
Chapter 2
31
Figure 2.16 Screw design features and thread types reported by Chapman et al. (1996)
Shuib et al. (2007) conducted a finite element study of three simple thread
geometries to evaluate the most biocompatible. Rectangular, triangular and
trapezoidal thread types were compared. Plastic deformation was not included in the
model and conclusions of the study simply reported that square threads were the
most biocompatible, as there was an equal distribution of stress between the screw
and bone thus preventing stress shielding. Stress shielding has been identified as one
cause of screw loosening over time (Gefen (2002)).
Content Removed Due to Copyright
Page 39
Chapter 2
32
Figure 2.17 Course and fine thread screw designs investigated by Gausepohl et al. (2001)
A double threaded pedicle screw design was previously investigated by Mummaneni
et al. (2002). An image of the double threaded design investigated compared a
standard single thread is provide in Figure 2.18. An experimental investigation of the
pullout strength of these designs found that the second smaller inner thread did not
lead to an increase in either higher bone purchase or higher pullout strengths.
However, it was noted that the insertion torque was 14.5% higher for the single
threaded screw.
Figure 2.18 (A) Single and double thread design investigated by Mummaneni et al. (2002),
(B) Comparison of pullout forces recorded for single and double screw designs
Content Removed Due to Copyright
Content Removed Due to Copyright
Page 40
Chapter 2
33
Alternative screw designs have been suggested by Goldhahn et al. (2005). These
designs include more rounded edges and increasing the surface area of the implant in
contact with the surrounding bone (Figure 2.19). Alternative methods of insertion
were also investigated based on pneumatic / ultrasound vibrations. Finite element
analysis of these new geometries revealed reduced stress on the surrounding bone.
These are preliminary designs and no clinical data currently exists to validate their
performance.
Figure 2.19 Alternate screw designs proposed by Goldhahn et al. (2005) offering reduced
stress concentrations in bone. Image obtained from Goldhahn et al. (2005)
Orthopaedic screws are used as the primary mode of fixation for applications such as
fracture plates (Kwon et al. (2002)), intramedullary rods (Cuny et al. (2008)), spinal
devices (GainesJr (2000)) and suture anchors (Barber et al. (2008)). The ability of
devices to perform as designed is dictated by pullout strength of the screws
anchoring them. Pullout is a commonly reported clinical problem (Owsley and
Gorczyca (2008)). The failure mechanisms leading to pullout have not previously
been uncovered.
2.5 Biomaterials
The devices investigated in Chapter 4 are manufactured from titanium and stainless
steel. Stainless steel was first implemented for a hip prosthesis in the late 1950s
(Charnley (1960)). Stainless steel offers good corrosion resistance, however it has
poor wear properties Navarro et al. (2008). Titanium is less stiff than stainless steel
Content Removed Due to Copyright
Page 41
Chapter 2
34
with good corrosion resistance. Additionally, as reported by Brånemark et al. (1964)
the porous microstructure of titanium facilitates bone ingrowth over time referred to
as osteointegration. This ensures that the implant is held in position and maintains
stability. Both stainless steel and titanium are significantly stiffer than cortical bone
as shown in the graph of Figure 2.20 Other metals, such as cobalt chromium,
tantalum and nitinol, are used to manufacture orthopaedic devices; however these
materials were not investigated in the work presented in this thesis.
Given that 70% of proximal humeral fractures occur in patients over 60 years of age
(Kettler et al. (2006)) the injury can be complicated by osteoporosis. Bone voids,
resulting from osteoporosis, mean poor results for proximal humerus fractures. In
cases where the reconstruction of the fracture fragments is not possible, a void filling
bone graft may be used. Problems associated with bone grafts include limited
availability and high cost. One option proposed to improve the performance of
fracture fixation devices is to fill these bone voids with bone graft substitutes such as
calcium phosphate cement. Histological studies of calcium phosphate showed that it
is osteoconductive (Frankenburg et al. (1998)). An experimental study by Kwon et
al. (2002) reported lower relative motion between fracture fragments when bone
voids were filled with cement (reinforced fixation). A clinical study of cement
reinforced fixation found that it lowered the prevalence of pain at the fracture site
compared to an unfilled bone void (unreinforced fixation) (Kwon et al. (2002);
Bajammal et al. (2008)).
Figure 2.20 Elastic modulus of CF PEEK compared to the properties of bone, titanium and
stainless steel.
Page 42
Chapter 2
35
Carbon fibre (CF) reinforced composites have been suggested as alternatives to
metallic implants for several biomedical applications (Fujihara et al. (2004); Kurtz
and Devine (2007); Kharazi et al. (2010)). CF reinforced composites can be tailored
to have a significantly lower stiffness than metallic devices close to that of cortical
bone. A summary of elastic modulus of carbon fibre peek is shown in Figure 2.20.
Ponnappan et al. (2009) compared a carbon fibre reinforced polymer
(polyetheretherketone (PEEK)) rod system to titanium for spinal applications. It was
reported that PEEK provided a more flexible stabilisation, as well as offering the
advantage of reduced stress at the bone screw interface. A summary of the ultimate
strengths of unreinforced and reinforced PEEK is provided in Table 2.5. The fatigue
properties of CFPEEK are also a concern as implanted devices will undergo millions
of cycles of loading. Steinberg et al. (2013) demonstrated that the fatigue
performance of CFPEEK proximal humeral plates satisfied ASTM standards for
implanted devices.
Table 2.5 Unreinforced and reinforced PEEK mechanical properties (Kurtz and Devine
(2007))
Unreinforced
PEEK
30%
Short CF
reinforced
PEEK
68%
Continuous CF
reinforced
PEEK
Flexural Modulus (GPa) 4 20 135
Tensile Strength (MPa) 93 170 >2000
Tensile Elongation (%) 30 - 40 1 - 2 1
Additonally, carbon fibre reinforced materials such as CFPEEK are radiolucent
(Kurtz and Devine (2007)). This means fracture lines are easier to visualise with x-
rays as there is no visible plate on the x-ray. CFPEEK devices are also MRI
compatible as the artefact generated by metallic components makes interpretation of
the MRI scan difficult 65 (Ponnappan et al. (2009)). CFPEEK materials also prevent
cold weather intolerance in patients, which has been reported for metallic devices
(Kitsis et al. (2003)).
Page 43
Chapter 2
36
2.6 References
Agneskirchner, J., Freiling, D., Hurschler, C. and Lobenhoffer, P., 2006. Primary
stability of four different implants for opening wedge high tibial osteotomy.
Knee Surgery, Sports Traumatology, Arthroscopy 14, 291-300.
Agur, A. M. R. and Dalley, A. F., 2008. Grant's Atlas of Anatomy, Lippincott
Williams & Wilkins.
An, Y., Kang, Q. and Friedman, R., 1996. Mechanical symmetry of rabbit bones
studied by bending and indentation testing. American journal of veterinary
research 57, 1786-1789.
An, Y. H. and Draughn, R. A., 1999. Mechanical Testing of Bone and the Bone-
Implant Interface, Taylor & Francis.
Ascenzi, A., Baschieri, P. and Benvenuti, A., 1990. The bending properties of single
osteons. Journal of Biomechanics 23, 763-771.
Ascenzi, A. and Bonucci, E., 1968. The compressive properties of single osteons.
The Anatomical Record 161, 377-391.
Ayers, R., Miller, M., Simske, S. and Norrdin, R., 1996. Correlation of flexural
structural properties with bone physical properties: a four species survey.
Biomedical sciences instrumentation 32, 251.
Bajammal, S. S., Zlowodzki, M., Lelwica, A., Tornetta, P., Einhorn, T. A. and
Buckley, R., 2008. The use of calcium phosphate bone cement in fracture
treatment. J Bone Joint Surg Am 90, 1186-1196.
Barber, F. A., Herbert, M. A., Beavis, R. C. and Barrera Oro, F., 2008. Suture
Anchor Materials, Eyelets, and Designs: Update 2008. Arthroscopy: The
Journal of Arthroscopic & Related Surgery 24, 859-867.
Battula, S., Schoenfeld, A., Vrabec, G. and Njus, G. O., 2006. Experimental
evaluation of the holding power/stiffness of the self-tapping bone screws in
normal and osteoporotic bone material. Clinical Biomechanics 21, 533-537.
Bayraktar, H. H., Morgan, E. F., Niebur, G. L., Morris, G. E., Wong, E. K. and
Keaveny, T. M., 2004. Comparison of the elastic and yield properties of
human femoral trabecular and cortical bone tissue. Journal of Biomechanics
37, 27-35.
Brånemark, P., Breine, U., Johansson, B., Roylance, P., Röckert, H. and Yoffey, J.,
1964. Regeneration of bone marrow. Cells Tissues Organs 59, 1-46.
Buchler, P., Farron, A., 2004. Benefits of an anatomical reconstruction of the
humeral head during shoulder arthroplasty: a finite element analysis. Clinical
Biomechanics 19, 16-23.
Budyn, É. and Hoc, T., 2010. Analysis of micro fracture in human Haversian cortical
bone under transverse tension using extended physical imaging. International
Journal for Numerical Methods in Engineering 82, 940-965.
Burstein, A. H., Reilly, D. T. and Martens, M., 1976. Aging of bone tissue:
Mechanical properties. J Bone Joint Surg Am 58, 82.
Chapman, J. R., Harrington, R. M., Lee, K. M., Anderson, P. A., Tencer, A. F. and
Kowalski, D., 1996. Factors Affecting the Pullout Strength of Cancellous
Bone Screws. Journal of Biomechanical Engineering 118, 391-398.
Charnley, J., 1960. Anchorage of the femoral head prosthesis to the shaft of the
femur. Journal of Bone and Joint Surgery-British Volume 42, 28.
Choi, K., Kuhn, J. L., Ciarelli, M. J. and Goldstein, S. A., 1990. The elastic moduli
of human subchondral, trabecular, and cortical bone tissue and the size-
Page 44
Chapter 2
37
dependency of cortical bone modulus. Journal of Biomechanics 23, 1103-
1113.
Clavert, P., Zerah, M., Krier, J., Mille, P., Kempf, J. and Kahn, J., 2006. Finite
element analysis of the strain distribution in the humeral head tubercles
during abduction: comparison of young and osteoporotic bone. Surg Radiol
Anat 28, 581-587.
Cristofolini, L. and Viceconti, M., 2000. Mechanical validation of whole bone
composite tibia models. Journal of Biomechanics 33, 279-288.
Cristofolini, L., Viceconti, M., Cappello, A. and Toni, A., 1996. Mechanical
validation of whole bone composite femur models. Journal of Biomechanics
29, 525-535.
Cuny, C., Scarlat, M. M., Irrazi, M., Beau, P., Wenger, V., Ionescu, N. and Berrichi,
A., 2008. The Telegraph nail for proximal humeral fractures: A prospective
four-year study. J Shoulder Elbow Surg 17, 539-545.
Currey, J., 1998. Mechanical properties of vertebrate hard tissues. Proceedings of the
Institution of Mechanical Engineers, Part H: Journal of Engineering in
Medicine 212, 399-411.
Currey, J. D., 1988. The effect of porosity and mineral content on the Young's
modulus of elasticity of compact bone. Journal of Biomechanics 21, 131-139.
Currey, J. D., 2002. Bones Structure and Mechanics, Princeton University Press.
Dickenson, R. P., Hutton, W. C. and Stott, J. R., 1981. The mechanical properties of
bone in osteoporosis. Journal of Bone and Joint Surgery-British Volume 63,
233-38.
Doursounian, L., Grimberg, J., Cazeau, C., Jos, E. and Touzard, R., 2000. A new
internal fixation technique for fractures of the proximal humerus-the
Bilboquet device: A report on 26 cases. J Shoulder Elbow Surg 9, 279-288.
Drucker, D. and Prager, W., 1952. Soil Mechanics and Plastic Analysis or Limit
Design. Quarterly of applied mathematics 10, 157.
Erkan, S., Hsu, B., Wu, C., Mehbod, A., Perl, J. and Transfeldt, E., 2010. Alignment
of pedicle screws with pilot holes: can tapping improve screw trajectory in
thoracic spines? European Spine Journal 19, 71-77.
Feng, Z., Rho, J., Han, S. and Ziv, I., 2000. Orientation and loading condition
dependence of fracture toughness in cortical bone. Materials Science and
Engineering: C 11, 41-46.
Frankenburg, E. P., Goldstein, S. A., Bauer, T. W., Harris, S. A. and Poser, R. D.,
1998. Biomechanical and histological evaluation of a calcium phosphate
cement. J Bone Joint Surg Am 80, 1112-1124.
Fujihara, K., Huang, Z. M., Ramakrishna, S., Satknanantham, K. and Hamada, H.,
2004. Feasibility of knitted carbon/PEEK composites for orthopedic bone
plates. Biomaterials 25, 3877-3885.
GainesJr, R. W., 2000. The Use of Pedicle-Screw Internal Fixation for the Operative
Treatment of Spinal Disorders. The Journal of Bone and Joint Surgery
(American) 82, 1458-1458.
Gausepohl, T., Möhring, R., Pennig, D. and Koebke, J., 2001. Fine thread versus
coarse thread: A comparison of the maximum holding power. Injury 32,
Supplement 4, 1-7.
Gefen, A., 2002. Computational simulations of stress shielding and bone resorption
around existing and computer-designed orthopaedic screws. Medical and
Biological Engineering and Computing 40, 311-322.
Page 45
Chapter 2
38
Goldhahn, J., Seebeck, J., Frei, R., Frenz, B., Antoniadis, I. and Schneider, E., 2005.
New implant designs for fracture fixation in osteoporotic bone. Osteoporosis
International 16, S112-S119.
Grover, P., Albert, C., Wang, M. and Harris, G. F., 2011. Mechanical
characterization of fourth generation composite humerus. Proceedings of the
Institution of Mechanical Engineers, Part H: Journal of Engineering in
Medicine 225, 1169-1176.
Hägg, O. and Lundberg, B., 1984. Aspects of prognostic factors in comminuted and
dislocated proximal humeral fractures. Surgery of the shoulder. Philadelphia:
BC Decker, 51-59.
Johnell, O. and Kanis, J., 2006. An estimate of the worldwide prevalence and
disability associated with osteoporotic fractures. Osteoporosis International
17, 1726-1733.
Johnson, A. J., 2007. Humeral Fracture Fixation Techniques: A FEA Comparison of
Locking and Compression Techniques with Cadaveric Pullout Comparison of
Cortical Compression and Internal Locking Screws, University of Maryland,
College Park.
Keaveny, T. M., Pinilla, T. P., Crawford, R. P., Kopperdahl, D. L. and Lou, A.,
1997. Systematic and random errors in compression testing of trabecular
bone. Journal of Orthopaedic Research 15, 101-110.
Kettler, M., Biberthaler, P., Braunstein, V., Zeiler, C., Kroetz, M. and Mutschler, W.,
2006. Treatment of proximal humeral fractures with the PHILOS angular
stable plate. Presentation of 225 cases of dislocated fractures. Der
Unfallchirurg 109, 1032-40.
Kharazi, A. Z., Fathi, M. H. and Bahmany, F., 2010. Design of a textile composite
bone plate using 3D-finite element method. Materials & Design 31, 1468-
1474.
Kincaid, B., Schroder, L. and Mason, J., 2007. Measurement of Orthopedic Cortical
Bone Screw Insertion Performance in Cadaver Bone and Model Materials.
Experimental Mechanics 47, 595-607.
Kitsis, C. K., Marino, A. J., Krikler, S. J. and Birch, R., 2003. Late complications
following clavicular fractures and their operative management. Injury 34, 69-
74.
Ko, R., 1953. The tension test upon the compact substance of the long bones of
human extremities. J Kyoto Pref Med Univ 53, 503.
Koike, Y., Komatsuda, T. and Sato, K., 2008. Internal fixation of proximal humeral
fractures with a Polarus humeral nail. J Orthopaed Traumatol 9, 135-139.
Koval, K. J., Blair, B., Takei, R., Kummer, F. J. and Zuckerman, J. D., 1996.
Surgical neck fractures of the proximal humerus: a laboratory evaluation of
ten fixation techniques. J Trauma 40, 778-83.
Koval, K. J., Gallagher, M. A., Marsicano, J. G., Cuomo, F., McShinawy, A. and
Zuckerman, J. D., 1997. Functional Outcome after Minimally Displaced
Fractures of the Proximal Part of the Humerus*. The Journal of Bone and
Joint Surgery (American) 79, 203-7.
Kuhn, J. L., Goldstein, S. A., Ciarelli, M. J. and Matthews, L. S., 1989. The
limitations of canine trabecular bone as a model for human: A biomechanical
study. Journal of Biomechanics 22, 95-107.
Kurtz, S. M. and Devine, J. N., 2007. PEEK biomaterials in trauma, orthopedic, and
spinal implants. Biomaterials 28, 4845-4869.
Page 46
Chapter 2
39
Kutz, M., 2003. Standard Handbook of Biomedical Engineering and Design,
McGraw-Hill. 8.1-8.23.
Kwon, B. K., Goertzen, D. J., O'Brien, P. J., Broekhuyse, H. M. and Oxland, T. R.,
2002. Biomechanical evaluation of proximal humeral fracture fixation
supplemented with calcium phosphate cement. J Bone Joint Surg Am 84,
951-61.
Liebschner, M. and Keller, T., 2005. Hydraulic Strengthening Affects the Stiffness
and Strength of Cortical Bone. Annals of Biomedical Engineering 33, 26-38.
Liebschner, M. A. K., 2004. Biomechanical considerations of animal models used in
tissue engineering of bone. Biomaterials 25, 1697-1714.
Linde, F., Hvid, I. and Pongsoipetch, B., 1989. Energy absorptive properties of
human trabecular bone specimens during axial compression. Journal of
Orthopaedic Research 7, 432-439.
Maldonado, Z. M., Seebeck, J., Heller, M. O. W., Brandt, D., Hepp, P., Lill, H. and
Duda, G. N., 2003. Straining of the intact and fractured proximal humerus
under physiological-like loading. J Biomech 36, 1865-1873.
Martens, M., Van Audekercke, R., Delport, P., De Meester, P. and Mulier, J. C.,
1983. The mechanical characteristics of cancellous bone at the upper femoral
region. Journal of Biomechanics 16, 971-983.
McNamara, L., 2011. Bone as a Material. Comprehensive Biomaterials, Elsevier.
169-186.
Mercer, C., He, M. Y., Wang, R. and Evans, A. G., 2006. Mechanisms governing the
inelastic deformation of cortical bone and application to trabecular bone.
Acta Biomaterialia 2, 59-68.
Morgan, E.F.,Keaveney, T.M., 2001. Dependence of yield strain of human trabecular
bone on anatomic site. Journal of Biomechanics 34, 569-577.
Muckter, H., Herzog, L., Becker, M., Vogel, W., Meeder, P. J. and Buchholz, J.,
2001. Angle- and rotation-stable internal fixation of proximal humerus
fractures with the humerus fixator plate. Early clinical experience with a
newly developed implant. Der Chirurg; Zeitschrift fur alle Gebiete der
operativen Medizen 72, 1327-35.
Mullins, L. P., Bruzzi, M. S. and McHugh, P. E., 2009. Calibration of a constitutive
model for the post-yield behaviour of cortical bone. Journal of the
Mechanical Behavior of Biomedical Materials 2, 460-470.
Mummaneni, P.V., Haddock, S.M., Liebschner, M.A.K., Keaveny, T.M., Rosenburg,
W.S., 2002. Journal of Spinal Disorders & Techniques 15, 64-68.
Nalla, R. K., Kinney, J. H. and Ritchie, R. O., 2003. Mechanistic fracture criteria for
the failure of human cortical bone. Nat Mater 2, 164-168.
Nalla, R. K., Kruzic, J. J. and Ritchie, R. O., 2004. On the origin of the toughness of
mineralized tissue: microcracking or crack bridging? Bone 34, 790-798.
Navarro, M., Michiardi, A., Castaño, O. and Planell, J. A., 2008. Biomaterials in
orthopaedics. Journal of The Royal Society Interface 5, 1137-1158.
Norman, T. L., Nivargikar, S. V. and Burr, D. B., 1996. Resistance to crack growth
in human cortical bone is greater in shear than in tension. Journal of
Biomechanics 29, 1023-1031.
Olvera, D., Zimmermann, E. A. and Ritchie, R. O., 2012. Mixed-mode toughness of
human cortical bone containing a longitudinal crack in far-field compression.
Bone 50, 331-336.
Page 47
Chapter 2
40
Owsley, K. C. and Gorczyca, J. T., 2008. Displacement/Screw Cutout After Open
Reduction and Locked Plate Fixation of Humeral Fractures. J Bone Joint
Surg Am 90, 233-240.
PacificResearchLaboratories. (2012). "Sawbones Biomechanical Test Materials".
Retrieved June 2012, 2012, from
http://www.sawbones.com/products/bio/default.aspx.
Ponnappan, R. K., Serhan, H., Zarda, B., Patel, R., Albert, T. and Vaccaro, A. R.,
2009. Biomechanical evaluation and comparison of polyetheretherketone rod
system to traditional titanium rod fixation. The Spine Journal 9, 263-267.
Reilly, D. T. and Burstein, A. H., 1974. The Mechanical Properties of Cortical Bone.
The Journal of Bone & Joint Surgery 56, 1001-1022.
Reilly, D. T. and Burstein, A. H., 1975. The elastic and ultimate properties of
compact bone tissue. Journal of Biomechanics 8, 393-396, IN9-IN11, 397-
405.
Resch, H., Povacz, P., Frohlich, R. and Wambacher, M., 1997. Percutaneous fixation
of three-and four-part fractures of the proximal humerus. J Bone Joint Surg
Br 79, 295-300.
Rho, J.-Y., Kuhn-Spearing, L. and Zioupos, P., 1998. Mechanical properties and the
hierarchical structure of bone. Medical Engineering & Physics 20, 92-
102.
Ritchie, R., Kinney, J., Kruzic, J. and Nalla, R., 2006. Cortical bone fracture. Wiley
Encyclopedia of Biomedical Engineering.
Roberts, J. W., Grindel, S. I., Rebholz, B. and Wang, M., 2007. Biomechanical
Evaluation of Locking Plate Radial Shaft Fixation: Unicortical Locking
Fixation Versus Mixed Bicortical and Unicortical Fixation in a Sawbone
Model. The Journal of Hand Surgery 32, 971-975.
Rose, P. S., Adams, C. R., Torchia, M. E., Jacofsky, D. J., Haidukewych, G. G. and
Steinmann, S. P., 2007. Locking plate fixation for proximal humeral
fractures: initial results with a new implant. J Shoulder Elbow Surg 16, 202-
207.
Schryver, H., 1978. Bending properties of cortical bone of the horse. American
journal of veterinary research 39, 25.
Shuib, S., Ridzwan, M., Mohamad Ibrahim, M. and Tan, C., 2007. Analysis of
Orthopedic Screws for Bone Fracture Fixations with Finite Element Method.
Journal of Applied Sciences 7, 1748-1754.
Simkin, A. and Robin, G., 1973. The mechanical testing of bone in bending. Journal
of Biomechanics 6, 31-39.
Sperling, J. W., Cofield, R. H. and Rowland, C. M., 2004. Minimum fifteen-year
follow-up of Neer hemiarthroplasty and total shoulder arthroplasty in patients
aged fifty years or younger. Journal of Shoulder and Elbow Surgery 13, 604-
613.
Steinberg, E.L., Rath, E., Shlaifer, A., Chechik, O., Maman, E., Salai, M., 2013.
Carbon fiber reinforced PEEK Optima—A composite material biomechanical
properties and wear/debris characteristics of CF-PEEK composites for
orthopedic trauma implants. Journal of the Mechanical Behavior of
Biomedical Materials 17, 221-228.
Tan, J. S., Bailey, C. S., Dvorak, M. F., Fisher, C. G., Cripton, P. A. and Oxland, T.
R., 2007. Cement augmentation of vertebral screws enhances the interface
strength between interbody device and vertebral body. Spine 32, 334.
Page 48
Chapter 2
41
Weatherholt, A. M., Fuchs, R. K. and Warden, S. J., 2012. Specialized Connective
Tissue: Bone, the Structural Framework of the Upper Extremity. Journal of
Hand Therapy 25, 123-132.
Webb, J.D., Blemker, S.S, Delp, S.L., 2012. 3D finite element models of shoulder
muscles for computing lines of actions and moment arms. Computer Methods
in Biomechanics and Biomedical Engineering. Article in Press.
Wen-Chi, T., Po-Quang, C., Tung-Wu, L., Shing-Sheng, W., Kao-Shang, S. and
Shang-Chih, L., 2009. Comparison and prediction of pullout strength of
conical and cylindrical pedicle screws within synthetic bone. BMC
Musculoskeletal Disorders 10.
Zimmermann, E. A., Launey, M. E., Barth, H. D. and Ritchie, R. O., 2009. Mixed-
mode fracture of human cortical bone. Biomaterials 30, 5877-5884.
Zimmermann, E. A., Launey, M. E. and Ritchie, R. O., 2010. The significance of
crack-resistance curves to the mixed-mode fracture toughness of human
cortical bone. Biomaterials 31, 5297-5305.
Zioupos, P. and Currey, J. D., 1998. Changes in the Stiffness, Strength, and
Toughness of Human Cortical Bone With Age. Bone 22, 57-66.
Page 49
Chapter 3
42
Chapter 3
Theory
3.1 Introduction
The theoretical basis of the computational work presented in Chapters four, six and
seven are outlined in the current chapter. The definitions and governing equations for
the material models are provided for elasticity and plasticity with a focus on the
extended Drucker Prager model. The computational modelling techniques for two
methods of fracture are also outlined, namely element deletion, and the extended
finite element method (XFEM). Both implicit and explicit finite element solution
schemes (Abaqus Standard and Abaqus Explicit) are utilised in this thesis. Both
schemes are outlined, highlighting the advantages and disadvantages of each solution
scheme. Notation used within this thesis is Table 3.1.
Table 3.1: Notation summary used in the present thesis
For example, the dot product of two components in 3D is written as follows:
The cross product of two vectors is written as follows:
Notation Type Example
A scalar value written in italics a
A vector written in bold or unbold inside square brackets a or [a]
A vector with a transpose aT
A second order tensor in bold a
A second order tensor with Transpose aT or [a]
T
(3.1)
(3.2)
Page 50
Chapter 3
43
3.2 Deformation (Measuring Stress and Strain)
In the computational simulations performed in this work, finite deformation
kinematics is assumed. The position vectors, X and x, define a material point in the
reference (or undeformed) and current (or deformed) configurations, respectively.
Essentially, when a body is subjected to a stress, a particle of that body may move
from an original position in space (X) to a new position in space (x). The path or
history of positions of a particle can be written relative to time as follows:
(3.3)
The displacement vector of the material point is given as
(3.4)
Consider two neighbouring particles, with initial positions located at positions and
. The deformation gradient tensor, , relates the difference in particle position
in the current configuration, to that reference configuration,
(3.5)
The deformation of materials is generally path dependent and so the constitutive
relationships are defined in terms of time (rate form). The velocity of a particle is
defined in equation 3.6. This defines the rate of change of the spatial position x as a
function of time for a specific material particle.
(3.6)
The velocity difference between two neighbouring particles is given in equation 3.7.
(3.7)
where, is referred to as the velocity gradient.
(3.8)
Relating this to the deformation gradient F in equation 3.9
Page 51
Chapter 3
44
(3.9)
Therefore the velocity difference ( ) between two neighbouring particles can be
obtained using equation 3.10.
(3.10)
The relative distance between the two particles ( ) remains the same throughout
the particle motion and therefore has no time derivative. Comparing the two
formulations for from equations 3.9 and 3.10 in terms of the relative distance
between particles ( ) (equation 3.11).
or (3.11)
The velocity gradient (L) consists of two components, a symmetric strain rate tensor
(D) and an anti-symmetric rotation or spin tensor (W). The velocity gradient is the
sum if these two (L=D+W).
(3.12)
(3.13)
The integration of D (equation 3.12) with respect to time, gives the logarithmic strain
tensor . Equation 3.14 can be used in the calculation of finite strain.
(3.14)
Stress calculated and reported in this thesis unless otherwise stated is the Cauchy
“true” stress (σ). It is defined as the force per unit area for the current level of
deformation of a body. It can be decomposed into two parts; the hydrostatic stress
which governs volume change of a body and deviatoric stress which governs shape
change of a body. These individual components will be discussed further for the
description of the Drucker Prager yield criterion. The stress tensor is symmetric
(σ = σT) and related to the traction (t) on an internal or external surface of the current
configuration of a body and a normal vector to the surface of that body (n).
Page 52
Chapter 3
45
(3.15)
The current stress state of a body can be defined as the sum of the mean normal ( )
and deviatoric (S) stress (equation 3.16).
(3.16)
where, the mean normal stress ( ) is a product of the mean hydrostatic pressure ( )
and the kronecker delta ( ). is equal to 1 if , and 0 if .
(3.17)
3.3 Elasto-Plasticity
Abaqus defines elasto-plastic deformation of a material as two components, an
elastic component ( ; consisting of recoverable deformation) and a plastic
component ( ; consisting of permanent deformation).
(3.18)
The total strain rate of the material is also considered as a combination of elastic and
plastic strain rates as shown in equation 3.19.
(3.19)
Integrating equation 3.19 with respect to time gives the corresponding elastic and
plastic strains (equation 3.20).
(3.20)
If considering a material as linear isotropic elastic then the elasticity can be written
in terms of two material constants; the bulk modulus (K) and the Shear Modulus (G).
These are calculated in terms of the Young’s modulus (E) and the Poisson’s ratio (ν).
Page 53
Chapter 3
46
(3.21)
(3.22)
Hooke’s law relates the current stress state of a body ( ) to the deformation strain ( )
of the stiffness of the body according to the elasticity tensor ( ).
(3.23)
In the case of isotropic elasticity the 36 components of can simply be defined in
terms of the two variables (Young’s modulus (E) and the Poisson’s ratio (ν)). In the
case of anisotropic elasticity the 36 components of can be defined in terms of 21
independent constants. An orthotropic material can be defined in terms of 9
independent components. This is further reduced to 5 components in the case of a
transversely isotropic material.
Plastic deformation/ yield of cortical bone in this thesis is defined using the linear
Drucker Prager plasticity model. This model was first introduced by Drucker and
Prager (1952). The adapted linear Drucker Prager model is used to model frictional
materials that have higher yield strength in compression than tension (Abaqus
(2009)). The model is isotropic. It predicts a non-circular yield surface in the
deviatoric plane in order to predict alternate yield strengths in tension and
compression. The yield surface is defined in terms of both the Von Mises equivalent
stress (q) and the equivalent pressure (p) (equation 3.17).
(3.24)
where, the Drucker Prager deviatoric stress measure t is defined in equation 3.25.
(3.25)
Page 54
Chapter 3
47
(3.26)
where, β is the slope of the linear yield surface in the p-t plane and is referred to as
the friction angle of the material (Figure 3.1). d is the cohesion of the material
(equation 3.27-3.29), is the third invariant of deviatoric stress. K is the flow stress
ratio between yield stress in triaxial tension and triaxial compression.
Figure 3.1: Linear yield surface for the Drucker-Prager plasticity formulation in the p-t
plane.
(3.27)
Or
(3.28)
Or
(3.29)
where the cohesion of the material can be defined in terms of uniaxial
compression( ), uniaxial tension( ) or the shear yield stress( ).
Plastic flow of the material is governed by the flow potential G.
(3.30)
Where, ψ is the dilation angle in the p-t plane. The previously calibrated Drucker
Prager parameters reported for bovine cortical bone were: K=1, β=43.5o, ψ=0 Mercer
et al. (2006). For ψ=0, no dilation occurs.
d
β
t
p
Yield Surface
Page 55
Chapter 3
48
3.4 Damage Modelling
3.4.1 Damage Modelling with Element Deletion
Crack initiation and propagation is simulated in Chapter 6 using the integrated
damage initiation and evolution criteria in Abaqus 6.9 Explicit. Damage is
characterised by material degradation beyond a defined yield stress, once the
material is fully degraded an option to remove the element from the mesh is
available to simulate crack propagation. The graph of Figure 3.2 summarises the
process of damage initiation and evolution for cortical bone. Once a defined critical
yield stress ( ) and equivalent plastic strain (
) are reached damage is initiated
( ). Further deformation beyond this point leads to a reduction in stiffness and
strength until the defined equivalent plastic strain at failure is reached, at this point
( ) the element is removed from the mesh.
Figure 3.2 Process of damage initiation and evolution for cortical bone to simulate crack
initiation and propagation during screw pullout.
The damage initiation criterion implemented in Chapter 6 is a shear based criterion.
Equivalent plastic strain at the onset of damage is a function of shear stress ratio and
plastic strain rate (
). Once the current equivalent plastic strain reaches the
Page 56
Chapter 3
49
defined critical value then the initiation criteria equals 1 ( ). At this point
damage has been initiated so the damage variable equals 0 ( ).
(3.31)
The definition of the softening response as damage evolves is based on the fracture
energy ( ). The fracture energy defined in terms of a stress displacement response
is based on Hillerborg et al. (1976). The equivalent plastic displacement ( ) is
defined in terms of an elements characteristic length ( ) and equivalent plastic strain
( ). The characteristic length L is determined based upon the average line across an
element for a first order element.
(3.32)
A linear damage evolution is defined in terms of the plastic displacement ( ) at
failure and the damage variable ( ). When reaches the critical defined
magnitude for plastic displacement at failure the damage variable reaches the value 1
( ) and the element is removed from the mesh.
Figure 3.3 Graph of linear relationship between damage variable ( ) and the plastic
displacement ( )
(3.33)
1
D
Page 57
Chapter 3
50
3.4.2 Damage Modelling with the Extended Finite Element Method (XFEM)
The extended finite element method (XFEM) implemented in Chapter 7 was
developed for computationally modelling crack initiation and propagation without
the need for adaptive remeshing (Melenk and Babuška (1996); Sukumar et al.
(2004); Song et al. (2006); Abaqus (2012)). In contrast to the element deletion
method, crack propagation using the XFEM method involves splitting elements
rather than removing them from them mesh. Additionally, unlike cohesive zone
modelling in which a crack path is predefined, XFEM can be used to predict crack
initiation and propagation along an arbitrary, solution dependent path. A process of
damage initiation and evolution are implemented to simulate fracture opening.
Discontinuous functions are added to the conventional finite element nodal functions
with additional degrees of freedom. XFEM can be used to model stationary or
moving cracks. The work presented in Chapter 7 of this thesis focuses on the
modelling of moving cracks. Damage initiation is predicted according to a defined
anisotropic failure criterion outlined in Chapter 7. Damage evolution is simulated
using the integrated energy based damage evolution in Abaqus 6.12 Standard.
The addition of nodal functions to the conventional finite element nodal
displacement vector is shown in equation 3.34. is the conventional nodal
shape function. is the standard nodal displacement vector associated with a node
without XFEM. is the product of the enriched degrees of freedom vector
and the associated discontinuous jump function across the crack surface
.
(3.34)
When modelling a moving crack using XFEM the assumption that a crack
propagates across an entire element at a time is made. A phantom node method in
conjunction with a fracture energy definition of bond strength between split elements
is used to model the propagation of cracks through the mesh. The principle of the
phantom node method is shown in Figure 3.4
Page 58
Chapter 3
51
Figure 3.4 (i) Cracked elements once damage is initiated, with phantom nodes in the same
location as real nodes; (ii) Crack opening occurs when strain energy dissipation reaches the
defined critical value. Phantom and real nodes displace independently of one another
Once damage is initiated the damage variable equals zero ( ). A cracked
element is shown in Figure 3.4(i). Crack propagation and crack opening is modelled
using a phantom node method. As shown in Figure 3.4(i), when a crack is initiated
in an element, phantom nodes (with additional degrees of freedom) are located at the
same location as the real nodes. A linear energy based damage evolution law was
defined for each of the failure criteria. The area under the graph of Figure 3.5 is the
fracture dissipation energy required to propagate the crack. When damage initiates,
the two surfaces of the cracked element are held together by equal and opposite
forces referred to as the traction strength ( )(Figure 3.5). The traction strength ( ) is
degraded linearly over the separation (δ) of the two surfaces. The traction strength
( ) of the split element surfaces is determined by the user defined fracture energy
required to propagate the crack ( ).
(3.35)
Feerick et al. (2013) JMBBM, Article In Press, http://dx.doi.org/10.1016/j.jmbbm.2012.12.004
Page 59
Chapter 3
52
Figure 3.5 Linear degradation of traction strength between crack surfaces, area under the
graph is the fracture energy required to propagate the crack ( )
When the fracture dissipation energy reaches the defined critical value then the split
element fragments are free to displace independently of one another. Crack opening
is shown in Figure 3.4(ii), with phantom nodes displacing away from real node
locations. Small sliding contact is implemented between newly exposed surfaces.
3.5 Abaqus Standard (Implicit) vs Explicit Modelling
Implicit modelling means that the current state of a body at is determined by
the information available at . In contrast with this explicit modelling means
that the current state of a body at is determined by the information available
at .
3.5.1 Implicit Modelling
Implicit modelling (i.e. Abaqus Standard) uses the implicit Hilber-Hughes-Taylor
operator for the integration of equations. A Newton-Raphson method is implemented
for Abaqus Standard simulations. The principle of virtual work is the fundamental
equation upon which this method is based.
(3.36)
where is a reference volume, is the surface bounding the reference volume. is
the stress tensor and is the surface traction. is the virtual strain vector and is
Trac
tio
n (
T)
Crack Opening (δ)
Gfδmax
Tmax
Page 60
Chapter 3
53
the virtual displacement vector. Integration of equation 3.36 over a finite element
mesh containing multiple elements with Volume ( ) and Surface ( ) is the sum of
the integrands of each element. The virtual strain and displacement within each
element are defined in equations (3.37 and 3.38)
(3.37)
(3.38)
where, and are the element shape gradient and shape function matrices
respectively. Therefore substituting equations 3.37 & 3.38 into equation 3.36 and
integrating over a mesh of “e” number of elements give equation 3.39.
(3.39)
is the elemental vector of nodal displacements. As equation 3.39 involves the
summing of individual element quantities, the individual virtual components
( ) become redundant and are replaced with global components giving
equation 3.40.
(3.40)
where, is the global nodal displacement vector for the mesh (containing “e”
number of elements). The out of balance/residual forces vector ( ) can be written in
terms of the global nodal displacement vector as shown in equation 3.41.
(3.41)
Implicit solving involves incremental methods, where loads/displacements are
applied in time steps ( ) up to a defined ultimate time ( ). Each increment of an
analysis is solved and updated iteratively using the Newton Raphson Method from
time to time to solve for until is reached. Defining equation 3.41
for the ith
iteration gives equation 3.42.
(3.42)
Page 61
Chapter 3
54
where, is the vector of nodal displacements for the ith
iteration at time .
The term on the right hand side is referred to as the Jacobian matrix or can be
referred to as the global stiffness matrix ( ).
(3.43)
Equation 3.43 must be solved, for each iteration, for the change in incremental
displacements ( ). In order to solve for the global stiffness matrix ( )
must be inverted. Therefore this leads to a significant computational expense
compared to explicit solution method outlined in 3.4.2, but generates an accurate
solution. The accuracy of the method also depends on the accurate calculation of
, which in turn depends on the accurate calculation of
. The
accuracy of the solution is also dictated by the convergence criterion where the
updated value for must be less than a tolerance value. Complications can arise
when using Abaqus Standard if:
simulations involve a highly non linear stress-strain response
simulating large deformation problems
simulating damage and fracture of materials
simulating contact and sliding between surfaces
One alternative available within Abaqus is the explicit solution method, described in
the following section.
3.5.2 Explicit Modelling
Abaqus Explicit was developed for modelling dynamic problems, with large
deformation of bodies. Acceleration and velocity at a particular time point are
assumed constant for that time increment and are used to solve for next time point
rather than the iterative method outlined in section 3.5.1 of this chapter. Abaqus
explicit uses the central difference operator as outlined in equations 3.44 and 3.45.
(3.44)
Page 62
Chapter 3
55
(3.45)
where, is the displacement vector and superscripts identifying the current time
increment. In this case refers to the increment number rather than the iteration
number specified for implicit solving methods. As no iterations are involved in the
Explicit solving method, no convergence checks are made. Therefore this method
can be used to solve for simulations that failed to converge using the implicit solving
method.
The use of an explicit solution means that each new time increment is calculated by
assuming constant velocities and constant accelerations across half time
intervals (
). The accelerations are calculated at the start of an increment
according to equation 3.46.
(3.46)
where, is the vector of externally applied forces and is the lumped mass matrix.
(3.47)
where, is the vector of nodal forces and is the vector of internal element forces.
(3.48)
(3.49)
denotes the current density of the material. All other quantities are defined in terms
of the global expression of equation 3.40. The lumped mass matrix from equation
3.46 can be isolated to give , which is comparable to the linear
equation 3.43 of the implicit solving method. The lumped mass matrix ( ) is
diagonalised making matrix inversion a significantly lower computational expense,
compared to the inversion of the global stiffness matrix required by the implicit
solving method.
Page 63
Chapter 3
56
Updating the incremental changes of the components of equation 3.46 requires small
time increments to ensure an accurate solution. The stability limit determines the size
of the time increment.
(3.50)
where, is the maximum element eigenvalue. The stability limit is enforced
using equation 3.51.
(3.51)
where is the characteristic element length and is the dilatational wave speed.
(3.52)
where and are the Lamé constants and is the material density. A quasi-static
problem solved using the explicit solving method would require much smaller time
increments than the implicit solving method. Each increment of an explicit
simulation can be calculated at a low computational expense, however in some cases
it is quite likely that >100,000 increments are required to solve. As the stability limit
is based on the characteristic length of an element, it is important to maintain a
regular element size within the mesh and ensure that excessively small elements do
not reduce the increment size when using Abaqus Explicit.
The run time of an Abaqus Explicit simulation can be artificially reduced by
speeding up the applied deformation or scaling the density of the materials of the
model. Scaling of the density is the preferred method. Focussing on equations 3.51
and 3.52, when the density of the material is scaled by a factor, the incremental time
magnitude is increased by the square root of that factor (eg. increasing the density by
a factor of 4 would result in doubling the magnitude of ).
It has been shown that in order to prevent dynamic effects in the model the ratio
between kinetic energy and internal energy in the model should be kept below 5%
(Chung et al. (1998); Choi et al. (2002)).
Page 64
Chapter 3
57
3.6 References
Abaqus, 2009. Abaqus Users Manual 6.9, Dassault Systemes Simulia Corp.,
Providence
Abaqus, 2012. Abaqus Users Manual 6.12, Dassault Systemes Simulia Corp.,
Providence.
Choi, H. H., Hwang, S. M., Kang, Y. H., Kim, J. and Kang, B. S., 2002. Comparison
of Implicit and Explicit Finite-Element Methods for the Hydroforming
Process of an Automobile Lower Arm. The International Journal of
Advanced Manufacturing Technology 20, 407-413.
Chung, W. J., Cho, J. W. and Belytschko, T., 1998. On the dynamic effects of
explicit FEM in sheet metal forming analysis. Engineering Computations 15,
750-776.
Drucker, D. and Prager, W., 1952. Soil Mechanics and Plastic Analysis or Limit
Design. Quarterly of applied mathematics 10, 157.
Hillerborg, A., Modeer, M. and Petersson, P. E., 1976. Analysis of crack formation
and crack growth in concrete by means of fracture mechanics and finite
elements. Cement and concrete research 6, 773-781.
Melenk, J. M. and Babuška, I., 1996. The partition of unity finite element method:
Basic theory and applications. Computer Methods in Applied Mechanics and
Engineering 139, 289-314.
Mercer, C., He, M. Y., Wang, R. and Evans, A. G., 2006. Mechanisms governing the
inelastic deformation of cortical bone and application to trabecular bone.
Acta Biomaterialia 2, 59-68.
Song, J. H., Areias, P. and Belytschko, T., 2006. A method for dynamic crack and
shear band propagation with phantom nodes. International Journal for
Numerical Methods in Engineering 67, 868-893.
Sukumar, N., Huang, Z. Y., Prévost, J. H. and Suo, Z., 2004. Partition of unity
enrichment for bimaterial interface cracks. International Journal for
Numerical Methods in Engineering 59, 1075-1102.
Page 65
Chapter 4
58
Chapter 4
Investigation of metallic and carbon fibre PEEK fracture
fixation devices for three-part proximal humeral fractures
Abstract
An investigation of proximal humeral fracture fixation has been conducted. Four
devices were selected for the study; a locking plate, intramedullary nail (IM Nail),
K-wires and a Bilboquet device. A 3D model of a humerus was created using a
process of thresholding based on the grayscale values of a CT scan of an intact
humerus. An idealised three part fracture was created in addition to removing a
standard volume from the humeral head as a representation of bone voids that occur
as a result of the injury. All finite element simulations conducted represent 90o arm
abduction. Simulations were conducted to investigate the effect of filling this bone
void with calcium phosphate cement for each device. The effect of constructing
devices from carbon fibre polyetheretherketone (CFPEEK) was investigated.
Simulations of cement reinforced devices predict greater stability for each device.
The average unreinforced fracture line opening (FLO) is reduced by 48.5 % for
metallic devices, with a lesser effect on composite devices with FLO reduced by
23.6 %. Relative sliding (shear displacement) is also reduced between fracture
fragments by an average of 58.34 %. CFPEEK device simulations predict reduced
stresses at the device-bone interface.
4.1 Introduction
The shoulder joint allows multiplanar motion of the upper limb which is facilitated
by a complex interaction of joint geometry, muscle forces and ligament restraints.
Proximal humeral fractures can permanently disrupt this arrangement and lead to
pain and loss of function, particularly when the joint (articular) surface is involved in
the fracture pattern. Proximal humeral fractures are the third most frequent fracture
after hip and wrist fractures (Kettler et al. (2006)). Cancellous bone depletes with
age, thus the occurrence of proximal humerus fractures is highest particularly in the
elderly. However, proximal humeral fractures are not limited to the elderly and can
Page 66
Chapter 4
59
also occur in younger individuals as a result of falling on an outstretched limb or as a
result of a high energy impact. Displaced intra-articular fractures in physiologically
fit patients are candidates for reconstructive surgery.
Several types of proximal humeral fracture fixation devices have been developed and
implemented clinically. These include locking plates (Muckter et al. (2001); Kwon et
al. (2002); Rose et al. (2007); Owsley and Gorczyca (2008)), intramedullary nails
(Cuny et al. (2008); Koike et al. (2008)), the Bilboquet device (Doursounian et al.
(2000); Doursounian et al. (2011)) and percutaneous fixation using K-wires (Jaberg
et al. (1992); Resch et al. (1997)). Previous clinical studies for locking plates and
intramedullary fixation have reported screw pullout and push out as primary modes
of failure (Cuny et al. (2008); Owsley and Gorczyca (2008)). Previous experimental
studies reported that K-wires had higher relative motion between fracture fragments
than locking plates or an intramedullary rod (Koval et al. (1996); Kwon et al.
(2002)). The Bilboquet device is not commonly used for proximal humeral fracture
fixation compared to the other three methods of fixation; however it is proposed as
an alternative to Hemiarthroplasty (Doursounian et al. (2000)).
Given that 70% of proximal humeral fractures occur in patients over 60 years of age
(Kettler et al. (2006)), the injury can be complicated by osteoporosis. Bone voids,
resulting from osteoporosis, mean poor results for proximal humerus fractures. In
cases where the reconstruction of the fracture fragments is not possible, a void filling
bone graft may be used (Ring et al. (2001)). Problems associated with bone grafts
include limited availability and high cost. One option proposed to improve the
performance of fracture fixation devices is to fill these bone voids with bone graft
substitutes such as calcium phosphate cement (Faour et al. (2011)). Histological
studies of calcium phosphate showed that it is osteoconductive (Frankenburg et al.
(1998)). An experimental study by Kwon et al. (2002) reported lower relative motion
between fracture fragments when bone voids were filled with cement (reinforced
fixation). A clinical study of cement reinforced fixation found that it lowered the
prevalence of pain at the fracture site compared to an unfilled bone void
(unreinforced fixation) (Kwon et al. (2002); Bajammal et al. (2008)).
Page 67
Chapter 4
60
Previous studies have proposed carbon fibre (CF) reinforced composites as
alternatives to metallic implants for several biomedical applications (Fujihara et al.
(2004); Kurtz and Devine (2007); Kharazi et al. (2010)). CF reinforced composites
can be tailored to have a significantly lower modulus than metallic devices close to
that of cortical bone. A previous experimental study by Ponnappan et al. (2009)
compared a polyetheretherketone (PEEK) rod system to titanium for spinal
applications. It was reported that PEEK provided a more flexible stabilisation, as
well as offering the advantage of reduced stress at the bone screw interface. An
additional advantage of PEEK is the fact that it is radiolucent (Kurtz and Devine
(2007)). This means fracture lines are easier to visualise with x-rays as there is no
visible plate on the x-ray. PEEK devices are also MRI compatible as the artefact
generated by metallic components makes interpretation of the MRI scan difficult
(Ponnappan et al. (2009)). Some patients have developed cold weather intolerance as
a result of metal devices (Kitsis et al. (2003)); the use of PEEK would eliminate this
complication.
The objective of the present chapter is to computationally investigate the
performance of four methods of fixation; locking plate, intramedullary rod, K-wires
and the Bilboquet device. To date, no previous studies have compared the
performance of these four devices in terms of micro motion between fracture
fragments as well as stress distribution within the humeral head. The effect of
reinforcing each device with calcium phosphate cement was also investigated. The
effect of constructing devices from carbon fibre reinforced PEEK (CFPEEK) was
investigated and compared to metallic devices.
4.2 Materials & Methods
4.2.1 Experimental
Experimental tests were conducted using synthetic humeri (4th generation humerus
#3404, Sawbones, Malmö, Sweden). A three part fracture was recreated in a
synthetic humerus and a fracture repair was implemented using a locking plate
(Philos, AO, Davos, Switzerland), with screw configurations similar to those used in
our finite element models (Figure 4.1(B)). The experimental set up is shown in
Figure 4.2. Uniaxial strain gauges (CEA-06-240UZ-120, Micro-Measurements,
Page 68
Chapter 4
61
North Carolina, USA) were then applied to the shaft (S2) and humeral head (S1) of
the repaired humerus and mechanical testing was performed. An intact
(Figure 4.2(A)) synthetic humerus was also tested following identical strain gauge
placement. Both humeri were orientated 63.33o to the vertical axis to represent 90
o
arm abduction (Poppen and Walker (1978)). The test was conducted using an Instron
universal testing system (Model 3364, Instron, UK) with a 30 kN load cell. An
LVDT was used to record the displacement of the crosshead of the Instron as shown
in Figure 4.2(A). A data acquisition system (NI cDAQ-9172, National Instruments,
Newbury, Berkshire, UK) was used to collect strain, load and displacement data at
the same time points. A load of up to 534 N was applied at a linear rate of 1
mm/min. The test procedure was repeated five times (n=5) for both the intact and
fracture repaired humerus. The strains recorded experimentally were compared to the
predicted computational strains in the same regions of the humerus. Two sample t
tests were conducted to establish the statistical significance of the results.
Figure 4.1 Experimental sample preparation; (A) intact humerus; (B) locking plate repaired
three part fractured humerus; (C) side view of intact and plate repaired three part fracture
highlighting fracture lines.
4.2.2 Computational:
A 3D geometry of an intact humerus was generated from the CT scan of a 78 year
old Caucasian male. Using thresholding and 3D geometry generating software (v3.2
Simpleware Ltd. Exeter, UK) the grayscale values of the images were used to create
cortical and cancellous bone volumes. The CT scans values were calibrated and
Page 69
Chapter 4
62
converted to Hounsfield units according to the equation HU=1000x(CT-CTw)/(CTw-
CTa) where CTw and CTa are the CT values of water and air respectively (Rho et al.
(1995)). A Hounsfield unit (HU) of zero represents water. A cortical bone volume
was isolated by selecting pixels with a HU ranging from 500-900 (Lim Fat et al.
(2012)). The cancellous bone volume was isolated as HU ranging from 80-499
within the humeral head (Yamada et al. (2007)). An idealised three part fracture was
generated. The fracture fragments were created based upon the Mueller AO
classification of proximal humeral fractures (Müller (1990)). The fracture fragments
created are highlighted in Figure 4.3. The three fragments are the greater tuberosity
(Figure 4.3A), articular and shaft fragments (Figure 4.3B). An ellipsoid shaped
volume was removed from the humeral head to represent a bone void. The 37.7%
volume of bone that remained was representative of the average percentage of bone
tissue lost within the humeral head with age for patients that reported shoulder joint
complications (Yamada et al. (2007)). Additionally, for simulations of cement
reinforced fixation, this void was then filled with a homogeneous volume that was
assigned the properties of commercially available calcium phosphate cement. 3D
models of the four fracture fixation devices were generated and positioned in the
assembled model according to anatomical location.
Figure 4.2 Experimental set up for 90
o arm abduction loading; (A) intact humerus and (B)
locking plate repaired three part fractured humerus.
Feerick et al. (2012) J Med Eng & Phys, Article In Press,
http://dx.doi.org/10.1016/j.medengphy.2012.07.016
Page 70
Chapter 4
63
The four methods of fixation are shown in Figure 4.3. The locking plate is an
external fixate with screws passing through the lateral cortex and anchored in the
opposite cortical wall (Figure 4.3(A)). In this model, nine screws were modelled
with two distal screws and seven screws anchored in the proximal humeral head. The
void volume, highlighted in Figure 4.3(A-D), indicates the location of the cement for
a reinforced fixation. The intramedullary nail is an internal fixate inserted into the
intramedullary canal and locked both proximally (four screws) and distally (two
screws) (Figure 4.3(B)). K-wires are stainless steel, terminally threaded wires that
are pierced through the lateral cortex and anchored in the opposite cortical wall. A
configuration using five K-wires was considered, based on the images reported by
Jaberg et al. (1992). As shown in Figure 4.3(C), two K-wires were inserted through
the greater tuberosity fragment and anchored in the humeral shaft cortex. The
remaining three were inserted through the lateral distal shaft and inserted in the
opposite articular fragment cortex. The Bilboquet device is an internal fixate
consisting of two components: firstly, the stem, which is anchored with cement in
the shaft of the humerus, and secondly, a spigot which is a pronged plate anchored in
the humeral head (Figure 4.3(D)). A model of an intact humerus was also generated
to provide a benchmark for comparison of stress fields generated by each of the
fixation devices.
Page 71
Chapter 4
64
Figure 4.3: 3D computational models four methods of fixation. The three fracture fragments
are highlighted in different colours; the greater tuberosity (blue), the articular fragment
(purple) and the shaft (green). (A) Locking plate fixation, (B) IM rod fixation, (C) 5 K-wire
fixation, (D) Bilboquet fixation.
Feerick et al.
(2012) J Med
Eng & Phys,
Article In
Press,
http://dx.doi.o
rg/10.1016/j.m
edengphy.201
2.07.016
Page 72
Chapter 4
65
The mesh generated for each fixation method contained, on average, 750,000
elements (20% hex C3D8 elements and 80% tet C3D4 elements). Due to the
complex curvature of the humerus, the mesh consists of both tet and hex elements.
All computational simulations were conducted using the finite element solver
software Abaqus 6.9 standard (Simulia, Providence, RI, USA). Figure 4.4 illustrates
the boundary conditions placed on the model for each of the simulations. The base of
the shaft of the humerus was fixed in position. The load applied to the humerus
model was selected based upon the experimental data reported by Poppen and
Walker (1978), which stated that a compressive peak load of 80% body weight
exerted at the humeral head occurs at 90o
abduction. A previous 3D computational
study of a shoulder joint also reported peak stresses occurred at 90o arm abduction
Clavert et al. (2006). A pressure load of 0.755 MPa was applied over a circular area
of Ø30 mm (representing 534 N), at an angle of 63.33o relative to the central axis of
the humeral shaft to simulate 90o arm abduction. Five loading-unloading cycles with
a linear waveform were performed to analyse cumulative micro motion at the
fracture fragment contact surfaces. Linear elastic material behaviour is assumed in
the current chapter without consideration of plasticity or damage. The material
properties assigned to the models are summarised in Table 4.1.
Figure 4.4 [i] Boundary conditions applied to all models created including intact simulation,
[ii] Section view of locking plate fixation, [iii] Section view of IM nail fixation, [iv] Section
view of K-wire fixation, [v] Section view of Bilboquet fixation.
Feerick et al. (2012) J Med Eng & Phys, Article In Press,
http://dx.doi.org/10.1016/j.medengphy.2012.07.016
Page 73
Chapter 4
66
Table 4.1 Material Properties
Modulus (GPa) Poisson’s Ratio
Cortical Bone 12 0.3
Cancellous Bone 0.1 0.3
Cement 1.52 0.3
Titanium
(Locking Plate, Bilboquet)
110 0.3
Stainless Steel
(Intramedullary Nail, K-wires)
193 0.3
Short Fibre CFPEEK 18 0.3
Contact interactions were included between the humeral shaft and the greater
tuberosity fragment, between the humeral shaft and the articular fragment, and
between the greater tuberosity and the articular fragments. The contact interactions
were defined using surface to surface finite sliding with a coefficient of friction of
0.3 (Viceconti et al. (2004)). Tied constraints were applied between the cement and
surrounding bone / device under the assumption that cement attains full adhesion
with the surrounding components. Tied constraints were also applied between
threaded areas of each device and surrounding bone.
Simulations were conducted to evaluate the performance of locking plate and IM nail
devices constructed from short carbon fibre reinforced PEEK (CFPEEK) with a
modulus of 18 GPa. CFPEEK is significantly more compliant than titanium (110
GPa) and stainless steel (193 GPa). Simulations were also conducted for reinforced
fixations with a cement modulus ranging from 0.1 GPa to 1.5 GPa.
Each simulation was examined and compared, in terms of micro motion, between the
fracture fragments as well as stress distribution within the humeral head. Pressure
and shear stresses are considered in order to provide a complete description of the
stress state in the bone and implant. Regions in which the yield stress of bone is
exceeded are identified. In particular, high pressures at implant tips and high shear
Page 74
Chapter 4
67
stresses along implant bone interfaces indicate possible implant pullout or push out
for each device
4.3 Results
4.3.1 Experimental:
The peak experimental strains were compared to the computed axial strain
components in the corresponding strain gauge direction in the finite element
simulations (Figure 4.5). Due to the high level of mesh refinement, several elements
coincided with the strain gauge location. Therefore, a range of strains are presented
for the computational results of Figure 4.5. It was noted that in the region of strain
gage S1, the strain changed from tension, for the intact case, to compression, for the
locking plate case. The compressive strain magnitude for the locking plate fixation
was six times higher than the tensile strain magnitude of the intact humerus. It
should be noted that there was a large range for the computational simulations of
locking plate fixation at the location of S1, as a high strain gradient was computed in
this region. A reduction in compressive strain occurred at location S2 for the locking
plate repaired humerus, compared to an intact humerus. As shown in the chart of
Figure 4.5, the same trends in strain were observed both computationally and
experimentally. No statistical difference was observed between the experimental and
computational results.
4.3.2 Computational:
The stability of each fixation method was examined by computing the maximum
magnitude of fracture line opening (FLO) between fracture fragments. In all cases
the cement reinforced simulations had significantly lower FLO between fracture
fragments than unreinforced simulations. The deformed shape of a K-wire fixation at
the mid-cycle peak load is shown for the unreinforced and reinforced simulations in
Figure 4.6A and 4.6B respectively. The two key areas of FLO are highlighted for
both reinforced and unreinforced K-wire fixation. As a result of the glenohumeral
loading, we see that the articular fragment was compressed into the greater
tuberosity and subject to a rotation. This resulted in FLO at the medial side of the
articular fragment and humeral shaft surfaces. At the same time, the greater
Page 75
Chapter 4
68
tuberosity fragment was subject to a rotation outwards in the lateral direction. This
lead to opening of fracture lines between the greater tuberosity and humeral shaft
surfaces. A similar pattern of deformation was observed for all four devices. As
illustrated in Figure 4.6C, cement reinforcement resulted in a significant reduction in
FLO (<19 microns) for all four devices. A cement reinforced Bilboquet simulation
computed the most significant reduction (67%) compared to the unreinforced
equivalent.
Figure 4.5 Graph of average peak experimental strains (micro strains) recorded for five tests
(n=5) and standard deviations compared to the average strains predicted computationally at
peak load in the same regions for intact and plate repaired humeri.
In addition to FLO, relative sliding (shear displacement) between fracture fragments
was computed for five cycles of loading and unloading. The average shear
displacement between the fracture fragments is reported for both reinforced and
unreinforced devices in Figure 4.7. During five cycles of loading and unloading there
was a cumulative increase in shear displacement between the fracture fragments. In
all cases, reinforced simulations predicted lower shear displacement between fracture
fragments compared to unreinforced devices. K-wire simulations predicted the
highest shear displacement compared with other reinforced devices. The same trend
was predicted when unreinforced K-wires were compared to other unreinforced
devices. An unreinforced IM nail and Bilboquet predicted similar shear displacement
magnitudes. A reinforced locking plate and IM nail computed shear displacements
Feerick et al. (2012) J Med Eng & Phys, Article In Press,
http://dx.doi.org/10.1016/j.medengphy.2012.07.016
Page 76
Chapter 4
69
close in magnitude. A reinforced Bilboquet simulation predicted the lowest
magnitude of shear displacement.
Figure 4.6 (A) Failure mode for unreinforced K-wire fixation (deformation scale factor: 50),
(B) Failure mode for reinforced K-wire fixation (deformation scale factor: 50), (C) Bar chart
of maximum fracture line opening (FLO) between fracture fragments.
Figure 4.8 summarises the shear stress (Tresca) distribution within the cortical bone
of the humerus for each method of fixation compared to an intact model. A section
view of the cortical bone for each method of fixation simulated is presented in Figure
4.8(A-D). Shear stress distribution computed for an intact cortical humerus is also
presented for comparison (Figure 4.8(E)). The key points to note are as follows:
In all cases, cement reinforcement resulted in a reduction in the average shear
stress in both the articular and greater tuberosity fragments.
For all devices, shear stresses in the lateral cortex of the greater tuberosity
and humeral shaft were lower than those computed for the intact humerus.
Reductions in shear stress were more pronounced in cement reinforced
fixations.
Unreinforced locking plate, K-wires and Bilboquet fixation resulted in shear
stresses in the articular fragment that were higher than those computed for the
Feerick et al. (2012) J Med Eng & Phys, Article In Press,
http://dx.doi.org/10.1016/j.medengphy.2012.07.016
Page 77
Chapter 4
70
intact case. Unreinforced locking plate and IM nail fixation resulted in lower
shear stresses within the greater tuberosity than the intact case. In contrast,
unreinforced K-wires and Bilboquet fixation resulted in higher shear stresses
than the intact case in the greater tuberosity.
Shear stresses in the articular and greater tuberosity fragments computed for a
reinforced Bilboquet fixation, were significantly lower than those predicted
for the intact case.
Figure 4.7 Average shear displacement between fracture fragments for unreinforced (UR)
and reinforced (R) fracture fixation during fives cycles of loading and unloading.
Figure 4.9 summarises the pressure distribution within the cortical bone of the
humerus for each method of fixation compared to an intact humerus. A section view
of the cortical bone, for each method of fixation simulated, is presented in Figure
4.9(A-D). An intact cortical bone section view of pressure distribution is also
presented in Figure 4.9(E). The computed pressures followed the same trend as the
computed shear stresses, with the highest pressures predicted in the regions
surrounding the device anchors/screws. An unreinforced K-wire and IM nail
achieved the closest pressure distribution to that computed for the intact case. A
reinforced Bilboquet device resulted in significantly lower pressure distribution
Feerick et al. (2012) J Med Eng & Phys, Article In Press,
http://dx.doi.org/10.1016/j.medengphy.2012.07.016
Page 78
Chapter 4
71
within the humeral head compared to all other devices, with the average pressure
distribution within the articular fragment being three times lower than the intact case.
The average pressure distribution within the greater tuberosity was five times lower
than the intact case.
Figure 4.8 Section view of Tresca shear stress distribution within the humerus cortical bone,
(A) Locking plate fixation [i] Unreinforced, [ii] Reinforced, (B) IM nail fixation
[i]Unreinforced, [ii]Reinforced, (C) K-wires fixation [i] Unreinforced, [ii] Reinforced, (D)
Bilboquet fixation [i] Unreinforced, [ii] Reinforced, (E) Shear stress distribution within an
intact humerus subject to 90o arm abduction.
Additional simulations, over a range of loading orientations for an unreinforced
locking plate and IM nail, are shown in Figures 4.10 and 4.11 respectively. The
computed shear stress in the humeral shaft cortical bone decreased with increasing
arm abduction (angle of loading), as shown in Figure 4.10, with a minimum reached
at 90o and an increase observed at 120
o. In contrast with this, the shear stress within
the humeral head increased with increasing arm abduction (angle of loading),
reaching a maximum at 90o and reducing again at 120
o.
Shear stress distribution computed for an IM nail is presented in Figure 4.11. Due to
the fact that the IM nail is an internal fixate, the lateral side of the humerus was
shielded from the fluctuating shear stress observed for the locking plate repaired
humerus, for all loading orientations. Similar to the locking plate (Figure 4.10) the
computed shear stress within the cortical bone of the humeral head increased with
Feerick et al. (2012) J Med Eng & Phys, Article In Press,
http://dx.doi.org/10.1016/j.medengphy.2012.07.016
Page 79
Chapter 4
72
increasing angle of abduction, as shown in Figure 4.11. The highest shear stress
occurred at 90o abduction, with a reduction observed for 120
o. However, in contrast
to the locking plate fixation, no significant changes in shaft stresses were computed
across the range of loading orientations for the IM nail. The results included in
Figure 4.10 and 4.11 highlight that 90o abduction was the critical loading orientation
at which maximum stresses occurred in the regions surrounding screw tips and
within the humeral head.
Figure 4.9 Section view of pressure distribution within the humerus cortical bone,
(A) Locking plate fixation [i] Unreinforced, [ii] Reinforced, (B) IM nail fixation
[i] Unreinforced, [ii] Reinforced, (C) K-wires fixation [i] Unreinforced, [ii] Reinforced, (D)
Bilboquet fixation [i] Unreinforced, [ii] Reinforced, (E) Pressure distribution within an intact
humerus subject to 90o arm abduction
Highly localised maximum values of pressures and shear stresses occurred in the
cortical bone directly surrounding the screws of the locking plate and IM nail. Figure
4.12 highlights such stress concentrations for a metallic unreinforced locking plate
and intramedullary nail fixation (Figure 4.12(A-B)). Pressure concentrations also
occurred in the regions of cortical bone at the tips of the screws (pressure
concentrations not shown in Figure 4.12). Unreinforced fixations had higher
maximum stresses than reinforced. Unreinforced locking plates computed the highest
maximum stresses. A maximum shear stress of 113 MPa was computed in the
cortical bone adjacent to the screw tips. This exceeded reported values of ultimate
tensile strength (UTS) (95.1 MPa Dickenson et al. (1981)) for osteoporotic bone.
Given the extremely high cortical bone stress concentrations that resulted from
Feerick et al. (2012) J Med Eng & Phys, Article In Press,
http://dx.doi.org/10.1016/j.medengphy.2012.07.016
Page 80
Chapter 4
73
metallic fixation devices, simulations using CFPEEK devices were conducted for a
locking plate and IM nail (Figure 4.12(C-D)). The maximum stresses within the
cortical bone were significantly reduced when the fixation device was constructed
from CFPEEK, compared to a metallic implant as shown by the bar chart in
Figure 4.12(E). The maximum shear stress was significantly reduced from 112 MPa
to 45 MPa when a CFPEEK plate was used instead of a metallic plate for
unreinforced fixation. A similar trend was observed for an IM Nail. The
corresponding reductions were less significant when devices were cement reinforced.
Figure 4.10 Computed shear stress (Tresca) (Pa) for unreinforced locking plate for four
stages of abduction (30o, 60
o, 90
o and 120
o).
Clearly the device material and cement reinforcement had a significant effect on
cortical bone stress. The effect of cement modulus on cortical bone stress is shown in
Figure 4.13(A-C) for a CFPEEK locking plate fixation. Cement moduli of 1.5GPa,
0.5GPa and 0.1GPa were considered and bone stresses were compared to the intact
case (Figure 4.13(D)). With decreasing modulus of bone cement the average stress
within the greater tuberosity and articular fragments increased, becoming a closer
replication of the shear stress distribution of the intact case in this region.
Feerick et al. (2012) J Med Eng & Phys, Article In Press,
http://dx.doi.org/10.1016/j.medengphy.2012.07.016
Page 81
Chapter 4
74
Figure 4.11 Computed shear stress (Tresca) (Pa) for unreinforced IM nail for four stages of
abduction (30o, 60
o, 90
o and 120
o).
Figure 4.12 Shear stress section view of implant and cortical bone (A) unreinforced titanium
locking plate, (B) unreinforced stainless steel IM nail, (C) unreinforced CFPEEK plate, (D)
unreinforced CFPEEK IM nail, (E) Bar chart of maximum shear stresses for unreinforced
(UR) and reinforced (R) metallic and CFPEEK devices.
Feerick et al. (2012) J Med Eng & Phys, Article In Press,
http://dx.doi.org/10.1016/j.medengphy.2012.07.016
Feerick et al. (2012) J Med Eng & Phys, Article In Press,
http://dx.doi.org/10.1016/j.medengphy.2012.07.016
Page 82
Chapter 4
75
Figure 4.13 Section view of shear stress distribution within the humerus cortical bone
comparing intact humerus shear stress distribution to reinforced CFPEEK locking plate with
cements of varying moduli; (A) Cement modulus (1.5 GPa), (B) Cement modulus (0.5 GPa),
(C) Cement modulus (0.1 GPa), (D) Intact.
In addition to CFPEEK offering reduced peak stresses, it was necessary that
reasonable stability was provided. Thus fracture line opening (FLO) (Figure 4.14(A))
between fracture fragments was compared to corresponding metallic devices. In the
case of an unreinforced locking plate fixation, a CFPEEK device computed FLO of
25 μm, compared to a FLO of 15 μm for a metallic locking plate. A higher FLO was
also computed for the CFPEEK device for a reinforced fixation. In the case of IM
nail fixation, very similar levels of FLO were computed for CFPEEK and metallic
devices. Overall, simulations suggested that the FLO for CFPEEK devices was of a
similar order to that provided by metallic devices.
Feerick et al. (2012) J Med Eng & Phys, Article In Press,
http://dx.doi.org/10.1016/j.medengphy.2012.07.016
Page 83
Chapter 4
76
Figure 4.14 Comparison of metallic locking plate and IM nail versus CFPEEK for fracture
line opening (FLO) between fracture fragments.
4.4 Discussion
This chapter provides, for the first time, a computational assessment of four fracture
fixation techniques for proximal humerus fractures, with a specific focus on cortical
bone stress, fracture fragment displacement, cement reinforcement and device
material properties at 90o arm abduction. For all devices, it was found that cement
reinforcement increases the stability, reducing the FLO as well as shear displacement
between the fracture fragments. Unreinforced locking plates and IM nail fixation
result in extremely high cortical bone stress concentration in the region surrounding
screw tips. Predicted stresses exceed reported values of ultimate strength of
osteoporotic cortical bone (95.1 MPa Dickenson et al. (1981)), indicating a high
potential for screw pullout/pushout. This is a commonly reported clinical failure
mode for these devices (Owsley and Gorczyca (2008)). We demonstrate that devices
manufactured from short fibre CFPEEK will significantly reduce cortical bone
stresses in the region of the screw tips, and may provide lower instances of device
failure by screw pullout/pushout. We also demonstrate that CFPEEK devices provide
a similar level of fixation stability to metallic implants in terms of FLO between
fracture fragments.
Feerick et al. (2012) J Med Eng & Phys, Article In Press,
http://dx.doi.org/10.1016/j.medengphy.2012.07.016
Page 84
Chapter 4
77
One commonly reported issue with proximal humeral fracture fixation is that
fixation methods are too stiff (Lill et al. (2003)), leading to block pullout of screws,
or screw penetration into the glenoid (Owsley and Gorczyca (2008); Clavert et al.
(2010); Dheerendra et al. (2011)). In the present chapter, localised maximum stresses
computed for unreinforced models, at the implant anchor-screw interface with
cortical bone for metallic devices, are an indicator of potential screw pullout/push
out. These maximum stresses fall within the range for yield and potential fatigue
failure for cortical bone, particularly if these devices were used to repair osteoporotic
bone with a yield stress of 75.8 MPa and ultimate strength of 95.1 MPa (Dickenson
et al. (1981)). The occurrence of these maximum stresses in the region of the screw
tips motivated the study of cortical bone failure mechanisms during screw pullout in
Chapter 5. Resch (2011) proposed the use of semi rigid constructs such as K-wires to
reduce maximum stresses within the humeral head. This is supported by the results
of the present chapter, which suggests that K-wire fixation results in lower stress
concentrations in the cortical bone than a locking plate or IM nail fixation. However,
the stability predicted for K-wire fixation is lower than these devices which is
supported by clinical studies that reported issues with K-wire migration (Bogner et
al. (2008); Brunner et al. (2010)). In the present chapter we demonstrate that carbon
fibre reinforced PEEK (CFPEEK) locking plates and IM nails provide a less stiff
fixation than metallic devices, resulting in lower stress concentrations at anchor sites.
This suggests that CFPEEK devices will lower the risk of device failure due to screw
pullout/pushout. An experimental and computational study by Bougherara et al.
(2011) compared a composite hip stem to commercially available metallic
equivalents. This study highlighted the reduced stress in the composite implant,
suggesting it would better replicate the stress distribution within an intact femur.
While the current chapter provides motivation for the development of CFPEEK
devices, the application of composite materials for proximal humeral fracture
fixation warrants further investigation in terms of design optimisation and fatigue
performance (Sobieraj et al. (2009); Sobieraj et al. (2010)). In addition to
significantly lowering maximum cortical bone stresses, CFPEEK devices do not
compromise the stability of the fracture fragments compared to metallic equivalents.
A recent study by Yánez et al. (2010) proposed a new system for reducing the
incidence of screw loosening and screw pullout using a PEEK screw locking element
for metal fracture plates.
Page 85
Chapter 4
78
Stability is an important factor when selecting a method of fixation for proximal
humeral fracture fixation. Focussing on metallic devices, a reinforced Bilboquet
device has the lowest level of shear displacement, followed by a reinforced locking
plate, followed by a reinforced intramedullary nail. An unreinforced K-wire fixation
predicts the highest level of shear displacement between fracture fragments.
However, reinforced K-wires predicted shear displacement lower than that of an
unreinforced locking plate and intramedullary rod, as well as predicting the lowest
peak stresses at the cortical bone-implant interface. This suggests that reinforced K-
wires may be a viable option for proximal humeral fracture fixation. All devices
exhibited a cumulative increase in shear displacement. In the case of unreinforced K-
wire fixation, the large cyclic increment of shear displacement could prove
problematic over a large numbers of loading cycles, leading to a loss of fracture
surface overlap. Additionally, the computed FLO is highest for the unreinforced K-
wires and the Bilboquet device, with cement reinforcement offering a significant
reduction for both. The prediction of normal (FLO) and tangential (shear
displacement) components of relative motion of fracture fragments, in the current
chapter, provides an insight into the mechanisms of inter-fragmentary micro-motion.
Previous experimental studies have reported relative motion between fracture
fragments (Kwon et al. (2002); Rose et al. (2010)), without specifying the normal
and tangential components.
The computed results suggest that cement reinforcement is advantageous for all four
methods of fixation, predicting significant increases in fracture fixation stability. All
reinforced simulations predicted lower FLO than an unreinforced simulation. This
finding is supported by previous experimental studies (Kwon et al. (2002); Mathison
et al. (2010)). Furthermore, a recent clinical study by Neviaser et al. (2011) reported
lower complications with reinforced locking plates in regard to screw
penetration/cutout or loss of reduction. While reinforcement was provided by an
allograft strut in this clinical study, the simulations performed in the current chapter
suggest that cement reinforcement would provide similar improvements. Due to the
fact that K-wires and intramedullary rod fixations require small incisions for device
insertion, it could be suggested that cement reinforcement would not be viable
surgically, as commercially available cements require significantly larger openings
for insertion. However, the development of percutaneous injectable calcium
Page 86
Chapter 4
79
phosphate bone cements (Low et al. (2010)) may facilitate the implementation of
cement reinforced K-wires and intramedullary rod. In addition to lower modulus
materials for each device, a parameter study of cement modulus provides motivation
for developing lower modulus bone cements in order to better replicate the intact
case in terms of cortical bone stress, while increasing stability.
The present chapter contains a number of limitations. Tied constraints are applied to
contact surfaces between cement and surrounding bone or implants. The assumption
that complete adhesion exists between these components may not be fully
representative of the in vivo environment and merits further study. Each device is
examined for one configuration of fixation, based on those selected by previous
publications (Kwon et al. (2002); Koike et al. (2008)). The locking plate, IM nail and
K-wires can have several configurations. The angles of the screws of a locking plate
and intramedullary rod can be altered. Additionally, a large range of insertion and
anchor points can be implemented for various numbers of K-wires. While the
optimal for each has yet to be identified, the computational models developed in the
current chapter can provide a platform for future device optimisation. Linear elastic
material behaviour is assumed in the current chapter without consideration of
plasticity or damage (Mullins et al. (2009); Kelly and McGarry (2012)). Simulations
suggest that high stress concentrations in the regions of screw tips will lead to bone
plasticity, damage and ultimately screw pullout. Given the high level of geometric
detail incorporated into our models of the humerus and fixation devices, very large
numbers of elements were used (>700,000), with full contact being implemented at
fracture surfaces. It is important to note that five loading cycles required 24 hour run
time, using 64 cores on a high performance workstation. Therefore it was not
feasible to simulate large numbers of loading cycles for the devices considered. The
loads applied to the humerus are simplified to a glenohumeral force at 90o
arm
abduction, with no muscle simulation included. The present chapter focuses
primarily on 90o loading. Simulations over a range of loading orientations reveal that
the highest stresses occur at this orientation. However, it is important to note that the
load orientation does influence the distribution of stress in the bone and the device.
It was assumed that the material properties of a composite plate could be directly
applied to the same geometry of the metallic plate; this was justified by the fact that
short carbon fibre reinforced PEEK can be injection moulded.
Page 87
Chapter 4
80
In conclusion, this chapter provides, for the first time, a computational assessment of
four fracture fixation techniques for proximal humerus fractures. This chapter is also
the first computational study to report cyclic loading and micro motion between
contact surfaces of fracture fragments for proximal humeral fracture fixation. A
previous study by Maldonado et al. (2003) conducted finite element simulations on a
plate fixation of a two part humeral fracture by representing fracture lines as areas of
low stiffness, providing limited insight into relative fracture fragment motion.
Previous studies have evaluated the performance of composite materials as
alternatives to metal for fracture plates (Fujihara et al. (2004); Kharazi et al. (2010);
Kim et al. (2010)). The present study provides the first computational assessment of
CFPEEK for proximal humeral fracture fixation. The findings presented offer further
motivation for development of this material for fracture fixation devices as an
alternative to current metallic equivalents.
Page 88
Chapter 4
81
4.5 References
Bajammal, S. S., Zlowodzki, M., Lelwica, A., Tornetta, P., Einhorn, T. A. and
Buckley, R., 2008. The use of calcium phosphate bone cement in fracture
treatment. J Bone Joint Surg Am 90, 1186-1196.
Bogner, R., Hubner, C., Matis, N., Auffarth, A., Lederer, S. and Resch, H., 2008.
Minimally-invasive treatment of three-and four-part fractures of the proximal
humerus in elderly patients. J Bone Joint Surg Br 90, 1602-1607.
Bougherara, H., Zdero, R., Dubov, A., Shah, S., Khurshid, S. and Schemitsch, E. H.,
2011. A preliminary biomechanical study of a novel carbon–fibre hip implant
versus standard metallic hip implants. Medical Engineering & Physics
33, 121-128.
Brunner, A., Weller, K., Thormann, S., Jöckel, J. A. and Babst, R., 2010. Closed
Reduction and Minimally Invasive Percutaneous Fixation of Proximal
Humerus Fractures Using the Humerusblock. J Orthop Trauma 24, 407-13.
Clavert, P., Adam, P., Bevort, A., Bonnomet, F. and Kempf, J. F., 2010. Pitfalls and
complications with locking plate for proximal humerus fracture. J Shoulder
Elbow Surg 19, 489-494.
Clavert, P., Zerah, M., Krier, J., Mille, P., Kempf, J. and Kahn, J., 2006. Finite
element analysis of the strain distribution in the humeral head tubercles
during abduction: comparison of young and osteoporotic bone. Surg Radiol
Anat 28, 581-587.
Cuny, C., Scarlat, M. M., Irrazi, M., Beau, P., Wenger, V., Ionescu, N. and Berrichi,
A., 2008. The Telegraph nail for proximal humeral fractures: A prospective
four-year study. J Shoulder Elbow Surg 17, 539-545.
Dheerendra, S. K., Khan, W. S., Barber, J., Goddard, N. J. and Ahrens, P. M., 2011.
Outcomes of locking plates in proximal humeral fractures: a systematic
review. Shoulder & Elbow 3, 74-84.
Dickenson, R. P., Hutton, W. C. and Stott, J. R., 1981. The mechanical properties of
bone in osteoporosis. Journal of Bone and Joint Surgery-British Volume 63,
233-38.
Doursounian, L., Grimberg, J., Cazeau, C., Jos, E. and Touzard, R., 2000. A new
internal fixation technique for fractures of the proximal humerus-the
Bilboquet device: A report on 26 cases. J Shoulder Elbow Surg 9, 279-288.
Doursounian, L., Kilinc, A., Cherrier, B. and Nourissat, G., 2011. Complex proximal
humeral fractures: A prospective study of 22 cases treated using the
"Bilboquet" device. Orthop. Traumatol. Surg. Res. 97, 58-66.
Faour, O., Dimitriou, R., Cousins, C. A. and Giannoudis, P. V., 2011. The use of
bone graft substitutes in large cancellous voids: Any specific needs? Injury
42, Supplement 2, S87-S90.
Frankenburg, E. P., Goldstein, S. A., Bauer, T. W., Harris, S. A. and Poser, R. D.,
1998. Biomechanical and histological evaluation of a calcium phosphate
cement. J Bone Joint Surg Am 80, 1112-1124.
Fujihara, K., Huang, Z. M., Ramakrishna, S., Satknanantham, K. and Hamada, H.,
2004. Feasibility of knitted carbon/PEEK composites for orthopedic bone
plates. Biomaterials 25, 3877-3885.
Jaberg, H., Warner, J. J. and Jakob, R. P., 1992. Percutaneous stabilization of
unstable fractures of the humerus. J Bone Joint Surg Am 74, 508-15.
Kelly, N. and McGarry, J. P., 2012. Experimental and numerical characterisation of
the elasto-plastic properties of bovine trabecular bone and a trabecular bone
Page 89
Chapter 4
82
analogue. Journal of the Mechanical Behavior of Biomedical Materials 9,
184-197.
Kettler, M., Biberthaler, P., Braunstein, V., Zeiler, C., Kroetz, M. and Mutschler, W.,
2006. Treatment of proximal humeral fractures with the PHILOS angular
stable plate. Presentation of 225 cases of dislocated fractures. Der
Unfallchirurg 109, 1032-40.
Kharazi, A. Z., Fathi, M. H. and Bahmany, F., 2010. Design of a textile composite
bone plate using 3D-finite element method. Materials & Design 31, 1468-
1474.
Kim, S. H., Chang, S. H. and Jung, H. J., 2010. The finite element analysis of a
fractured tibia applied by composite bone plates considering contact
conditions and time-varying properties of curing tissues. Composite
Structures 92, 2109-2118.
Kitsis, C. K., Marino, A. J., Krikler, S. J. and Birch, R., 2003. Late complications
following clavicular fractures and their operative management. Injury 34, 69-
74.
Koike, Y., Komatsuda, T. and Sato, K., 2008. Internal fixation of proximal humeral
fractures with a Polarus humeral nail. J Orthopaed Traumatol 9, 135-139.
Koval, K. J., Blair, B., Takei, R., Kummer, F. J. and Zuckerman, J. D., 1996.
Surgical neck fractures of the proximal humerus: a laboratory evaluation of
ten fixation techniques. J Trauma 40, 778-83.
Kurtz, S. M. and Devine, J. N., 2007. PEEK biomaterials in trauma, orthopedic, and
spinal implants. Biomaterials 28, 4845-4869.
Kwon, B. K., Goertzen, D. J., O'Brien, P. J., Broekhuyse, H. M. and Oxland, T. R.,
2002. Biomechanical evaluation of proximal humeral fracture fixation
supplemented with calcium phosphate cement. J Bone Joint Surg Am 84,
951-61.
Lill, H., Hepp, P., Korner, J., Kassi, J. P., Verheyden, A. P., Josten, C. and Duda, G.
N., 2003. Proximal humeral fractures: how stiff should an implant be? Arch
Orthop Trauma Surg 123, 74-81.
Lim Fat, D., Kennedy, J., Galvin, R., O’Brien, F., Mc Grath, F. and Mullett, H.,
2012. The Hounsfield value for cortical bone geometry in the proximal
humerus—an in vitro study. Skeletal Radiology 41, 557-568.
Low, K. L., Tan, S. H., Zein, S. H. S., Roether, J. A., Mouriño, V. and Boccaccini,
A. R., 2010. Calcium phosphate-based composites as injectable bone
substitute materials. Journal of Biomedical Materials Research Part B:
Applied Biomaterials 94B, 273-286.
Maldonado, Z. M., Seebeck, J., Heller, M. O. W., Brandt, D., Hepp, P., Lill, H. and
Duda, G. N., 2003. Straining of the intact and fractured proximal humerus
under physiological-like loading. J Biomech 36, 1865-1873.
Mathison, C., Chaudhary, R., Beaupre, L., Reynolds, M., Adeeb, S. and Bouliane,
M., 2010. Biomechanical analysis of proximal humeral fixation using locking
plate fixation with an intramedullary fibular allograft. Clin Biomech 25, 642-
646.
Muckter, H., Herzog, L., Becker, M., Vogel, W., Meeder, P. J. and Buchholz, J.,
2001. Angle- and rotation-stable internal fixation of proximal humerus
fractures with the humerus fixator plate. Early clinical experience with a
newly developed implant. Der Chirurg; Zeitschrift fur alle Gebiete der
operativen Medizen 72, 1327-35.
Page 90
Chapter 4
83
Müller, M. E., 1990. The comprehensive classification of fractures of long bones,
Springer-Verlag.
Mullins, L. P., Bruzzi, M. S. and McHugh, P. E., 2009. Calibration of a constitutive
model for the post-yield behaviour of cortical bone. Journal of the
Mechanical Behavior of Biomedical Materials 2, 460-470.
Neviaser, A. S., Hettrich, C. M., Beamer, B. S., Dines, J. S. and Lorich, D. G., 2011.
Endosteal Strut Augment Reduces Complications Associated With Proximal
Humeral Locking Plates. Clin. Orthop. Relat. Res, 3300-3306.
Owsley, K. C. and Gorczyca, J. T., 2008. Displacement/Screw Cutout After Open
Reduction and Locked Plate Fixation of Humeral Fractures. J Bone Joint
Surg Am 90, 233-240.
Ponnappan, R. K., Serhan, H., Zarda, B., Patel, R., Albert, T. and Vaccaro, A. R.,
2009. Biomechanical evaluation and comparison of polyetheretherketone rod
system to traditional titanium rod fixation. The Spine Journal 9, 263-267.
Poppen, N. K. and Walker, P. S., 1978. Forces at the Glenohumeral Joint in
Abduction. Clin Orthop 135, 165-170.
Resch, H., 2011. Proximal humeral fractures: current controversies. J Shoulder
Elbow Surg 20, 827-832.
Resch, H., Povacz, P., Frohlich, R. and Wambacher, M., 1997. Percutaneous fixation
of three-and four-part fractures of the proximal humerus. J Bone Joint Surg
Br 79, 295-300.
Rho, J. Y., Hobatho, M. C. and Ashman, R. B., 1995. Relations of mechanical
properties to density and CT numbers in human bone. Medical Engineering
& Physics 17, 347-355.
Ring, D., McKee, M. D., Perey, B. H. and Jupiter, J. B., 2001. The use of a blade
plate and autogenous cancellous bone graft in the treatment of ununited
fractures of the proximal humerus. Journal of Shoulder and Elbow Surgery
10, 501-507.
Rose, D. M., Sutter, E. G., Mears, S. C., Gupta, R. R. and Belkoff, S. M., 2010.
Proximal Humeral Fractures. Geriatric Orthopaedic Surgery & Rehabilitation
1, 73-7.
Rose, P. S., Adams, C. R., Torchia, M. E., Jacofsky, D. J., Haidukewych, G. G. and
Steinmann, S. P., 2007. Locking plate fixation for proximal humeral
fractures: initial results with a new implant. J Shoulder Elbow Surg 16, 202-
207.
Sobieraj, M. C., Kurtz, S. M. and Rimnac, C. M., 2009. Notch sensitivity of PEEK in
monotonic tension. Biomaterials 30, 6485-6494.
Sobieraj, M. C., Murphy, J. E., Brinkman, J. G., Kurtz, S. M. and Rimnac, C. M.,
2010. Notched fatigue behavior of PEEK. Biomaterials 31, 9156-9162.
Viceconti, M., Ricci, S., Pancanti, A. and Cappello, A., 2004. Numerical model to
predict the longterm mechanical stability of cementless orthopaedic implants.
Med Biol Eng Comput 42, 747-753.
Yamada, M., Briot, J., Pedrono, A., Sans, N., Mansat, P., Mansat, M. and Swider, P.,
2007. Age- and gender-related distribution of bone tissue of osteoporotic
humeral head using computed tomography. Journal of Shoulder and Elbow
Surgery 16, 596-602.
Yánez, A., Carta, J. A. and Garcés, G., 2010. Biomechanical evaluation of a new
system to improve screw fixation in osteoporotic bones. Medical Engineering
& Physics 32, 532-541.
Page 91
Chapter 4
84
4.6 Appendix 4A
Figure 4A.1 Model Generation of intact specimen model of cortical and cancellous
bone volumes from CT scans using Simpleware
Figure 4A.2 Mesh data for intact humerus model generated using Simpleware
Page 92
Chapter 5
85
Chapter 5
Experimental Study of Cortical Bone Screw Pullout
Abstract
An experimental study of screw pullout from cortical bone has been conducted. A
novel modification of standard screw pullout tests, which provided real time image
capture of damage mechanisms during pullout, was developed. Pullout forces,
measured using the novel test rig, were validated against standard pullout tests.
Osteon alignment was considered during pullout tests, to investigate the effect of
osteons aligned parallel to the axis of the orthopaedic screw (longitudinal pullout), as
well as the effect of osteons aligned perpendicular to the axis of the screw
(transverse pullout). Distinctive alternate failure mechanisms were uncovered for
longitudinally and transversely orientated cortical bone during screw pullout.
Vertical crack propagation, parallel to the axis of the screw, was observed for a
longitudinal pullout. Horizontal crack propagation, perpendicular to the axis of the
screw, was observed for a transverse pullout.
5.1 Introduction
Cortical bone is a naturally occurring composite. The constituents can be classified
as organic and inorganic phases and water. The organic phase consists of impure
hydroxyapatite, while the inorganic phase consists mainly of collagen. At the micro-
scale, arrangement of the constituents can be seen as stacks of concentric collagen
sheets with a central Haversian canal forming osteons which are embedded in an
interstitial matrix of hydroxyapatite. In long whole bones, osteons are aligned
parallel to the central axis of the bone (Rho et al. (1998); Cowin (2001)).
Orthopaedic screws are used as the primary mode of fixation for applications such as
fracture plates (Kwon et al. (2002)), intramedullary rods (Cuny et al. (2008)), spinal
devices (GainesJr (2000)) and suture anchors (Barber et al. (2008)). Screw pullout is
a commonly reported clinical problem (Owsley and Gorczyca (2008)). Maximising
the insertion depth of screws in cortical bone has been shown to significantly
increase the pullout strength of orthopaedic screws. Pollard et al. (2010) reported that
a bicortical fixation, with a screw inserted through the lateral cortex and anchored in
Page 93
Chapter 5
86
the opposite cortical wall, significantly increased the strength of fixation. The ability
of devices to perform as designed is dictated by the pullout strength of the screws
anchoring them. The failure mechanisms that lead to screw pullout have not
previously been uncovered.
The objective of Chapter 5 is to experimentally identify the failure mechanisms that
lead to screw pullout from cortical bone. In order to uncover these failure
mechanisms, a novel test rig was developed. This modification of standard pullout
tests (ASTMF543-07) facilitates live imaging of crack initiation and propagation as
the screw is removed from the bone.
5.2 Materials and Methods
5.2.1 Sample preparation
Cortical bone samples (24x20x10mm) were extracted from the mid-diaphysis of a
bovine metacarpus, parallel to the central axis of the bone. A sample extracted with
osteons aligned parallel to the cut direction was referred to as a longitudinal sample.
A sample extracted with osteons aligned perpendicular to the cut direction was
referred to as a transverse sample. An illustration of osteon alignment within samples
is shown in Figure 5.1. The bovine bone was obtained from an abattoir within a few
hours post mortem. The samples were extracted within 24 hours and were kept
hydrated in saline solution while refrigerated at 3o C until testing. All testing was
carried out within 14 days post mortem. A high speed bandsaw (Jubilee VBS 360,
Addison Saws Ltd., West Midlands, UK) was used to make initial extraction of
samples. Samples were sanded in saline solution to obtain polished surfaces for
testing.
5.2.2 Orthopaedic Cortical Bone Screws
Commercially available 3.5mm cortical bone screws (Arthrex Inc., Naples, Florida,
USA) were used for the pullout tests (Figure 5.2). These screws are used in the
Arthrex Humeral Suture Locking Plate (Arthrex Inc., Naples, Florida, USA). These
screws are self tapping with an inner diameter of 2.5 mm. Guidelines provided by the
manufacturer stated that a pilot hole of 2.5 mm should be drilled prior to insertion.
Page 94
Chapter 5
87
The self-tapping screw was inserted into all samples with torque limited to 1.5Nm
(as specified by manufacturer).
Figure 5.1 Samples extracted from bovine metacarpus considering osteon alignment. A
sample extracted with osteons aligned parallel to the cut direction was referred to as a
longitudinal sample. A sample extracted with osteons aligned perpendicular to the cut
direction was referred to as a transverse sample.
Figure 5.2 3.5 mm cortical bone screws with an inner diameter of 2.5 mm. The screws are
self tapping with a cutting flute detail at the tip of the screw. The head of the screw is also
threaded so that the screw locks into the threaded holes of the plate.
Page 95
Chapter 5
88
5.2.3 Standard Pullout Tests
Standard pullout tests were conducted according to ASTM F543-07, where screws
were fully embedded in cortical bone blocks. The test rig for complete pullout is
shown in the Figure 5.3. The bone sample was clamped on all four sides. The top
plate of the rig, with a square window of 24 x 20 mm, prevented the sample moving
upwards. A pilot hole of 2.5 mm was drilled in the secured sample and screws were
inserted at a depth of 8mm. Insertion torque did not exceed 1.5 Nm. The screw
heads were gripped using a clamp for load application. Tests were carried out using
an Instron (Model 8500, Instron, UK) 10kN load cell. The test set up is illustrated in
the images of Figure 5.4.
Figure 5.3 Complete pullout test rig. Samples were clamped on four sides with top plate
preventing upward motion of sample. Section views highlight clamping of sample.
Page 96
Chapter 5
89
Figure 5.4 Complete pullout test rig; (A) Test rig clamped in Instron test machine with
screw head gripped in upper rig; (B) Bone sample embedded in resin to facilitate tighter
clamping of samples; (C) Side view of screw removed from sample.
5.2.4 Screw Pullout Damage Visualisation Test (SPDV)
A novel test rig was developed to facilitate real-time imaging of bone damage during
screw pullout, which this chapter refers to as a Screw Pullout Damage Visualisation
(SPDV) test. A schematic of the SPDV rig is shown in Figure 5.5, illustrating key
design components [A-H]. The rig created a 180o symmetric pullout test. The bone
was held in position in the x and z directions by three clamping screws at the sides
and rear of the sample (Figure 5.5D). The bone was held in position in the y
direction by a retaining plate (Figure 5.5E). Half of the screw (Figure 1A) was
embedded in cortical bone (Figure 5.5B) while the remaining half was embedded in
a poly methyl methacrylate slider (Figure 5.5C). This created a window to monitor
crack initiation and propagation (Figure 5.6). The slider was free to move upwards in
the y direction and acted as a guide during the pullout test. The slider was prevented
from moving in the z direction by a poly methyl methacrylate window (Figure 5.5F),
which was bolted to the test rig frame. In summary, the slider and window provided
screw guidance and symmetric constraints on the cortical bone during pullout. It is
important to note that the slider merely underwent rigid body motion with the screw
in the y-direction, so that pullout force was dictated exclusively by the cortical bone.
Page 97
Chapter 5
90
Forces due to friction between the slider and the bone were found to be negligible
(< load cell sensitivity of 0.5N).
Figure 5.5 Schematic of Experimental test rig for SPDV test with section view A-A
an B-B highlighting inner test rig components
A 2.5mm pilot hole was drilled at the interface between the slider and the cortical
bone, which created a shaft of radius 1.25mm in both materials. The self-tapping
screw was inserted to a depth of 8mm into the bone and Perspex slider, with the
maximum applied torque limited to 1.5 Nm (as specified by the screw manufacturer).
The samples were positioned in the test rig with osteons aligned parallel and
perpendicular to the axis of the screw. Tests conducted with osteons aligned parallel
to the axis of the screw, as shown in Figure 5.7A, were referred to as “longitudinal
pullout tests”. Tests conducted with osteons aligned perpendicular to the screw axis,
as shown in Figure 5.7B, were referred to as “transverse pullout tests”. Two sample
t-tests were conducted to determine the statistical significance of the results
(α<0.05).
Page 98
Chapter 5
91
Figure 5.6 Experimental test rig for SPDV test. Front view, highlighting the screw
embedded in bone
Figure 5.7 (A) Longitudinal SPDV test, with osteons aligned parallel to the axis of the
screw; (B) Transverse SPDV test, with osteons aligned perpendicular to the axis of the screw
5.2.5 Comparison of Standard Pullout and SPDV Tests
Measured forces recorded for a complete pullout were multiplied by a factor of 0.5;
in order to validate forces measured using the Screw Pullout Damage Visualisation
(SPDV) test method. This was due to the fact that only half of the screw was
embedded in cortical bone for an SPDV test compared to a complete pullout test.
Feerick and McGarry
J Biomech, Volume 45,
Issue 9, 1 June 2012,
Pages 1666–1672
Feerick and
McGarry J
Biomech, Volume
45, Issue 9, 1 June
2012, Pages 1666–
1672
Page 99
Chapter 5
92
Therefore, the pullout force exerted on the screw should be half the value recorded
for a complete pullout. Each set of experimental tests had a sample size of five. Two
sample t-tests were conducted to determine statistical significance of the results
(α<0.05).
5.2.6 SPDV Test Image Capture
A dual camera system was used to record the pullout test and load data
simultaneously (Figure 5.8). A magnification (X10) lens captured an optical window
of 24x8 mm during the pullout test, at a rate of 60 frames per second.
Simultaneously, a second camera recorded the load displacement data displayed on
the Instron console. The cameras were synchronised prior to testing to determine the
time lag between them. A circular fluorescent light was used to aid visualisation of
the sample during the test.
Figure 5.8: Dual camera live imaging of load displacement data and failure mode as screw
was removed from the bone sample.
5.3 Results
The results of this chapter are presented in two parts. The results from a standard
complete pullout are first presented for both longitudinally and transversely aligned
cortical bone. The results obtained from the SPDV test are then presented with
comparison to the load displacement data observed for complete pullout. A summary
of the pullout forces for each sample is provided in Table 5.1.
Page 100
Chapter 5
93
Table 5.1: Pullout forces recorded for standard pullout and SPDV tests, for longitudinal and
transverse samples
5.3.1 Complete Pullout
5.3.1.1 Longitudinal Pullout Results
The experimental failure mode observed for a complete longitudinal pullout is
summarised in Figure 5.9 below. The bone between the screw threads remained
between the threads after removal as shown by Figure 5.9(A & C). When the screw
was removed from the bone a cleared out hole remained, with no visible bone
deformation. Whitening was observed in the area immediately surrounding the edge
of the hole, as highlighted in Figure 5.9B.
Figure 5.9 Longitudinal complete pullout failure mode; (A) Side view of standard pullout
post test; (B) Cortical bone top surface; (C) Bone remains between screw threads once the
screw is removed.
Standard Pullout Force (kN) SPDV Pullout Force (kN)
Sample Longitudinal Transverse Longitudinal Transverse
1 2.19 5.00 1.62 1.67
2 2.66 3.91 0.86 1.69
3 2.21 4.76 0.57 2.15
4 2.44 4.03 1.51 2.19
5 2.45 3.85 1.11 1.96
Average 2.39 4.31 1.13 1.93
Standard
Deviation
0.19 0.54 0.44 0.24
Page 101
Chapter 5
94
Figure 5.10 Average longitudinal complete pullout load displacement curve.
The average load displacement data for a longitudinal complete pullout is shown in
Figure 5.10. The material followed a non linear response up to a peak load of
2.39 kN at 0.7 mm, with an average standard deviation of ±0.19 kN. There was
minimal plastic deformation observed prior to failure of the material. Once the peak
load was reached an immediate drop in load occurred followed by a gradual
degradation of the loading curve as the screw was removed from the bone. It is
suggested that this gradual degradation of the loading curve was due to friction
between the fracture surfaces as the screw was removed.
5.3.1.2 Transverse Pullout Results
The experimental failure mode observed for a transverse complete pullout is shown
in Figure 5.11. Large deformation and whitening of the material was observed
several millimetres away from the screw edge. Figure 5.11B shows the fracture
fragments observed post pullout. It was observed that less material remained
between the screws threads (Figure 5.11C) in comparison with a longitudinal
pullout.
Feerick and McGarry
J Biomech, Volume 45,
Issue 9, 1 June 2012,
Pages 1666–1672
Page 102
Chapter 5
95
Figure 5.11 Transverse complete pullout failure mode; (A) Side view of standard pullout
post test; (B) Cortical bone top surface; (C) Bone remained between screw threads once the
screw was removed.
The average load displacement data for a transverse complete pullout is shown in
Figure 5.12. An average peak load of 4.31 kN was observed at 0.8 mm, with an
average standard deviation of 0.54 kN. Plastic deformation was observed prior to
failure. The peak load recorded for a transverse pullout was a factor of 2 higher than
a longitudinal pullout. Once the peak load was reached, an immediate drop in load
occurred, followed by a more rapid degradation of load compared with longitudinal
pullout, as the screw was removed from the bone.
Figure 5.12 Average transverse complete pullout load displacement curve.
Feerick and McGarry
J Biomech, Volume 45,
Issue 9, 1 June 2012,
Pages 1666–1672
Page 103
Chapter 5
96
5.3.2 Screw Pullout Damage Visualisation
5.3.2.1 SPDV Longitudinal Pullout Results
The force displacement curve for a longitudinal SPDV test is shown in Figure 5.13.
The average peak load recorded for the longitudinal SPDV test was 1.13 kN, with a
standard deviation of 0.44 kN. In order to determine the accuracy of the SPDV test,
the average peak load recorded for 5 complete pullouts was halved (1.195 kN), no
statistical significance between tests was observed (p=0.763).
Images of the failure mechanisms, captured during a longitudinal SPDV test, are
collated in Figure 5.14. The initial position of the screw is shown in Figure 5.14(i).
Once peak load was reached some areas of localised whitening were evident at the
screw tips (Figure 5.14(ii)). Once the peak load was reached (Figure 5.14(iii)),
vertical cracks formed upwards from the screw thread tips, the bone between the
screw threads detached and was removed with the screw (Figure 5.14(v)). This left a
cleared out hole with no thread definition, as shown in Figure 5.14(vi).
Figure 5.13 Average Load displacement for longitudinal SPDV test.
Feerick and McGarry
J Biomech, Volume 45,
Issue 9, 1 June 2012,
Pages 1666–1672
Page 104
Chapter 5
97
Figure 5.14 Longitudinal SPDV test experimental failure mode images: (i) Initial screw
position, (ii) At peak load, areas of localised whitening were evident at the screw thread tips;
(iii) Crack initiation occurred immediately post peak load; (iv) Cracks propagated vertically
upwards from screw thread tips; (v) Material detachment occurred as cracks propagated
further, bone remained between screw threads as screw was removed; (vi) Final position,
smoothed fracture surface remained with no thread definition.
Magnified images of the failure surface, post testing, for a longitudinal pullout are
shown in Figure 5.15. The jagged surface following pullout was clearly visible as
well as the localised deformation with no obvious material deformation away from
the failure surface.
Figure 5.15 Magnified (x50) fracture surface images post longitudinal SPDV test
Feerick and McGarry J Biomech, Volume 45, Issue 9, 1 June 2012, Pages 1666–1672
Page 105
Chapter 5
98
5.3.2.2 SPDV Transverse Pullout Results
The average peak load for the transverse SPDV test (Figure 5.16) was 1.93 kN, with
a standard deviation of 0.24 kN. The halved average peak load (2.155 kN) for
transverse complete pullout tests also revealed no statistical difference between the
peak loads (p=0.21).
In both tests we saw that the transverse pullout tests required a peak load which was
a factor of two higher than in the longitudinal direction. This validated the force data
reported by the SPDV test, which facilitated failure mode viewing as well as reliable
load data.
Figure 5.16 Force displacement curve from transverse SPDV tests.
Images of the failure mechanisms, captured during a transverse SPDV test, are
collated in Figure 5.17 with initial position shown in Figure 5.17(i). At peak load
(Figure 5.17(ii)), whitening of the material extended horizontally outwards from the
screw threads. This whitening was much more extensive than observed during
longitudinal pullout. Crack initiation occurred at these whitened locations
(Figure 5.17(iii)). Importantly, cracks were oriented in the horizontal direction. As
the test progressed, further whitening occurred and horizontal cracks propagated into
the bone (Figure 5.17(iv). As the screw was removed, the bone above the horizontal
cracks underwent bending and detached itself from undeformed bone, as highlighted
in Figure 5.17(v). Following complete screw pullout, a jagged irregular fracture
Feerick and McGarry J
Biomech, Volume 45, Issue 9, 1
June 2012, Pages 1666–1672
Page 106
Chapter 5
99
surface was revealed. Clearly this failure mode was distinctly different to the failure
mode observed during the longitudinal SPDV, which resulted in localised vertical
crack formation, with no significant bone deformation observed beyond the screw
thread tips (Figure 5.14(vi)).
Magnified images of the failure surface, post testing, for a transverse pullout is
summarised in Figure 5.18. The horizontal cracks that propagated were clearly
visible, with the crack tip extending several millimetres into the surrounding bone.
Figure 5.17 Transverse SPDV test experimental failure mode images: (i) Initial screw
position, (ii) At peak load, whitening of bone extended horizontally outwards from the screw
threads; (iii) Crack initiation occurred in the horizontal direction; (iv) Crack progression was
observed in the horizontal direction with further whitening of the bone; (v) Material
detachment occurred as the bone underwent bending and further deformation as the screw
was removed; (vi) Final position, a jagged irregular fracture surface remained.
(A
)
Feerick and McGarry J Biomech, Volume 45, Issue 9, 1 June 2012, Pages 1666–1672
Page 107
Chapter 5
100
Figure 5.18 Magnified (x50) fracture surface images post transverse SPDV test
5.4 Discussion
The novel experimental SPDV test rig developed for this chapter, uncovers for the
first time the distinctive alternate failure mechanisms for longitudinally and
transversely orientated cortical bone during screw pullout. The test rig reveals these
failure modes in real time as the screw is removed from the cortical bone.
Previous experimental studies of cortical bone have reported significant differences
in stiffness and strength in longitudinal and transverse directions (Reilly and
Burstein (1975); Ashman et al. (1984)). Higher forces have been documented for
transverse pullout compared to longitudinal pullout (Seebeck et al. (2004)), but no
failure mechanisms have previously been uncovered. Previous experimental studies
of screw pullout have conducted pullout tests from synthetic materials such as
Sawbone polyurethane foam (Chapman et al. (1996); Chatzistergos et al. (2010)).
Page 108
Chapter 5
101
The former study reported the effect of several screw design parameters, such as
thread shape factor, major diameter of screw and the length of engagement of the
screw. However, due to the fact that the testing was conducted on homogeneous
polyurethane foam, the effect of microstructure alignment of the anchoring material
could not be investigated. Similarly, Chatzistergos et al. (2010) conducted pullout
from polyurethane foam, in this case the samples were cut post testing to examine
the fracture surface following screw pullout. Again, since no microstructural
representation of bone was possible with these synthetic materials, clean fracture
lines were observed with materials between screw threads being removed with the
screw. Advancing on previous work, the present chapter experimentally uncovers
significantly different failure mechanisms for longitudinal and transverse screw
pullout, in addition to differences in pullout force.
Furthermore, the SPDV test demonstrated that damage and crack propagation
perpendicular to the screw axis for transverse pullout required large material
deformation prior to screw removal. This resulted in higher pull out forces than
observed for longitudinal tests, in which crack propagation occurred in a localised
region between the screw tips, facilitating screw removal with little deformation of
the surrounding bone.
In conclusion, for the first time, the present experimental chapter uncovered the
relationship between osteon alignment, crack patterns and failure force for cortical
bone screw pullout.
Page 109
Chapter 5
102
5.5 References
Ashman, R. B., Cowin, S. C., Van Buskirk, W. C. and Rice, J. C., 1984. A
continuous wave technique for the measurement of the elastic properties of
cortical bone. Journal of Biomechanics 17, 349-361.
Barber, F. A., Herbert, M. A., Beavis, R. C. and Barrera Oro, F., 2008. Suture
Anchor Materials, Eyelets, and Designs: Update 2008. Arthroscopy: The
Journal of Arthroscopic & Related Surgery 24, 859-867.
Chapman, J. R., Harrington, R. M., Lee, K. M., Anderson, P. A., Tencer, A. F. and
Kowalski, D., 1996. Factors Affecting the Pullout Strength of Cancellous
Bone Screws. Journal of Biomechanical Engineering 118, 391-398.
Chatzistergos, P. E., Magnissalis, E. A. and Kourkoulis, S. K., 2010. A parametric
study of cylindrical pedicle screw design implications on the pullout
performance using an experimentally validated finite-element model.
Medical Engineering & Physics 32, 145-154.
Cowin, S. C., 2001. Bone mechanics handbook, CRC press USA.
Cuny, C., Scarlat, M. M., Irrazi, M., Beau, P., Wenger, V., Ionescu, N. and Berrichi,
A., 2008. The Telegraph nail for proximal humeral fractures: A prospective
four-year study. J Shoulder Elbow Surg 17, 539-545.
GainesJr, R. W., 2000. The Use of Pedicle-Screw Internal Fixation for the Operative
Treatment of Spinal Disorders. The Journal of Bone and Joint Surgery
(American) 82, 1458-1458.
Kwon, B. K., Goertzen, D. J., O'Brien, P. J., Broekhuyse, H. M. and Oxland, T. R.,
2002. Biomechanical evaluation of proximal humeral fracture fixation
supplemented with calcium phosphate cement. J Bone Joint Surg Am 84,
951-61.
Owsley, K. C. and Gorczyca, J. T., 2008. Displacement/Screw Cutout After Open
Reduction and Locked Plate Fixation of Humeral Fractures. J Bone Joint
Surg Am 90, 233-240.
Pollard, J. D., Deyhim, A., Rigby, R. B., Dau, N., King, C., Fallat, L. M. and Bir, C.,
2010. Comparison of Pullout Strength between 3.5-mm Fully Threaded,
Bicortical Screws and 4.0-mm Partially Threaded, Cancellous Screws in the
Fixation of Medial Malleolar Fractures. The Journal of foot and ankle surgery
: official publication of the American College of Foot and Ankle Surgeons
49, 248-252.
Reilly, D. T. and Burstein, A. H., 1975. The elastic and ultimate properties of
compact bone tissue. Journal of Biomechanics 8, 393-396, IN9-IN11, 397-
405.
Rho, J.-Y., Kuhn-Spearing, L. and Zioupos, P., 1998. Mechanical properties and the
hierarchical structure of bone. Medical Engineering & Physics 20, 92-
102.
Seebeck, J., Goldhahn, J., Städele, H., Messmer, P., Morlock, M. M. and Schneider,
E., 2004. Effect of cortical thickness and cancellous bone density on the
holding strength of internal fixator screws. Journal of Orthopaedic Research
22, 1237-1242.
Page 110
Chapter 5
103
Content Removed Due to Copyright
5.6 Appendix 5A: Test Rig CAD Assembly Drawings
Page 111
Chapter 5
104
Content Removed Due to Copyright
Page 112
Chapter 5
105
Content Removed Due to Copyright
5.7 Appendix 5B: Computational Assessment of SPDV Test
Page 113
Chapter 5
106
Content Removed Due to Copyright
Page 114
Chapter 5
107
Content Removed Due to Copyright
Page 115
Chapter 5
108
Content Removed Due to Copyright
Page 116
Chapter 5
109
Content Removed Due to Copyright
Page 117
Chapter 5
110
Content Removed Due to Copyright
Page 118
Chapter 6
111
Chapter 6
Computational Study of Cortical Bone Screw Pullout using
Element Deletion
Abstract
A computational study of screw pullout from cortical bone has been conducted.
Finite element simulation of screw pullout, incorporating material damage and crack
propagation, was performed. Simulations revealed that a homogeneous material
model for cortical bone predicts vertical crack propagation patterns for both
longitudinal and transverse screw pullout. A biphasic multi-layered composite model
representing cortical bone microstructure was developed. A unique set of material
and damage properties was used for both transverse and longitudinal pullout
simulations, with only layer orientations being changed. Simulations predicted: (i)
Higher pullout forces for transverse pullout; (ii) Horizontal crack paths perpendicular
to screw axis for transverse pullout, whereas vertical crack paths were computed for
longitudinal pullout. Computed results agreed closely with experimental
observations of Chapter 5 in terms of pullout force and crack propagation.
6.1 Introduction
The objective of this chapter is to develop a predictive computational model capable
of replicating the experimentally observed failure modes and peak forces reported in
Chapter 5, for screw pullout. Previous computational studies, investigated pullout
with homogeneous, isotropic materials (Zhang et al. 2006; Chatzistergos et al. 2010).
The current chapter highlights the importance of modelling cortical bone as an
inhomogeneous microstructure to simulate realistic pullout failure modes, as crack
propagation is dependent upon osteon alignment. A calibrated microstructure model
for cortical bone would provide efficient evaluation of thread designs for application
specific devices.
Page 119
Chapter 6
112
6.2 Materials and Methods
All computational simulations were conducted using the finite element solver
Abaqus/Explicit 6.9 (Simulia, Providence, RI, USA). A 2D axisymmetric model was
created based on the geometry of the screws used for experimental tests. A structured
mesh consisting of 35,472 bilinear axisymmetric reduced integration elements
(CAX4R), was generated by partitioning the cortical bone geometry (Abaqus, 2009).
An element length of 50µm was used. A mesh sensitivity analysis was conducted for
element lengths of 10-200µm, with convergence of failure load and crack patterns
being observed for element lengths of 50µm or less. Internal (IE) and kinetic (KE)
energies were monitored for all simulations, to ensure that KE never exceeded 5% of
IE, as shown in Figure 6.1. This ensured inertia effects were insignificant for explicit
simulations (Abaqus, 2009).
Figure 6.1 Plot of kinetic (ALLKE) an internal (ALLIE) energy of the model during pullout
simulation.
Initially, the cortical bone was modelled as a homogeneous elasto-plastic material
(Model A, Figure 3(i)). Inelastic material behaviour was modelled using Drucker-
Prager plasticity (Table 6.1)(Drucker and Prager (1952); Derikx et al. (2011))
(Further detail of Drucker Prager model provided in Chapter 3).
Page 120
Chapter 6
113
Table 6.1 Fixed parameters for all computational models
Density (kg/m3) 1960
Drucker Prager Flow Stress Ratio (K) 1
Drucker Prager Friction Angle (β) 43.5o
Drucker Prager Dilation Angle (ψ) 0
In addition to the homogeneous Model A, a second model representing cortical bone
microstructure was developed (Model B). A layered structure consisting of two
distinctly different materials was constructed, one a stiff and strong material, the
second a compliant and weak material. This composite model was a
phenomenological representation of the complex microstructure of cortical bone.
The significant differences in layer stiffness are representative of the individual
properties of the main constituents of cortical bone, namely collagen and
hydroxyapatite. The layer thicknesses (Material 1: 0.2mm and Material 2: 0.4mm)
were based upon experimental measurements of cortical bone (Rho et al. 1998; Gong
et al. (1964); Kutz (2003)). Both materials were modelled as isotropic elasto-plastic,
again using Drucker-Prager plasticity. The layers of Model B were orientated to
represent osteon alignment for transverse and longitudinal pullout simulations, as
shown in Figure 6.2(ii) and (iii), respectively.
Figure 6.2 Boundary conditions: (i) Model A; (ii) Model B transverse osteon orientation;
(iii) Model B longitudinal osteon orientation
Feerick and McGarry J Biomech, Volume 45, Issue 9, 1 June 2012, Pages 1666–1672
Page 121
Chapter 6
114
Boundary conditions applied to all models are highlighted in Figure 6.2. Hard
surface to surface contact was included between the screw threads and bone, with a
coefficient of friction of 0.3 (Viceconti et al. (2004)). No significant changes were
computed when frictionless contact was assumed between the screw surface and the
bone.
A damage process was incorporated in the models to simulate crack initiation and
propagation. A critical plastic strain was calibrated for each material by conducting
extensive parameter studies, until simulated damage initiation patterns agreed with
experimental observations. A critical plastic displacement was also calibrated for
each material. Once an element was deformed by the critical plastic displacement it
was removed from the mesh facilitating crack propagation in the model (Further
detail provided in Chapter 3) (Abaqus (2009)).
6.3 Results
Initial simulations for Model A were conducted using a modulus of 22 GPa as this
had previously been reported experimentally for cortical bone. Results of the 22 GPa
modulus are summarised in Figure 6.3. A modulus of 22 GPa proved too stiff when
compared to experimental results for screw pullout for a transverse and longitudinal
simulation. The modulus was incrementally reduced until a modulus of 2.2 GPa
replicated the slope of the experimental data for both longitudinal and transverse
simulations (Figure 6.3).
Page 122
Chapter 6
115
Figure 6.3 Force displacement curves for: (i) Experimental standard longitudinal and
transverses pullout tests, (ii) Computational results for modulus of 22 GPa (iii)
Computational results for modulus of 2.2 GPa.
The use of a homogeneous anisotropic material model was investigated for the
simulation of the experimentally observed peak loads and crack patterns.
Simulations were conducted using commonly reported values for cortical bone from
the literature (Reilly and Burstein (1975); Rho et al. (1998)). Simulations were also
conducted using the material properties calibrated for Model B. Despite the
significantly different material properties assigned in the 1 and 2 directions, the same
crack patterns were predicted for both a longitudinal and transverse simulation, as
shown by the stiffness degradation contour plots of Figure 6.4(i). Increasing the
difference between the material properties (using Model B parameters, decreasing E2
to 800 MPa and reducing E12 to 500 MPa, shown in Table 6.2) failed to alter this
pattern. Additionally, looking at the load displacement curves of Figure 6.4(ii), we
see that the same peak loads were predicted for longitudinal and transverse
Feerick and McGarry J Biomech, Volume 45, Issue 9, 1 June 2012, Pages 1666–1672
Page 123
Chapter 6
116
simulations for both sets of material properties, in contrast to the significantly
different pullout forces observed experimentally in Chapter 5 for longitudinal and
transverse pullout tests. From these results, the necessity for a phenomenological
representation of the cortical bone microstructure was apparent; in order to capture
the key differences between longitudinal and transverse pullout forces and failure
mechanisms.
Table 6.2 Anisotropic Material Properties
Reilly et al. Model B Parameters
E1 (GPa) 22.1 22.1
E2 (GPa) 10.1 0.8
G12 (GPa) 3.3 0.5
ν 0.3 0.3
σy1 (MPa) 200 200
σy2 (MPa) 100 100
σy12 (MPa) 50 50
Page 124
Chapter 6
117
Figure 6.4 (i) Stiffness degradation for longitudinal and transverse pullout simulations with
bands of stiffness degradation localised vertically upwards from screw thread tips; (ii) Force
displacement curves for: (a) Experimental standard longitudinal and transverses pullout
tests, (b) Computational force displacement data for anisotropic material properties from
literature (c) Computational force displacement data for Model B material properties.
Feerick and McGarry J Biomech, Volume 45, Issue 9, 1 June 2012, Pages 1666–1672
Page 125
Chapter 6
118
Calibrated model parameters are summarised in Table 6.3. Force deformation curves
computed using the homogeneous Model A, are compared to standard and SPDV
experimental results in Figure 6.5A. Firstly, it should be noted that an excellent
correlation was obtained with the longitudinal results (blue curve) for a shear yield
stress of 50MPa (Table 6.3). A peak force of 2 kN was computed at 0.4mm and by
calibrating the damage initiation and evolution variables, a loading plateau and load
reduction curve similar to the experimental data was obtained. Crack initiation and
propagation was predicted vertically upwards from the screw thread tips (Figure
6.5B(i-iv)), similar to experiments of Chapter 5. The bone between the screw threads
detached as the screw was displaced upwards leaving a smoothed failure surface
with no thread definition. Next, focusing on the transverse pullout data, also Figure
6.5A (red curve), it should be noted the shear yield stress of Model A was increased
to 80MPa (Table 6.3), in order to capture the higher pullout forces recorded
experimentally. Critically, however, the damage mechanism predicted by this
homogeneous model was identical to that shown in Figure 6.5B, simulating vertical
cracks. This does not resemble the horizontal crack propagation observed
experimentally for transverse pullout tests (Chapter 5 Figure 5.17).
Table 6.3 Calibrated model parameters for Model A and B
Model A Model B
Material 1 Material 2
Ti Screw Elastic Modulus (GPa) 110
Cortical Bone Elastic Modulus (MPa) 2200 22100 800
Drucker Prager Hardening
Shear Yield Stress (MPa)
Long Trans
800 50
50 80
Damage Initiation 0.025 0.04 0.025
Damage Evolution (mm) 2.0 0.8 0.3
Over 200 simulations were conducted to calibrate a unique set of elasto-plastic and
damage material properties for Model B (Table 6.3). This property set satisfied three
Page 126
Chapter 6
119
distinct criteria for replicating experimental tests: (i) Slope of the loading curve prior
to the peak load; (ii) Peak (failure) forces; (iii) Crack propagation patterns.
Figure 6.5 (A) Model A: Drucker-Prager predicted force displacement curve versus average
experimental load data for longitudinal and transverse orientations; (B) Contour plot of
material stiffness degradation factor (SDEG) with damage evolution at four time points;
vertical crack propagation failure mode computed for both longitudinal and transverse
pullout simulations.
Feerick and McGarry J Biomech, Volume 45, Issue 9, 1 June 2012, Pages 1666–1672
Page 127
Chapter 6
120
Model B predicted horizontal crack propagation and extensive regions of material
damage for transverse pullout simulations, as shown in Figure 6.6(ii). This pattern of
damage corresponds closely to that observed experimentally (Chapter 5). Material
properties were calibrated so that the predicted force displacement curve matched
experimental measurement for the transverse test, with a peak pullout force of
3.52kN (Figure 6.6(i)). When identical material properties were used to simulate the
longitudinal pullout test, computed peak forces were on average 36.1% lower than
corresponding transverse simulations. This agreed with experimental data where a
47.5% reduction was observed. Most importantly, the mode of failure predicted for a
longitudinal simulation (Figure 6.7(ii)) was also similar to experimental observations
(Chapter 5), with vertical crack prediction.
The load data, produced by Model B, did not match the post-peak experimentally
recorded data as closely as Model A, as the plastic displacement prior to element
deletion was much lower. Increasing plastic displacement prior to deletion in
Model B resulted in higher stress localisation at the screw threads for transverse
pullout, thereby altering the path of element deletion so that horizontal cracks were
no longer predicted.
Page 128
Chapter 6
121
Figure 6.6 Model B composite pullout simulation: (i)Transverse pullout force data
compared to experimental force data with Model B simulations for increasing matrix yield
stress (50MPa, 65 MPa, 70 MPa); (ii) Contour plot of stiffness degradation factor with
failure progression for transverse pullout
Feerick and McGarry J Biomech, Volume 45, Issue 9, 1 June 2012, Pages 1666–1672
Page 129
Chapter 6
122
Figure 6.7 Model B composite pullout simulation: (i) Longitudinal pullout load data
compared to experimental load data with Model B simulations for increasing matrix yield
stress (50 MPa, 65 MPa, 70 MPa); (ii) Contour plot of stiffness degradation with failure
progression for longitudinal pullout
Feerick and McGarry J Biomech, Volume 45, Issue 9, 1 June 2012, Pages 1666–1672
Page 130
Chapter 6
123
6.4 Discussion
This chapter highlights the inability of a homogeneous material model (Model A) to
predict the crack propagation patterns during in cortical bone for transverse pullout.
Additionally, investigating the use of a homogeneous anisotropic material model
failed to predict the alternate failure loads/modes observed experimentally. A
biphasic multilayered composite model (Model B) for cortical bone is proposed,
which is capable of predicting the alternate failure modes uncovered by experimental
tests for both longitudinal and transverse pullout simulations. To the author’s
knowledge, this composite model is the first inhomogeneous model developed for
simulating cortical bone screw pullout. The model accurately predicts experimentally
measured pullout forces for both longitudinal and transverse pullout, with the latter
being significantly higher.
Developing an inhomogeneous model of cortical bone microstructure incorporating
damage demonstrates that crack propagation perpendicular to the screw axis for
transverse pullout requires large material deformation prior to screw removal. This
resulted in higher pullout forces than those predicted for longitudinal simulations; in
which vertical crack propagation occurred between the screw thread tips, with lower
deformation of bone during pullout. Simulation of alternate pullout forces and crack
propagation patterns, by varying the orientation of layers of Model B, represents a
significant advance on previous models of screw pullout. For example, previous
studies have modelled pullout from homogeneous isotropic materials without
damage prediction as a representation of bone (Zhang et al. (2004); Wirth et al.
(2010)). A study by Chatzistergos et al. (2010) modelled screw pullout using a
homogeneous material model with cohesive zone surfaces applied along predefined
paths. Thus, these previous models are not capable of predicting the alternate crack
patterns and pullout forces determined by osteon alignment relative to the screw
axis.
Homogeneous material models have been used for cortical bone (Mercer et al.
(2006); Mullins et al. (2009)). However, in the present chapter we highlight the
deficiency of homogeneous isotropic damage modelling of cortical bone for screw
pullout. An inhomogeneous, computational unit cell model highlights the necessity
Page 131
Chapter 6
124
of accounting for material orientation in large scale models as the effects are not
negligible (Mullins et al. (2007)). Use of XFEM has been reported for 2D models of
cortical bone, incorporating a representation of the microstructure of cortical bone.
These models report the altered trajectories of crack propagation depending on
osteon alignment and cement lines during cortical bone fracture (Budyn and Hoc
(2010); Abdel-Wahab et al. (2012)). Without incorporating detailed geometries of
the microstructure of cortical bone, the present chapter demonstrates that a
phenomenological representation of the cortical bone microstructure is sufficient to
capture the key differences between longitudinal and transverse pullout failure
mechanisms, namely increased pullout force and horizontal crack propagation for
transverse pullout.
The findings of the present chapter are relevant to the design and clinical
implantation of fracture fixation devices (GainesJr 2000; Kwon et al. 2002; Barber et
al. 2008; Cuny et al. 2008). Of particular relevance are devices, such as polyaxial
locking plates, where screw insertion angle can be selected during surgery (Wilkens
et al. (2008); Königshausen et al. (2012)). Screw pullout is a commonly reported
failure mode for locking plates (Owsley et al. 2008). For the first time, the present
chapter models the relationship between osteon alignment, crack patterns and failure
force for cortical bone screw pullout. These findings will provide a useful design
paradigm for application specific fracture fixation devices, offering a better
understanding of potential failure mechanisms. Using these computational and
experimental (Chapter 5) techniques, device designers can determine precise
guidelines for surgeons regarding screw orientation, screw thread design selection,
and spacing of screws. The importance of screw spacing was highlighted in Chapter
5 due to the alternate crack propagation paths observed for transverse and
longitudinal pullout. During transverse pullout, significant crack propagation was
observed perpendicular to the screw axis. Commercially available locking plates
contain a large number of screw insertion points, providing the surgeon with several
options for screw placement (Smith et al. (2007)). Placing screws too closely
together may lead to uniting of cracks and extensive regions of bone damage, adding
significant complications to revision surgery. Additionally, the techniques presented
in this chapter provide a powerful design tool for the investigation of new materials
and screw geometries (Goldhahn et al. (2006); Yánez et al. (2010)).
Page 132
Chapter 6
125
Limitations of the microstructure Model B have been identified. Firstly, while the
model provides an excellent match up to peak load, there is a sudden reduction in
load post peak, in contrast with the slower force reduction observed experimentally.
Secondly, a 2D axisymmetric representation of 3D helical screw geometry is used.
3D simulation of cortical bone fracture, using the phenomenological model
developed in the current chapter, was not possible due to excessive computational
demand. Therefore, an alternate computational modelling methodology is proposed
in Chapter 7 that is computationally viable for 3D simulations.
In conclusion, Model B, developed in the current chapter, captures the damage
mechanisms and failure modes of cortical bone during screw pullout, as observed
experimentally in Chapter 5. Additionally, the calibrated Model B is capable of
predicting both the failure modes and peak loads for longitudinal and transverse
pullout simulations. This provides a useful paradigm that can be used to evaluate
screw thread design for application specific fracture fixation.
Page 133
Chapter 6
126
6.5 References
Abaqus, 2009. Abaqus Users Manual 6.9, Dassault Systemes Simulia Corp.,
Providence
Abdel-Wahab, A. A., Maligno, A. R. and Silberschmidt, V. V., 2012. Micro-scale
modelling of bovine cortical bone fracture: Analysis of crack propagation and
microstructure using X-FEM. Computational Materials Science 52, 128-135.
Barber, F. A., Herbert, M. A., Beavis, R. C. and Barrera Oro, F., 2008. Suture
Anchor Materials, Eyelets, and Designs: Update 2008. Arthroscopy: The
Journal of Arthroscopic & Related Surgery 24, 859-867.
Budyn, É. and Hoc, T., 2010. Analysis of micro fracture in human Haversian cortical
bone under transverse tension using extended physical imaging. International
Journal for Numerical Methods in Engineering 82, 940-965.
Derikx, L. C., Vis, R., Meinders, T., Verdonschot, N. and Tanck, E., 2011.
Implementation of asymmetric yielding in case-specific finite element
models improves the prediction of femoral fractures. Computer Methods in
Biomechanics and Biomedical Engineering 14, 183-193.
Drucker, D. and Prager, W., 1952. Soil Mechanics and Plastic Analysis or Limit
Design. Quarterly of applied mathematics 10, 157.
Goldhahn, J., Reinhold, M., Stauber, M., Knop, C., Frei, R., Schneider, E. and Linke,
B., 2006. Improved anchorage in osteoporotic vertebrae with new implant
designs. Journal of Orthopaedic Research 24, 917-925.
Gong, J. K., Arnold, J. S. and Cohn, S. H., 1964. Composition of trabecular and
cortical bone. The Anatomical Record 149, 325-331.
Königshausen, M., Kübler, L., Godry, H., Citak, M., Schildhauer, T. A. and Seybold,
D., 2012. Clinical outcome and complications using a polyaxial locking plate
in the treatment of displaced proximal humerus fractures. A reliable system?
Injury 43, 223-231.
Kutz, M., 2003. Standard Handbook of Biomedical Engineering and Design,
McGraw-Hill. 8.1-8.23.
Mercer, C., He, M. Y., Wang, R. and Evans, A. G., 2006. Mechanisms governing the
inelastic deformation of cortical bone and application to trabecular bone.
Acta Biomaterialia 2, 59-68.
Mullins, L. P., Bruzzi, M. S. and McHugh, P. E., 2009. Calibration of a constitutive
model for the post-yield behaviour of cortical bone. Journal of the
Mechanical Behavior of Biomedical Materials 2, 460-470.
Mullins, L. P., McGarry, J. P., Bruzzi, M. S. and McHugh, P. E., 2007.
Micromechanical modelling of cortical bone. Computer Methods in
Biomechanics and Biomedical Engineering 10, 159-169.
Reilly, D. T. and Burstein, A. H., 1975. The elastic and ultimate properties of
compact bone tissue. Journal of Biomechanics 8, 393-396, IN9-IN11, 397-
405.
Rho, J.-Y., Kuhn-Spearing, L. and Zioupos, P., 1998. Mechanical properties and the
hierarchical structure of bone. Medical Engineering & Physics 20, 92-
102.
Smith, W. R., Ziran, B. H., Anglen, J. O. and Stahel, P. F., 2007. Locking plates: tips
and tricks. The Journal of Bone and Joint Surgery (American) 89, 2298-2307.
Viceconti, M., Ricci, S., Pancanti, A. and Cappello, A., 2004. Numerical model to
predict the longterm mechanical stability of cementless orthopaedic implants.
Med Biol Eng Comput 42, 747-753.
Page 134
Chapter 6
127
Wilkens, K. J., Curtiss, S. and Lee, M. A., 2008. Polyaxial locking plate fixation in
distal femur fractures: a biomechanical comparison. Journal of Orthopaedic
Trauma 22, 624.
Wirth, A., Mueller, T., Vereecken, W., Flaig, C., Arbenz, P., Müller, R. and van
Lenthe, G., 2010. Mechanical competence of bone-implant systems can
accurately be determined by image-based micro-finite element analyses.
Archive of Applied Mechanics 80, 513-525.
Yánez, A., Carta, J. A. and Garcés, G., 2010. Biomechanical evaluation of a new
system to improve screw fixation in osteoporotic bones. Medical Engineering
& Physics 32, 532-541.
Zhang, Q. H., Tan, S. H. and Chou, S. M., 2004. Investigation of fixation screw pull-
out strength on human spine. Journal of Biomechanics 37, 479-485.
Page 135
Chapter 6
128
Content Removed Due to Copyright
6.6 Appendix 6A: Model B Calibration
Page 136
Chapter 6
129
Content Removed Due to Copyright
Page 137
Chapter 6
130
Content Removed Due to Copyright
Page 138
Chapter 6
131
Content Removed Due to Copyright
Content Removed Due to Copyright
Page 140
Chapter 6
133
Content Removed Due to Copyright
Page 141
Chapter 7
134
Chapter 7
Anisotropic Mode Dependent Damage of Cortical Bone
using the Extended Finite Element Method (XFEM)
Abstract
Anisotropic damage initiation criteria were developed for extended finite element
method (XFEM) prediction of crack initiation and propagation in cortical bone. This
anisotropic damage model was shown to accurately predict the dependence of crack
propagation patterns and fracture toughness on mode mixity and on osteon
orientations, as observed experimentally. Three initiation criteria were developed to
define crack trajectories relative to osteon orientations and maximum principal stress
direction for single and mixed mode fracture. Alternate failure strengths for tensile
and compressive loading were defined to simulate the asymmetric failure of cortical
bone. The dependence of cortical bone elasticity and failure properties on osteon
orientation is analogous to the dependence of composite properties on fibre
orientation. Hence, two of the criteria developed in the present chapter were based
upon the Hashin damage criterion, commonly implemented in composite damage
modelling. The third criterion developed was defined in terms of the maximum
principal stress. This criterion initiated off axis crack growth perpendicular to the
direction of the maximum principal stress. This unique set of calibrated parameters
accurately predicted; (i) the relationship between fracture energy and osteon
alignment, (ii) the alternate crack patterns for both varying osteon orientations and
loading angle. Application of the developed anisotropic damage models to cortical
bone screw pullout highlights the potential application for orthopaedic device design
evaluation.
7.1 Introduction
Several studies have investigated cortical bone fracture toughness and crack
trajectory as a function of microstructural alignment of osteons. (Norman et al.
(1996); Zimmermann et al. (2009); Zimmermann et al. (2010); An et al. (2011);
Olvera et al. (2012)). The dependence of osteon orientation on screw pullout force
Page 142
Chapter 7
135
and crack propagation during screw pullout has been demonstrated in Chapter 5. In
Chapter 6, in order to simulate crack patterns and pullout force, a phenomenological
representation of cortical bone was employed. Chapter 6 implemented a process of
element deletion to simulate crack growth in computational models that was mesh
dependent and as a result required mesh densities that were not computationally
viable for 3D simulations. Other computational studies have developed geometric
representations of the microstructure of cortical bone to simulate the fracture and
establish crack trajectories (Budyn and Hoc (2010); Abdel-Wahab et al. (2012)).
Again, upscaling these detailed microstructural geometries, in macroscale
simulations of fracture, would be computationally unfeasible. The present chapter
attempts to use anisotropic damage initiation criteria, in conjunction with the XFEM
method, to model cortical bone fracture at a lower computational expense.
XFEM is a method developed for computationally modelling crack initiation and
propagation without the need for adaptive remeshing (Melenk and Babuška (1996);
Sukumar et al. (2004)). Unlike cohesive zone modelling, in which a crack path is
predefined, XFEM can be used to predict crack initiation and propagation along an
arbitrary, solution dependent path (Abaqus (2012)). A process of damage initiation
and evolution are implemented to simulate fracture opening. Damage initiation is
predicted according to a defined failure criterion. Once a crack initiates, for a
particular element, it is split into two. The fragments of the split element are free to
displace independently of each other, once the defined fracture energy is exceeded.
Contact interactions can be applied to the newly exposed surfaces, following crack
propagation, to prevent non-physical overclosure of elements that may come into
contact.
The objective of the present chapter is to develop anisotropic elasticity material
models with anisotropic damage initiation failure criterion. Implementation of these
failure criteria, in conjunction with XFEM, is used to model mixed mode fracture of
cortical bone. Screw-pullout simulations are also presented, demonstrating that
anisotropic damage criteria can be used to compute complex fracture patterns in
cortical bone at the macroscale.
Page 143
Chapter 7
136
7.2 Materials & Methods
7.2.1 Cortical Bone Failure Criteria
Three failure criteria are defined for cortical bone (equations 7.1-7.3), with a specific
crack direction being defined for each criterion, as indicated in Figure 7.1(i-iii). A
material orientation was assigned to the model geometries to represent fibre (osteon)
direction (Figure 7.1(i)). As indicated in equations 7.1-7.3, once any of the failure
criteria ( , , ) reaches a value of 1, damage is initiated for that criterion.
Cortical bone microstructure has previously been compared to a composite
consisting of a fibre and matrix (Rho et al. (1998)). The dependence of cortical bone
elasticity and failure properties on osteon orientation is analogous to the dependence
of composite properties on fibre orientation. Hence, failure criteria 1&2 are based
upon Hashin damage (Hashin (1980)), a commonly reported damage criterion for
composite failure (Matzenmiller et al. (1995); Lapczyk and Hurtado (2007)). Failure
criterion 1 (fibre failure ) is defined in terms of the axial and shear fibre
strengths relative to and (equation 7.1).When failure criterion 1 is initiated,
crack growth occurs perpendicular to the osteon direction (Figure 7.1(i)). Failure
criterion 2 (matrix failure ) is defined in terms of the axial and shear
matrix strengths relative to and (equation 7.2). When failure criterion 2 is
initiated, crack growth occurs parallel to the osteon direction (Figure 7.1(ii)). To
account for off axis crack prediction a third failure criterion ( ) was defined by
equation 7.3. The angle of the maximum principal stress relative to the fibre
direction ( ) is used to define an effective strength based upon the fibre ( ) and
matrix ( ) strengths. When the maximum principal stress ( ) exceeds the
effective strength, failure criterion 3 initiates and crack growth occurs perpendicular
to the maximum principal stress direction, as shown in Figure 7.1(iii). Cortical bone
has previously been shown to exhibit asymmetric failure strengths (Reilly and
Burstein (1975)). Therefore, alternate failure strengths were defined for fibre and
matrix failures under tension and compression, hence six failure parameters are
defined for the anisotropic damage initiation criteria for cortical bone.
Page 144
Chapter 7
137
(7.1)
(7.2)
(7.3)
Figure 7.1 Crack trajectories for each failure criteria; (i) Failure criterion 1 crack trajectory:
normal to the fibre orientation (direction 1); (ii) Failure criterion 2 crack trajectory: parallel
to the fibre orientation (direction 2); (iii) Failure criterion 3 crack trajectory: normal to the
maximum principal stress direction (an)
The failure criteria defined in equations 7.1-7.3 were implemented using the
FORTRAN user sub routine UDMGINI, in conjunction with XFEM, using Abaqus
6.12 Standard for crack propagation modelling. Regions of the mesh in which
XFEM fracture modelling was implemented are referred to as enrichment zones.
Once damage was initiated, split element fragments were free to displace
independently of each other when the defined critical fracture energy was exceeded
as outlined in Chapter 3. All simulations were conducted using anisotropic linear
elastic material properties. Hard contact was implemented on the newly exposed split
element surfaces, to prevent non-physical over closure, with a coefficient of friction
of 0.3.
Page 145
Chapter 7
138
7.2.2 Material Parameter Longitudinal Calibration
The first simulations used to calibrate the anisotropic damage model were those of
Norman et al. (1996). The dimensions and boundary conditions shown in Figure 7.2
were based upon those reported by Norman et al. (1996). The latter study reported
load displacement data for mode I and mode II tests that were used to partially
calibrate the anisotropic elasticity and anisotropic damage parameters. Simulations
were conducted using Abaqus 6.12 standard.
Figure 7.2 (A) Mode I and (B) Mode II boundary conditions for simulations of Norman et al
(1996) cortical bone fracture experiments.
7.2.3 Material Parameter Transverse/Longitudinal Calibration
Following the simulation of longitudinal experiments of Norman et al. (1996)
experimental tests of Zimmerman et al. (2009) were next simulated to provide a
complete calibration and validation of the anisotropic damage initiation criteria. The
geometry of the models of Figure 7.3 was based upon the experimental tests
performed by Zimmerman et al (summarised in Table 7-1). Mixed mode simulations
(phase angles 15o
- 90o) were simulated using an asymmetric four point bend test.
The boundary conditions applied for the asymmetric four point bend simulations are
shown in Figure 7.3(A) (He (2000)). Two rigid supports (R1 & R2) were positioned
at the base of sample, while two loading points (P1 & P2) were applied at the top of
the sample. A notch located at the centre of the sample represented a pure mode II
test. Positioning of the notch by a distance “c” from the centre of the specimen
produced a mixed mode test. As the magnitude of “c” increases, the mode mixity
Feerick et al. (2013) JMBBM, Article In Press, http://dx.doi.org/10.1016/j.jmbbm.2012.12.004
Page 146
Chapter 7
139
tends towards mode I. Simulations were conducted for longitudinally and
transversely orientated cortical bone for mode I (phase 0), mode II (phase 90), phase
15, phase 30 and phase 60. Additionally, pure mode I simulations were conducted
using a three point bend test (Figure 7.3B). Material orientations were applied to
represent longitudinal and transverse alignment of osteons, as illustrated in
Figure 7.3.
Figure 7.3 2D asymmetric four and three point bend tests (A) Asymmetric four point bend
test; (B) Three point bend test. The fibre orientation assigned to represent transverse and
longitudinal osteon alignment loadings are indicated by the transverse and longitudinal
arrows of (A) and (B).
The force data from the simulations was used to calculate the fracture toughness in
terms of the strain energy release rate (G) for cortical bone (He (2000); Marsavina
and Piski (2010)). The shear force (Q) and the bending moment (M) were
determined by the position of the loading (P). The stress intensity factors KI and KII
were calculated according to equations 7.4 & 7.5 for four point bend tests. KI
(equation 7.6) is calculated for a 3 point bend test according to the ASTM standard
EI1290-08.
Table 7.1 Geometry of samples associated with Figure 7.3
(mm) (mm) c (mm)
a 2.0 s 16.0 Phase 30 1.10
W 5.0 b1 6.0 Phase 60 0.35
a/w 0.4 b2 12.0 Phase 90 0.00
Feerick et al. (2013) JMBBM, Article In Press, http://dx.doi.org/10.1016/j.jmbbm.2012.12.004
Page 147
Chapter 7
140
4Pt Bend:
(7.4)
(7.5)
where, as shown in Figure 7.3A
3Pt Bend:
(7.6)
where, ;
as shown in Figure 7.3B
FI and FII were calculated in accordance with He (2000). As the ratio of notch height
to sample width (a/W) is 0.4 equations (7.7 & 7.8) are used to define FI and FII.
(7.7)
(7.8)
The strain energy release rate (Gc) is calculated according to equation 7.9.
(7.9)
To replicate the methods of Zimmermann et al. (2009) (plane stress calculations) a
single effective modulus (E’=E’I=E’II) was used to calculate Gc in equation 7.9.
Page 148
Chapter 7
141
7.2.4 XFEM Application: 2D and 3D Screw Pullout
Following calibration of the model using the experimental data of (Norman et al.
(1996); Zimmermann et al. (2009)), 2D & 3D simulations were conducted for
cortical bone screw pullout. The geometry of the models was taken from the
previous experimental and computational studies of screw pullout in Chapters 5 and
6. 3D simulations were conducted to investigate the effect of geometrically complex
features, such as the cutting flute and helix of self tapping screws (Figure 7.4B). The
geometry and boundary conditions applied to the 2D (35,392 elements) and 3D
(183,552 elements) models are illustrated in Figure 7.4. As crack initiation was
expected to occur in more than one region of the model, it was necessary to apply
multiple enrichment regions between each of the screw threads, as illustrated in
Figure 7.4A. 2D simulations were conducted with material orientations to represent
longitudinal and transverse screw pullout (Figure 7.4A). 3D simulations were also
conducted for varied osteon alignment (Figure 7.4B).
Figure 7.4 2D & 3D screw pullout schematic (A) 2D screw pullout boundary conditions
highlighting the material orientations for longitudinal, transverse simulations with multiple
enrichment zones (E1-E5); (B) 3D screw pullout to investigate unsymmetrical features
including helical geometry and cutting flute.
7.3 Results
7.3.1 Material Parameter Longitudinal/Transverse Calibration
Cortical bone is a transversely orthotropic material. It was necessary to conduct
parametric studies to calibrate the unique set of parameters for anisotropic elasticity
Feerick et al. (2013) JMBBM, Article In Press, http://dx.doi.org/10.1016/j.jmbbm.2012.12.004
Page 149
Chapter 7
142
(E11,E22,E12,E23) and failure strengths ( (tensile), (compression),
) for the homogenised representation of cortical bone. The simulation of the
experimental studies of Norman et al. (1996) and Zimmermann et al. (2009),
provided the validation for the calibration of these parameters. The experimental
studies of Norman et al. (1996) focussed on the fracture of longitudinal alignment of
cortical bone. Therefore, the critical parameters calibrated from the experimental
data of Norman et al. were E22, E12, (tensile), and . Following an
extensive parametric study, a unique set of values for the aforementioned parameters
was identified (Table 7.1), so that the mode I and mode II test results of Norman et
al. were accurately predicted by the model. The load displacement curve for a mode I
compact tension simulation is shown in Figure 7.5A. The anisotropic elasticity
properties provided the calibration of the initial slope, with the failure criteria
determining the failure force. The damage evolution criteria defined the post peak
load curve as unloading occurred with crack propagation. The predicted failure force
of 35 N at 0.23 mm displacement was similar to the experimental results of Norman
et al. (1996). The predicted crack patterns are illustrated in Figure 7.5A, parallel to
the direction of the osteons, with crack propagation clearly visible with the opening
of the crack surface. The predicted failure mode and load displacement curve for a
mode II simulation are shown in Figure 7.5B. Compared to the crack trajectories of a
mode I simulation, Figure 7.5B shows a slight deviation of the crack from the osteon
direction. The predicted failure force of 700 N was close to the experimentally
observed value of 675 N reported by Norman et al.
The experimental testing conducted by Zimmermann et al. (2009) provided the data
to complete the identification of a unique parameter set for cortical bone (Table 7.2).
The results of a longitudinal cortical bone bend test simulation are shown in Figure
7.6. Mode I failure resulted in vertical crack prediction parallel to the direction of
osteon alignment (Figure 7.6A). As shown in Figure 7.6 (A-D), as the phase angle
increased from mode I (0o) to mode II (90
o), the direction of crack propagation
gradually deviated from the osteon direction, so that the mode II crack direction was
almost perpendicular to the osteon direction. As cortical bone is strongest in the
osteon direction (fibre direction), the predicted fracture toughness (defined in terms
of strain energy release rate) increased with increasing phase angle (Figure 7.6E).
Page 150
Chapter 7
143
The 6 fold increase in computed fracture toughness, from mode I to mode II,
strongly correlates with the experimental data of Zimmerman et al., (also shown in
Figure 7.6E).
Figure 7.5 (A) Mode I predicted crack pattern and failure load compared to experimental
load displacement curve reported by Norman et al (1996), (B) Mode II predicted crack
pattern and failure load compared to experimental load displacement curve reported by
Norman et al (1996).
As shown in Figure 7.7 (A-D), as the phase angle increased from mode I (0o) to
mode II (90o), the direction of crack propagation gradually deviated from
perpendicular to the osteon direction, so that the mode II crack direction was parallel
to the osteon direction. This computed, mode dependent crack orientation that is
extremely similar to that observed by Zimmermann et al. (2009), as shown in Figure
7.7F. In contrast to the longitudinally aligned bend test results (Figure 7.6E), the
predicted fracture toughness for a transversely aligned sample decreased with
Feerick et al. (2013) JMBBM, Article In Press, http://dx.doi.org/10.1016/j.jmbbm.2012.12.004
Page 151
Chapter 7
144
increasing phase angle (Figure 7.7E). In this case the predicted fracture toughness
decreased by a factor of 2.6 from mode I to mode II. This reduction in fracture
toughness from mode I to mode II is similar to the experimental results of
Zimmerman et al for a transversely aligned specimen, as shown in Figure 7.7E.
Finally, it should be noted that a mesh sensitivity study was conducted to assess the
mesh independence of XFEM, as summarised in Appendix 7A.
Figure 7.6 Fracture pattern and strain energy release rate for longitudinally aligned cortical
bone for varying phase angles: (A) Mode 1 (Phase 0o); (B) Phase 15
o; (C) Phase 30
o; (D)
Phase 90o and (E) Normalised predicted strain energy release rates compared to
experimental data reported by Zimmerman et al.
Table 7.2 Assigned elasticity, strength and damage evolution parameters
Elastic
Modulus
(MPa)
Initiation Criteria
Failure Strengths
(MPa)
Evolution
Criteria
(J/m2)
E11 4500 (tensile) 150 Fibre 800
E22 2200 (tensile) 65 Matrix 300
E33 2200 280
G12 1000 (compression) 213
G23 846 84
ν23 0.3 132
Feerick et al. (2013) JMBBM, Article In Press, http://dx.doi.org/10.1016/j.jmbbm.2012.12.004
Page 152
Chapter 7
145
Figure 7.7 Fracture pattern and strain energy release rate for transversely aligned cortical
bone for varying phase angles: (A) Mode 1 (Phase 0o); (B) Phase 15
o; (C) Phase 30
o; (D)
Phase 90o and (E) Predicted strain energy release rates normalised against phase 0
o strain
energy release rate compared to experimental data reported by Zimmerman et al. (2009), (F)
Experimental crack pattern images reported for transversely aligned cortical bone fracture by
Zimmerman et al (2009) taken from Elsevier Biomaterials 30, 5877-5884.
7.3.2 2D application: Screw pullout
Having calibrated the unique property set for anisotropic elasticity and damage
initiation criteria for cortical bone (Table 7.2), using the experimental data of
Zimmermann et al. (2009) and Norman et al. (1996), the data was then used to
simulate screw pullout. The results of a 2D simulation of screw pullout for a
longitudinal and transverse screw pullout are summarised in Figure 7.8. Five
enrichment regions were applied to the mesh as cracks were expected to initiate in
multiple regions, based on previous experimental observations of Chapter 5. Cracks
primarily occurred parallel to the direction of the osteons, as shown in Figure 7.8 (i-
ii). The predicted patterns of crack propagation replicate those observed
Content Removed Due to Copyright
Feerick et al. (2013) JMBBM, Article In Press, http://dx.doi.org/10.1016/j.jmbbm.2012.12.004
Page 153
Chapter 7
146
experimentally for longitudinal and transverse screw pullout in Chapter 5. The
predicted pullout forces are summarised in Figure 7.8(iii), a significant increase in
pullout force for a transverse pullout simulation correlates well with the
experimental data of Chapter 5. The importance of subdivision of the finite element
mesh into multiple enrichment zones, was found to be critical, for accurate failure
prediction of multiple cracks, as discussed in Appendix 7B.
Figure 7.8 Fracture pattern predicted by 2D screw pullout simulation compared to the
experimental failure mechanisms observed for (i) Longitudinally and (ii) Transversely
orientated cortical bone; (iii) Experimental and computational pullout forces for longitudinal
and transverse screw pullout.
The results of a 3D simulation of screw pullout for a longitudinal, transverse and 45
degree screw pullout simulation are summarised in Figure 7.9. Results for the crack
directions were generally the same as 2D simulations, all cracks occurred parallel to
the direction of the osteons. The location of crack initiation was influenced by the
Feerick et al. (2013) JMBBM, Article In Press, http://dx.doi.org/10.1016/j.jmbbm.2012.12.004
Page 154
Chapter 7
147
helical geometry of the screw. For all simulations, cracks were not predicted to
initiate in the region of the cutting flute.
Figure 7.9 Crack pattern predicted for 3D screw pullout simulation for (i) longitudinally,
(ii) transversely and (iii) 45 degree orientated cortical bone.
7.4 XFEM Application: 3D Proximal Humeral Fracture Fixation
7.4.1 Materials and Methods
The 3D models generated for an unreinforced locking plate repaired three part
fractured humerus in Chapter 4, were used for a macroscale device level application
of the damage criteria, calibrated for cortical bone, in the current chapter. The model
set up is shown in Figure 7.10. The osteon orientation applied to the model is also
shown in Figure 7.10A. Osteon direction was applied parallel to the central axis of
the medullary canal, in the shaft of the humerus (Rho et al. (1998)). A
circumferential osteon orientation was applied to articular and greater tuberosity
fragments of the proximal humerus (Heřt et al. (1994); Rho et al. (1998)). A pressure
load was applied to represent 90 degree arm abduction at the glenohumeral joint. The
applied pressure load was ramped up linearly. Simulations were conducted for a
metallic (titanium (modulus of 110 GPa)) and CFPEEK locking plate (modulus of 18
GPa). Both materials were modelled as linear elastic, as was the case in Chapter 4.
Feerick et al. (2013) JMBBM, Article In Press, http://dx.doi.org/10.1016/j.jmbbm.2012.12.004
Page 155
Chapter 7
148
7.4.2 Results
Damage was initiated for a metallic plate at a load of 411.42 N. A higher force of
573.9 N (a factor of 1.39 higher) was required to initiate damage in a CFPEEK
repaired humerus. The predicted crack patterns are shown for each of the fracture
fragments, for both metallic and CFPEEK devices (Figures 7.11-7.13). The
glenohumeral loading was linearly increased to 1.28 kN to compare the level of
crack growth in each of the fragments. The crack patterns predicted in the articular
fragment of the humerus are shown in Figure 7.11. The exterior view of the articular
fragment shows significantly higher crack growth parallel to the applied osteon
direction compared to that predicted for a CF PEEK locking plate (Figure 7.11A and
B)). Higher levels of crack growth were also observed for a titanium locking plate on
the interior surface of the articular fragment. Additional cracks were predicted at the
cortical bone central stabilising screw interface (Figure 7.11C). Damage was not
initiated at this location for a CF PEEK locking plate (Figure 7.11D). The predicted
crack patterns for the greater tuberosity fracture fragment are shown in Figure 7.12.
The key difference between locking plate materials in this case was that crack
prediction occurred on different surfaces of the greater tuberosity. Cracks were
predicted on the interior surface of the greater tuberosity for a titanium locking plate,
in contrast with crack prediction on the external surface of the greater tuberosity for
a CFPEEK locking plate. No difference was observed in the crack pattern prediction
for the humeral shaft fragment (Figure 7.13). Cracks were predicted perpendicular to
the osteon direction in the same locations on the external surface of the humerus for
both titanium and CF PEEK locking plates.
Page 156
Chapter 7
149
Figure 7.10 Loading and boundary conditions of 3D locking plate proximal humeral
fracture fixation; (A) Pressure load applied to simulate 90 degree arm abduction. Osteon
orientations applied to humerus highlighted on outer surface of bone; (B) Section view of
humerus highlighting loading relative to locking plate position.
These initial simulations of three part proximal humeral fracture fixation under
glenohumeral loading provided some insight into the critical locations at which
screw pullout/pushout may occur. Comparison of titanium and CFPEEK materials
highlight that the risk of screw pullout/pushout is even higher for stiffer materials,
relative to the stiffness of cortical bone (in this case titanium). Although the
geometry of the screws of the locking plate did not contain detailed thread shape
geometry, it did highlight the potential for future application of the computational
methodologies of this chapter in the development and design evaluation of the next
generation of orthopaedic devices.
Page 157
Chapter 7
150
Figure 7.11 Crack initiation and propagation in the articular fragment for glenohumeral load
of 1.28 kN; (A-B) Exterior view of articular fragment for titanium and CF PEEK locking
plates respectively; (C-D) Interior view of articular fragment for titanium and CF PEEK
locking plates respectively.
Page 158
Chapter 7
151
Figure 7.12 Crack initiation and propagation in the greater tuberosity fragment for
glenohumeral load of 1.28 kN; (A-B) Exterior view of greater tuberosity fragment for
titanium and CF PEEK locking plates respectively; (C-D) Interior view of greater tuberosity
fragment for titanium and CF PEEK locking plates respectively.
Page 159
Chapter 7
152
Figure 7.13 Crack initiation and propagation in the humeral shaft fragment for
glenohumeral load of 1.28 kN; (A) Exterior view of humeral shaft fragment for titanium
locking plate; (B) Exterior view of articular fragment for CF PEEK locking plate.
7.5 XFEM Application: CF PEEK orthopaedic screws
The results of the current chapter combined with Chapter 4 content, suggests the risk
of screw pullout / pushout is reduced when CFPEEK devices are used. Therefore,
simulations using the XFEM method were conducted to investigate the suitability of
CFPEEK for direct replacement of metallic designs. CFPEEK can be injection
moulded, therefore, the same geometries of metallic screws could be replicated. An
investigation of the performance of CFPEEK was conducted using the 2D screw
pullout models, presented in the current chapter. The material properties assigned to
the CFPEEK were sourced from the literature for 30 % CF reinforced PEEK, the
properties are summarised in Table 7.3 below (Kurtz and Devine (2007)).
Page 160
Chapter 7
153
Table 7.3 Material properties of carbon fibre reinforced PEEK
Modulus of
Elasticity (GPa)
Ultimate Strength
(MPa)
Poisson’s Ratio
30 % Carbon
Fibre PEEK
20
170
0.4
The results for longitudinal pullout simulations are shown in Figure 7.14 for varying
thread depths. For all screw depths, damage was initiated, not only in the cortical
bone but also in the CF reinforced PEEK. This was due to the stress concentrations
at the base of the screw threads as they merge into the central shaft. This design
feature was not an issue for metals as the ultimate strengths were sufficiently higher
than cortical bone. Therefore, when designing with CF reinforced PEEK care must
be taken to avoid features that may give rise to such stress concentrations.
Figure 7.14 Longitudinal screw pullout simulations from cortical bone with CF reinforced
PEEK screws for varying screw depths; (A) 5 threads of the screw were embedded in
cortical bone; (B) 4 threads of the screw were embedded in cortical bone; (C) 3 threads of
the screw were embedded in cortical bone; (D) 2 threads of the screw were embedded in
cortical bone; (E) 1 thread of the screw was embedded in cortical bone.
Page 161
Chapter 7
154
7.6 Discussion
Cortical bone has a distinct aligned microstructure with microscale geometric
features, determining the fracture patterns at the macroscale. Many previous
computational studies investigating the damage and fracture of cortical bone have
focussed on microscale simulations, incorporating details of the cortical bone
microstructure (Budyn and Hoc (2010); Abdel-Wahab et al. (2012)). Upscaling of
such a microstructural modelling approach to simulate macroscale fracture patterns
(e.g. crack propagation during screw pullout) is not currently feasible due to
excessive computational demand. In the present chapter an anisotropic damage
initiation criteria is developed for the extended finite element method (XFEM)
prediction of crack initiation and propagation in cortical bone. This anisotropic
damage model is shown to accurately predict the dependence of crack propagation
patterns and fracture toughness on mode mixity and on osteon orientations, as
reported in previous experimental studies (Norman et al. (1996); Zimmermann et al.
(2009)). This modelling approach is also used to simulate cortical bone failure
mechanisms during screw pullout. Crack propagation patterns are found to
correspond closely to the experimental observations of Chapter 5, for longitudinal
and transverse osteon orientation.
The anisotropic behaviour of cortical bone has been well established (Reilly and
Burstein (1975); Cowin (2001)). Previous studies have investigated the fracture
toughness of cortical bone (Norman et al. (1996); Feng et al. (2000); Zimmermann
et al. (2009); Zimmermann et al. (2010); An et al. (2011); Olvera et al. (2012)).
These studies have reported a distinct relationship between the fracture toughness
and microstructure alignment. Based on the findings of Zimmermann et al. (2009),
Feng et al. (2000) and the present chapter content, mode II fracture toughness for
longitudinally aligned cortical bone is higher than mode I. Feng et al. (2000) also
reported that Mode II fracture toughness was higher than Mode I for transversely
aligned cortical bone which conflicts with the opposing trend reported by
Zimmermann et al. (2009) and by the present chapter. Zimmermann et al. (2009)
attributed this to the fact that Feng et al. (2000) generated large notches in samples
relative to sample thickness. Similar to the dependence in fracture toughness on
osteon orientation in cortical bone, several natural/manmade composites exhibit a
Page 162
Chapter 7
155
dependence of mechanical and fracture properties on fibre alignment (Jernkvist
(2001); Kondo et al. (2011)). The Hashin damage criteria has been developed to
predict anisotropic damage in fibre reinforced laminates (Hashin (1980)). As these
laminates are fibre reinforced, damage initiation predominately occurs in the matrix,
with the crack trajectories being dependent on fibre direction. This is comparable to
the trend observed for cortical bone, with crack patterns influenced by osteon
orientation. Hence, the Hashin damage type criteria are an appropriate selection for
the damage initiation criteria (Failure Index1&2) of the current chapter. The Hashin
type failure criteria (1&2), used in the present chapter, capture the influence of
osteon orientation on crack direction. Additionally, the current chapter implements
alternate strengths in tension and compression, as motivated by previous
experimental results for cortical bone (Bayraktar et al. (2004); Mercer et al. (2006)).
The aforementioned Hashin type criteria, limit crack propagation to directions
parallel or perpendicular to osteons. However, based on the experimental finding of
Zimmermann et al. (2009), it is clear that the binary crack pattern that would be
predicted by the Hashin type criteria would fail to predict the sensitivity of crack
propagation to mode mixity, hence a third failure criterion must be implemented.
The third failure criterion directs crack growth perpendicular to the direction of the
maximum principal stress. This criterion is responsible for off axis crack growth
prediction for the mixed mode case studies of four point bend and screw pullout.
Thus, the combined failure criteria of the present chapter predicts; (i) the relationship
between fracture energy and osteon alignment, (ii) the alternate crack patterns for
both varying osteon orientations and loading angle, (iii) distinctive patterns of crack
propagation during screw pullout.
Previous models of screw pullout from cortical and cancellous bone have been
reported (Zhang et al. (2004); Wirth et al. (2010)). However, damage initiation and
crack propagation were not incorporated into these models. A study by Chatzistergos
et al. (2010) modelled screw pullout using predefined cohesive zone surfaces to
simulate damage. XFEM offers an advance on this approach, as it eliminates the
requirement to predefine the path of the crack. The experimental observations of
Chapter 6 demonstrate significantly different failure mechanisms for longitudinal
and transverse screw pullout, in addition to differences in pullout force, highlighting
the importance of a modelling approach that is not limited to predefined crack paths.
Page 163
Chapter 7
156
In order to predict crack paths during screw pullout a 2D computational
microstructure model with damage initiation and element removal was developed in
Chapter 6. Both crack paths and predicted pull-out forces were found to correlate
strongly with experimental observations. However, this modelling approach is
dependent on the phenomenological representation of the microstructural features of
cortical bone and on the resolution of the finite element mesh. Hence, the extension
of this approach to 3D simulations is not computationally feasible. In contrast, the
present chapter demonstrates that the XFEM modelling approach can reliably predict
crack propagation patterns as a function of osteon orientation for both 2D and 3D
screw pullout simulations. The ability to conduct 3D simulations of screw pullout
allows for the investigation of several unsymmetrical features of screws such as the
helix and the cutting flute of a self tapping screw.
Chapter 4 evaluated the performance of metallic and CFPEEK devices for fracture
fixation, including locking plates, intramedullary rods and k-wires. The
computational study of Chapter 4 relied on the identification of peak stress
concentrations as indicators of potential failure. The methodologies developed in the
current chapter, applied to an unreinforced locking plate fixation of a humerus,
highlights the potential future application in designing the next generation of
orthopaedic fracture fixation devices. The modelling technique could also be applied
across a range of applications including suture anchors and a range of internal and
external fracture fixation devices (GainesJr (2000), Kwon et al. (2002) Barber et al.
(2008); Cuny et al. (2008)). In summary, the implementation of XFEM for device
evaluation offers a powerful design tool. It can be used to evaluate, not only the
design of the device but also the suitability of the site chosen to anchor the device.
In conclusion, the predicted transition in crack direction and fracture toughness as a
function of osteon orientation and mode mixity, correspond closely with the results
of previous experimental studies of cortical bone (Norman et al. (1996);
Zimmermann et al. (2009)) and screw pullout (Chapter 5). The techniques developed
in the current chapter are not limited to applications that consider cortical bone, but
rather any composite material containing a known microstructural alignment. To the
author’s knowledge, this chapter is the first to implement anisotropic damage
initiation criteria in conjunction with XFEM for cortical bone. The proposed
Page 164
Chapter 7
157
homogenised representation of cortical bone, coupled with anisotropic damage
initiation criteria of the present chapter, predict: (i) the relationship between fracture
energy and osteon alignment; (ii) the alternate crack patterns for both varying osteon
orientations and loading angle; (iii) distinctive patterns of crack propagation during
screw pullout.
Page 165
Chapter 7
158
7.7 References
Abaqus, 2012. Abaqus Users Manual 6.12, Dassault Systemes Simulia Corp.,
Providence.
Abdel-Wahab, A. A., Maligno, A. R. and Silberschmidt, V. V., 2012. Micro-scale
modelling of bovine cortical bone fracture: Analysis of crack propagation and
microstructure using X-FEM. Computational Materials Science 52, 128-135.
An, B., Liu, Y., Arola, D. and Zhang, D., 2011. Fracture toughening mechanism of
cortical bone: An experimental and numerical approach. Journal of the
Mechanical Behavior of Biomedical Materials 4, 983-992.
Barber, F. A., Herbert, M. A., Beavis, R. C. and Barrera Oro, F., 2008. Suture
Anchor Materials, Eyelets, and Designs: Update 2008. Arthroscopy: The
Journal of Arthroscopic & Related Surgery 24, 859-867.
Bayraktar, H. H., Morgan, E. F., Niebur, G. L., Morris, G. E., Wong, E. K. and
Keaveny, T. M., 2004. Comparison of the elastic and yield properties of
human femoral trabecular and cortical bone tissue. Journal of Biomechanics
37, 27-35.
Budyn, É. and Hoc, T., 2010. Analysis of micro fracture in human Haversian cortical
bone under transverse tension using extended physical imaging. International
Journal for Numerical Methods in Engineering 82, 940-965.
Chatzistergos, P. E., Magnissalis, E. A. and Kourkoulis, S. K., 2010. A parametric
study of cylindrical pedicle screw design implications on the pullout
performance using an experimentally validated finite-element model.
Medical Engineering & Physics 32, 145-154.
Cowin, S. C., 2001. Bone mechanics handbook, CRC press USA.
Cuny, C., Scarlat, M. M., Irrazi, M., Beau, P., Wenger, V., Ionescu, N. and Berrichi,
A., 2008. The Telegraph nail for proximal humeral fractures: A prospective
four-year study. J Shoulder Elbow Surg 17, 539-545.
Feng, Z., Rho, J., Han, S. and Ziv, I., 2000. Orientation and loading condition
dependence of fracture toughness in cortical bone. Materials Science and
Engineering: C 11, 41-46.
GainesJr, R. W., 2000. The Use of Pedicle-Screw Internal Fixation for the Operative
Treatment of Spinal Disorders. The Journal of Bone and Joint Surgery
(American) 82, 1458-1458.
Hashin, Z., 1980. Failure Criteria for Unidirectional Fiber Composites. Journal of
applied mechanics 47, 329-334.
He, M., 2000. Asymmetric four-point crack specimen. Journal of applied mechanics
67, 207.
Heřt, J., Fiala, P. and Petrtýl, M., 1994. Osteon orientation of the diaphysis of the
long bones in man. Bone 15, 269-277.
Jernkvist, L. O., 2001. Fracture of wood under mixed mode loading: II.
Experimental investigation of Picea abies. Engineering Fracture Mechanics
68, 565-576.
Kondo, A., Sato, Y., Suemasu, H. and Aoki, Y., 2011. Fracture Resistance of
Carbon/Epoxy Composite Laminates under Mixed-Mode II and III Failure
and Its Dependence on Fracture Morphology. Advanced Composite Materials
20, 405-418.
Kurtz, S. M. and Devine, J. N., 2007. PEEK biomaterials in trauma, orthopedic, and
spinal implants. Biomaterials 28, 4845-4869.
Page 166
Chapter 7
159
Kwon, B. K., Goertzen, D. J., O'Brien, P. J., Broekhuyse, H. M. and Oxland, T. R.,
2002. Biomechanical evaluation of proximal humeral fracture fixation
supplemented with calcium phosphate cement. J Bone Joint Surg Am 84,
951-61.
Lapczyk, I. and Hurtado, J. A., 2007. Progressive damage modeling in fiber-
reinforced materials. Composites Part A: Applied Science and Manufacturing
38, 2333-2341.
Marsavina, L. and Piski, T., 2010. Bimaterial Four Point Bend Specimen with Sub-
Interface Crack. International Journal of Fracture 164, 325-332.
Matzenmiller, A., Lubliner, J. and Taylor, R. L., 1995. A constitutive model for
anisotropic damage in fiber-composites. Mechanics of Materials 20, 125-152.
Melenk, J. M. and Babuška, I., 1996. The partition of unity finite element method:
Basic theory and applications. Computer Methods in Applied Mechanics and
Engineering 139, 289-314.
Mercer, C., He, M. Y., Wang, R. and Evans, A. G., 2006. Mechanisms governing the
inelastic deformation of cortical bone and application to trabecular bone.
Acta Biomaterialia 2, 59-68.
Norman, T. L., Nivargikar, S. V. and Burr, D. B., 1996. Resistance to crack growth
in human cortical bone is greater in shear than in tension. Journal of
Biomechanics 29, 1023-1031.
Olvera, D., Zimmermann, E. A. and Ritchie, R. O., 2012. Mixed-mode toughness of
human cortical bone containing a longitudinal crack in far-field compression.
Bone 50, 331-336.
Reilly, D. T. and Burstein, A. H., 1975. The elastic and ultimate properties of
compact bone tissue. Journal of Biomechanics 8, 393-396, IN9-IN11, 397-
405.
Rho, J.-Y., Kuhn-Spearing, L. and Zioupos, P., 1998. Mechanical properties and the
hierarchical structure of bone. Medical Engineering & Physics 20, 92-
102.
Sukumar, N., Huang, Z. Y., Prévost, J. H. and Suo, Z., 2004. Partition of unity
enrichment for bimaterial interface cracks. International Journal for
Numerical Methods in Engineering 59, 1075-1102.
Wirth, A., Mueller, T., Vereecken, W., Flaig, C., Arbenz, P., Müller, R. and van
Lenthe, G., 2010. Mechanical competence of bone-implant systems can
accurately be determined by image-based micro-finite element analyses.
Archive of Applied Mechanics 80, 513-525.
Zhang, Q. H., Tan, S. H. and Chou, S. M., 2004. Investigation of fixation screw pull-
out strength on human spine. Journal of Biomechanics 37, 479-485.
Zimmermann, E. A., Launey, M. E., Barth, H. D. and Ritchie, R. O., 2009. Mixed-
mode fracture of human cortical bone. Biomaterials 30, 5877-5884.
Zimmermann, E. A., Launey, M. E. and Ritchie, R. O., 2010. The significance of
crack-resistance curves to the mixed-mode fracture toughness of human
cortical bone. Biomaterials 31, 5297-5305.
Page 167
Chapter 7
160
7.8 Appendix 7A: Mesh Sensitivity
A mesh sensitivity study was conducted to investigate the mesh independence of
crack propagation using the XFEM method. It is clear from the images of Figure
7A.1 that the optimum element length must be identified. A low density mesh with
large element lengths may slow the rate of crack turning and the prediction of steady
state crack trajectory (Figure 7A.1(i)). A structured mesh should be implemented in
the regions in which crack initiation occurs. Generating a structured quad mesh
surrounding the crack tip (Figure 7A.1(ii)) leads to a correct prediction of crack
orientation. A further increase in mesh density has no effect on the predicted failure
mode or failure load (Figure 7A.1(iii)).
Figure 7A.1 Mesh sensitivity study for (i) unstructured mesh; (ii) optimum structure mesh
(iii) higher density structured mesh
7.9 Appendix 7B: XFEM Observations
Some key observations associated with the use of XFEM are summarised in
Figure 7B.1. Surfaces at which cracks are expected to reach completion by exiting
the mesh should not contain single nodes of any element (Figure 7B.1A(i)). If the
crack reaches the point of a single node and the element cannot be split then the
Feerick et al. (2013) JMBBM, Article In Press, http://dx.doi.org/10.1016/j.jmbbm.2012.12.004
Page 168
Chapter 7
161
crack will alter its’ trajectory, as highlighted in Figure 7B.1A(ii-iii). This results in
unrealistic force predictions as additional work is required to grow the crack
horizontally. Another example of cracks reaching the end of an enrichment zone but
failing to exit the mesh is highlighted in Figure 7B.1B(i). As a result of the crack
reaching the end of the enrichment zone and failing to exit the mesh, the crack tip at
the neighbouring thread alters trajectory. The crack is forced horizontally until it is
free to return to vertical crack growth again (Figure 7B.1B(ii)), resulting in
additional work reported in the force predictions. Additionally, it was noted that the
use of multiple enrichment zones can lead to issues with cracks bridging between
neighbouring enrichment zones (Figure 7B.1C(i)). This can result in elevated force
predictions as the resulting fracture surfaces resist further crack growth (Figure
7B.1C(ii)). All of the highlighted issues of Figure 7B.1 were overcome with the
implementation of a structured mesh.
Figure 7B.1 XFEM crack patterns influenced by the mesh and enrichment regions; (A)
Single node located on surface of mesh, (B) Altered crack trajectory due to crack failing to
exit mesh, (C) Bridging of cracks between neighbouring enrichment regions resulting in
elevated failure force predictions
Feerick et al. (2013) JMBBM, Article In Press, http://dx.doi.org/10.1016/j.jmbbm.2012.12.004
Page 169
Chapter 7
162
Content Removed Due to Copyright
7.10 Appendix 7C: 2D FORTRAN User Subroutine
Page 170
Chapter 7
163
Content Removed Due to Copyright
Page 171
Chapter 7
164
Content Removed Due to Copyright
7.11 Appendix 7D: 3D FORTRAN User Subroutine
Page 172
Chapter 7
165
Content Removed Due to Copyright
Page 173
Chapter 7
166
Content Removed Due to Copyright
Page 174
Chapter 8
167
Chapter 8
Concluding Remarks
The field of orthopaedic fracture fixation covers a vast range of fracture types with a
broad range of fixation devices to select from. Optimal devices or fracture fixation
techniques have not been identified for particular fractures. Selection of
device/fixation technique is made at the discretion of the associated orthopaedic
surgeon. For example, deciding between a locking plate and an intramedullary rod
for a proximal humeral fracture fixation. Additionally, there may be a range of
surgical choices for a given device regarding how many screws to use to anchor the
device and the spacing of these screws. (Wilkens et al. (2008); Königshausen et al.
(2012)). Surgeons are not provided with device designer guidelines offering
biomechanical motivation for selecting a device or anchor location. Rather, surgical
selections are generally based upon clinical reports that offer scales of patient
satisfaction/functionality, or the devices that were used during surgical training of
the orthopaedic surgeon. There is a significant need for greater biomechanical input
into surgical decisions, with more direct communication between surgeons and
device designers. The primary fracture application considered in this thesis is
complex three part fractures of the proximal humerus, with a particular focus on
orthopaedic screw pullout. In order to develop future next generation devices capable
of surpassing their predecessors, in terms of lifespan and reversion to intact
functionality, it is necessary to ascertain the design flaws and failure mechanisms of
existing devices. Most importantly, an in-depth understanding of the complex
fracture mechanics and failure mechanisms of the cortical bone is integral to the
successful design and analysis of orthopaedic devices. Such an enhanced
understanding of bone biomechanics is critical not just for device design, but also
from a clinical perspective in terms of device selection. Therefore, the work of this
thesis aimed to explore the mechanisms of cortical bone fracture through the
symbiotic development of experimental studies and computational finite element
modelling studies. Experimental studies provided novel visual insight with regard to
the relationship between crack patterns, screw pullout force and microstructural
alignment of cortical bone. Development of computational models that are capable
of capturing these relationships offers significant potential in the development of
Page 175
Chapter 8
168
future next generation devices. One such example is the evaluation of emerging
biomaterials such as CFPEEK as a suitable alternative to currently used metallic
materials.
The study of Chapter 4, for the first time, computationally compared four fracture
fixation techniques for proximal humerus fractures, with a specific focus on cortical
bone stress, fracture fragment displacement, cement reinforcement and device
material properties at 90o arm abduction. Previous studies of proximal humeral
fracture repair were predominately clinical or experimental, with very few studies
using finite element analysis to evaluate proximal humeral fracture fixation. For
example, the study reported by Maldonado et al. (2003) conducted finite element
simulations on a plate fixation of a two part humeral fracture by representing fracture
lines as areas of low stiffness, providing limited insight into relative fracture
fragment motion. However, in Chapter 4, finite sliding hard contact was
implemented between fracture fragments that facilitated modelling of fracture line
opening in addition to relative sliding between fracture fragments. This provided a
more accurate representation of the interaction between fracture fragments following
repair. Simulations predicted that reinforced fixation led to a reduction in relative
sliding between fracture fragments in addition to a reduction in fracture line opening
under cyclic loading at the glenohumeral interface. This finding was supported by
previous clinical and experimental observations. (Kwon et al. (2002); Mathison et al.
(2010); Rose et al. (2010); Neviaser et al. (2011)). Elevated stress concentrations,
noted at the screw cortical bone interface, also provided insight with regard to the
commonly reported screw pullout/pushout (Owsley and Gorczyca (2008)). The
identification of these stresses supported the fact that overly stiff metallic devices,
compared to the stiffness of cortical bone (Lill et al. (2003)), leads to block pullout
of screws or screw penetration into the glenoid (Owsley and Gorczyca (2008);
Clavert et al. (2010); Dheerendra et al. (2011)). The magnitude of these stresses were
computed in the range of the ultimate strength of osteoporotic cortical bone
(Dickenson et al. (1981)).
The use of lower stiffness materials, closer to the modulus of cortical bone, such as
carbon fibre reinforced PEEK (CFPEEK), are proposed in Chapter 4 as an
alternative to metallic devices for proximal humeral fracture repair. Composite
Page 176
Chapter 8
169
materials have previously been proposed for orthopaedic fracture fixation (Yánez et
al. (2010); Bougherara et al. (2011)). Simulations of a CFPEEK locking plate and
IM rod highlight the significant reduction in stresses at the screw cortical bone
interface that may lower the incidence of screw pullout/pushout. In addition to
reducing stress concentrations at the screw cortical bone interface, simulations
demonstrate that the relative displacement of fracture fragments is comparable to
that of metallic equivalent devices. Therefore the use of the more compliant
CFPEEK material to reduce stress concentrations within the humerus was predicted
not to compromise device stability in terms of fracture line displacement. Composite
materials have promising prospects in the field of orthopaedic fracture fixation due
to the fact that FDA approval has been established for these materials in recent years
and several grades are available. In Table 8.1 the material properties of three grades
of polyetheretherketone (PEEK) are summarised. Table 8.1 highlights the wide range
of material properties available and thus the potential to replace metallic devices that
are currently overly stiff, significantly altering the stress distribution within whole
bones compared to the intact case.
Table 8.1 Unreinforced and reinforced PEEK mechanical properties (Kurtz and Devine
(2007))
Unreinforced
PEEK
30%
Short CF
reinforced
PEEK
68%
Continuous CF
reinforced
PEEK
Flexural Modulus (GPa) 4 20 135
Tensile Strength (MPa) 93 170 >2000
Tensile Elongation (%) 30 - 40 1 - 2 1
Poisson’s ratio 0.36 0.4 0.38
Due to the computationally observed trend of stress concentrations occurring at the
screw cortical bone interface and the clinically reported failures of screw anchored
devices, it was clear that the cortical bone failure mechanisms during screw pullout
merited further study. The development of a novel experimental test rig (screw
pullout damage visualisation (SPDV) test of Chapter 5), facilitating visualisation of
failure modes in real time during pullout, offered unprecedented insight into the
Page 177
Chapter 8
170
relationship between osteon orientation, screw pullout strength and crack patterns.
Transverse pullout (osteons perpendicular to screw axis) was observed to require a
pullout force a factor of two higher than a longitudinal pullout (osteons parallel to
screw axis). Transverse pullout also required significantly higher levels of
deformation and crack growth perpendicular to the axis of screw, in order to be
removed from the bone. The load data recorded during an SPDV tests was validated
by the load displacement data from standard pullout tests. The SPDV test rig is not
limited to investigating the failure mechanisms of cortical bone during screw pullout.
The rig could be used to investigate a multitude of anchors in a variety of
biomaterials such as cancellous bone, bone cement or combined layers of these
materials. The experimental testing of Chapter 5 focused on monotonic screw
pullout; however the loading application could be altered to investigate the fatigue
performance of anchors and materials to investigate loosening. The loading
configuration could also be modified from simply tensile to compressive for screw
pushout or off axis loading to represent toggling of screws. The SPDV test rig is also
a relatively low cost rig compared to other studies that utilised micro CT scanners to
image failure mechanisms (Wirth et al. (2010)). Such a micro CT based approach
also prohibits the testing of metallic screws/components due to resultant imaging
artefacts.
The relationship uncovered between osteon orientation, crack patterns and pullout
force during cortical bone screw pullout (by the SPDV test of Chapter 5) provided
strong motivation, to develop a predictive computational model with the capability
of capturing this relationship. The computational models generally under predict the
screw pullout strength compared to experimental test which provides an inbuilt
factor of safety. The development of a computational model, capable of predicting
both pullout force and crack propagation patterns as a function of osteon-screw
alignment, would provide a powerful design tool for development and evaluation of
new materials and screw geometries (Goldhahn et al. (2006); Yánez et al. (2010)).
Previous computational studies of screw pullout have modelled bone as an elasto-
plastic continuum without any modelling of fracture or damage (Zhang et al. (2004);
Wirth et al. (2010)). Chatzistergos et al. (2010) modelled pullout from solid rigid
polyurethane foam using a homogeneous material model with cohesive zone surfaces
applied along predefined paths. This type of modelling approach would not be
Page 178
Chapter 8
171
capable of predicting the crack patterns observed during a transverse pullout, which
involved significant crack growth perpendicular to the central screw axis. Therefore
it was clear that a method of fracture modelling would have to be selected that did
not require predefined crack growth. The first computational method implemented
for modelling screw pullout was a homogeneous elasto-plastic continuum with
damage initiation according to an equivalent plastic strain invariant and the element
deletion method was used to model subsequent crack propagation as outlined in
Chapter 6. This modelling approach predicted the same crack patterns for
longitudinal and transverse pullout simulations. Hence, in order to improve on this
model, a phenomenological representation of the microstructure of cortical bone was
required, in order to replicate the different experimentally observed failure loads and
crack patterns for longitudinal and transverse screw pullout. This model consisted of
multiple layers of two distinctly different materials with different stiffness, yield
strengths and damage initiation and evolution criteria. This biphasic multi-layered
composite model developed for cortical bone, accurately predicted the significantly
higher pullout forces during transverse screw pullout. Additionally, this model
predicted the significantly different crack growth directions for longitudinal and
transverse crack growth. The biphasic multi-layered composite model provides a
useful design paradigm for application specific fracture fixation devices, offering a
better understanding of potential failure mechanisms. As previously mentioned,
commercially available locking plates contain a range of locations for device
anchoring (Smith et al. (2007)). Distribution of screws too closely together,
particularly for transverse cortical bone orientation, may lead to uniting of cracks
and extensive regions of bone damage, adding significant complications to revision
surgery. Using the methodologies developed, more precise guidelines regarding
screw orientation, screw thread design selection, and spacing of screws can be
provided to surgeons.
Computational crack propagation was predicted using the element deletion
technique, by the removal of several adjoining elements. The distinct geometric
representation of the microstructure of the biphasic multi-layered composite guided
the paths of element deletion. Application of the biphasic multi-layered composite
model to 3D simulations was not possible due to excessive computational demand.
Therefore an alternate computational approach that eliminated the need for explicit
Page 179
Chapter 8
172
geometric representation of the microstructure was developed in Chapter 7.
Anisotropic damage initiation criteria, with associated crack propagation directions,
were implemented using the extended finite element method (XFEM) to simulate
direction dependent crack propagation. It is demonstrated in Chapter 7 that it is
sufficient to model cortical bone as a homogeneous, anisotropic elastic continuum
with a known osteon orientation, without the need for a phenomenological
representation of cortical bone microstructure. XFEM involves splitting of elements
to simulate crack propagation rather than removing elements from the mesh as
implemented in the microstructural model of Chapter 6. Although the element
deletion method of Chapter 6 was limited to 2D applications, it demonstrated the
importance of the composite nature of cortical bone in crack propagation patterns.
Hence, this motivated the use of composite based damage criteria for the XFEM
damage initiation criteria. Hashin damage type criteria were developed for two of the
damage initiation criteria of Chapter 7. These Hashin based criteria provided good
replication of crack patterns reported in previous experimental studies of Mode I and
II cortical bone fracture (Norman et al. (1996); Zimmermann et al. (2009)). However
off axis crack prediction, that was observed during experimental mixed mode
loading of cortical bone (Zimmermann et al. (2009)), required the development of a
third criterion. This criterion was based upon an effective stress with crack growth
defined orthogonal to the maximum principal stress direction. Additionally,
asymmetric strengths in tension and compression were assigned, as motivated by
previous experimental results for cortical bone (Bayraktar et al. (2004); Mercer et al.
(2006)). The combined failure criteria developed for XFEM predicted; (i) the
relationship between fracture energy and osteon alignment and (ii) the alternate
crack patterns for both varying osteon orientations and loading angle as reported for
experimental studies of single and mixed mode fracture of cortical bone (Norman et
al. (1996); Zimmermann et al. (2009)). Further application of the calibrated models
to 2D and 3D screw pullout illustrated the ability of the developed computational
model to predict; (i) distinctive patterns of crack propagation during screw pullout
and (ii) osteon alignment dependent screw pullout strength.
The anisotropic damage initiation criteria, developed for XFEM prediction of crack
initiation and propagation in cortical bone, offers a powerful design tool. It can be
used to evaluate not only the design of the device but also the suitability of the site
Page 180
Chapter 8
173
chosen to anchor the device. This is further confirmed by the additional applications
outlined in Chapter 7 for 3D simulations of screw pullout, three part proximal
humeral fracture repair and 2D simulations of CFPEEK screws. As concluded from
the findings of Chapter 4, CFPEEK devices lower stress concentrations at the screw
cortical bone interface, lowering the risk of screw pullout/pushout. In Chapter 7, the
calibrated material and anisotropic damage model for cortical bone with XFEM
prediction of crack propagation, was applied to a 3D model of locking plate fixation
of a three part fractured humerus. Simulations compared a CFPEEK locking plate
with a titanium equivalent. Predicted crack initiation load was 28% lower in the case
of a titanium plate compared to a CFPEEK plate. The critical locations of crack
initiation and directions of crack propagation were identified. This highlights the
potential for future application of the methodologies developed in this thesis to
evaluate existing devices, and to guide the development of improved/novel designs.
Simulation of pullout of CFPEEK screws from cortical bone predicted cracks in both
cortical bone and CFPEEK screws. Therefore, this suggests that existing designs
intended for metallic screws will require some geometric modifications to reduce
stress concentrations if CFPEEK material is used.
The findings of this thesis provide the motivation for further investigation of
CFPEEK for the field of orthopaedic fracture fixation. Furthermore, the experimental
and computational techniques developed in this thesis provide the toolset to do so.
Ongoing work by the author using the techniques developed in this thesis, in
conjunction with a biomaterials company, has been in an area of insertion of self
tapping CFPEEK suture anchors. Modelling of the insertion of screws was beyond
the scope of this thesis; however it is considered an important aspect of screw
design, due to potential damage initiation or plastic deformation during insertion.
Future work should also involve the development of computational models to
capture the fracture mechanics of cancellous bone and bone cement. Therefore, the
failure mechanisms of these materials could also be incorporated into 3D fracture
fixation techniques of 3 part humerus fracture simulations. This would provide a
complete understanding of the failure mechanisms in each of the materials involved
in the repair. Beyond the applications provided in the present thesis, the experimental
and computational techniques developed can also be applied to multiple aspects of
orthopaedic fracture fixation device design at multiple scales of interest, ranging
Page 181
Chapter 8
174
from specific individual components of the device to evaluation of the overall
performance of the device under physiological loading conditions.
Page 182
Chapter 8
175
References
Bayraktar, H. H., Morgan, E. F., Niebur, G. L., Morris, G. E., Wong, E. K. and
Keaveny, T. M., 2004. Comparison of the elastic and yield properties of
human femoral trabecular and cortical bone tissue. Journal of Biomechanics
37, 27-35.
Bougherara, H., Zdero, R., Dubov, A., Shah, S., Khurshid, S. and Schemitsch, E. H.,
2011. A preliminary biomechanical study of a novel carbon–fibre hip implant
versus standard metallic hip implants. Medical Engineering & Physics
33, 121-128.
Clavert, P., Adam, P., Bevort, A., Bonnomet, F. and Kempf, J. F., 2010. Pitfalls and
complications with locking plate for proximal humerus fracture. J Shoulder
Elbow Surg 19, 489-494.
Dheerendra, S. K., Khan, W. S., Barber, J., Goddard, N. J. and Ahrens, P. M., 2011.
Outcomes of locking plates in proximal humeral fractures: a systematic
review. Shoulder & Elbow 3, 74-84.
Dickenson, R. P., Hutton, W. C. and Stott, J. R., 1981. The mechanical properties of
bone in osteoporosis. Journal of Bone and Joint Surgery-British Volume 63,
233-38.
Goldhahn, J., Reinhold, M., Stauber, M., Knop, C., Frei, R., Schneider, E. and Linke,
B., 2006. Improved anchorage in osteoporotic vertebrae with new implant
designs. Journal of Orthopaedic Research 24, 917-925.
Königshausen, M., Kübler, L., Godry, H., Citak, M., Schildhauer, T. A. and Seybold,
D., 2012. Clinical outcome and complications using a polyaxial locking plate
in the treatment of displaced proximal humerus fractures. A reliable system?
Injury 43, 223-231.
Kurtz, S. M. and Devine, J. N., 2007. PEEK biomaterials in trauma, orthopedic, and
spinal implants. Biomaterials 28, 4845-4869.
Kwon, B. K., Goertzen, D. J., O'Brien, P. J., Broekhuyse, H. M. and Oxland, T. R.,
2002. Biomechanical evaluation of proximal humeral fracture fixation
supplemented with calcium phosphate cement. J Bone Joint Surg Am 84,
951-61.
Lill, H., Hepp, P., Korner, J., Kassi, J. P., Verheyden, A. P., Josten, C. and Duda, G.
N., 2003. Proximal humeral fractures: how stiff should an implant be? Arch
Orthop Trauma Surg 123, 74-81.
Maldonado, Z. M., Seebeck, J., Heller, M. O. W., Brandt, D., Hepp, P., Lill, H. and
Duda, G. N., 2003. Straining of the intact and fractured proximal humerus
under physiological-like loading. J Biomech 36, 1865-1873.
Mathison, C., Chaudhary, R., Beaupre, L., Reynolds, M., Adeeb, S. and Bouliane,
M., 2010. Biomechanical analysis of proximal humeral fixation using locking
plate fixation with an intramedullary fibular allograft. Clin Biomech 25, 642-
646.
Mercer, C., He, M. Y., Wang, R. and Evans, A. G., 2006. Mechanisms governing the
inelastic deformation of cortical bone and application to trabecular bone.
Acta Biomaterialia 2, 59-68.
Neviaser, A. S., Hettrich, C. M., Beamer, B. S., Dines, J. S. and Lorich, D. G., 2011.
Endosteal Strut Augment Reduces Complications Associated With Proximal
Humeral Locking Plates. Clin. Orthop. Relat. Res, 3300-3306.
Page 183
Chapter 8
176
Norman, T. L., Nivargikar, S. V. and Burr, D. B., 1996. Resistance to crack growth
in human cortical bone is greater in shear than in tension. Journal of
Biomechanics 29, 1023-1031.
Owsley, K. C. and Gorczyca, J. T., 2008. Displacement/Screw Cutout After Open
Reduction and Locked Plate Fixation of Humeral Fractures. J Bone Joint
Surg Am 90, 233-240.
Rose, D. M., Sutter, E. G., Mears, S. C., Gupta, R. R. and Belkoff, S. M., 2010.
Proximal Humeral Fractures. Geriatric Orthopaedic Surgery & Rehabilitation
1, 73-7.
Smith, W. R., Ziran, B. H., Anglen, J. O. and Stahel, P. F., 2007. Locking plates: tips
and tricks. The Journal of Bone and Joint Surgery (American) 89, 2298-2307.
Wilkens, K. J., Curtiss, S. and Lee, M. A., 2008. Polyaxial locking plate fixation in
distal femur fractures: a biomechanical comparison. Journal of Orthopaedic
Trauma 22, 624.
Wirth, A., Mueller, T., Vereecken, W., Flaig, C., Arbenz, P., Müller, R. and van
Lenthe, G., 2010. Mechanical competence of bone-implant systems can
accurately be determined by image-based micro-finite element analyses.
Archive of Applied Mechanics 80, 513-525.
Yánez, A., Carta, J. A. and Garcés, G., 2010. Biomechanical evaluation of a new
system to improve screw fixation in osteoporotic bones. Medical Engineering
& Physics 32, 532-541.
Zhang, Q. H., Tan, S. H. and Chou, S. M., 2004. Investigation of fixation screw pull-
out strength on human spine. Journal of Biomechanics 37, 479-485.
Zimmermann, E. A., Launey, M. E., Barth, H. D. and Ritchie, R. O., 2009. Mixed-
mode fracture of human cortical bone. Biomaterials 30, 5877-5884.