20
Title I School Improvement 2011-2012 Presented by: Evonne Irondi Federal Programs Supervisor
| Date post: | 03-Jan-2016 |
| Category: |
Documents |
| Upload: | muriel-pope |
| View: | 213 times |
| Download: | 0 times |

Title I School Improvement2011-2012
Presented by:Evonne IrondiFederal Programs Supervisor

How is a Title I School Identified For Improvement?

Adequate Yearly Progress (AYP) determines if a
Title I school goes into Title I School Improvement

• AYP measures reading/language arts and math progress by student group against state targets.

Schools, divisions, and the state must meet or exceed the following annual measurable objectives (AMOs) to make AYP.
Year of Test Administration
Year of AYP Determination
Reading AMOs
Mathematics AMOs
2009-2010 2010-2011 81 79
2010-2011 2011-2012 86 85
2011-2012 2012-2013 91 90
2012-2013 2013-2014 96 95
2013-2014 2014-2015 100 100
Determining Adequate Yearly Progress Status

• Two consecutive years of not meeting AYP
• Must be in the same subject
• After two consecutive years of not meeting the AYP standards, LCPS must offer Public School Choice.

• If just one student subgroup does not meet state target in reading/language arts or math, the school does not make AYP.

AYP Status
AYP Status Areas
School Y/N ENG/MAT/OAI ALL BLACK HISPANIC ELL SPED WHITE ED ALL BLACK HISPANIC ELL SPED WHITE ED
Guilford Elementary School N ENG and MAT N N N N N N N N
Forest Grove Elementary School N ENG and MAT N N N N N N
Sterling Elementary School N ENG and MAT N N N N N N N N
English Math
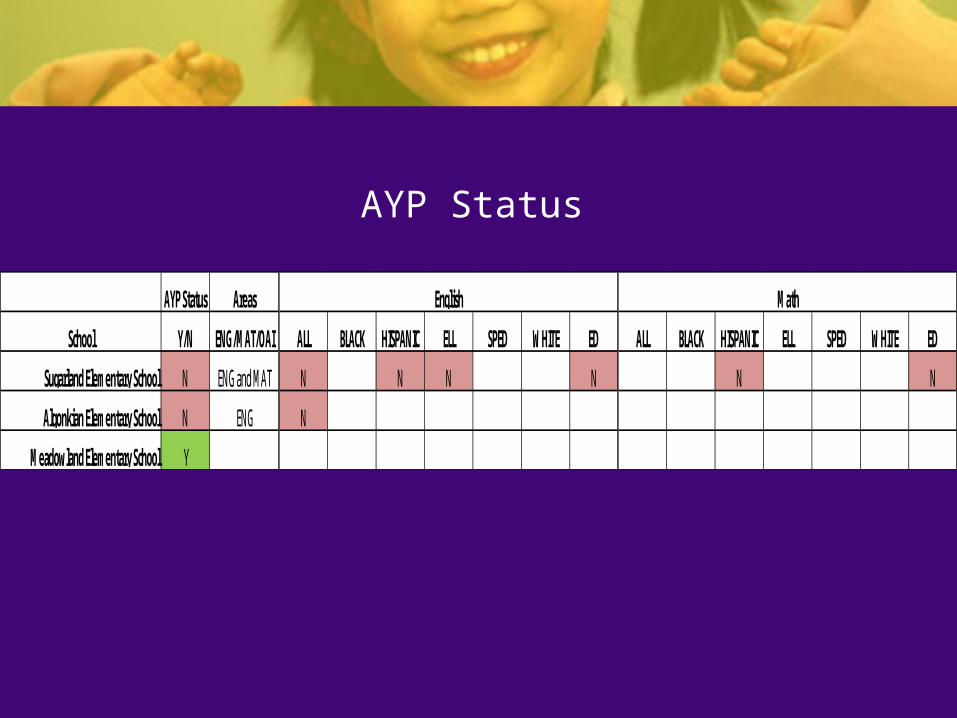
AYP Status
AYP Status Areas
School Y/N ENG/MAT/OAI ALL BLACK HISPANIC ELL SPED WHITE ED ALL BLACK HISPANIC ELL SPED WHITE ED
Sugarland Elementary School N ENG and MAT N N N N N N
Algonkian Elementary School N ENG N
Meadowland Elementary School Y
English Math

Public School Choice PSC is an option , not a requirement.
Offered to all students until the school is no longer identified for improvement or is no longer a Title I school.
Grant priority to the lowest achieving disadvantaged students (eligible for free and/or reduced meals).

Selection of Schools
Provide a choice of at least two schools.
Schools of choice must not be Title I schools identified for school improvement and have the capacity to accommodate transfers

Demographic Distribution 2011-2012
School TotalGuilford 461 53 11.5% 36 7.8% 280 60.7% 17 3.7% 5 1.1% 1 0.2% 69 15.0%Forest Grove 527 111 21.1% 45 8.5% 197 37.4% 21 4.0% 10 1.9% 2 0.4% 141 26.8%Sterling 518 124 23.9% 43 8.3% 183 35.3% 21 4.1% 9 1.7% 0 0.0% 138 26.6%
WhiteAsian Black Hispanic Multi-Racial Native American Pacific Islander
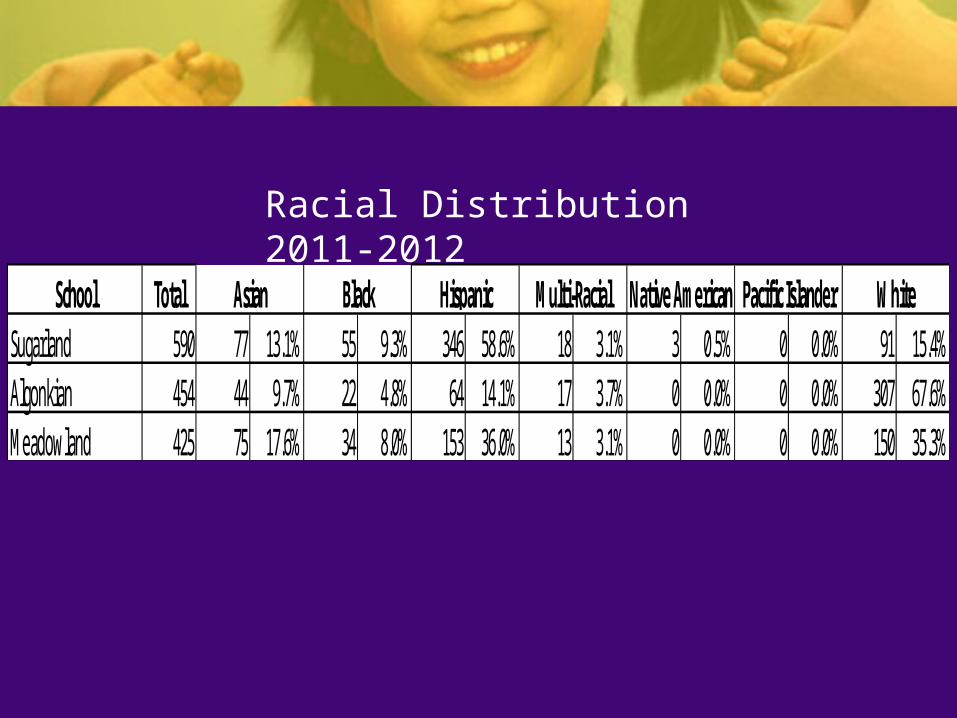
Racial Distribution 2011-2012
School TotalSugarland 590 77 13.1% 55 9.3% 346 58.6% 18 3.1% 3 0.5% 0 0.0% 91 15.4%Algonkian 454 44 9.7% 22 4.8% 64 14.1% 17 3.7% 0 0.0% 0 0.0% 307 67.6%Meadowland 425 75 17.6% 34 8.0% 153 36.0% 13 3.1% 0 0.0% 0 0.0% 150 35.3%
WhiteAsian Black Hispanic Multi-Racial Native American Pacific Islander

Is transportation provided?

15
• LCPS must provide bus transportation; however parents may choose to transport.
• LCPS is responsible for transportation until the home school is no longer in improvement status or is no longer a Title I School.

• Parents will be notified in writing of their child’s transfer approval.
• Notifications will include the date the student may enroll at the option school.
• LCPS plans to have enrollment occur no later than Wednesday, August 31, 2011.

So what is the school doing with the data to help individual
student achievement?

Questions and Answers……

For further questions, please contact . . .
Evonne Irondi
Federal Programs Supervisor
Loudoun County Public Schools
571-252-1080


