Title is set in 30/33 UniSerifSC Subtitle is set in 14/18 UniSans Bold Unisys Accelerating e-Business Transformation Through Unisys e- @ ction Solutions Unisys Corporation 1999 Annual Report
Transcript
Title is set in 30/33UniSerifSC
Subtitle is set in 14/18 UniSans Bold
Unisys
Accelerating e-Business Transformation Through Unisys e-@ction Solutions
Unisys Corporation 1999 Annual Report
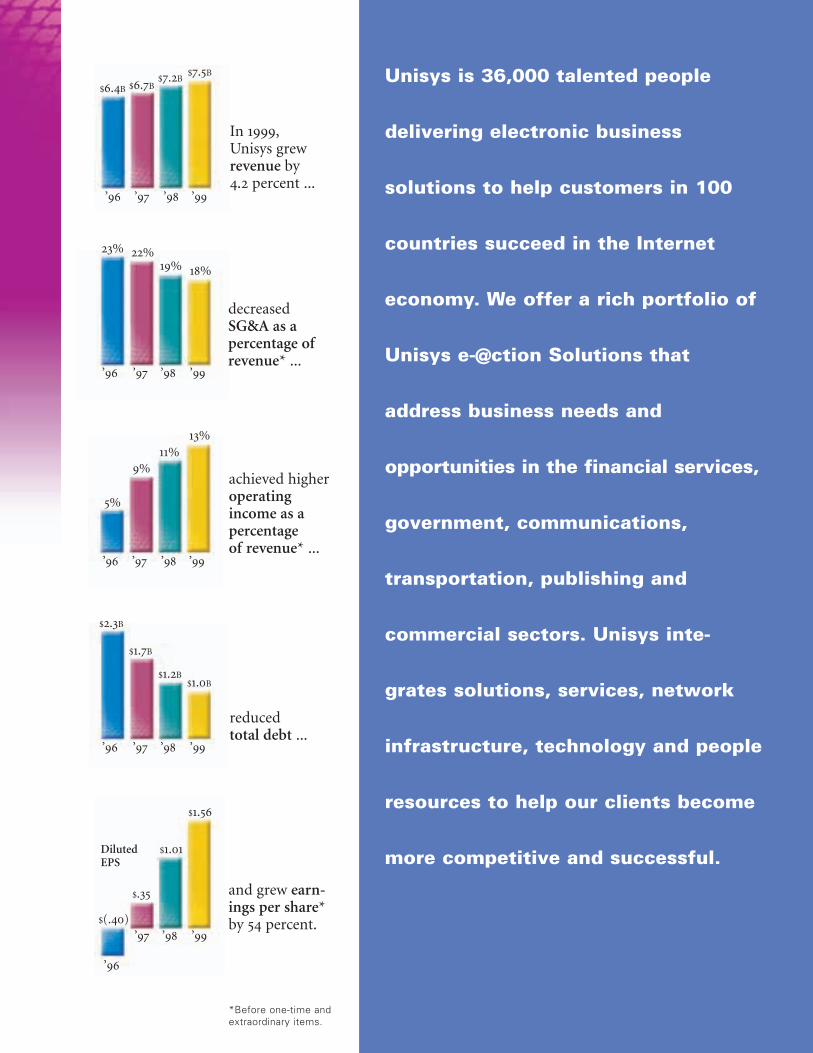
*Before one-time andextraordinary items.
$(.40)
$.35
$1.01
$1.56
23% 22%19% 18%
5%
9%
11%
13%
$2.3B
$1.7B
$1.2B$1.0B
$6.4B $6.7B$7.2B
$7.5B
’96
’97 ’98 ’99
’96 ’97 ’98 ’99
’96 ’97 ’98 ’99
’96 ’97 ’98 ’99
’96 ’97 ’98 ’99
and grew earn-ings per share*by 54 percent.
decreasedSG&A as a percentage ofrevenue* ...
achieved higheroperatingincome as a percentage of revenue* ...
reduced total debt ...
In 1999,Unisys grew revenue by 4.2 percent ...
Unisys is 36,000 talented people
delivering electronic business
solutions to help customers in 100
countries succeed in the Internet
economy. We offer a rich portfolio of
Unisys e-@ction Solutions that
address business needs and
opportunities in the financial services,
government, communications,
transportation, publishing and
commercial sectors. Unisys inte-
grates solutions, services, network
infrastructure, technology and people
resources to help our clients become
more competitive and successful.Diluted EPS
1
Letter to Stakeholders 2
Chairman and CEO Larry Weinbach reviews our achievements in 1999 and outlines our growth strategy.
Chairman’s Q&A 6
Our chairman answers key questions about e-business and its role in Unisys strategy.
Year in Review 8
Key accomplishments in 1999 prepare us for 2000and beyond.
Unisys at a Glance 10
Focused on our clients’ business issues, we go to market with vertical-industry expertise supported by technology, network management and outsourcing capabilities.
Helping Our Clients 12
Unisys employees work with clients to help them solvebusiness problems and become more competitiveand successful.
An Employer of Choice 24
Investing in our people through innovative programs such as Unisys University is a key strategy for a successful future.
Unisys in the Community 26
Unisys volunteers and contributions provide strong support to the communities where we conduct business.
Unisys Around the World 28
Our global network of people and technology enables us to serve customers in more than 100 countries.
Management’s Discussion and Analysis 30
Consolidated Financial Statements 38
Notes to Consolidated Financial Statements 42
Corporate Officers 63
Board of Directors 64
Investor Information 65
Contents
On the cover
Energized Unisys
people deliver Unisys
e-@ction Solutions to
help our clients
address the challenges
and opportunities
of the Internet
economy. Pictured are
Angela Shiu (Hong
Kong), Jaoa Albertino
Alves (Rio de Janeiro),
Eve Butera (Wash-
ington) and Joel
Buege (Chicago).
2
Letter to Stakeholders
E-commerce. Electronic business. The Internet economy. Whatever
you call it, everyone is talking about it.
Here at Unisys, we’re doing something about it. That’s what the
cover of our 1999 Annual Report declares. Energized Unisys
employees are “accelerating e-business transformation” — both
within Unisys and for our clients. Throughout these pages you’ll see
that we have sharpened our focus on electronic business through our
Unisys e-@ction Solutions.
Electronic business is key to our profitable growth, allowing us
to build on our accomplishments in 1999. And those accomplish-
ments were many. We retired our preferred stock, further reduced
our debt, and delivered strong earnings growth.
Growth in revenue, however, did not meet our expectations —
or yours — and the market punished our share price in the fourth
quarter. For the full year, revenue grew 4.2 percent to $7.54 billion.
This did not meet our target, and it is driving our resolve to make
2000 a year of solid, profitable revenue growth.
Our efforts in 2000 will represent an acceleration of the phased
approach to improving our business that we began two years ago.
When I came to Unisys in 1997, the company required a fundamental
turnaround. We had $2.3 billion in debt, a market value of $2.7 bil-
lion, and an employee population that had lost its confidence. Today
we have a much stronger financial structure, a market value of
approximately $10 billion, and some 36,000 talented people who are
eager to succeed.
Building on Our Success
In fact, the full view of our financial results for 1999 shows that
we have built a strong foundation for success in 2000. Operating
income grew 20 percent to $961 million. Net income before extra-
ordinary items increased 33 percent to $501 million. Diluted earnings
per share were up 54 percent to $1.56. This is the performance of a
company that is succeeding in the marketplace.
These results were enabled in part by our improved financial
structure. Our company is more sound financially than it has been in
more than a decade. And much of that progress was made in 1999.
In August we completed our program to retire all 28.4 million
shares of Series A Cumulative Convertible Preferred Stock out-
standing at the start of 1999. We also continued our program for debt
reduction, decreasing debt to $1.0 billion at year-end. That
Lawrence A. WeinbachChairman, President and Chief Executive Officer
3
means in just two years we have eliminated $1.4 billion of preferred stock and reduced debt
by $1.3 billion. As a result, we have cut annual dividends and interest expense by more than
$230 million from September 1997 levels.
We furthered our cost containment efforts through our ongoing “Cornerstone” initiative
to adopt a standard set of global processes and systems. This companywide program to
streamline our finance, information technology and procurement processes is simplifying
and improving operations while helping us cut unnecessary costs.
All of these efforts better enable us to leverage future revenue growth to fuel profitability
and invest in our business. We’re pleased that in 1999 all three major credit ratings —
Moody’s, Standard & Poor’s, and Duff & Phelps — increased their ratings of Unisys, the last
of these to investment grade.
Financial Summary
Year ended December 31
(Dollars in millions, except per share data)
1997* 1998 1999* % change (‘98-’99)
Revenue $6,662.9 $7,243.9 $7,544.6 4%
Operating income 588.8 799.0 960.7 20%
Operating income as %
of revenue 8.8% 11.0% 12.7% —
Interest expense 233.2 171.7 127.8 (26%)
Net income 176.4 376.4 500.8 33%
Diluted earnings per share .35 1.01 1.56 54%
Debt-to-capital ratio 58.0% 43.1% 33.9% —
Total debt 1,694.1 1,163.0 1,000.0 (14%)
Cash flow from operations 370.5 642.2 517.6 (19%)
SG&A as % of revenue 21.5% 18.8% 18.4% —
Stockholders’ equity 1,227.9 1,535.6 1,953.3 27%
Year-end stock price 13 7/8 34 7/16 31 15/16 (7%)
Shares outstanding 251.0M 258.2M 310.6M 20%
Number of employees 32,900 33,500 35,800 7%
Electronic business is key to our profitable growth, allowing us to build on our
accomplishments in 1999.
*Before one-time and extraordinary items.
4
Taking Advantage of the Internet Economy
Our improved financial structure isn’t the only thing that drove success in 1999 — or that
lays the foundation for success in 2000 and beyond.
In October we unveiled a comprehensive strategy and an integrated portfolio of ser-
vices and technologies to help our clients succeed in electronic business. We call these
services and technologies Unisys e-@ction Solutions. These solutions are enabling our
clients to take advantage of the efficiencies and opportunities made possible by electronic
business. And they’ll enable us to take advantage of the tremendous growth potential of
the Internet economy.
In November we announced a go-to-market plan designed to address our clients’
most pressing business issues. The plan is based on extensive research involving clients,
competitors and employees around the world. Building on the success of our Major
Accounts program, we are providing clients with a single point of accountability within
Unisys. The result is an integrated company that is better focused and easier to do
business with.
Today Unisys helps clients in seven key vertical industries address their electronic
business needs. We meet their requirements through services such as outsourcing,
networking, Windows 2000/NT services and systems integra-
tion, and through technology such as enterprise-class servers.
We continue to grow our services business, with the goal of
deriving 75 percent of our revenue from services in the next two
years. In 1999, operating profit margins on our services business
increased to 7.9 percent, while our services backlog — orders
received but not yet realized as revenue — grew 35 percent to
$4.6 billion.
Outsourcing in particular represents tremendous opportu-
nity for Unisys. We are one of the few companies that can com-
bine vertical-industry knowledge with expertise in
enterprise-class computing and state-of-the-art data centers.
Demand for our outsourcing services grew substantially in 1999,
and we expect this trend to continue.
We also anticipate strong growth for our network services. As more organizations
turn to electronic business, the need for a solid network infrastructure only increases.
Unisys has the experience and expertise to design, implement and maintain secure,
reliable and scalable networks on a global basis.
$6.4B$6.7B
$7.2B$7.5B
63%
37% 35% 32% 30%
65% 68% 70%
’96 ’97 ’98 ’99
Services
Technology
We continue toincrease the per-centage of our rev-enue derived fromservices, with thegoal of reaching 75percent in the nexttwo years.
Unisys e-@ction Solutions are enabling our clients to take advantage of the efficiencies
and opportunities made possible by electronic business.
5
Demand for our enterprise-class technology also remains strong. We’re building on the
success of our Unisys e-@ction ClearPath Enterprise Servers with a revolutionary new archi-
tecture called Cellular MultiProcessing (CMP). These new servers will help our clients meet
the mission-critical requirements of electronic business. We’ve already received several orders,
and we expect demand to grow significantly in 2000.
Growth is a major theme in other aspects of our business as well. We acquired four U.S.
companies in 1999: PulsePoint Communications, a developer of solutions for the communi-
cations industry; Publishing Partners International, a provider of solutions for the publishing
industry; Motay Electronics, a provider of test solutions for the semiconductor industry; and
Tech Hackers, a developer of solutions for securities trading and financial operations. We also
acquired Datamec, a Brazilian outsourcing company, and City Lifeline Systems, a U.K.-based
provider of solutions for trading in fixed income securities. These targeted acquisitions will
allow us to take advantage of growth opportunities in our key markets.
We also expanded our advertising and image-building programs in 1999. Our “monitor-
head” ad campaign — with the tagline “We eat, sleep and drink this stuff” — has garnered
attention worldwide. We will continue to use it to tell the world that Unisys people are
dedicated to meeting our clients’ needs.
Committed to Employees, Customers and Growth
We continued building our workforce and investing in our employees in 1999. We know
that our 36,000 creative, tenacious and technically excellent employees are the foundation
of all we do. Web recruiting tools, a revitalized university recruiting program and an active
employee referral program are helping us attract the talent we need to grow. In fact, we
hired 7,000 people in 1999. Once on board, these employees join others around the world
in honing their skills through Unisys University. The University now offers 10 schools of
instruction on six campuses, with hundreds of instructor-led classes and thousands of
computer-based courses.
In conclusion, we’re committed to working closely with our clients to help them address
the challenges and opportunities of the Internet economy. We’re committed to winning in the
marketplace and delivering significant value to our shareholders.
We’re proud of our accomplishments in 1999 — and we’re energized to achieve even
greater success in 2000.
Lawrence A. Weinbach
Chairman, President and Chief Executive Officer
6
Chairman’s Q&A
Q: Unisys continues to increase its
profitability, but revenue growth for
1999 fell short of expectations. What is
Unisys doing to accelerate top-line
growth?
A: Profitable growth to enhance shareholder
value is our top priority. It continues to
drive the phased approach we have taken to
rebuilding our company during the past
two years. In particular, we have been
improving how we serve our largest cus-
tomers through the Major Accounts pro-
gram we put in place in early 1998. Our top
200 customers are now served by client rela-
tionship executives who are accountable to
customers to orchestrate all the Unisys
resources required to serve them. The results
speak for themselves: Revenue from these
accounts grew at strong double-digit rates
in 1999.
In November we completed an in-depth,
seven-month review of how we go to
market, which included global research
involving our customers, our competitors
and our sales and delivery employees. The
study confirmed that our Major Accounts
approach should be extended to our top
1,000 accounts. We are implementing this
approach now and expect to see top-line
growth results beginning in 2000.
Of course, one of our best opportunities
for the double-digit revenue growth we are
projecting for the next few years lies in
helping clients address their opportunities
and challenges in the electronic business
revolution. We announced our e-business
strategy in October, introducing a rich port-
folio of more than 60 Unisys e-@ction Solu-
tions. We will continue to expand that
portfolio as we implement our strategy
throughout our business.
Q: Exactly what is “electronic
business,” and why is it important
to Unisys?
A: Unisys defines e-business as delivering
customer value by exploiting technologies
inspired by the commercialization of the
Internet. Taken further, e-business trans-
forms the way an organization attracts,
interacts with and transacts business with
clients, suppliers, employees and other
stakeholders.
E-business is important to Unisys
because we are in the business of helping
our clients apply information technology to
address business issues and opportunities.
And literally thousands of our current and
potential clients have recognized that the
single largest business issue and opportunity
they face is their response to the Internet
economy.
Q: What is the “Internet economy”?
A: The Internet economy — sometimes
called the digital economy — is that part
of our overall economy associated with
e-business. As the chart shows, the volume
of commercial activity conducted over the
Internet will grow dramatically over the next
few years. Industry observers describe this
period as being a “second wave” in the
Internet economy, with consumer accep-
tance of the medium exploding.
19980
$1.0
$2.0
$3.0
U.S. Total
Global Low
Global High
1999 2000 2001 2002 2003
The E-Business Market (trillions)
Source: Forrester Research Inc.
7
The first wave, which occurred during
the past few years, was dominated by the so-
called “dotcom” companies that rarely had
any physical assets or traditional capabilities
to serve customers. We see the winners in
this second wave as the dotcoms and the tra-
ditional bricks-and-mortar organizations
that take action now to transform into
hybrids — organizations that successfully
integrate their electronic capabilities and
required physical infrastructures. Unisys is
an ideal partner to help them accomplish
that integration.
Q: What are Unisys key strengths in the
e-business market?
A: We have strengths in all the key areas in
which customers will need to address their
e-business opportunities. First, our in-depth
knowledge of business processes in our
strategic market segments enables us to help
our customers define and then implement
world-class, industry-specific solutions.
Second, we deliver mainframe-class perfor-
mance through our scalable computing
platforms and networks, and our ability to
integrate complex computing environments
from many vendors. Third, we have critical
expertise in building, integrating and man-
aging the network infrastructure that is the
foundation of e-business. Fourth, we have
an enterprisewide perspective that allows us
to provide guidance on integrating and
managing secure systems and networks
across complex, geographically dispersed
operations.
Q: How does Unisys enterprise
technology fit into the Unisys e-business
strategy?
A: We know that as e-business volumes grow,
more resilient computing platforms will be
required. Our new Unisys e-@ction Enter-
prise Servers — especially our new ES5000
and ES7000 servers — are ideal “engines” to
support the high-volume, mission-critical
requirements associated with e-business.
These server platforms will ensure that or-
ganizations offering e-business services can
serve their customers with around-the-clock
availability and can scale to meet the
unpredictable transaction volumes of the
e-business world. This family of servers is
based on standard Intel and Windows NT
technology, but with mainframe performance
attributes. We will begin shipments of these
advanced servers in early 2000.
“One of our best opportunities for double-digit revenue growth lies in helping clients
address their opportunities and challenges in the electronic business revolution.”
Worldwide, revenues generated on the Web areprojected to grow at a compound annual rate ofup to 106 percent between 1998 and 2003. U.S.sales are projected to reach $1.4 trillion, whileglobal sales are projected to range from $1.8trillion to $3.2 trillion.
8
Year in Review
January
The City of Chicago selects Unisys to outsourcenetwork and desktop management. With an esti-mated value of $75 million over its five-yearperiod, the contract showcases our remote network management and other IT services.
Unisys is named a charter Global SolutionsPartner by Nortel Networks, delivering consulting, design, integration and support forNortel’s Unified Networks solution. Whenleading IT providers need partners who haveexpertise in enterprise computing, they turn to Unisys.
February
FTD Inc., the world’s leading floral company, purchases a Unisys e-@ction ClearPath Enter-prise Server. These serverscombine our proven mainframeenvironment with applications and databases for Windows2000/NT.
Unisys develops new creativematerial for its successful “monitor-head” advertising campaign. The ads feature Unisys people off the job but still thinking about how tosolve our clients’ business chal-lenges. The tagline – We eat,sleep and drink this stuff –captures the can-do spirit of ourcreative, tenacious, technicallyexcellent employees.
June
Unisys announces its plan to acquire PulsePoint Communications, a leading devel-oper of solutions for the communicationsindustry. The acquisition expands Unisys port-folio of industry solutions for small, mid-size and “next-generation” telecom providers,a large portion of the worldwide market.
Unisys launches Unisys Federal Online, an e-business service forthe U.S. federal govern-ment. The resource allowsagencies of the federalgovernment to purchasecommodity IT productsonline, providing access tomore than 100,000 prod-ucts from some 1,200 leading suppliers.
Unisys enters the final stages of U.S. deploy-ment of standard business applications in our“Cornerstone” initiative to strengthen ourinformation infrastructure. The long-term, multiphase effort is changing the opera-tional culture of Unisys through a standard setof global practices.
July
TV networks worldwide take advantage of Unisystechnology in broadcasting the British Open andother golf tournaments. Building on our sophisti-cated scoring system, Unisys now measures wind speed and direction, which is displayed forTV viewers as players compete. Providing our technology to such sportingevents allows us to demonstrate to a global audience our ability todeliver valuable information in real-time.
August
Unisys completes its program to retire all 28.4 million shares of Series A Convertible Preferred Stock outstanding at the start of 1999. In two yearswe have eliminated $1.4 billion of preferred stock and reduced debt by $1.3billion. Through these efforts we have cut annual dividends and interestexpense by more than $230 million from September 1997 levels, when webegan our financial improvement program.
Pennsylvania becomes the first U.S. state to undertake a comprehensive IT outsourcing initiative, a seven-year contract valued at about $500million. By outsourcing to Unisys, the state expects to realize significantefficiencies in the operation of its data centers.
September
Unisys wins a contract valued at about $55 million from ECT, the Brazilianpostal service, to integrate branch offices into its overall corporate network.The systems integration project represents ECT’s first step toward an e-business environment.
The 36,000 talented people of Unisys are proud of our accomplishments in 1999.
We’re even more excited about how they position us for growth in 2000 and beyond.
9
March
Unisys joins Pennsylvania’s SciTech Scholars program, under which we provide internships for high-tech students and job opportunities for high-tech graduates. It’s one more example of our ongoing commitment tobeing an employer of choice.
Unisys opens the Cisco Technical Readiness Lab at our headquarters inBlue Bell, Pennsylvania. Part of our Unisys University professional development organization, the lab provides an ideal environment for thetraining, certification and development of Unisys networking experts.
Industry research firm International Data Corp. reports that Unisys e-@ction ClearPath Enterprise Servers are “best of breed” for large-scaletransaction-processing applications. As organizations pursue e-businessopportunities, demand is growing for such high-performance, high-availability servers.
Unisys and Microsoft introduce end-to-end services for the rapid deploy-ment and integration of Microsoft Office 2000. Leveraging our expertise in design and delivery of distributed computing infrastructures,the Unisys Office 2000 Solution facilitates the deployment of Office 2000 in enterprise environments.
April
Unisys wins ISO 9002 certification for itsentire Unisys service delivery, support centerand logistics operations in Latin America andthe Caribbean. Unisys now holds more than30 ISO certifications for quality assur-ance and management processes.
May
The Nasdaq Stock Market Inc. invests in Windows NT-based Unisys enterprise server technology. More organizations are discovering that, supported by Unisys enterprise-class software and services, Windows NT can meet their mission-critical computing needs.
October
Unisys announces a multimillion-dollaragreement with Dow Jones & Co., pub-lisher of The Wall Street Journal. Unisys e-@ction Publishing Solutions will provide improved editorial workflow, electronicpagination, Web publishing capabilities and oper-ational flexibility.
Unisys unveils a comprehensive strategy and integrated portfolio of ser-vices, solutions and technologies to help our clients succeed in e-business.Unisys e-@ction Solutions enable organizations to take advantage ofthe operational efficiencies and growth opportunities of the Interneteconomy.
Unisys unveils the Unisys e-@ction Enterprise ServerES7000, a family of Intel-based, mainframe-classservers that signals a fundamental shift in the economicsof large-scale computing. Based on the revolutionary UnisysCellular MultiProcessing (CMP) architecture, the serversoffer a cost-effective alternative to high-end UNIX/RISC systems as large-scale engines for e-business.
Unisys announces partner relationships with BEA Systems, Siebel Systems and Intershop, three leading sup-pliers of e-business software. The alliances will enable us todeliver new types of e-business and customer relationshipmanagement solutions.
November
Unisys announces a business realignmentthat focuses the company on meeting customer needs. The initiative replaces the “three businesses/one holding company”model with a networked structure driven by customer needs in key industry sectors, centered on portfolios of Unisys e-@ctionSolutions, and coordinated close to customersin geographic markets around the world.
At Comdex — a major trade show — Unisys demonstrates the largest Windows 2000-based application ever built.“Unisys has demonstrated that it can rapidlyimplement an enterprise-scalable, robust,manageable, secure data-center-type Win-dows 2000 environment,” says marketresearch firm Aberdeen Group.
December
Unisys and Deutsche Telekom sign anagreement to provide integrated IT andtelecommunications services to multi-national customers. It’s another example ofhow leading technology providers look toUnisys to help them provide the solutionstheir customers need.
Unisys at a Glance
10
Client BusinessIssues
Solutions
Services
Network Infrastructure
Enterprise Technology
Financial Services
Unisys People
Worldwide Public Sector
U.S. FederalGovernment
Unisys is a leading information services andtechnology provider to theglobal financial servicesindustry. Half the world’schecks are processed byUnisys systems, and morethan 2,200 financial servicesclients worldwide rely onUnisys e-@ction FinancialSolutions. Banks, insurancecompanies, brokerage firmsand other financial servicescompanies take advantageof our branch-automationsolutions, back-office sys-tems, customer relationshipmanagement and electronicbanking solutions.
Unisys enterprise technology provides the systems foundation for Unisys e-@ction Solu-tions. Unisys e-@ction ClearPath Enterprise Servers integrate proprietary and open plat-forms, helping our clients achieve IT efficiency and meet the unprecedented performancedemands associated with e-business. Our sophisticated software and middleware solu-tions bring mainframe-class attributes to Intel and Windows 2000/NT platforms.
The continued expansion of distributed networks, combined with rapidly escalatingneeds for a solid infrastructure to support e-business, presents organizations with a hostof IT challenges. Unisys has the experience and expertise to design, implement and main-tain secure, reliable and scalable networks on a global basis. Our network architectsdesign infrastructures robust enough to meet tomorrow’s needs today.
Unisys offers a broad range of consulting, systems integration, outsourcing and main-tenance services to help our clients meet the demands of e-business and achieve newlevels of success. We also have the physical and intellectual resources to provide thelevel of outsourcing service our clients require, whether working alongside them onsiteor managing operations from one of our outsourcing centers.
Unisys offers a broad range of software applications that make business processes moreefficient, responsive and effective. Based on extensive industry knowledge and provenmethodologies, such industry solutions address challenges and opportunities in the keyvertical industries where Unisys does business. These industries include the financial ser-vices, government, communications, transportation, publishing and commercial sectors.
Unisys delivers value to customers through 36,000 creative, tenacious,
Unisys helps clients applytechnology to address thechallenges and opportunitiesof the Internet economy.Our knowledge of businessprocesses in seven verticalmarkets is key to helpingclients become more suc-cessful. We meet client needsthrough services such asindustry solutions, out-sourcing, networking andmaintenance, and throughtechnology such as enterprise-class servers and software.
Unisys helps governmentsworldwide apply technologyto improve operations and serve citizens. Unisys e-@ction Solutions helpeight of the 10 largest U.S.states deliver public-assis-tance benefits, assist justiceagencies in protecting morethan half the U.S. popula-tion, and provide systemsthat process 250 millionincome-tax returns world-wide. In fact, we have pro-vided solutions to morethan 1,500 agencies world-wide, including all 50 U.S.states and more than 900local governments.
Unisys is one of the largestproviders of IT solutions tothe U.S. federal government.Our expertise is focused onkey government require-ments such as solutions for electronic government,enterprise consolidation,desktop management,Windows 2000/NT integra-tion and IT outsourcing.Unisys made history when it delivered the world’s firstlarge-scale commercialcomputer to the CensusBureau in 1951. Today wemanage more than 200 federal contracts.
... Nasdaq State of New York Lufthansa Airlines American Express Subaru of America Banamex United Airlines Nationwide Insurance
Unisys Clients International Paper Kellogg Co. Los Angeles County Dept. of Defense Carnival Cruise Lines City of Chicago Riggs Bank
SBC Communications Dept. of Transportation Global Petroleum HSBC
Clients have identified several issues as crucial to their success, includ-ing e-business transformation, customer relationship management,
In addition, specialized Unisys technologies such as payment systems, storage products, security solutions, object-management software and voice-processing solutions help meet a broad range of business requirements.
Our certified technicians install and service multivendor solutions in virtually any location. And Unisys e-@ction Networkand Systems Management provides centralized monitoring at fully staffed network outsourcing centers.
Key partners: 3Com, Cisco Systems, Microsoft, Nortel Networks, NovellKey competitors: Getronics/Wang Global, IBM Global Services, ICL, Inacom, Siemens Nixdorf
Unisys has the experience and expertise to integrate and maintain systems, networks and desktop products from abroad range of vendors on a global basis.
Key partners: Cisco Systems, Computer Associates, Hewlett-Packard, Microsoft, OracleKey competitors: Andersen Consulting, Cap Gemini, Computer Sciences Corp., EDS, IBM Global Services
Our solutions also address cross-industry challenges and opportunities such as e-business transformation, customerrelationship management, network expansion, IT efficiency and business speed.
technically excellent employees, energized to work as a single team to help our clients.
Unisys is a premiereprovider of solutions to theglobal communicationsindustry. Our solutions helpclients generate new rev-enues through advanceddata and voice messaging,process high-volume excep-tion remittances, managetheir business-critical infra-structures, and enhance cus-tomer relationships throughnext-generation call centers.It’s no wonder 90 of theworld’s leading communica-tions firms — includingnine of the 10 largest — relyon Unisys solutions.
Unisys is a leading providerof IT services for the globaltransportation industry.Unisys e-@ction Trans-portation Solutions offer arange of solutions for air,land and ocean travel,including customer loyalty,reservation systems, freightmanagement, airport opera-tions and e-ticketing. Unisysserves more than 200 air-lines — including 17 of thetop 25. We also supportmore than 100 airports,major railroads, and manyother large transportationbusinesses.
Unisys provides sophisti-cated electronic publishingsolutions for mid-size andlarge newspapers around theworld. Unisys e-@ction Publishing Solutions helppublishers manage editorialworkflow, pagination, adver-tising, archiving and Webpublishing. Their integrateddesign means newspaperscan stay one step ahead ofdeadlines — and the com-petition. Today, more than180 newspapers — fromItaly’s Il Sole 24 Ore to TheWall Street Journal — relyon Unisys to serve millionsof readers worldwide.
Unisys provides a broadrange of systems, solutionsand services for the com-mercial market sector,including solutions forsupply chain management,customer relationship management, and retailenvironments. From opti-mized servers to middlewareintegration to e-businessservices, Unisys offers the systems, software,networking and industrysolutions that help ourclients achieve new levels ofcompetitiveness and success.
Banco Santander The Wall Street Journal NT&T Internal Revenue Service Bell AtlanticCisco Systems Amadeus BT Industrial Bank of Japan Social Security Administration
Sovereign Bank Deutsche Telekom Prudential Bureau of Census BASF BoeingDell Computer Iberia Airlines Federal Reserve Banks City of Rome General Services Administration
Group Northwest Airlines Qantas Airways State of Pennsylvania United HealthGroup Westpac ...
network expansion, IT efficiency, business speed, and a wide range of vertical-industry issues. Unisys integrates solutions, services, network infrastructure, technology and people resources to address these issues.
Unlocking the potential of enhanced customer service.
The enhanced ser-vice that AtlanticCanada On-Line(ACOL) provideshas resulted inhigher customersatisfaction. Oneof those satisfiedclients is Halifax,Nova Scotia-basedCredit UnionAtlantic — also along-time user ofUnisys bankingsolutions to auto-mate its localbranches.
The credit unionuses ACOL foronline registrationof loan securitydocuments — aprocess that usedto take severaldays. “With thenew system, wecan perform trans-actions from ourdesktops in acouple of min-utes,” says loanofficer Trish Giles(right). “ACOL isan excellentexample of howtechnology ischanging the waywe do business.”
12
“Putting the personalproperty registry onthe Internet enablesus to deliver a muchhigher level of serviceto our clients,” saysElaine MacEachern,Registrar of PersonalProperty for NovaScotia Department of Housing andMunicipal Affairs.
Unisys team memberswho help ACOL deliverservice to customersinclude Alex MacLean,Terence Connelly,Juanita Mombourquette,Neil Hegenbarth, Gregory Power, AndreaAllain, Glynis Bailey andChris Bennett.
Corporations aren’t the only organizations
taking advantage of e-business. Govern-
ments are turning to cyberspace to enhance
service delivery as more citizens become
wired to the Web.
That’s certainly true for the Canadian
provinces of Nova Scotia, New Brunswick,
Prince Edward Island, and Newfoundland
and Labrador, which have partnered with
Unisys to create Atlantic Canada On-Line
(ACOL). ACOL provides secure, electronic
access to government information. ACOL’s
clients — banks, law firms, real-estate agen-
cies, auto dealerships — use ACOL to reg-
ister, update and search personal property
records.
“Before ACOL, accessing personal prop-
erty information required sorting through
thousands of paper records,” explains Elaine
MacEachern, Registrar of Personal Property
for Nova Scotia Department of Housing and
Municipal Affairs. “Today, we’ve unlocked
that information to make it instantly avail-
able through the ACOL service.”
ACOL is an excellent example of how
e-business can streamline processes and
generate new revenue. But ACOL also repre-
sents a unique partnership. Unisys is
investing up to $10 million over five years to
develop, implement and manage ACOL’s
infrastructure. In return, Unisys receives a
portion of the transaction fees paid by
ACOL clients.
Other Canadian provinces are interested
in similar systems. That’s no surprise to
MacEachern. “We changed history,” she
insists. “One day we were living in the old
world. Then on a Monday morning we
flipped the switch, and suddenly we were
conducting business in a new world.”
13
Delivering a historic city’s information in a new way.
Rome’s e-businessWeb site helpsjournalists deliverlate-breaking election news.Among those thatrely on the onlineelection results isnewspaper Il Messaggero —also a long-timeuser of Unisys e-@ction PublishingSolutions. “Ourreporters canquickly obtain up-to-the-minuteelection results,statistics and historical data,”says Silvio Biella,director of infor-mation technologyfor the century-olddaily. At right, Il Messaggero’slead story carriesthe election results.
14
The ability to tap into election information fromvirtually anywhere enables Rome’s citizens to bemore involved in the election process.
Even the most established institutions are
being transformed by e-business —
including the election process in the vener-
able City of Rome. Elections are an impor-
tant part of life in Rome. In fact, election
day is a day of celebration, when the entire
community becomes involved in the Eternal
City’s future.
But with more than 30 political parties,
3 million voters and 3,000 polling sites, elec-
tions were also complicated. That is, until
Unisys helped the city conduct the world’s
first elections for which results were tallied
in real-time and posted on the Internet
immediately after the polls closed.
True to its inventive heritage, the city
knew the Internet was the ideal tool for
publishing election results. The challenge was
making mainframe-based election data avail-
able on the Web. The solution was Unisys
e-@ction Internet Commerce Enabler.
“Our election site is a benefit to both
citizens and the city,” says Carlo Mazzola,
head of technology services for Rome. “Citi-
zens now get real-time information. And the
city doesn’t have to handle constant requests
for election results.”
And elections are just the beginning. “We
are now working to put other city services on
the Web,” explains Francesco DiMaggio, head
of information technology for the Rome City
Council. “Our motto is ‘moving information
instead of moving citizens.’”
Unisys team members who helpRome make life more convenientfor citizens include (back row)Antonello Canitano, Augusto
Gentili, Elisabetta Cortini,Domenico Maccarrone,Mauro Ponzi, Sergio Mollariand Valter Giordano, and(front row) Maurizio Ferro,Gianfranco Buonocore andSandro De Leo.
15
In the vibrantmetropolis of Rio de Janeiro,cybercafes —where people ofall ages gather tosocialize, surf theWeb and connectwith friendsaround the world— are increasinglypopular. In fact,International DataCorp. sees LatinAmerica as ahotbed for Internet growth,with usageexpanding at a compoundannual rate of 32 percent from1998 to 2003.
Allowing customers to dance to the beat of their own drummer.
16
E-business is transforming the way people work— and play. That’s certainly true in Brazil, wherea growing number of consumers turn to e-businesses like Som Livre for entertainment,shopping and more.
implemented a sophisticated security system
that protects the site from intruders and shields
customer information from prying eyes.
Today Som Livre is Brazil’s leading online
music retailer, offering tapes and CDs from 150
recording labels, more than 50,000 RealAudio
files that let customers listen before buying,
plus daily news, events calendars, music
reviews, artist biographies and more. Highly
scalable Unisys servers running Microsoft Win-
dows NT ensure that thousands of daily Web
visitors have instant access to the products and
information they want.
For Som Livre’s customers, that’s music to
their ears. “Our e-business is a success because
we have the reliability and security to meet
customer needs,” says Toninho Pezella, head of
marketing for Som Livre. “And that high level
of service keeps customers coming back.”
E-business presents whole new possibilities
for customers and businesses alike. Con-
sumers can access a broad range of product
information and decide how and when they
want to shop. Companies can offer greater
levels of convenience and reach more cus-
tomers than ever before.
Som Livre, part of a major Brazilian
entertainment company, recognized that
opportunity when it sought to create an
e-business to sell music online. By providing
convenient access to music from around the
world, plus a fully interactive Web experi-
ence, Som Livre knew it could serve Brazil’s
burgeoning online community while
reaching new customers.
Unisys helped Som Livre design its
e-business Web site and get it up and running
in record time. Unisys also developed and
17
Unisys team memberswho help keep SomLivre in step includeAna Paula GoncalvesDos Reis, Eric Francisco, RogerioMachado F. da Silva,Jose AlexandreRibeiro, FernandoHenriques and JoaoAlbertino Alves.
Taking customer satisfaction and convenience to new heights.
Electronic solutions such as e-ticketing make iteasier for travelers to reach their destinations.So does the new Shanghai Pudong InternationalAirport (above), and four other major Chineseairports using Unisys e-@ction TransportationSolutions, including Beijing Capital InternationalAirport. These services automate each facility’spassenger and baggage check-in procedures tofacilitate quick passenger boarding, on-timeflight departures and more personalized pas-senger service. That will be critical in 2000,when Shanghai Pudong International expects to welcome nearly 8 million travelers.18
Unisys and CathayPacific team membersworked hand in gloveto help the airlinebecome one of thefirst to launch e-ticketing interna-tionally. Pictured areGrant Crampton,Bonnie Lam (CathayPacific), ColinFleming, Richard Mak(Cathay Pacific),Simon Ng (CathayPacific), Gary Lau(Cathay Pacific), Suryanarayan Chavaliand Robert McFadden.
In the highly competitive airline industry,
the race to better passenger convenience and
satisfaction goes to the swift. And quicker
than most was Hong Kong’s Cathay Pacific
Airways in recognizing the potential of
online services.
In particular, the airline anticipated that
e-ticketing would soon become the new
standard in customer service. But devel-
oping a proprietary e-ticketing system is a
costly endeavor. The solution? Call on the
e-business expertise of Unisys.
Cathay Pacific took advantage of the
Unisys AIRCARE program — part of Unisys
e-@ction Transportation Solutions — to
implement a cost-effective e-ticketing system
that would improve customer service and
eliminate the inefficiencies of issuing,
collecting and retaining paper tickets.
Unisys AIRCARE is a unique coopera-
tive venture in which Unisys airline clients
worldwide share costs for the development
of software solutions and related technical
support.
“The program enabled us to obtain a
sophisticated e-ticketing system for signifi-
cantly less than the cost of a proprietary
system,” says Anthony Yeung, Manager, Sys-
tems Delivery, at Cathay Pacific. “The pro-
gram also gives us 24x7 access to the Unisys
experts who helped develop the system and
who can provide immediate assistance to
our internal IT staff.”
19
Supporting the network infrastructure that enables e-business.
In Chicago, the fire department — along with more than 40 other city depart-ments — relies on Unisys to keep the network ready to respond at a moment’snotice. The network outsourcing project “signifies Unisys increasing competi-tiveness in the overall network and desktop management space and in thestate and local government market,” says Stephen M. Clancy, a principal analyst with GartnerGroup, Dataquest IT Services research.
20
“I can concentrate on our e-businessstrategy and letUnisys worry aboutkeeping the systemsand networks up and running,” saysElizabeth Boatman,CIO of the City of Chicago.
The Unisys network management team works side-by-side with City of Chicago IT employees. Pictured areMichael McCallister (City of Chicago), Ian VincentStacey, Jack Carpenter, Ellen Barry (City of Chicago),Dwight Janzen, Frankie Robles, Thomas E. Vaisnaras,Joel Buege and Arlyn D. Engman.
Big cities require big networks. And for the
networking expertise that helps conduct the
city’s business, the City of Chicago turns to
Unisys. We provide network and desktop
consulting, installation, maintenance,
helpdesk support and remote network
management for more than 40 city depart-
ments, including fire, police, emergency
communications, and even the operations
of O’Hare Airport.
The network also serves as the backbone
for Chicago’s e-business Web site, which
offers traffic advisories, crime statistics,
permit applications and city merchandise.
The award-winning site is integrated with the
city’s new “311” service, a state-of-the-art call
center that handles nonemergency requests
about such services as
neighborhood cleanup,
abandoned vehicles
and pest control.
“Outsourcing the management of our
network lets me focus on our core initiatives,”
explains Elizabeth Boatman, Chicago’s CIO.
“We can pursue these e-business initiatives
knowing that we have a reliable infrastructure
to support them.”
Part of that infrastructure includes tech-
nology from Cisco Systems. In fact, Cisco’s
network products comprise more than 80
percent of the global Internet infrastructure.
For the network design, implementation
and integration know-how that enables
those products to perform at their peak,
Cisco turns to Unisys. As a Cisco Professional
Services partner, Unisys helps Cisco deliver
end-to-end network solutions for today’s
e-businesses. Unisys also supports Cisco’s
internal network, providing network manage-
ment services to help Cisco keep its own
infrastructure up and running.
21
Turning to online procurement to streamline processes and
reduce costs.
Online procure-ment is a key partof the e-businessstrategy of thePublic BuildingsService (PBS), partof the U.S. Gen-eral ServicesAdministration.PBS builds,develops, leasesand manages morethan 280 millionsquare feet of realestate, and thework environ-ments of morethan 1 million federal employeesnationwide. Onlineprocurementthrough servicessuch as UnisysFederal Online ishelping PBS speedprocesses, reducecosts and be moreresponsive to thecomplex needs ofits clients.
22
Unisys team membersenabling online pro-curement for the U.S.federal government:Steve Bayne, MarkBlanks, Eve Butera,Dave Hylton, KristineHarirchian, Jim Tullyand Carlton Weaver.
Online consumer sales capture the
headlines, but the real promise of the
Internet economy lies in business-to-
business e-commerce. In fact, online
procurement is streamlining processes and
reducing costs for a growing number of
organizations — including the U.S.
federal government.
A key enabler of such online
procurement is Unisys Federal Online, a
Unisys e-business. This resource allows
agencies of the federal government to
purchase commodity IT products online.
Unisys Federal Online provides access to
more than 100,000 products from more
than 1,200 leading suppliers. Buyers can
make purchases through the open market
or other government contracts, and can
perform cross-contract searches of products
and pricing. Most orders are delivered
within 24 to 48 hours.
For government entities such as the
Public Buildings Service, online procure-
ment is an important part of an overall
e-business strategy aimed at achieving
greater efficiencies, reducing costs and
better fulfilling their missions.
It’s no surprise, then, that federal invest-
ment in e-business will increase 10 percent
each year, helping boost the federal market
for technology products and services to
$34 billion by 2004, according to market
research firm INPUT. That investment will
help agencies better serve their constituen-
cies, responding to their needs in the blink
of an eye — or the click of a mouse.
23
The Public Buildings Service takes advantageof e-business to manage thousands of U.S.government properties, including such historicstructures as the National Building Museum(left and inset) and the Old Executive OfficeBuilding (below) in Washington, D.C.
24
The strength of Unisys lies in its 36,000 creative, tenacious and
technically excellent people. That’s why Unisys is investing in
employee recruitment, training and development programs that
position Unisys as an employer of choice.
Attracting and retaining high-caliber talent is challenging in
today’s hot job market. Demand for new university and technical
school grads and experienced information technology professionals
far exceeds supply. Unisys competes for talent not only with other
large firms but also with a growing market for independent contrac-
tors and the burgeoning number of e-business startups that are
siphoning off talent.
To build the talented workforce Unisys needs to fuel its growth
agenda, we’re concentrating on three areas. First, we’re e-enabling
our recruiting process by investing in new Web recruiting tools to
increase the number of hires we source through the Internet. Finding
people with the right skills in the shortest time is what recruiting is
all about.
Second, we’ve established a presence at some 70 colleges and
universities worldwide through a revitalized university recruiting
program. In 1999 we recruited 27 percent of new hires, excluding
our U.S. federal government business, directly from university
campuses and technical schools. We expect to continue this success
in 2000, with a target of 35 percent of hires being new graduates.
The third way we’re bringing talent into the company is through
employee referrals. In 1999 we recruited 30 percent of new hires from
this source, and our aim is to grow this to 40 percent. Candidates
referred by current employees generally have the right skills and are a
good fit for our culture. Plus, employee referrals are faster and more
economical than advertisements or recruiters in locating talent.Our college recruitingprogram matchesUnisys executiveswith the schools thatproduce the besttalent for our industry— such as UniversityCollege London,among the top univer-sities in the UnitedKingdom. Unisys wasone of 35 leadingemployers to takepart in the institu-tion’s first-ever IT andEngineering Fair in1999. Pictured isUnisys employee GillPateman (right).
Investing in our employees to succeed in the marketplace.
25
Once on board, Unisys people are eager to hone their skills to be better equipped to solve
customer problems and contribute to Unisys success. Unisys University creates a learning
culture by making education readily accessible to employees around the world.
The University includes six campuses, 10 schools of instruction, hundreds of instructor-
led classes and more than 15,500 computer-based course enrollments. More than 4,900
instructor-led training sessions were conducted for classes totaling 46,000 students in 1999,
and the Unisys University intranet site receives more than 75,000 visits a month. In October
we added an e-business school aimed at helping employees master the complexities of this
burgeoning aspect of our business.
We will continue to invest in our educational and technical certification programs to
ensure that Unisys people have the requisite skills and leadership to meet the needs of our
customers and partners.
As part of the Lead-ership School ofUnisys University,managers attend aspecial class at Get-tysburg NationalMilitary Park, siteof the pivotal battleof the Civil War.Here they explorehow the leadershipissues that werecrucial on the bat-tlefield in 1863have implicationsfor the businesslandscape of today.Pictured are VictorReis, David MunozFallas, Nicolas Sandoval, WendyStubbs, RosemaryFowke, GaryZelasko, RobertPatey, guide RandyKolton and JohnLeuenberger.
~
26
Unisys actively supports the many important charitable and community service organizations
that help improve the quality of life where we live and work. This support takes the form
of leadership, technology, expertise and Unisys contributions to support operational and
program expenses.
The Unisys Volunteer Connection — an electronic meeting ground where Unisys
employees share information about their volunteer activities — is growing rapidly. The
number of Unisys employees who have registered with the Volunteer Connection more than
doubled from last year, and employees report that they volunteered more than 100,000 hours
of personal time in 1999. Those hours trigger cash grants to nonprofit organizations through
our Grants for Givers program. This program recognizes employees who volunteer 50 or
more hours of personal time per year to a nonprofit organization of their choice.
A great example of Unisys people applying their talents in their community is a contin-
uing program supporting Eisenhower Middle School in Norristown, Pennsylvania, near
Unisys headquarters. Now in its sixth year, the Unisys-Eisenhower partnership involves more
than 50 Unisys volunteers who support two key programs. Unisys Lunch Buddies is an
informal mentoring program that matches Unisys employees with middle school students on
a regular basis, supporting academic growth and self-confidence. Unisys PC Buddies links
students, Unisys employees and Unisys technology in the school’s computer lab to help
students gain skills in using computers and the Internet as tools
to support class work and encourage exploration.
Strengthening our communities through employee volunteerism and Unisys resources.
The PC Buddies program links students with Unisysemployees and technology to help children gainskills in using computers and the Internet. Picturedare Unisys employees Jonathan Brach, Lori Beck and Melinda Bean.
27
Another example of Unisys people making a difference is Univida, a charitable volunteer
organization created by Unisys employees in Brazil. Univida is a strong employee organization
that supports more than 125 needy children in São Paulo through donations of food, clothing,
shoes, toys and other items. The group is also active in Rio de Janeiro, where participants donate
goods and visit children and elderly people.
And we continue our focus on science and technology education through the Science
Learning Network project. The project is actively building new Web-based science education
resources through partnerships with leading science museums around the world. These
resources — designed to support the teaching of science both in and outside the classroom —
have been developed in a range of languages, including English, Japanese, Mandarin Chinese,
French and Spanish.
Unisys employeessupport needy children in Rio deJaneiro with dona-tions of food,clothing — and theirtime. Pictured areUnisys employeesMarcia Brandao,Sandra Marques,Claudia Lossio andAline Salamene.
Unisys Around the World
CorporateHeadquartersUnisys Way
Blue Bell,
Pennsylvania 19424
North AmericaUnisys does business in all
50 U.S. states and all 12
Canadian provinces and ter-
ritories, with principal
offices at these locations:
Birmingham, Alabama
Anchorage, Alaska
Calgary, Alberta
Phoenix, Arizona
Tempe, Arizona
Little Rock, Arkansas
Brisbane, California
Camarillo, California
Cupertino, California
Los Angeles, California
Norwalk, California
Sacramento, California
Englewood, Colorado
Shelton, Connecticut
Dover, Delaware
Boca Raton, Florida
Miami, Florida
Tallahassee, Florida
Tampa, Florida
Atlanta, Georgia
Honolulu, Hawaii
Chicago, Illinois
Lisle, Illinois
Lombard, Illinois
Indianapolis, Indiana
Bettendorf, Iowa
West Des Moines, Iowa
Overland Park, Kansas
Frankfort, Kentucky
Baton Rouge, Louisiana
Portland, Maine
Winnipeg, Manitoba
Burlington, Massachusetts
Somerville, Massachusetts
Okemos, Michigan
Eagan, Minnesota
Jackson, Mississippi
St. Louis, Missouri
Omaha, Nebraska
Las Vegas, Nevada
Reno, Nevada
Fredericton, New Brunswick
New Providence,
New Jersey
Trenton, New Jersey
Albany, New York
New York, New York
Rochester, New York
Charlotte, North Carolina
Winston-Salem, North
Carolina
Bismarck, North Dakota
Halifax, Nova Scotia
Brecksville, Ohio
Holland, Ohio
Westerville, Ohio
Oklahoma City, Oklahoma
Ottawa, Ontario
Pickering, Ontario
Toronto, Ontario
Tualatin, Oregon
Harrisburg, Pennsylvania
Montreal, Quebec
Quebec City, Quebec
Columbia, South Carolina
Sioux Falls, South Dakota
Memphis, Tennessee
Austin, Texas
Irving, Texas
North Dallas, Texas
Burlington, Vermont
McLean, Virginia
Richmond, Virginia
Bellevue, Washington
Seattle, Washington
Charleston, West Virginia
Brookfield, Wisconsin
Madison, Wisconsin
LatinAmerica/CaribbeanHeadquarters
Boca Raton, Florida
Principal Offices
Buenos Aires, Argentina
Bridgetown, Barbados+
La Paz, Bolivia+
Rio de Janeiro, Brazil
Sao Paulo, Brazil
Santiago, Chile
Bogota, Colombia
San Jose, Costa Rica
Santo Domingo,
Dominican Republic+
Quito, Ecuador+
San Salvador, El Salvador*
Guatemala City, Guatemala*
Tegucigalpa, Honduras*
Kingston, Jamaica+
Mexico City, Mexico
Managua, Nicaragua*
Panama City, Panama+
Lima, Peru
San Juan, Puerto Rico
Port of Spain, Trinidad+
Montevideo, Uruguay
Caracas, Venezuela
U.K./Africa/MiddleEast/IndiaHeadquarters
Uxbridge, England
Principal Offices
Algiers, Algeria
Baku, Azerbaijan+
Manama, Bahrain+
Cotonou, Benin+
Gaborone, Botswana
Ouagadougou, Burkina
Faso+
Doula, Cameroon+
Nicosia, Cyprus+
Cairo, Egypt+
London, England
Addis Ababa, Ethiopia+
Libreville, Gabon+
Accra, Ghana+
Mumbai, India+
Tehran, Iran+
Dublin, Ireland
Ramat Gan, Israel
Tel Aviv, Israel+
Abidjan, Ivory Coast
Amman, Jordan+
Nairobi, Kenya+
Safat, Kuwait+
Beirut, Lebanon+
Blantyre, Malawi+
28
U.S. FederalGovernmentHeadquarters
McLean, Virginia
Principal Offices
Montgomery, Alabama
Camarillo, California
Ft. Collins, Colorado
Washington, D.C.
Niceville, Florida
Fairview Heights, Illinois
Frankfort, Kentucky
Baton Rouge, Louisiana
Hanover, Maryland
Lanham, Maryland
Somerville, Massachusetts
St. Louis, Missouri
Omaha, Nebraska
Trenton, New Jersey
Oklahoma City, Oklahoma
Hillsboro, Oregon
Portland, Oregon
Arlington, Virginia
Crystal City, Virginia
Falls Church, Virginia
Glen Allen, Virginia
Newington, Virginia
Reston, Virginia
Virginia Beach, Virginia
Centers ofExcellenceMajor sites where Unisys
showcases expertise in
specific technologies or
markets.
Melbourne, Australia
Sydney, Australia
Vienna, Austria
Brussels, Belgium
Sao Paulo, Brazil
Mission Viejo, California
Santiago, Chile
Bogota, Colombia
San Jose, Costa Rica
London, England
Uxbridge, England
Boca Raton, Florida
Paris, France
Atlanta, Georgia
Frankfurt, Germany
Sulzbach, Germany
Milan, Italy
Tokyo, Japan#
Kuala Lumpur, Malaysia
Burlington, Massachusetts
Mexico City, Mexico
Plymouth, Michigan
Eagan, Minnesota
Roseville, Minnesota
Amsterdam, Netherlands
Farmington, New York
Auckland, New Zealand
Halifax, Nova Scotia
Blue Bell, Pennsylvania
Kennett Square,
Pennsylvania
Malvern, Pennsylvania
Tredyffrin, Pennsylvania
Manila, Philippines
Lisbon, Portugal
Johannesburg, South Africa
Madrid, Spain
Bamako, Mali+
Valetta, Malta+
Nouakchott, Mauritania+
Port Louis, Mauritius+
Casablanca, Morocco+
Windhoek, Namibia
Niamey, Niger+
Lagos, Nigeria+
Belfast, Northern Ireland+
Ruwi, Oman+
Karachi, Pakistan
Riyadh, Saudi Arabia+
Dakar, Senegal
Johannesburg, South Africa
Dar es Salaam, Tanzania+
Lome, Togo+
Tunis, Tunisia+
Kampala, Uganda
Dubai, United Arab
Emirates+*
Lusaka, Zambia
Harare, Zimbabwe+
Continental EuropePrincipal Offices
Vienna, Austria
Brussels, Belgium
Sofia, Bulgaria+
Zagreb, Croatia+
Prague, Czech Republic
Copenhagen, Denmark
Helsinki, Finland
Paris, France
Frankfurt, Germany
Gibraltar+
Athens, Greece+
Budapest, Hungary
Reykjavik, Iceland+
Milan, Italy
Almaty, Kazakhstan+
Riga, Latvia+
Vilnius, Lithuania+
Luxembourg
Skopje, Macedonia+
Amsterdam, Netherlands
Oslo, Norway
Warsaw, Poland
Lisbon, Portugal
Bucharest, Romania+
Bratislava, Slovak Republic
Ljubljana, Slovenia+
Madrid, Spain
Stockholm, Sweden
Thalwil, Switzerland
Zurich, Switzerland
Ankara, Turkey+
Istanbul, Turkey+
Tashkent, Uzbekistan+
Belgrade, Yugoslavia+
Asia NorthHeadquarters
Hong Kong, China
Principal Offices
Beijing, China
Guangzhou, China
Shanghai, China
Seoul, South Korea
Taipei, Taiwan
Asia SouthHeadquarters
Kuala Lumpur, Malaysia
Principal Offices
Dacca, Bangladesh+
Jakarta, Indonesia+
Manila, Philippines
Singapore
Colombo, Sri Lanka+
Bangkok, Thailand
Hanoi, Vietnam*
As a global company, Unisys offers the breadth of resources to support our customers in every part of the world. Listed are major sites where Unisys serves clients,
develops technologies or markets solutions. This range of locations is complemented by a vast network of sales, marketing and support sites worldwide.
29
South PacificHeadquarters
Sydney, Australia
Principal Offices
Adelaide, Australia
Brisbane, Australia
Canberra, Australia
Melbourne, Australia
Perth, Australia
Auckland, New Zealand
Wellington, New Zealand
JapanHeadquarters
Tokyo#
Zurich, Switzerland
Austin, Texas
Caracas, Venezuela
McLean, Virginia
Redmond, Washington
Outsourcing CentersMajor sites where Unisys
runs information operations
or provides other support
services.
Buenos Aires, Argentina
Phoenix, Arizona
North Ryde, Australia
Sao Paolo, Brazil
Bakersfield, California
Concord, California
Long Beach, California
Milton Keynes, England
Mexico City, Mexico
Eagan, Minnesota
Amsterdam, Netherlands
Pearl River, New York
Morrisville, North Carolina
Alingsas, Sweden
Reston, Virginia
Seattle, Washington
Engineering,Development &DistributionMajor sites where Unisys
designs hardware, develops
software and distributes
products. Distribution is part
of a network of 125 centers
and 8,000 stocking locations
worldwide.
Chandler, Arizona
North Ryde, Australia
Brussels, Belgium
Sao Paulo, Brazil
Mission Viejo, California
Rancho Bernardo, California
Toronto, Canada
Santiago, Chile
Hong Kong, China
Bogota, Colombia
Uxbridge, England
Norcross, Georgia
Sulzbach, Germany
Elk Grove Village, Illinois
Milan, Italy
Tokyo, Japan#
Plymouth, Michigan
Eagan, Minnesota
Roseville, Minnesota
Sassenheim, Netherlands
Blue Bell, Pennsylvania
Tredyffrin, Pennsylvania
Manila, Philippines
Salt Lake City, Utah
Caracas, Venezuela
Redmond, Washington
Support CentersMajor sites where Unisys
provides electronic and
telephone services to sup-
port hardware and software
systems.
Buenos Aires, Argentina
Brisbane, Australia
Canberra, Australia
Melbourne, Australia
Sydney, Australia
Vienna, Austria
Brussels, Belgium
Rio de Janeiro, Brazil
Sao Paulo, Brazil
Santiago, Chile
Hong Kong, China
Bogota, Colombia
San Jose, Costa Rica
Copenhagen, Denmark
Milton Keynes, England
Helsinki, Finland
Paris, France
Atlanta, Georgia
Frankfurt, Germany
Milan, Italy
Kuala Lumpur, Malaysia
Mexico City, Mexico
Plymouth, Michigan
Roseville, Minnesota
Amsterdam, Netherlands
Wellington, New Zealand
Blue Bell, Pennsylvania
Lima, Peru
Lisbon, Portugal
San Juan, Puerto Rico
Seoul, South Korea
Madrid, Spain
Stockholm, Sweden
Zurich, Switzerland
Taipei, Taiwan
Caracas, Venezuela
To contact a Unisys office close to you:
In the U.S. and Canada: 800-338-3501 or 215-986-4011
Oustide the U.S.: +215-986-4011
On the Web: http://www.app1.unisys.com/GlobalOps
+ Distributorship
# Joint venture
* Representative
office
30
Unisys Corporation
Management’s Discussion and Analysis of Financial Condition and Results of Operations
Results of operations
For 1999, the company reported net income of $510.7 million, or $1.59 per diluted common
share, compared to $376.4 million, or $1.01 per diluted common share, for 1998. The current
year included a one-time tax benefit of $22.0 million, or $.07 per diluted common share,
related to a new U.S. Treasury income tax regulation, as well as an extraordinary charge
of $12.1 million, or $.04 per diluted share, for the early extinguishment of debt. Excluding
those items, diluted earnings per share in 1999 was $1.56.
In 1997, net income before one-time charges was $176.4 million, or $.35 per common
share. In the fourth quarter of 1997, the company recorded one-time charges against net
income of $1.0 billion. Including these charges, the company had a 1997 net loss of $852.9
million, or $5.25 per share. For further information on the 1997 fourth quarter charges,
see Note 5 of Notes to Consolidated Financial Statements.
In August of 1999, the company acquired PulsePoint Communications, Tech Hackers,
Inc. and Publishing Partners International, Inc. Approximately 2.9 million shares of the
company’s common stock were exchanged for all of the outstanding shares of these
companies. The transactions were accounted for as poolings of interests and all prior
periods presented were restated.
The following comparisons of income statement categories exclude the one-time
charges in 1999 and 1997 discussed above.
Revenue for 1999 was $7.54 billion compared to $7.24 billion in 1998 and $6.66 billion
in 1997. Revenue in 1999 and 1998 increased 4% and 9%, respectively. Excluding the negative
impact of foreign currency translation in 1999 and 1998, revenue in those years would have
risen 7% and 11%, respectively. Revenue from international operations in 1999, 1998, and
1997 was $4.19 billion, $4.09 billion and $3.93 billion, respectively. Revenue from U.S.
operations was $3.35 billion in 1999, $3.15 billion in 1998, and $2.73 billion in 1997.
Total gross profit percent was 35.6% in 1999, 34.1% in 1998, and 35.0% in 1997.
The increase in 1999 from 1998 reflects improvements in both the services and technology
segments.
Selling, general and administrative expenses were $1.38 billion in 1999 (18.4% of
revenue), $1.36 billion in 1998 (18.8% of revenue), and $1.43 billion in 1997 (21.5% of
revenue).
Research and development expenses in 1999 were $339.4 million compared to
$308.3 million in 1998 and $309.9 million in 1997.
In 1999, the company reported operating income of $960.7 million (12.7% of revenue)
compared to $799.0 million (11.0% of revenue) in 1998 and $588.8 million (8.8% of
revenue) in 1997.
Information by business segment for 1999, 1998, and 1997 is presented below:
(Millions of dollars) Total Eliminations Services Technology
AssetsCurrent assetsCash and cash equivalents $ 464.0 $ 616.4Accounts and notes receivable, net 1,430.5 1,239.0Inventories 372.9 471.0Deferred income taxes 472.7 428.8Other current assets 105.6 88.9
Goodwill 12.5 8.9 963.9(Increase) in deferred income taxes, net (9.9) (26.7) (25.2)(Increase) decrease in receivables, net (244.5) (277.3) 24.9Decrease in inventories 98.0 94.4 80.6(Decrease) increase in accounts payable and other accrued liabilities (81.8) 103.1 (233.2)Increase in estimated income taxes 78.2 148.0 32.9(Decrease) increase in other liabilities (2.2) 13.2 (85.6)(Increase) decrease in other assets (159.2) (57.6) 106.6Other 63.1 (1.7) 102.2
Net cash provided by operating activities 517.6 642.2 370.5
Cash flows from investing activitiesProceeds from investments 1,033.8 1,991.0 1,662.5Purchases of investments (1,013.8) (2,006.5) (1,630.0)Proceeds from sales of properties 47.9 51.1 5.1Investment in marketable software (122.8) (100.3) (133.5)Capital additions of properties (219.6) (209.1) (184.0)Purchases of businesses (53.9) (3.9) (22.2)Proceeds from marketable securities 4.8
Net cash (used for) investing activities (328.4) (277.7) (297.3)
Cash flows from financing activitiesRedemption of preferred stock (197.0) (150.0)Proceeds from issuance of long-term debt 30.3 197.3Payments of long-term debt (164.4) (749.2) (.1)Net (reduction in) proceeds from short-term borrowings (25.6) 9.6 28.4Dividends paid on preferred shares (59.4) (106.5) (113.1)Proceeds from employee stock plans 87.7 79.5 8.6Costs of debt conversions (46.1)Proceeds from issuance of preferred stock 13.1Other 6.6
Net cash (used for) financing activities (328.4) (569.3) (252.6)
Effect of exchange rate changes on cash and cash equivalents (13.2) (3.0) (24.9)
Net cash used for continuing operations (152.4) (207.8) (204.3)
Net cash used for discontinued operations (19.1)
Decrease in cash and cash equivalents (152.4) (207.8) (223.4)Cash and cash equivalents, beginning of year 616.4 824.2 1,047.6
Cash and cash equivalents, end of year $ 464.0 $ 616.4 $ 824.2
See notes to consolidated financial statements.
Unisys Corporation
Consolidated Statement of Stockholders’ EquityOther, Accumulated
Principally Other ComprehensivePreferred Common Accumulated Treasury Paid-In Comprehensive Income
(Millions) Stock Stock Deficit Stock Capital Income (Loss)* (Loss)
Balance at December 31, 1996 $ 1,425.2 $1.8 $0,(836.1) $(16.3) $1,429.5 $(390.1)
Conversions to common stock (.1) .7 606.0
Issuance of stock under stockoption and other plans 4.0 8.6
Issuance of preferred stock 13.1
Net loss (852.9) $ (852.9)
Other comprehensive income –translation adjustments (58.0) (58.0)
Comprehensive loss $ (910.9)
Dividends (113.1)
Unearned compensation 3.0
Tax benefit related to stock plans 1.5
Other .1 1.0
Balance at December 31, 1997 1,438.2 2.5 (1,802.1) (12.2) 2,049.6 (448.1)
Conversions to common stock (.1) .5
Conversion of shareholder notes 6.6
Issuance of stock under stock
option and other plans .1 (11.4) 90.2
Net income 376.4 $ 376.4
Other comprehensive income –translation adjustments (83.5) (83.5)
Comprehensive income $ 292.9
Dividends (106.5)
Unearned compensation 4.8
Tax benefit related to stock plans 30.6
Balance at December 31, 1998 1,444.7 2.6 (1,532.2) (23.6) 2,175.7 (531.6) (911.6
Conversions to common stock (1,245.3) .4 1,271.2
Redemption of preferred stock (197.0)
Issuance of stock under stockoption and other plans .1 (17.8) 103.4
Net income 510.7 $ 510.7
Other comprehensive income –
translation adjustments (38.8) (38.8)
Comprehensive income $ 471.9
Dividends (32.9)
Unearned compensation
Tax benefit related to stock plans 66.1
Other (2.4))
Balance at December 31, 1999 $ – $3.1 $(1,054.4) $(41.4) $3,616.4 $(570.4)
*Entire amount relates to foreign currency translation adjustments.
See notes to consolidated financial statements.
41
42
Unisys Corporation
Notes to Consolidated Financial Statements
Revenue recognition Sales revenue is recorded upon shipment of product in thecase of sales contracts and upon installation in the case of sales-type leases. Revenuefrom equipment maintenance is recorded as earned over the lives of the respectivecontracts. Revenue from software licenses is recorded when persuasive evidence of anarrangement exists, delivery has occurred, thefee is fixed or determinable, and collectibilityis probable. Revenue for post-contractsoftware support arrangements, which aremarketed separately, is recorded over thesupport period or as the contract elements are delivered.
Revenue under systems integration and services contracts is recognized on the basis of the estimated percentage ofcompletion of services rendered or whenservices have been performed and accepted,depending on the nature of the project.
Accounting for large multi-year, fixed-pricesystems integration contracts involvesconsiderable use of estimates in determining revenue, costs, and profits. When estimatesindicate a loss under a contract, cost ofrevenue is charged with a provision for such loss. Revisions in profit estimates arereflected in the period in which the facts that give rise to the revision become known.Income taxes Income taxes are provided on taxable income at the statutoryrates applicable to such income. Deferredtaxes have not been provided on thecumulative undistributed earnings of foreignsubsidiaries because such amounts areexpected to be reinvested indefinitely.Marketable software The cost ofdevelopment of computer software to be sold or leased incurred subsequent toestablishment of technological feasibility iscapitalized and amortized to cost of sales overthe estimated revenue-producing lives of theproducts, but not in excess of three yearsfollowing product release.
Summary of significantaccounting policiesPrinciples of consolidation Theconsolidated financial statements include theaccounts of all majority-owned subsidiaries.Investments in companies representingownership interests of 20% to 50% areaccounted for by the equity method.Use of estimates The preparation of financial statements in conformity withgenerally accepted accounting principlesrequires management to make estimates andassumptions that affect the amounts reportedin the financial statements and accompanyingnotes. Actual results could differ from thoseestimates.Cash equivalents All short-term investments purchased with a maturity ofthree months or less are classified as cashequivalents.
Inventories Inventories are valued at thelower of cost or market. Cost is determinedprincipally on the first-in, first-out method.
Properties and depreciationProperties are carried at cost and aredepreciated over the estimated lives of such assets using the straight-line method.Outsourcing equipment is depreciated over theshorter of the asset lives or the terms of thecontract. For other classifications of properties,the principal rates used are summarized below:
Rate per Year (%)
Buildings 2-5
Machinery and office equipment 5-25
Rental equipment 25
Advertising costs The companyexpenses all advertising costs as they areincurred. The amount charged to expenseduring 1999, 1998, and 1997 was $48.6,$48.2, and $53.1 million, respectively.
1
Translation of foreign currencyThe local currency is the functional currencyfor most of the company’s internationalsubsidiaries and, as such, assets and liabilitiesare translated into U.S. dollars at year-endexchange rates. Income and expense itemsare translated at average exchange ratesduring the year. Translation adjustmentsresulting from changes in exchange rates are reported in other comprehensive income.Exchange gains and losses on foreigncurrency swaps designated as hedges ofinternational net asset investments andexchange gains and losses on intercompanybalances of a long-term investment nature arealso reported in other comprehensive income.
For those international subsidiariesoperating in hyper-inflationary economies, the U.S. dollar is the functional currency and,as such, non-monetary assets and liabilitiesare translated at historical exchange rates andmonetary assets and liabilities are translatedat current exchange rates. Exchange gainsand losses arising from translation areincluded in other income (expense), net.Derivative financial instrumentsThe derivative financial instruments used bythe company are foreign exchange forwardcontracts, foreign exchange options, foreigncurrency swaps and interest rate swaps. Thecompany does not hold or issue derivativesfor speculative trading purposes.
For those financial instruments involvingforeign exchange, no impact on financialposition or results of operations would resultfrom a change in the underlying exchangerate. All of the company’s foreign currencycontracts and options have been designatedas and are effective as hedges againstspecific exposures and have been accountedfor as such. Therefore, a change in thederivative’s value would be offset by anopposite change in the hedged exposure.
The company has interest rate and foreigncurrency swaps. In the interest rate swaps,the company receives payments based on aU.S. fixed rate of interest and pays interestbased on a foreign currency denominated
floating rate. Over the terms of these agree-ments, the difference between what thecompany receives and pays for the interestrate swaps is recognized in interest expense.The company uses the foreign currencyswaps in order to hedge the foreign currencyexposure of its net investments in foreignsubsidiaries and equity investments. Thecurrency effects of the hedges are reflected in accumulated other comprehensive income(loss), thereby offsetting a portion of theforeign currency translation of net assets.
The company monitors its risks inderivative transactions by periodicallyassessing the cost of replacing, at marketrates, those contracts in the event of defaultby the counterparty. The company believessuch risk to be remote. In addition, beforeentering into derivative contracts, andperiodically during the life of the contract, the company reviews the counterparties’ financial condition.
Gains or losses on foreign exchangeforward contracts and the cost of foreigncurrency options are deferred in currentliabilities and other current assets, respec-tively. The cost of options is reported inincome ratably over the option term, and anygains thereon as well as any gains or losseson foreign exchange contracts are recognizedin income (either in revenue or cost ofrevenue) when the transactions being hedged are recognized. Cash flows on suchinstruments are reported in investing activitiesas proceeds or purchases of investments.
If the criteria for hedge accountingdiscussed above were not met, gains or losses on these instruments would beincluded in income currently and would not be deferred. If a derivative financial instrumentis terminated before the transaction date ofthe hedged transaction, any deferred gain orloss would continue to be deferred until thetransaction date. If an expected transaction is no longer likely to occur, any deferred gainsor losses on financial instruments that hedge such a transaction would be reported inincome immediately.
43
44
Year ended December 31 (Millions, except per share data) 1999 1998 1997
Basic earnings per share computation
Income (loss) before extraordinary item $ 522.8 $ 376.4 $ (852.9)
Less dividends on preferred shares (36.7) (106.5) (111.1)
Income (loss) available to common stockholders before extraordinary item 486.1 269.9 (964.0)
Extraordinary item (12.1)
Net income (loss) available to common stockholders $ 474.0 $ 269.9 $ (964.0)
Weighted average shares (thousands) 287,290 253,335 183,550
Basic earnings per share
Before extraordinary item $ 1.69 $ 1.07 $ (5.25)
Extraordinary item (.04)
Total $ 1.65 $ 1.07 $ (5.25)
Diluted earnings per share computation
Income (loss) available to common stockholders before extraordinary item $ 486.1 $ 269.9 $ (964.0)
Plus interest expense on assumed conversion of 8 1/4% Convertible Notes due 2006, net of tax .3 1.5
Income (loss) available to common stockholdersplus assumed conversions before extraordinary item 486.4 271.4 (964.0)
Extraordinary item (12.1)
Net income (loss) available to common stockholders $ 474.3 $ 271.4 $ (964.0)
Weighted average shares (thousands) 287,290 253,335 183,550
Plus incremental shares from assumed conversions:
Preferred stock 877 1,350
Employee stock plans 9,835 11,164
8 1/4% Convertible Notes due 2006 818 3,994
Adjusted weighted average shares 298,820 269,843 183,550
Diluted earnings per share
Before extraordinary item $ 1.63 $ 1.01 $ (5.25)
Extraordinary item (.04)
Total $ 1.59 $ 1.01 $ (5.25)
The shares listed below were not included in the computation of diluted earnings per share because to do so would have been antidilutive for the periods presented.
Year ended December 31 (thousands) 1999 1998 1997
Employee stock plans 6,680 101 22,792
Preferred stock 47,448 48,800
8 1/4% convertible notes due 2006 4,042
2Earnings per shareThe following table shows how earnings per share was computed for the three years ended December 31, 1999.
hedging activities. SFAS No. 133 requires a company to recognize all derivatives as either assets or liabilities in the statement of financial position and measure thoseinstruments at fair value. Management isevaluating the impact this statement mayhave on the company’s financial statements.
As discussed in Note 5, effective December31, 1997, the company elected to change itsmethod of measuring goodwill impairment.
One-time chargesStrategic realignments In the fourthquarter of 1997, the company recorded apretax charge of $113.6 million, $103.7 millionafter tax, or $.56 per diluted common share.The charge was related to plans to discon-tinue the manufacturing and assembly ofpersonal computers and low-end servers, andto dispose of a small, non-strategic technologyproduct. The charge included (a) $64.9 millionfor work-force reductions of approximately1,000 people (500 U.S.-based and 500European-based), (b) $46.2 million for productand program discontinuances, and (c) $2.5million associated with facilities. A furtherbreakdown of these costs is as follows (in millions of dollars):
45
3
5
4
AcquisitionsDuring 1999, the company acquired thefollowing companies: Datamec, a Brazilianapplication outsourcing company; MotayElectronics, a U.S.-based company thatprovides advanced automated burn-in systems and products to the semiconductorindustry; and City Lifeline Systems Limited, a U.K.-based company that provides softwareand solutions for organizations trading in fixedincome securities. These companies wereacquired for an aggregate purchase price of approximately $60.0 million and wereaccounted for under the purchase method of accounting.
During 1999, the company also acquiredthe following U.S. companies: PulsePointCommunications, a developer of carrier-classenhanced services solutions for the communi-cations industry; Tech Hackers, Inc., a devel-oper of software tools and enterprise systemsfor securities trading and financial operations;and Publishing Partners International, Inc., aprovider of advertising management softwareand services for the publishing industry.Approximately 2.9 million shares of the com-pany’s common stock were exchanged for allof the outstanding shares of these companies.These acquisitions were accounted for underthe pooling of interests method of accountingand all prior periods were restated.
Accounting changesIn 1999, the Securities and ExchangeCommission’s staff issued Staff AccountingBulletin (“SAB”) No. 101, “Revenue Recog-nition in Financial Statements.” SAB No. 101provides guidance on revenue recognition andhad no effect on the company’s consolidatedfinancial position, consolidated results ofoperations, or liquidity.
In June 1998, the Financial AccountingStandards Board issued Statement of Finan-cial Accounting Standards (“SFAS”) No. 133,“Accounting for Derivative Instruments andHedging Activities.” This statement, which is effective for the year beginning January 1,2001, establishes accounting and reportingstandards for derivative instruments and for
Personal Non-StrategicComputers Technology
Cost Category Total Manufacturing Product
Work-force reductions – Europe $ 54.5 $47.7 $ 6.8
U.S. 10.4 10.4
Subtotal 64.9 58.1 6.8
Products and Programs –Provision for assetwrite-downs 15.0 13.7 1.3
Associated goodwill 33.7 18.3 15.4
Cumulative translationadjustments (2.5) (2.5)
Subtotal 46.2 32.0 14.2
Facilities (representingprovision for idlelease costs) 2.5 2.5
Total charge $113.6 $90.1 $23.5
46
Cash expenditures in 1999 and 1998relating to the above restructuring actionswere $8.9 million and $32.6 million,respectively. Employee levels were reduced in 1999 and 1998 by 59 and 600 people,respectively, through termination actions, and, in addition, approximately 20 positions will be terminated in 2000 as certain supportoperations are phased out in completion ofthe original plan to discontinue PC manufac-turing. The $6.3 million balance of the reserve at December 31, 1999 for work-forcereductions represents amounts of terminationindemnities expected to be paid for theseactions.Other restructuring actions Theamounts below relate principally to restruc-turing actions taken in 1995. In October 1995,the company announced that it would realigninternally into three business units – informa-tion services, support services, and computersystems – each with its own marketing andsales organization. In the fourth quarter of1995, in connection with this realignment, the company recorded a restructuring chargeof $717.6 million. The charge initially covered(a) $436.6 million for work-force reductions of approximately 7,900 people includingseverance, notice pay, medical, and otherbenefits, (b) $218.6 million for consolidation of office facilities and manufacturing capacity,and (c) $62.4 million for costs associated withproduct and program discontinuances. Activityduring the years ended December 31, 1999,1998 and 1997 in the reserves related tothese restructuring actions was as follows:
Activity related to these 1997 restructuringactions during the years ended December 31,1999, 1998 and 1997, was as follows:
Work-Force(Millions) Total Reductions(1) Products Facilities
Total charge $113.6 $ 64.9 $ 46.2 $ 2.5
Immediateasset write-downs (31.2) (31.2)
Balance atDec. 31, 1997 82.4 64.9 15.0 2.5
Utilized (40.0) (32.0) (8.0)
Other(2) (20.8) (18.3) (2.5)
Balance atDec. 31, 1998 21.6 14.6 7.0 –
Utilized (12.1) (7.3) (2.9) (1.9)
Other(2) .5 (1.0) (.7) 2.2
Balance atDec. 31, 1999 $ 10.06 $ 6.3 $ 3.4 $ .3
Expected futureutilization:
2000 $ 6.4 $ 3.6 $ 2.8
2001 andthereafter 3.6 2.7 .6 $ .3
(1) Includes severance, notice pay, medical, and other benefits.(2) Includes changes in estimates, reversals of excess reserves, translation
adjustments, and additional provisions.
In 1998, there was a reduction in accrued work-force provisions, principally for the reversal of unneeded reserves due to approximately 150 voluntary terminations, and the favorable results of negotiations ontermination indemnities relating principally to PC manufacturing personnel. In addition, as a result of the sale of the non-strategictechnology product operations in 1998 onmore favorable terms than originally antici-pated, the company reversed $6.0 million ofunneeded accruals, principally for terminationindemnities for approximately 130 people.
Cash expenditures associated with theserestructuring actions in 1999, 1998 and 1997were $35.7 million, $85.8 million and $178.7million, respectively. Personnel reductionsrelated to these restructuring actions during1999, 1998 and 1997 were approximately 225,300 and 2,600, respectively. The $16.2 millionbalance of the reserve at December 31, 1999for work-force reductions represents theremaining balance of $12.2 million ofextended payment severance packages for terminated employees and an accrual of $4.0 million for planned work-force reductions of approximately 100 people, which wereidentified in 1998 and late 1997 and which are expected to be completed by early 2001.The $30.4 million 1999 ending reserve balance for facility consolidations representscontractual obligations (reduced by sub-leaseincome) existing under long-term leases ofvacated facilities.
Work-Force(Millions) Total Reductions(1) Facilities(2) Products
(1) Includes severance, notice pay, medical, and other benefits.
(2) Includes consolidation of office facilities and manufacturing capacity.
(3) Includes changes in estimates, reversals of excess reserves, translation adjustments, and additional provisions.
Other charges Effective December 31,1997, the company elected to change itsmethod of measuring goodwill impairment,which is reported as a change in accountingprinciple that is inseparable from a change in estimate. Prior to the change, whenimpairment indicators existed, goodwill wasevaluated for impairment and any impairmentwould have been measured based oncomparing the unamortized goodwill toprojected undiscounted operating results.Under the company’s new accountingmethod, any impairment of goodwill indicatedby such comparison would be measured bydiscounting projected cash flows using adiscount rate commensurate with the risksinvolved. If the estimate of the futurediscounted cash flows, net of the carryingamount of tangible net assets, is less than thecarrying amount of goodwill, the differencewould be charged to operations. When agoodwill impairment must be recognized, thecompany believes the discounted cash flowmethod is a better measurement of theremaining value of goodwill, considering thecompany’s circumstances, particularly therapid changes that continue to occur in themarketplace away from the proprietarytechnology and maintenance businesses, and the continuing declines in revenue and margins in these businesses.
In the fourth quarter of 1997, the companyrecorded a charge of $883.6 million, or $4.81per diluted common share, principally for the writeoff of goodwill related to the 1986acquisition of Sperry Corporation. Yearlyamortization of such goodwill wasapproximately $36 million.
In connection with a strategic operationsreview in the fourth quarter of 1997, indica-tors of a potential impairment were identified,and the company concluded that it should test the remaining Sperry goodwill for recoverability. The most significant impairmentindicator was an expected decline in Sperry-related revenue. The majority of Sperry-relatedrevenue results from hardware and associatedoperating systems software. Since the acqui-sition of Sperry in 1986, experience has seena shift from centralized processing to desktopcomputing with customer demand for openarchitectures. This shift in market demand led
47
48
6
At December 31, 1999 and 1998, work in process inventories included $33.3 and$85.9 million, respectively, of costs related to long-term contracts.
Estimated income taxes
December 31 (Millions) 1999 1998
Parts and finished equipment $236.8 $ 264.1
Work in process and materials 136.1 206.9
Total inventories $372.9 $ 471.0
Accounts receivable andinventoriesAccounts and notes receivable, net includeunbilled accounts receivable, for whichrevenue has been recorded under the percent-age of completion method, at December 31,1999 and 1998 of $217.8 million and $184.8 million, respectively.
Inventories comprise the following:
Year ended December 31 (Millions) 1999 1998 1997
Income (loss) before income taxes
United States $ 485.4 $ 397.8 $ (960.4)
Foreign 284.9 196.4 212.3
Total income (loss) before income taxes $ 770.3 $ 594.2 $ (748.1)
Estimated income taxes (benefit)
Current
United States $ 22.3 $ 26.7 $ 28.0
Foreign 112.1 51.8 69.0
State and local 10.5 23.3 23.1
Total 144.9 101.8 120.1
Deferred
United States 75.7 115.2 (21.9)
Foreign 24.4 .7 6.8
State and local 2.5 .1 (.2)
Total 102.6 116.0 (15.3)
Total estimated income taxes $ 247.5 $ 217.8 $ 104.8
to industry-wide erosions in demand for mainframe systems and continuedcompetitive pricing pressure. Anothersignificant aspect to the decline in Sperry-related revenue is the continuing industry-wide erosion of proprietary maintenancerevenue and margin streams. The companyprepared an estimate of projected cash flowsrelating to the remaining Sperry businesses.The sum of these expected future undis-counted cash flows were less than thecarrying amount of the remaining Sperry goodwill, which indicated the existence of animpairment loss. In preparing the cash flowanalysis used by the company to measuregoodwill impairment for Sperry, the followingmajor assumptions were used: (1) the com-pany’s one year detail plan and its three-yearstrategic plan were used as a basis to projectfuture results, (2) a risk-based rate of 17.3%was used to discount future cash flows, (3) a 6% compounded annual decline inSperry-related revenue, (4) a continuation ofdeclining gross profit margins, (5) expenselevels were based on a percent of revenue,consistent with historical experience, and (6) a 40% effective income tax rate. Theprojections of Sperry-related cash flows were based on management’s best estimateof future results. Actual results could differmaterially from those estimates.
In addition, in the fourth quarter of 1997, the company completed the conversionof $271.2 million of its 81⁄4% convertiblesubordinated notes due 2006. The conversionwas in response to a special offer to payholders of these notes a cash premium foreach note converted. The company recorded a one-time charge of $42.0 million, or $.23 per diluted common share, to cover the cost of this special offer.Summary The 1997 restructuring andother charges were recorded in the followingstatement of income classifications: Cost ofrevenue, $57.1 million; selling, general andadministrative expenses, $12.3 million;research and development expenses, $4.9 million; impairment charges, $922.9million; and other income (expense), net, $42.0 million.
7
Following is a reconciliation of estimated income taxes at the United States statutory tax rate to estimated income taxes asreported:
Year ended December 31 (Millions) 1999 1998 1997
United States statutory incometax (benefit) $269.6 $208.0 $(261.8)
Difference in estimated incometaxes on foreign earnings, losses,and remittances 3.8 (46.1) (35.7)
State taxes 9.3 15.1 14.8
Tax refund claims, audit issues, and other matters (18.0) 31.2 42.7
Amortization of goodwill 2.3 1.8 335.1
U.S. tax law change (22.0)
Other 2.5 7.8 9.7
Estimated income taxes $247.5 $217.8 $ 104.8
The tax effects of temporary differencesand carryforwards that give rise to significantportions of deferred tax assets and liabilitiesat December 31, 1999 and 1998, were as follows:
December 31 (Millions) 1999 1998
Deferred tax assets
Capitalized research and development $ 596.1 $ 591.6
Tax loss carryforwards 254.2 282.9
Foreign tax credit carryforwards 114.4 232.3
Other tax credit carryforwards 243.3 140.7
Prepayments 138.5 109.7
Postretirement benefits 82.4 91.0
Employee benefits 88.5 64.2
Depreciation 46.3 60.8
Restructuring 38.2 50.7
Other 281.7 239.0
1,883.6 1,862.9
Valuation allowance (308.7) (354.5)
Total deferred tax assets $1,574.9 $1,508.4
Deferred tax liabilities
Pensions $ 424.1 $ 337.3
Other 75.3 110.0
Total deferred tax liabilities $ 499.4 $ 447.3
Net deferred tax assets $1,075.5 $1,061.1
SFAS No. 109 requires that deferred taxassets be reduced by a valuation allowance if it is more likely than not that some portionor all of the deferred tax asset will not berealized. During 1999, the net decrease in the valuation allowance was $45.8 million.Included in this decrease was a one-time taxbenefit of $22.0 million, or $.07 per dilutedcommon share, related to a new U.S. Treasuryincome tax regulation pertaining to the use ofnet operating loss carryforwards of acquiredcompanies.
Cumulative undistributed earnings offoreign subsidiaries, for which no U.S. income or foreign withholding taxes have been recorded, approximated $790.0 million at December 31, 1999. Such earnings areexpected to be reinvested indefinitely.Determination of the amount of unrecognizeddeferred tax liability with respect to suchearnings is not practicable. The additionaltaxes payable on the earnings of foreignsubsidiaries, if remitted, would be substan-tially offset by U.S. tax credits for foreigntaxes already paid. While there are no specificplans to distribute the undistributed earningsin the immediate future, where economicallyappropriate to do so, such earnings may beremitted.
Cash paid during 1999, 1998, and 1997 for income taxes was $96.6, $92.7, and $80.0 million, respectively.
At December 31, 1999, the company has U.S. federal and state and local tax loss carryforwards and foreign tax losscarryforwards for certain foreign subsidiaries,the tax effect of which is approximately$254.2 million. These carryforwards will expire as follows (in millions): 2000, $8.6;2001, $7.4; 2002, $7.5; 2003, $12.1; 2004,$10.4; and $208.2 thereafter. The company also has available tax credit carryforwards of approximately $357.7 million, which willexpire as follows (in millions): 2000, $9.0;2001, $62.0; 2002, $56.6; 2003, $7.2; 2004, $7.5; and $215.4 thereafter.
The company’s net deferred tax assetsinclude substantial amounts of capitalizedresearch and development, and tax creditcarryforwards. Failure to achieve forecastedtaxable income might affect the ultimaterealization of the net deferred tax assets.There can be no assurance that in the futurethere would not be increased competition or
49
50
Long-term debtLong-term debt comprises the following:
Total long-term debt maturities in 2000,2001, 2002, 2003, and 2004 are $22.9, $17.9,$.3, $399.7, and $334.4 million, respectively.
Cash paid during 1999, 1998, and 1997 for interest was $141.5, $185.6, and $253.1million, respectively.
As discussed in Note 13, the companyentered into interest rate swaps that convertthe interest rate on the company’s $200million 77⁄8% senior notes due 2008 and $200million of its 113⁄4% senior notes due 2004 to a U.S.-floating rate. Under foreign currencyswaps, the effective interest rate on theseprincipal balances is Japanese libor plus .40% (.59% at December 31, 1999) and euro libor plus 4.71% (8.05% at December31, 1999), respectively.
In March 1999, the remaining outstandingbalance of $27 million of the 81⁄4% convertiblesubordinated notes due 2006 were convertedinto 3.9 million shares of the company’scommon stock.
During 1999, the company repurchased$115.8 million principal amount of its 113⁄4%senior notes due 2004 and $25.5 millionprincipal amount of its 12% senior notes due2003 at a cost of $157.4 million. As a result,the company recorded an extraordinary chargeof $12.1 million, net of $6.5 million of incometax benefits, or $.04 per diluted commonshare.
The company has a $400 million creditagreement expiring June 2001. As ofDecember 31, 1999, there were noborrowings outstanding under the facility
December 31 (Millions) 1999 1998
12% senior notes due 2003 $399.5 $ 425.0113/4% senior notes due 2004* 334.2 450.077/8% senior notes due 2008* 200.0 200.081/4% convertible subordinated
notes 27.0 27.0Other, net of unamortized
discounts 39.4 8.8
Total 973.1 1,110.8Less – Current maturities 22.9 4.1
Total long-term debt $950.2 $1,106.7
*See interest rate swap discussion below.
December 31 (Millions) 1999 1998
Land $ 8.4 $ 10.3
Buildings 164.4 166.4
Machinery and office equipment 1,323.0 1,261.1
Rental and outsourcing equipment 227.2 296.8
Total properties $1,723.0 $1,734.6
other factors that may result in a decline in sales or margins, loss of market share, delays in product availability, or technologicalobsolescence.
The company is currently contesting issues before the Internal Revenue Service in connection with Sperry Corporation for the years ended March 31, 1982, throughSeptember 16, 1986. In management’sopinion, adequate provisions for income taxes have been made for all years.
8PropertiesProperties comprise the following:
10
9Investments at equitySubstantially all of the company’s investments at equity consist of NihonUnisys, Ltd., a Japanese company (“NUL”).At December 31, 1999, the company ownedapproximately 28.6% of NUL’s common stock that has a fair market value ofapproximately $1.1 billion. The company has approximately $157 million of retainedearnings that represents undistributedearnings of NUL.
11
and the entire $400 million was available forborrowings. The company pays commitmentfees on the total amount of the facility. Inaddition, the company has access to certainuncommitted lines of credit from U.S. banksand international subsidiaries maintain short-term credit arrangements with banks in accordance with local customary practice.
Other accrued liabilitiesOther accrued liabilities (current) comprise the following:
December 31 (Millions) 1999 1998
Payrolls and commissions $ 360.9 $ 334.3
Customers’ deposits and prepayments 522.0 629.5
Taxes other than income taxes 113.5 133.0
Restructuring* 36.2 70.7
Other 150.5 140.7
Total other accrued liabilities $1,183.1 $1,308.2
*At December 31, 1999 and 1998, an additional $21.0 million and $36.8 million, respectively, was reported in other liabilities(long term) on the consolidated balance sheet.
51
12LeasesRental expense, less income from subleases,for 1999, 1998, and 1997 was $139.0, $147.4,and $155.3 million, respectively.
Minimum net rental commitments undernoncancelable operating leases outstanding at December 31, 1999, substantially all ofwhich relate to real properties, were asfollows: 2000, $134.8 million; 2001, $112.1million; 2002, $86.7 million; 2003, $64.3million; 2004, $49.4 million; and thereafter,$304.7 million. Such rental commitments have been reduced by minimum subleaserentals of $84.7 million due in the future under noncancelable subleases.
13Financial instrumentsThe company uses derivative financialinstruments to manage its exposure to market risks from changes in foreign currencyexchange and interest rates. The derivativeinstruments used are foreign exchangeforward contracts, foreign exchange options,interest rate swaps and foreign currencyswaps.
Due to its foreign operations, the companyis exposed to the effects of foreign currencyexchange rate fluctuations on the U.S. dollar.Foreign exchange forward contracts andoptions generally having maturities of lessthan nine months are entered into for the sole purpose of hedging certain royaltyincome and cost exposures.
The cost of foreign currency options is recorded in other current assets in theconsolidated balance sheet. At December 31,1999, such amount was $3.5 million. Whenthe U.S. dollar strengthens against foreigncurrencies, the decline in value of the under-lying exposures is partially offset by gains in the value of purchased currency optionsdesignated as hedges. When the U.S. dollarweakens, the increase in the value of theunderlying exposures is reduced only by the premium paid to purchase the options.The cost of options is reported in incomeratably over the option term, and any gainsthereon are reported in income when therelated transactions being hedged (generally within 12 months) are recognized.
The company also enters into foreignexchange forward contracts. Gains and losseson such contracts are deferred and included in current liabilities until the correspondingtransaction is recognized. At December 31,1999, the company had a total of $264.7million (of notional value) of such contracts, $237.0 million to sell foreign currencies, and$27.7 million to buy foreign currencies. AtDecember 31, 1998, the company had a totalof $192.3 million (of notional value) of foreignexchange forward contracts, $181.9 million to sell foreign currencies, and $10.4 million to buy foreign currencies. At December 31,1999, a realized net loss on such contracts ofapproximately $5.6 million was deferred andincluded in current liabilities. Gains or losses
52
on foreign exchange forward contracts are reported in income when the relatedtransactions being hedged (principally within three months) are recognized.
In 1999, the company entered into interestrate and currency swaps for Japanese yenand euros. In the currency swaps, the com-pany is obligated to deliver on April 1, 2008,23.2 billion yen in exchange for $200 millionand is obligated to deliver on October 15,2004, 194.4 million euros in exchange for$200 million. At December 31, 1999, thecompany had a payable of $22.5 millionincluded in other liabilities (long term) relatedto these currency swaps. Over the terms ofthese swaps, the company receives paymentsbased on a U.S. fixed rate of interest and paysinterest based on a foreign currency denomi-nated floating rate. The difference betweenwhat the company receives and pays for theinterest rate swaps is recognized over the lifeof the agreements in interest expense. Thecompany has designated the currency swapsas hedges of the foreign currency exposureon its net investments in foreign subsidiariesand equity investments. The currency effectsof these hedges are reflected in accumulatedother comprehensive income (loss) therebyoffsetting a portion of the foreign currencytranslation of net assets.
Financial instruments comprise thefollowing:
December 31 (Millions) 1999 1998
Outstanding:
Long-term debt $ 973.1 $1,110.8
Foreign exchange forward contracts* 264.7 192.3
Foreign exchange options* 288.2 262.2
Interest rate swaps* 400.0 –
Foreign currency swaps* 400.0 –
Estimated fair value:
Long-term debt $1,021.2 $1,352.0
Foreign exchange forward contracts (1.9) (1.5)
Foreign exchange options 8.4 2.8
Interest rate swaps 3.4 –
Foreign currency swaps (27.2) –
*notional value
14
Financial instruments also includetemporary cash investments and customeraccounts receivable. Temporary investmentsare placed with creditworthy financial institu-tions, primarily in over-securitized treasuryrepurchase agreements, Euro-time deposits, or commercial paper of major corporations. At December 31, 1999, the company’s cashequivalents principally have maturities of less than one month. Due to the shortmaturities of these instruments, they arecarried on the balance sheet at cost plusaccrued interest, which approximates market value. Realized gains or losses during 1999 and 1998, as well as unrealizedgains or losses at December 31, 1999, were immaterial. Receivables are due from a large number of customers that are dispersed worldwide across many industries.At December 31, 1999 and 1998, thecompany had no significant concentrations of credit risk.
The carrying amount of cash and cashequivalents approximates fair value becauseof the short maturity of these instruments.The fair value of the company’s long-termdebt is based on the quoted market prices for publicly traded issues. For debt that is not publicly traded, the fair value is estimated,after considering any conversion terms, based on current yields to maturity for thecompany’s publicly traded debt with similarmaturities. In estimating the fair value of itsderivative positions, the company utilizesquoted market prices, if available, or quotesobtained from outside sources.
LitigationThere are various lawsuits, claims, andproceedings that have been brought orasserted against the company. Although theultimate results of these lawsuits, claims, andproceedings are not currently determinable,management does not expect that thesematters will have a material adverse effect onthe company’s consolidated financial position,consolidated results of operations, or liquidity.
No single customer accounts for more than 10% of revenue. Revenue from variousagencies of the U.S. Government, which isreported in both business segments,approximated $865, $917, and $791 million in 1999, 1998, and 1997, respectively.
A summary of the company’s operations by business segment for 1999, 1998, and1997 is presented below:
53
Segment informationThe company has two business segments:Services and Technology. The products andservices of each segment are marketedthroughout the world to commercialbusinesses and governments. The majorservice and product lines by segment are as follows: Services – systems integration,including industry and custom solutions, outsourcing, network services, and multivendor maintenance; Technology –enterprise-class servers, specializedtechnologies, and personal computers.
The accounting policies of each businesssegment are the same as those described in the summary of significant accountingpolicies, except for warranty obligationsrelated to company-manufactured PCs in theTechnology business segment. For segmentreporting purposes, prior to 1998, such costsare accounted for on a cash basis, whereas on a total company basis, such costs areaccounted for on an accrual basis. In 1998,the company outsourced the manufacture of such products and any warranty costsrelated to company-manufactured PCs areconsidered corporate costs. The effect of the difference between the cash and accrualbasis in 1997 was immaterial. Intersegmentsales and transfers are priced as if the salesor transfers were to third parties. Thecompany evaluates business segmentperformance on operating income exclusive of restructuring charges and unusual and nonrecurring items. All corporate and centrally incurred costs are allocated to the business segments based principally on assets, revenue, employees, squarefootage, or usage.
Corporate assets are principally cash and cash equivalents, prepaid pension assets, and deferred income taxes. Theexpense or income related to corporate assets are allocated to the business seg-ments. In addition, corporate assets includean offset for accounts receivable that havebeen recorded as sales in accordance with SFAS No. 125 because such receivables are included in the assets of the businesssegments.
15
(Millions of dollars) Total Corporate Services Technology
Total assets 5,631.6 2,791.0 1,573.7 1,266.9Investments at
equity 215.7 9.9 205.8Capital expenditures
for properties 184.0 81.8 102.2
54
Presented below is a reconciliation of total business segment operating income to consolidated income (loss) before income taxes:
Presented below is a reconciliation of totalbusiness segment assets to consolidated assets:
Geographic information about the company’srevenue, which is principally based on location of the selling organization, and properties, ispresented below:
(Millions) 1999 1998 1997
Revenue
United States $3,357.9 $3,154.3 $2,732.4
Foreign 4,186.7 4,089.6 3,930.5
Total $7,544.6 $7,243.9 $6,662.9
Properties, net
United States $ 367.2 $ 322.3 $ 312.7
United Kingdom 64.2 56.2 53.5
Brazil 38.8 61.9 67.9
Other foreign 150.6 145.0 152.4
Total $ 620.8 $ 585.4 $ 586.5
Year ended December 31(Millions) 1999 1998 1997
Total segment operatingincome $ 984.3 $ 844.3 $ 592.7
Interest expense (127.8) (171.7) (233.2)
Other income (expense), net (62.6) (33.1) (106.5)
Impairment charges (922.9)
Other special charges (74.3)
Corporate and eliminations (23.6) (45.3) (3.9)
Total income (loss) beforeincome taxes $ 770.3 $ 594.2 $ (748.1)
December 31 (Millions) 1999 1998 1997
Total segment assets $3,134.8 $2,895.4 $2,840.6
Cash and cash equivalents 464.0 616.4 824.2
Prepaid pension assets 975.9 833.8 762.4
Deferred income taxes 1,128.3 1,123.2 1,127.1
Elimination for sale of receivables (30.7) (28.4) (125.9)
Other corporate assets 217.4 172.8 203.2`
Total assets $5,889.7 $5,613.2 $5,631.6
16Employee plansStock plans Under plans approved by the stockholders, stock options, stockappreciation rights, restricted stock, andrestricted stock units may be granted toofficers and other key employees.
Options have been granted to purchase the company’s common stock at 100% of the fair market value at the date of grant.Options have a maximum duration of tenyears and generally become exercisable inannual installments over a four-year periodfollowing date of grant.
Restricted stock and restricted stock units have been granted and are subject toforfeiture until the expiration of a specifiedperiod of service commencing on the date ofgrant. Compensation expense resulting fromthe awards is charged to income ratably fromthe date of grant until the date the restrictionslapse and is based on fair market value at the date of grant. During the years endedDecember 31, 1999, 1998, and 1997, $2.5,$6.0, and $6.4 million was charged to income,respectively.
Effective July 1, 1998, the companyimplemented a world-wide Employee StockPurchase Plan (“ESPP”), which enablessubstantially all regular employees topurchase shares of the company’s commonstock through payroll deductions of up to 10% of eligible pay. The price the employeepays is 85% of the market price at thebeginning or end of a calendar quarter,whichever is lower. During the years endedDecember 31, 1999 and 1998, employeespurchased shares, all of which were newlyissued shares, for which $35.1 million and$5.6 million was paid to the company,respectively.
U.S. employees are eligible to participate in an employee savings plan. Under this plan, a percentage of the employee’s pay may be contributed to various investmentalternatives. Effective July 1, 1998, a company match for up to 1% of pay wasreinstituted. Effective January 1, 2000 suchcompany match was increased to 2%. Thematch consists of the company contributingnewly issued shares of its common stock tothe plan. The charge to income, related tosuch company match, for the years endedDecember 31, 1999 and 1998 was $8.2million and $4.1 million, respectively.
The company applies APB Opinion 25 for its stock plans and the disclosure-onlyoption under SFAS No. 123, “Accounting for Stock-Based Compensation.” Accordingly,no compensation expense is recognized for stock options granted and for common stockpurchases under the ESPP.
Pro forma information regarding netincome and earnings per share is required by SFAS No. 123, and has been determinedas if the company had accounted for its stockplans under the fair value method of SFAS No. 123. The fair value of stock options is estimated at the date of grant using aBlack-Scholes option pricing model with thefollowing weighted average assumptions for1999, 1998, and 1997, respectively: risk-freeinterest rates of 5.14%, 5.67%, and 6.59%,volatility factors of the expected market priceof the company’s common stock of 55%, aweighted average expected life of the optionsof five years, and no dividends.
For purposes of the pro forma disclosures,the estimated fair value of the options isamortized to expense over the options’ vesting period. The company’s pro forma net income (loss) for the years endedDecember 31, 1999, 1998, and 1997,respectively, follows: 1999, $472.2 million, or income of $1.46 per diluted share; 1998, $361.6 million, or income of $.95 per diluted share; and 1997, $(858.1) million, or a loss of $5.28 per share.
55
56
Year ended December 31 (Shares in thousands) 1999 1998 1997
A summary of the status of stock option activity follows:
Retirement benefitsRetirement plans funded status and amountsrecognized in the company’s consolidatedbalance sheet at December 31, 1999 and1998, follows:
The projected benefit obligations,accumulated benefit obligations and fair value of plan assets for plans withaccumulated benefit obligations in excess of plan assets was as follows (in millions
of dollars): $187.2 million, $178.1 million, and $108.2 million at December 31, 1999; and$92.0 million, $86.2 million, and $13.3 millionat December 31, 1998.
U.S. Plans International Plans
December 31 (Millions) 1999 1998 1999 1998
Change in benefit obligationBenefit obligation at beginning of year $3,684.1 $3,543.7 $811.7 $685.4
Service cost 39.3 35.7 18.0 15.3
Interest cost 251.3 248.3 51.5 45.8
Plan participants’ contributions 10.2 9.7
Plan amendments .6 .6 3.0 3.0
Actuarial (gain) loss (234.5) 105.8 716.3 76.5
Benefits paid (249.1) (250.0) (35.9) (34.5)
Effect of settlements/curtailments 1.1Foreign currency translation adjustments (66.9) 10.5
Other 38.2
Benefit obligation at end of year $3,491.1 $3,684.1 $844.2 $811.7
Change in plan assetsFair value of plan assets at beginning of year $4,459.1 $4,107.1 $877.9 $789.3
Actual return on plan assets 831.0 597.2 113.8 86.6
Other postretirement benefitsA reconciliation of the benefit obligation, fair value of the plan assets, and the funded status of the postretirement medical plan at December 31, 1999 and 1998, follows:
Year ended December 31 (Millions) 1999 1998 1997
Interest cost $14.9 $15.5 $16.3
Expected return on plan assets (.4) (1.1) (1.8)
Amortization of prior service benefit (2.2) (2.7) (2.7)
Recognized net actuarial loss .6 .6 1.2Settlement/curtailment gain (6.5)
Net periodic benefit cost $ 6.4 $12.3 $13.0
Weighted-average assumptionsas of December 31 were asfollows:
Discount rate 7.50% 7.20% 7.30%
Expected return on plan assets 8.00% 8.00% 8.00%
December 31 (Millions) 1999 1998
Change in benefit obligation
Benefit obligation at beginning of year $ 225.8 $ 227.4
Interest cost 14.9 15.5
Plan participants’ contributions 23.8 24.6
Actuarial loss (gain) 1.5 (2.1)
Benefits paid (43.1) (39.6)
Effect of settlement/curtailment (5.5)
Benefit obligation at end of year $ 217.4 $ 225.8
Change in plan assets
Fair value of plan assets at beginning of year $ 13.3 $ 15.4
Actual return on plan assets (.1) 1.0
Employer contributions 19.5 11.9
Plan participants’ contributions 23.8 24.6
Benefits paid (43.1) (39.6)
Fair value of plan assets at end of year $ 13.4 $ 13.3
Funded status $ (204.0) $(212.5)
Unrecognized net actuarial loss 12.1 16.8
Unrecognized prior service benefit (13.6) (22.9)
Accrued benefit cost $ (205.5) $(218.6)
Net periodic postretirement benefit cost for 1999, 1998, and 1997 follows:
Net periodic pension costs for 1999, 1998, and 1997 includes the following components:
U.S. Plans International Plans
Year ended December 31 (Millions) 1999 1998 1997 1999 1998 1997
Weighted-average assumptions as of December 31 were as follows:
Discount rate 7.75% 7.00% 7.25% 6.35% 6.36% 6.77%
Rate of compensation increase 5.40% 5.40% 5.40% 3.81% 4.07% 3.74%
Expected long-term rate of return on assets 10.00% 10.00% 10.00% 8.44% 8.23% 8.25%
Preferred Common Treasury(Thousands) Stock Stock Stock
Balance at December 31, 1996 28,831 177,271 (899)
Conversions to common stock (2) 73,150
Issuance of stock under stockoption and other plans 1,259 160
Other (29) 84
Balance at December 31, 1997 28,800 251,764 (739)
Conversions to common stock (2) 110
Issuance of stock under stockoption and other plans 143 7,573 (553)
Balance at December 31, 1998 28,941 259,447 (1,292)
Conversions to common stock (24,952) 46,090 110
Redemptions (3,941)
Issuance of stock under stockoption and other plans 6,916 (578)
Other (48)
Balance at December 31, 1999 – 312,453 (1,870)
The assumed health care cost trend rate used in measuring the expected cost of benefits covered by the plan was 8.4% for 1999, gradually declining to 5.5% in 2006 and thereafter. A one-percentage pointincrease (decrease) in the assumed healthcare cost trend rate would increase (decrease)the accumulated postretirement benefitobligation at December 31, 1999, by $8.4 million and $(7.6) million, respectively,and increase (decrease) the aggregate of theservice and interest cost components of netperiodic postretirement benefit cost for 1999by $.7 million and $(.6) million, respectively.
Stockholders’ equityThe company has 720.0 million authorized shares of common stock, par value $.01 pershare, and 40.0 million shares of authorizedpreferred stock, par value $1 per share,issuable in series.
During the year ended December 31, 1999,the company made several calls of its SeriesA Cumulative Convertible Preferred Stock(“Series A Preferred Stock”) for redemption.As a result, of the 28.4 million shares ofSeries A Preferred Stock outstanding atDecember 31, 1998, 24.5 million wereconverted into 40.8 million shares of thecompany’s common stock and 3.9 millionshares of Series A Preferred Stock wereredeemed for $197.0 million in cash.
In March 1999, the remaining balance of $27 million of 81/4% convertible subordi-nated notes due 2006 were converted into3.9 million shares of the company’s common stock.
Each outstanding share of common stock has attached to it one preferred share purchase right. The rights becomeexercisable only if a person or group acquires 20% or more of the company’scommon stock, or announces a tender or exchange offer for 30% or more of thecommon stock. Until the rights becomeexercisable, they have no dilutive effect on net income per common share.
At December 31, 1999, 27.0 million sharesof unissued common stock of the companywere reserved for stock options and for stockpurchase and savings plans.
Changes in issued shares during the threeyears ended December 31, 1999, were asfollows:
Total other comprehensive income (loss) (38.8) (83.5) (58.0)
Comprehensive income (loss) $ 471.9 $292.9 $(910.9)
*Net of income (loss) on translation adjustments reclassified to income upon sale or writeoff of ownership interest in foreign investments as follows: 1999, $.2 million; 1998, $(.1) million; and 1997, $2.8 million.
Comprehensive income for the three yearsended December 31, 1999, includes thefollowing components:
60
Report of ManagementThe management of the company is responsible for the integrity of its financial statements. These statements have been
prepared in conformity with generally accepted accounting principles and include amounts based on the best estimates
and judgments of management. Financial information included elsewhere in this report is consistent with that in the
financial statements.
The company maintains a system of internal accounting controls designed to provide reasonable assurance at a
reasonable cost that assets are safeguarded against loss or unauthorized use, and that transactions are executed in
accordance with management’s authorization and recorded and summarized properly. This system is augmented by
written policies and procedures, an internal audit program, and the selection and training of qualified personnel.
Ernst & Young LLP, independent auditors, have audited the company’s financial statements. Their accompanying
report is based on audits conducted in accordance with auditing standards generally accepted in the United States,
which require a review of the system of internal accounting controls and tests of accounting procedures and records
to the extent necessary for the purpose of their audits.
The Board of Directors, through its Audit Committee, which is composed entirely of outside directors, oversees
management’s responsibilities in the preparation of the financial statements and selects the independent auditors, subject
to stockholder ratification. The Audit Committee meets regularly with the independent auditors, representatives of
management, and the internal auditors to review the activities of each and to assure that each is properly discharging its
responsibilities. To ensure complete independence, the internal auditors and representatives of Ernst & Young LLP have
full access to meet with the Audit Committee, with or without management representatives present, to discuss the results
of their examinations and their opinions on the adequacy of internal controls and the quality of financial reporting.
Lawrence A. Weinbach Janet Brutschea Haugen
Chairman, President, Vice President
and Chief Executive Officer and Controller
Report of Independent AuditorsTo the Board of Directors of Unisys Corporation
We have audited the accompanying consolidated balance sheets of Unisys Corporation at December 31, 1999 and 1998,
and the related consolidated statements of income, stockholders’ equity and cash flows for each of the three years in the
period ended December 31, 1999. These financial statements are the responsibility of Unisys Corporation’s management.
Our responsibility is to express an opinion on these financial statements based on our audits.
We conducted our audits in accordance with auditing standards generally accepted in the United States. Those stan-
dards require that we plan and perform the audit to obtain reasonable assurance about whether the financial statements
are free of material misstatement. An audit includes examining, on a test basis, evidence supporting the amounts and dis-
closures in the financial statements. An audit also includes assessing the accounting principles used and significant esti-
mates made by management, as well as evaluating the overall financial statement presentation. We believe that our audits
provide a reasonable basis for our opinion.
In our opinion, the financial statements referred to above present fairly, in all material respects, the consolidated
financial position of Unisys Corporation at December 31, 1999 and 1998, and the consolidated results of its operations
and its cash flows for each of the three years in the period ended December 31, 1999, in conformity with accounting
principles generally accepted in the United States.
As described in Note 5 to the consolidated financial statements, effective December 31, 1997, Unisys Corporation
changed its method of accounting for the measurement of goodwill impairment.
Philadelphia, Pennsylvania
January 18, 2000
First Second Third Fourth
(Millions, except per share data) Quarter Quarter Quarter Quarter Year
1999
Revenue $1,822.8 $1,896.5 $1,865.4 $1,959.9 $7,544.6Gross profit 668.6 664.1 670.2 681.8 2,684.7Income before income taxes 169.7 182.5 196.1 222.0 770.3Income before extraordinary item 109.9 118.0 150.5 144.4 522.8Net income 109.9 118.0 138.4 144.4 510.7Dividends on preferred shares 22.8 12.0 1.9 26.6 36.7Earnings on common shares 87.1 106.0 136.5 (144.4 474.0Earnings per common share – basic (4.75) (5.30)
Earnings per common share – diluted .13 (4.75) (5.30)Before extraordinary item .31 .37 .47 .46 1.63Extraordinary item (.04) (.04)
Total .31 .37 .43 .46 1.59
Market price per common share – high 361/ 2 3915/ 16 .4911/16 477/16 4911/16
– low 275/8 273/ 8 371/16 2015/16 2015/163/
1998
Revenue $1,656.1 $1,737.2 $1,792.3 $2,058.3 $7,243.9Gross profit 563.0 586.8 605.9 712.3 2,468.0Income before income taxes 95.2 137.8 147.6 213.6 594.2Net income 59.9 87.0 93.8 135.7 376.4Dividends on preferred shares 26.7 26.6 26.6 26.6 106.5Earnings on common shares 33.2 60.4 67.2 109.1 269.9Earnings per common share – basic .13 .24 .26 .43 1.07
– diluted .13 .23 .25 .40 1.01Market price per common share – high 203/ 16 283/ 8 .3011/16 353/ 8 353/ 8
– low 135/ 16 171/ 4 175/ 8 181/ 8 135/ 16
.In the third quarter of 1999, the company completed three acquisitions that were accounted for as poolings of interests and all prior periods were restated. See Note 3 of the Notes to Consolidated Financial Statements.
Included in the third quarter of 1999, the company recognized a one-time tax benefit of $22.0 million, or $.07 per diluted common share. See Note 7 of the Notes to Consolidated Financial Statements.
The individual quarterly per-common share amounts may not total to the per-common share amount for the full year because of accounting rules governing the computation of earnings per common share.
Market prices per common share are as quoted on the New York Stock Exchange composite listing.
Income (loss) from continuing operations before income taxes 770.3 594.2 (748.1) 80.2 (786.0) 17.4 365.2 304.6 (1,422.2)
Income (loss) from continuing operations before extraordinary items and changes in accounting principles 522.8 376.4 (852.9) 50.7 (632.2) 14.8 280.6 168.6 (1,517.8)
Net income (loss) 510.7 376.4 (852.9) 38.6 (629.5) 103.2 559.7 363.5 (1,390.9)
(1) In 1999, the company completed three acquisitions that were accounted for as poolings of interests and all prior periods were restated. See Note 3 of the Notes to Consolidated Financial Statements.
(2) Includes special pretax charges of $1,039.2 million, $846.6 million, $186.2 million, and $1,200.0 million for the years ended December 31, 1997, 1995, 1994, and 1991, respectively.
(3) After deduction of cumulative preferred dividends in arrears in 1991, 1992, and 1993.
63
Corporate Officers
Lawrence A. WeinbachChairman, president andchief executive officer.Previously managingpartner and chief execu-tive, Andersen Worldwide.A Unisys officer since1997. Age 60.
George R. GazerwitzExecutive vice presidentand president, systems &technology. Previouslypresident, Unisys com-puter systems. A Unisysofficer since 1984. Age 59.
David O. AkerSenior vice president,worldwide humanresources. Previously vicepresident, human resources,Unisys information servicesand systems. A Unisysofficer since 1995. Age 53.
Jack F. McHaleVice president, investorrelations. Previously vicepresident, Unisys corpo-rate communications. AUnisys officer since 1986.Age 50.
Richard D. BadlerVice president, corporatecommunications. Previ-ously vice president, cor-porate communications,General Instrument. AUnisys officer since 1998.Age 49.
Barbara A. BabcockVice president and presi-dent, e-business services.Previously vice president,marketing and strategy,Unisys information ser-vices. A newly electedUnisys officer. Age 51.
Janet Brutschea HaugenVice president, corporatecontroller and actingchief financial officer.Previously audit partner,Ernst & Young. A Unisysofficer since 1996. Age 41.
Angus F. SmithVice president and trea-surer. Previously trea-surer, Rohm and Haas. AUnisys officer since 1997.Age 58.
Harold S. BarronSenior vice president andgeneral counsel. Previ-ously partner, Seyfarth,Shaw, Fairweather & Ger-aldson. A Unisys officersince 1991. Age 63.
Joseph W. McGrathExecutive vice presidentand president, global indus-tries. Previously vice presi-dent and general manager,Xerox production color sys-tems. A Unisys officer since1999. Age 47.
Nancy Straus SundheimVice president, deputygeneral counsel and sec-retary. Previously withDechert Price & Rhoads.A Unisys officer since1999. Age 48.
Jack A. BlaineExecutive vice presidentand president, worldwidesales and services. Previ-ously president, UnisysPacific Asia AmericasAfrica. A Unisys officersince 1988. Age 55.
James F. McGuirk IISenior vice president,worldwide public sector.Previously president,Unisys federal systems. AUnisys officer since 1996.Age 56.
Alastair M. TaylorVice president, worldwidefinancial services. Previ-ously chief executive,Unisys information servicesEurope. A newly electedUnisys officer. Age 51.
Janet B. WallaceSenior vice president andpresident, global networkservices. Previously vicepresident, services mar-keting and sales, Compaq.A newly elected Unisysofficer. Age 48.
Robert D. EvansVice president and presi-dent, global outsourcing.Previously vice presidentand general manager,Unisys outsourcing, NorthAmerica. A newly electedUnisys officer. Age 52.
Gail D. FoslerSenior vice president and chief economist ofThe Conference Board, a business-sponsored,nonprofit research organization. Also serves asa director of H.B. Fuller Company and DBSHoldings (Singapore) and as a trustee of theJohn Hancock Mutual Funds. A Unisysdirector since 1993. Age 52. 3
J.P. BolducChairman and chief executive officer, JPB Enter-prises, Inc., a merchant banking, venture capitaland real estate investment holding company withinterests in the food, real estate, packaging instru-ments and manufacturing industries. Previouslyserved in the positions of vice chairman, chiefoperating officer, president and chief executiveofficer, W.R. Grace & Co., from 1986 to 1995. Alsoserves as a director of Proudfoot PLC. A Unisysdirector since 1992. Age 60. 3,4
Board of Directors
Dr. James J. DuderstadtPresident Emeritus and University Professorof Science and Engineering at the Universityof Michigan. Also serves as a director of CMSEnergy Corporation. A Unisys director since1990. Age 57. 1
Henry C. DuquesDirector and chairman and chief executiveofficer of First Data Corporation, an elec-tronic payments and information manage-ment company. Also serves as a director oftheglobe.com, inc. A Unisys director since1998. Age 56. 2
Melvin R. GoodesRetired director and chairman and chief exec-utive officer of Warner-Lambert Company, adiversified worldwide health care, pharmaceu-tical and consumer products company. Previ-ously held position of president and chiefoperating officer. Also serves as a director ofChase Manhattan Corporation. A Unisysdirector since 1987. Age 64. 2
Edwin A. HoustonVice chairman, Ryder System, Inc., aninternational highway transportation services company. A Unisys director since 1993. Age 61. 1
Kenneth A. MackeGeneral partner of Macke Partners, a venture capital firm. Previously served as chairman and chief executive officer,Dayton Hudson Corporation, a generalmerchandise retailer, from 1984 to 1994.A Unisys director since 1989. Age 61. 2,4
Theodore E. MartinRetired director and president and chiefexecutive officer, Barnes Group, Inc., a man-ufacturer and distributor of automotive andaircraft components and maintenanceproducts. Previously held position of execu-tive vice president-operations. Also serves asa director of Ingersoll-Rand Company, PECorporation and RJR Nabisco HoldingsCorp. A Unisys director since 1995. Age 60. 3
Robert McClements, Jr.Retired chairman, president and chiefexecutive officer, Sun Company, Inc., adiversified energy company. Also serves asa director of Bethlehem Steel Corporation.A Unisys director since 1991. Age 71. 1,4
Lawrence A. WeinbachUnisys chairman, president and chiefexecutive officer since 1997. Previouslyserved as managing partner and chiefexecutive, Andersen Worldwide, a globalprofessional services organization. Alsoserves as a director of Avon Products, Inc.A Unisys director since 1997. Age 60.
not need to be exchanged for new Unisys certificates.
Annual Meeting
Stockholders are invited to attend the 2000 Unisys
Annual Meeting of Stockholders, which will be held at
the Marriott Philadelphia, 1201 Market Street,
Philadelphia, Pennsylvania, on Thursday, April 27, at
9:30 a.m.
Formal notice of the meeting, along with the proxy
statement and proxy materials, was mailed or
otherwise made available on or about March 16, 2000,
to stockholders of record as of February 28, 2000.
Common Stock Information
Unisys common stock (trading symbol “UIS”) is listed
for trading on the New York Stock Exchange, on
exchanges in Amsterdam, Brussels and London, and
on the Electronical Stock Exchange in Switzerland.
At December 31, 1999, there were 310.6 million shares
outstanding and about 32,800 stockholders of record.
Independent Auditors
Ernst & Young LLP
Philadelphia, Pennsylvania
Statements made by Unisys in this annual report that
are not historical facts, including those regarding
future performance, are forward-looking statements
under the Private Securities Litigation Reform Act of
1995. These statements are based on current
expectations and assumptions and involve risks and
uncertainties that could cause actual results to differ
from expectations. These risks and uncertainties are
discussed on page 37 of this report.
Unisys and theUnisys logo are regis-tered trademarks and e-@ction is a trade-mark of Unisys Cor-poration. Intel is atrademark of IntelCorporation.Microsoft is a regis-tered trademark andMicrosoft WindowsNT is a trademark ofMicrosoft Corpora-tion. UNIX is a regis-tered trademark ofThe Open Group. Allother brands andproducts referencedin this annual reportare acknowledged tobe trademarks or reg-istered trademarks oftheir respectiveholders.
This annual reportwas designed,written and producedby Unisys CorporateCommunications.Principal photographyby Richard Bowditch.