Title Longitudinal analysis of the peripapillary retinal nerve fiberlayer thinning in patients with retinitis pigmentosa.
Author(s) Oishi, A; Ogino, K; Nakagawa, S; Makiyama, Y; Kurimoto, M;Otani, A; Yoshimura, N
Citation Eye (2013), 27(5): 597-604
Issue Date 2013-05
URL http://hdl.handle.net/2433/187047
Right © 2014 The Royal College of Ophthalmologists
Type Journal Article
Textversion author
Kyoto University
1
Longitudinal analysis of the peripapillary retinal nerve fiber layer thinning in 1
patients with retinitis pigmentosa 2
Running head: longitudinal analysis of RNFL in RP 3
Akio Oishi, Ken Ogino, Satoko Nakagawa, Yukiko Makiyama, Masafumi 4
Kurimoto, Atsushi Otani, Nagahisa Yoshimura 5
6
Department of Ophthalmology and Visual Sciences, Kyoto University Graduate 7
School of Medicine, Kyoto, Japan 8
9
Corresponding author: Akio Oishi 10
54, Shougoin Kawahara-cho, Sakyo-ku, Kyoto 606-8507, Japan 11
Telephone number: (81)-75-751-3248 12
Fax number: (81)-75-752-0933 13
E-mail address: [email protected] 14
Acknowledgement: There is no funding agency for the study. Yoshimura N. has 15
commercial relationship with Topcon (F) and Canon (F). 16
Keywords: Retinitis pigmentosa, retinal nerve fiber layer, optical coherence 17
tomography 18
2
Abstract 19
Purpose: To investigate longitudinal changes in peripapillary retinal nerve fiber 20
layer (RNFL) thickness in patients with retinitis pigmentosa (RP). 21
Methods: We re-examined 103 RP patients whose RNFL thickness was 22
previously examined and reported. RNFL thickness was measured using Stratus 23
optical coherence tomography and was compared with the previous 24
measurements. The results were also compared with that of previously reported 25
normal subjects. Association between the decrease rate and visual acuity and 26
visual field was also investigated. 27
Results: The mean follow-up period was 56.9 months. After excluding patients in 28
whom RNFL images were of poor quality, 88 patients were eventually analyzed. 29
The average RNFL thickness decreased from 105.8 to 98.2 µm during the period, 30
with the average rate of decrease being 1.6 µm/year. The decrease in RNFL was 31
more evident in superior and inferior sectors. Cross sectional linear regression 32
analysis also revealed an age-dependent decrease in RNFL, with the slower 33
rate of decrease being 0.94 µm/year. The decrease in RNFL thickness was 34
significantly faster than that reported in normal subjects. The decrease rate was 35
not associated with visual functions. 36
3
Conclusion: Age-dependent RNFL thinning occurs at a faster rate in RP patients 37
as compared to that in normal subjects. The result supports the notion that 38
pathologic changes involve inner retina as well as outer retina in eyes with RP. 39
Considering the discrepancy in the rate of RNFL thinning estimated from trend 40
analysis and longitudinal measurement, care should be taken when interpreting 41
the result of cross sectional analysis. 42
43
4
Introduction 44
Retinitis pigmentosa (RP) is a hereditary heterogenous disease, which primarily 45
affects rod photoreceptors. As a consequence of rod photoreceptor death, 46
patients experience night blindness and peripheral visual field loss in the early 47
stages of the disease.1 Several therapeutic strategies for RP, including gene 48
therapy, cell transplantation therapy, and retinal prosthesis, have been 49
intensively investigated in recent times. 2 Each of these has demonstrated 50
promising effects, and some are currently under clinical trials.3, 4 51
However, the effect of RP on the preservation of second or third neurons—which 52
are necessary for conveying visual information to the lateral geniculate bodies or 53
visual cortex remains unclear. 5 If the status of inner retina varies in each patient, 54
selection of patients based on the preservation of inner retinal structures and 55
functions would be helpful to achieve maximal effect from the treatments.6 56
Histology studies concerning the status of the inner retina in RP are limited.7-10 57
These histologic reports showed that up to 75% of ganglion cell layer cells are 58
retained in the macular area in patients with RP7, 8; however, the percentage 59
decreases to 20%-30% in extra-macular region 9 and 70–90% of total ganglion 60
cells or theirs axons are lost eventually 10, suggesting that inner retinal cells are 61
5
partially preserved in RP but degenerate as the disease progresses. These 62
reports provide important information; however, the method of postmortem 63
analyses cannot be used for the evaluation of patient suitability for the future 64
treatment. 65
Several groups, including ours, have attempted to evaluate the inner retinal 66
status in vivo using optical coherence tomography (OCT) (Table 1). For example, 67
Walia et al. reported abnormal thinning and thickening of the retinal nerve fiber 68
layer (RNFL).11, 12 The abnormal thickening of the RNFL was also observed by 69
Hood et al.5 Consistently, a recent study dealing young subjects also showed 70
relatively thick RNFL.13 We have previously reported wide variations in RNFL 71
thickness in RP patients albeit with the average thickness being similar to that in 72
normal eyes. In addition, RNFL thickness in RP patients appears to decrease 73
faster than that observed in normal eyes.14 Anastasakis et al. used a more 74
recent model of OCT and confirmed the abnormal thickening and thinning of 75
RNFL. In addition, they reported a similar rate of age-dependent decrease in 76
RNFL thickness.15 The effect of using different models of OCT can be estimated 77
by the result of another recent report.16 However, all these reports are cross 78
sectional studies and information regarding the changes in RNFL thickness over 79
6
time remains limited. The rate of age-dependent change estimated from trend 80
analysis does not necessarily coincide with longitudinal measurement. In fact, a 81
recent study concerning the RNFL thickness in normal subjects revealed 82
discrepancies in the longitudinal and cross-sectional data;17 therefore, 83
longitudinal measurement is necessary to evaluate time-dependent changes in 84
RP patients in clinical practice. 85
In the present study, in order to evaluate longitudinal changes in RNFL thickness 86
in RP patients, we re-examined patients in whom the RNFL thickness was 87
previously assessed and reported approximately 5 years ago. Further, we 88
statistically analyzed these changes in RNFL thickness for age dependence and 89
disease progress. 90
Methods 91
Subjects 92
We re-recruited RP patients whose RNFL thickness results we previously 93
reported in 2008.14 The study sample consisted of 137 eyes from 137 RP 94
patients (including 2 patients with Usher syndrome) who were first examined 95
between January 2006 and April 2007. The exclusion criteria were as follows: 96
best-corrected visual acuity worse than 0.1 (20/200), presence of optic nerve 97
7
diseases or retinal vascular diseases, refractive errors greater than –6D, OCT 98
signal strength < 6, or OCT image showed evident artifact. These patients were 99
re-examined between May 2011 and April 2012 during a follow-up visit to our 100
institution. 101
All procedures conformed to the tenets of the Declaration of Helsinki, and the 102
study design was approved by the institutional review board and the ethics 103
committee of the Kyoto University Graduate School of Medicine. The aim of the 104
study and the measurement procedures were explained to the study participants. 105
The review board waived the need for written informed consent. We certify that 106
all applicable institutional and governmental regulations concerning the ethical 107
use of human volunteers were followed during this research. 108
Patients were examined using the Stratus OCT (Carl Zeiss Meditec, Inc., Dublin, 109
CA), which is not a recent OCT; however, this was the model used in the 110
previous study and was re-used to avoid interdevice variations. Peripapillary 111
RNFL was measured with the Fast RNFL scan option, comprising 3 circular 112
scans of a diameter of 3.4 mm around the optic disc. As in the previous study, we 113
excluded the patients in whom signal strength of the image did not reach 7 or in 114
whom segmentation of the image exhibited artifacts. 115
8
Among the measurement parameters, the RNFL thickness in the 12 divided 116
sectors, quadrant sectors, and the average RNFL thickness were used for 117
statistical analyses. In addition, according to the study of Wallia et al.,11 we 118
counted the number of sectors showing abnormal thinning or thickening in 12 119
divided sectors. When the color map image showed yellow or red, the sector 120
was judged as “thinning” and white was judged as “thickening”.11 121
We assigned a visual field score for each case based on the previously reported 122
system 14 with some modifications. Based on a previous histological report, 123
which indicated that the central 10- and 30-degree of retina contains up to 34% 124
and 69% of the total number of retinal ganglion cells, respectively,18 we divided 125
the visual field into concentric circles of central 0–10 degrees, central 10–30 126
degrees, and >30 degrees. Each concentric circle was further divided into 127
quadrant sectors. Theoretically, each sector contains a similar number of 128
ganglion cells (central 0–10 degrees: 8.5%, 10–30 degrees: 8.5%, and >30 129
degrees: 7.8%). We assigned a score for remaining visual field measured with 130
the V/4e isopter of Goldmann kinetic perimetry (GP). A score of 1 was assigned 131
for the remaining visual field in each sector. When the remaining visual field 132
occupied more than half but not the total extent of the sector, we gave a score of 133
9
0.5 (Figure 1). 134
135
Statistical analysis 136
The statistical program SPSS version 19 (IBM Japan, Tokyo, Japan) was used 137
for the analysis. Excel 2010 version 14.0.6112.5000 (Microsoft Japan, Tokyo, 138
Japan) was also used to compare the present data with previously reported 139
values. Descriptive analyses are reported as means ± SD unless otherwise 140
specified. The average RNFL thickness, RNFL thickness of each sector, and 141
signal strength of the OCT image in the present study were compared with the 142
previous measurements using the paired t-test. To estimate the age-dependent 143
decrease in RNFL thickness, a linear regression model was used with the 144
average RNFL as the dependent variable and age, refraction error, visual acuity, 145
and the visual field score as independent variables. To investigate the effect of 146
the changes in each parameter for changes in RNFL thickness, another linear 147
regression analysis was performed with the change of average RNFL thickness 148
as the dependent variable and observation period, change of OCT signal, 149
change of visual acuity, and change of visual field score as independent 150
variables. Correlations between each parameter were further analyzed with 151
10
Spearman’s rank correlation test. P values less than 0.05 was regarded as 152
significant. We searched for previous reports on PubMed concerning Stratus 153
OCT-measured RNFL of normal subjects. Among them, articles that included 154
linear regression coefficients with 95% confidential intervals were selected for 155
analysis.19-22 We calculated the standard error from the 95% confidential 156
intervals and compared these values with the measurements in the present 157
study using the t-test. 158
Results 159
We successfully reevaluated 103 (75.2%) patients out of the original population 160
of 137 patients. Generally, the examination was performed smoothly; however, 161
15 patients were excluded due to poor OCT image quality (7 or worse; 9 162
patients) and evident artifacts in RNFL segmentation (6 patients). Poor image 163
quality was due to progression of cataract, vitreous opacity, or fixation loss. A 164
decrease in signal strength, which affects thickness measurement, 23, 24 was 165
observed even in the included subjects (9.0 ± 1.1 to 8.5 ± 1.1, P = 0.002). Thus, 166
the final study population consisted of 88 patients (39 men and 49 women). At 167
the initial examination, the mean age was 50.4 ± 13.8 years (range, 20–77 168
years); the refractive error, –1.5 ± 2.4D (range, +3.75 to –5.875); logMAR, 0.18 ± 169
11
0.33 units (range, –0.18 to 1.0); and GP score, 7.6 ± 2.8 (range, 2–12). The 170
average duration between the previous and the present examination was 56.9 ± 171
4.4 months (range, 50.8–68.7 months). 172
The average RNFL thickness decreased from 105.8 ± 22.7 µm to 98.3 ± 23.2 µm 173
in the 5-year period (Figure 2A). Linear regression model showed that the 174
change of OCT signal is partly responsible for the decrease of measurement. 175
(2.1 µm of decrease/1 unit of change, P=0.007) The mean rate of decrease was 176
calculated as 1.63 ± 2.0 µm/year (range, -8.3–+3.4µm/year). The decrease was 177
more evident in the superior and inferior sectors (Figure 2B, exact values are 178
presented in online only table). OCT images from a representative case are 179
shown in Figure 3. 180
A negative correlation was noted between the average RNFL and age; using 181
cross-sectional multivariate linear regression analysis, the RNFL thickness was 182
noted to decrease by 0.94 µm/year (P<0.001, 95% CI: 0.64 to 1.24, Figure 2 C). 183
Baseline age was also associated with change of RNFL in the observation 184
period (ρ = –0.2, P=0.05). Refractive errors, visual acuity, and visual field had no 185
significant effects on RNFL thickness in multivariate linear regression analysis. 186
The result was consistent with the previous result that RNFL thinning is not 187
12
necessarily associated with the degree of visual impairment.14 However, 188
refractive error and the rate of decrease in RNFL thickness showed a weak 189
association (ρ = –0.30, P = 0.004; hyperopic eyes showed a faster rate of 190
decrease). GP score did not show significant effect on average RNFL thickness 191
but was associated with decrease of RNFL in the inferior sector (ρ = 0.21, 192
P=0.048; better GP score showed a smaller decrease of the inferior sector 193
RNFL). 194
Figure 2D shows the longitudinal measurements for the decrease in RNFL 195
thickness in each patient based on the baseline age. Most patients showed a 196
decrease in the RNFL thickness at a rate of 0 to –4 µm/year; however, 13 197
patients (14.8%) showed an increase in RNFL thickness. We compared these 13 198
patients and the rest of the subjects in age, sex, refractive error, visual acuity, 199
and visual field score but there was no significant differences (P=0.38, 0.20, 0.07, 200
0.44, 0.14, respectively). 201
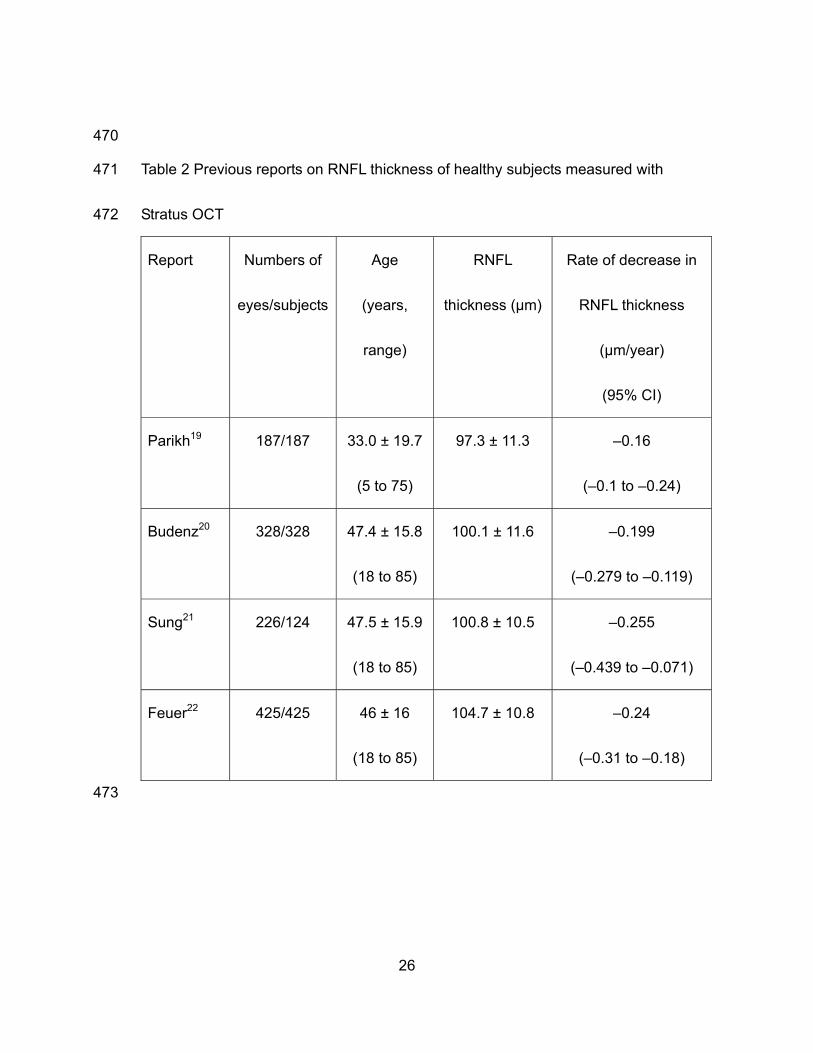
Since we did not have healthy controls who were followed up for 5 years, we 202
compared the previously reported rates of decrease in RNFL thickness in normal 203
eyes. We found 4 studies that examined normal subjects using Stratus OCT and 204
reported the rate of decrease in RNFL thickness along with 95% confidence 205
13
intervals (Table 2). The reported rate of decrease in RNFL thickness ranged 206
between –0.16 and –0.26 µm/year.19-22 We calculated standard deviations and 207
standard errors from the reported means and 95% CIs and we then compared 208
the value with the present result. The regression coefficient in the present study 209
indicated a significantly faster rate of decrease in RNFL thickness than that in 210
these 4 reports (P < 0.001 for all 4 comparisons). 211
We also investigated the abnormal thinning and thickening noted in certain 212
patients. At the baseline examination, abnormal thinning was noted in 1.1 ± 1.9 213
sectors, while thickening was noted in 2.7 ± 2.6 sectors. In the present 214
assessment, the number of sectors with abnormal thinning increased to 1.8 ± 2.2 215
(P < 0.001) and with thickening decreased to 2.4 ± 2.3 with non-significant 216
P-value (P = 0.057). 217
218
Discussion 219
The present study investigated time-dependent changes in RNFL thickness in 220
RP patients. The average RNFL thickness decreased by 7.1% in approximately 221
5 years in these patients, and the rate of RNFL thinning was higher than that 222
previously reported in healthy subjects. 223
The linear regression model showed a decrease in RNFL thickness of 0.94 224
14
µm/year in the RP patients, which was similar to that previously reported (–0.65 225
µm per year, within the 95% CI in the present study) using a different OCT 226
model.15 However, longitudinal RNFL thickness measurements demonstrated 227
that RNFL thickness in RP patients decreased at a rate of 1.63 µm/year. A similar 228
discrepancy in longitudinal measurements and linear regression coefficient 229
measurements for RNFL thickness was recently reported in normal subjects,17 230
suggesting that applying the linear regression model may not always be valid for 231
evaluating RNFL thinning in RP patients. Leung et al. clarified that age-related 232
changes in individuals should be determined from longitudinal data and not 233
based on the extrapolation of cross-sectional data;17 this can also be applied in 234
the present case. 235
The RNFL thinning did not progress equally in each quadrant. The sectoral 236
difference was already reported in normal subjects but it is not consistent as to 237
which quadrant significantly decreases with age. 17, 19, 21 In the present study, 238
inferior and superior sector showed significant thinning but nasal and temporal 239
sector did not. In addition, association between visual field score and RNFL 240
decrease rate was found only in inferior quadrant implying the correlation 241
between disease stage and progression pattern of RNFL thinning. Sectoral 242
15
difference can be an important issue when considering the site of visual 243
prosthesis implantation or cell transplantation. It should be further investigated. 244
Abnormal thickening as well as thinning of the RNFL has been previously 245
reported in RP patients.5, 11, 12 In fact, some patients showed thick RNFL at 246
baseline and after the follow-up. However, the number of sectors with thinning or 247
thicknening also showed the trend of thinning; the number of sectors with RNFL 248
thinning increased, while that with RNFL thickening tended to decrease. These 249
findings suggest that abnormal RNFL thickening certainly occurs in RP patients; 250
however, the overall RNFL thickness continues to decrease over time. If patients 251
are examined over longer follow-up periods or only patients in advanced stages 252
are examined, a predominance of abnormal thinning may be noted with no 253
findings of RNFL thickening. Although the patients whose RNFL thickness 254
increased during the follow up period did not show specific characteristics in the 255
present study and the change can be a variability of the measurement, 256
investigating which patients and when these patients show thickening of RNFL 257
would be of interest since it would highlight the pathological process of RP in the 258
retinal cells other than photoreceptors. 259
RNFL thickness is reported to be affected by signal strength, with low signal 260
16
strength being associated with RNFL thinning.23, 24 Generally, obtaining 261
good-quality OCT images in RP patients is more difficult than that in normal 262
subjects due to cataract, vitreous opacity, unstable fixation, etc. Increasing 263
patient age and disease progression render obtaining OCT images even more 264
difficult. In the present study, 15 patients were excluded due to signal strength < 265
6 or the presence of evident artifacts. Moreover, the average signal strength of 266
the included patients was also observed to have decreased in comparison to the 267
baseline. According to the linear regression analysis, around 1 µm of the 268
decrease observed in the present study could be explained by the change of 269
signal strength. 270
In the present study, we used the Stratus OCT instead of a later model. Although 271
the latest models of spectral domain OCT provide better resolution and higher 272
reproducibility,16 previous reports comparing measurements from these models 273
showed that the results from differing models, while highly correlated, are not 274
interchangeable.25-28 Since the Stratus OCT was used in our previous study of 275
the same study population, we used the same model for the present study. The 276
Stratus OCT does not have an eye-tracking system and automated registration. 277
In addition, acquisition of fundus image is done after the OCT measurement is 278
17
finished thus the placement of scan circle is not completely precise. These 279
limitations in variation of measurement should be noted. We now examine 280
patients with spectral domain OCT, and longitudinal analyses in the future will be 281
based on the result from the latest OCT models. 282
The present study was limited by its non-prospective design and lack of normal 283
control subjects since we did not have access to healthy subjects who were 284
followed up for 5 years; this is probably the case for most institutions. Age-, 285
gender-, and ethnicity- matched control would provide more robust conclusion. A 286
prospective study that strictly compares the rates of change in RNFL thickness 287
between normal controls and RP patients is required in the future. 288
The results of the present study demonstrated progressive age-related loss of 289
RNFL thickness in RP patients based on a longitudinal analysis of OCT images. 290
Our results indicate that the integrity of the inner retina should be carefully 291
evaluated in each RP patient before determining the therapeutic strategy. 292
293
Acknowledgement: none 294
295
18
References 296
297
1. Hartong DT, Berson EL, Dryja TP. Retinitis pigmentosa. Lancet 2006; 298
368(9549): 1795-1809. 299
300
2. Sahni JN, Angi M, Irigoyen C, Semeraro F, Romano MR, Parmeggiani F. 301
Therapeutic challenges to retinitis pigmentosa: from neuroprotection to 302
gene therapy. Curr Genomics 2011; 12(4): 276-284. 303
304
3. Weiland JD, Cho AK, Humayun MS. Retinal prostheses: current clinical 305
results and future needs. Ophthalmology 2011; 118(11): 2227-2237. 306
307
4. Kuno N, Fujii S. Biodegradable intraocular therapies for retinal disorders: 308
progress to date. Drugs Aging 2010; 27(2): 117-134. 309
310
5. Hood DC, Lin CE, Lazow MA, Locke KG, Zhang X, Birch DG. Thickness of 311
receptor and post-receptor retinal layers in patients with retinitis 312
pigmentosa measured with frequency-domain optical coherence 313
tomography. Invest Ophthalmol Vis Sci 2009; 50(5): 2328-2336. 314
315
6. Huang Q, Chowdhury V, Coroneo MT. Evaluation of patient suitability for a 316
retinal prosthesis using structural and functional tests of inner retinal 317
integrity. J Neural Eng 2009; 6(3): 035010. 318
319
7. Stone JL, Barlow WE, Humayun MS, de Juan E, Jr., Milam AH. 320
Morphometric analysis of macular photoreceptors and ganglion cells in 321
retinas with retinitis pigmentosa. Arch Ophthalmol 1992; 110(11): 322
1634-1639. 323
324
8. Santos A, Humayun MS, de Juan E, Jr., Greenburg RJ, Marsh MJ, Klock 325
IB et al. Preservation of the inner retina in retinitis pigmentosa. A 326
morphometric analysis. Arch Ophthalmol 1997; 115(4): 511-515. 327
328
9. Humayun MS, Prince M, de Juan E, Jr., Barron Y, Moskowitz M, Klock IB 329
et al. Morphometric analysis of the extramacular retina from postmortem 330
eyes with retinitis pigmentosa. Invest Ophthalmol Vis Sci 1999; 40(1): 331
19
143-148. 332
333
10. Eng JG, Agrawal RN, Tozer KR, Ross-Cisneros FN, Dagnelie G, 334
Greenberg RJ et al. Morphometric analysis of optic nerves and retina 335
from an end-stage retinitis pigmentosa patient with an implanted active 336
epiretinal array. Invest Ophthalmol Vis Sci 2011; 52(7): 4610-4616. 337
338
11. Walia S, Fishman GA, Edward DP, Lindeman M. Retinal nerve fiber layer 339
defects in RP patients. Invest Ophthalmol Vis Sci 2007; 48(10): 340
4748-4752. 341
342
12. Walia S, Fishman GA. Retinal nerve fiber layer analysis in RP patients 343
using Fourier-domain OCT. Invest Ophthalmol Vis Sci 2008; 49(8): 344
3525-3528. 345
346
13. Hwang YH, Kim SW, Kim YY, Na JH, Kim HK, Sohn YH. Optic nerve head, 347
retinal nerve fiber layer, and macular thickness measurements in young 348
patients with retinitis pigmentosa. Curr Eye Res 2012; 37(10): 914-920. 349
350
14. Oishi A, Otani A, Sasahara M, Kurimoto M, Nakamura H, Kojima H et al. 351
Retinal nerve fiber layer thickness in patients with retinitis pigmentosa. 352
Eye 2009; 23(3): 561-566. 353
354
15. Anastasakis A, Genead MA, McAnany JJ, Fishman GA. Evaluation of 355
retinal nerve fiber layer thickness in patients with retinitis pigmentosa 356
using spectral-domain optical coherence tomography. Retina 2012; 32(2): 357
358-363. 358
359
16. Garcia-Martin E, Pinilla I, Sancho E, Almarcegui C, Dolz I, 360
Rodriguez-Mena D et al. Optical coherence tomography in retinitis 361
pigmentosa: reproducibility and capacity to detect macular and retinal 362
nerve fiber layer thickness alterations. Retina 2012; 32(8): 1581-1591. 363
364
17. Leung CK, Yu M, Weinreb RN, Ye C, Liu S, Lai G et al. Retinal nerve fiber 365
layer imaging with spectral-domain optical coherence tomography: a 366
prospective analysis of age-related loss. Ophthalmology 2012; 119(4): 367
20
731-737. 368
369
18. Rizzo JF. Embryology Anatomy and Physiology of the Afferent Visual 370
Pathway. In: Miller NR, Newman NJ (eds). Walsh & Hoyt's Clinical 371
Neuro-Ophthalmology., 6th ed. Lippincott Williams & Wilkins: 372
Philadelphia; 2005. pp 3-82. 373
374
19. Parikh RS, Parikh SR, Sekhar GC, Prabakaran S, Babu JG, Thomas R. 375
Normal age-related decay of retinal nerve fiber layer thickness. 376
Ophthalmology 2007; 114(5): 921-926. 377
378
20. Budenz DL, Anderson DR, Varma R, Schuman J, Cantor L, Savell J et al. 379
Determinants of normal retinal nerve fiber layer thickness measured by 380
Stratus OCT. Ophthalmology 2007; 114(6): 1046-1052. 381
382
21. Sung KR, Wollstein G, Bilonick RA, Townsend KA, Ishikawa H, 383
Kagemann L et al. Effects of age on optical coherence tomography 384
measurements of healthy retinal nerve fiber layer, macula, and optic 385
nerve head. Ophthalmology 2009; 116(6): 1119-1124. 386
387
22. Feuer WJ, Budenz DL, Anderson DR, Cantor L, Greenfield DS, Savell J et 388
al. Topographic differences in the age-related changes in the retinal nerve 389
fiber layer of normal eyes measured by Stratus optical coherence 390
tomography. J Glaucoma 2011; 20(3): 133-138. 391
392
23. Cheung CY, Leung CK, Lin D, Pang CP, Lam DS. Relationship between 393
retinal nerve fiber layer measurement and signal strength in optical 394
coherence tomography. Ophthalmology 2008; 115(8): 1347-1351, 1351 395
e1341-1342. 396
397
24. Vizzeri G, Bowd C, Medeiros FA, Weinreb RN, Zangwill LM. Effect of 398
signal strength and improper alignment on the variability of stratus optical 399
coherence tomography retinal nerve fiber layer thickness measurements. 400
Am J Ophthalmol 2009; 148(2): 249-255 e241. 401
402
25. Knight OJ, Chang RT, Feuer WJ, Budenz DL. Comparison of retinal nerve 403
21
fiber layer measurements using time domain and spectral domain optical 404
coherent tomography. Ophthalmology 2009; 116(7): 1271-1277. 405
406
26. Sung KR, Kim DY, Park SB, Kook MS. Comparison of retinal nerve fiber 407
layer thickness measured by Cirrus HD and Stratus optical coherence 408
tomography. Ophthalmology 2009; 116(7): 1264-1270, 1270 e1261. 409
410
27. Vizzeri G, Weinreb RN, Gonzalez-Garcia AO, Bowd C, Medeiros FA, 411
Sample PA et al. Agreement between spectral-domain and time-domain 412
OCT for measuring RNFL thickness. Br J Ophthalmol 2009; 93(6): 413
775-781. 414
415
28. Seibold LK, Mandava N, Kahook MY. Comparison of retinal nerve fiber 416
layer thickness in normal eyes using time-domain and spectral-domain 417
optical coherence tomography. Am J Ophthalmol 2010; 150(6): 807-814. 418
419
29. Tamaki M, Matsuo T. Optical coherence tomographic parameters as 420
objective signs for visual acuity in patients with retinitis pigmentosa, future 421
candidates for retinal prostheses. J Artif Organs 2011; 14(2): 140-150. 422
423
30. Sliesoraityte I, Troeger E, Bernd A, Kurtenbach A, Zrenner E. Correlation 424
between spectral domain OCT retinal nerve fibre layer thickness and 425
multifocal pattern electroretinogram in advanced retinitis pigmentosa. Adv 426
Exp Med Biol 2012; 723: 471-478. 427
428
429
430
431
22
Figure legends 432
433
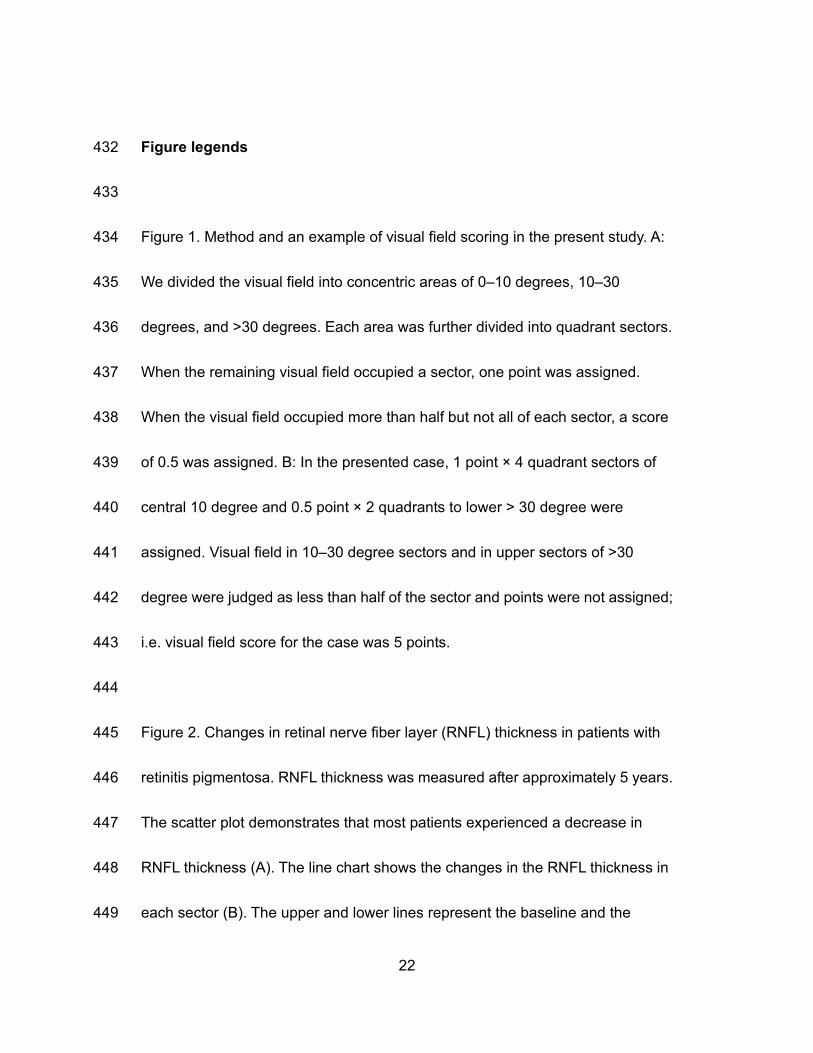
Figure 1. Method and an example of visual field scoring in the present study. A: 434
We divided the visual field into concentric areas of 0–10 degrees, 10–30 435
degrees, and >30 degrees. Each area was further divided into quadrant sectors. 436
When the remaining visual field occupied a sector, one point was assigned. 437
When the visual field occupied more than half but not all of each sector, a score 438
of 0.5 was assigned. B: In the presented case, 1 point × 4 quadrant sectors of 439
central 10 degree and 0.5 point × 2 quadrants to lower > 30 degree were 440
assigned. Visual field in 10–30 degree sectors and in upper sectors of >30 441
degree were judged as less than half of the sector and points were not assigned; 442
i.e. visual field score for the case was 5 points. 443
444
Figure 2. Changes in retinal nerve fiber layer (RNFL) thickness in patients with 445
retinitis pigmentosa. RNFL thickness was measured after approximately 5 years. 446
The scatter plot demonstrates that most patients experienced a decrease in 447
RNFL thickness (A). The line chart shows the changes in the RNFL thickness in 448
each sector (B). The upper and lower lines represent the baseline and the 449
23
follow-up (after 5 years) measurements of RNFL thickness, respectively. 450
Decrease in RNFL thickness was statistically significant in the inferior and 451
superior sectors. Figure 2 C and D shows correlation between age and RNFL 452
thickness. The regression line indicates a slope of –0.938 for the multiple linear 453
regression model (C). Baseline age and the rate of RNFL changes calculated 454
from longitudinal measurements did not show evident trend (D). T: temporal, S: 455
superior, N: nasal, I: inferior, *:P<0.05, **:P<0.01. 456
457
Figure 3. A representative case with retinitis pigmentosa showing marked 458
thinning of the retinal nerve fiber layer (RNFL). RNFL thickness was measured in 459
this 51-year-old woman after a 5-year interval. Fundus photographs show the 460
progression of the disease as indicated by pigmentation and retinal pigment 461
epithelium atrophy.(A, E) Scan alignment, image quality, and segmentation of 462
RNFL were confirmed for each measurement.(B, C, F, G) The average RNFL 463
thickness decreased from 102.88 µm (D) to 75.82 µm (H) at the end of 5 years 464
follow up in this patient.465
24
466
Table 1 Previous reports on RNFL thickness in RP patients 467
Report Numbers of
eyes/patients
OCT
model
Age
(years, range)
RNFL thickness
(µm)
Rate of
decrease in
RNFL
thickness
(µm/year)
Walia11 25/25 Stratus 48.6 (23 to 73) 97.0 ± 19.7 NA
Walia12 97/52 Optovue 39.7 (12 to 78) NA, abnormal
thinning in
38.1%,
thickening in
21.7%
NA
Oishi14 137/137 Stratus 50.0 ± 14.1
(15 to 78)
104.1 ± 21.7 –0.83 (95% CI,
–0.60 to –1.07)
Hood5 30/30 Spectralis 33.1 ± 15.9
(11 to 65)
128.2 ± 16.7 NA
25
Tamaki29 86/45 Cirrus 58.7 (13 to 79) Right: 93.2 ±
14.6
Left: 84.6 ± 17.4
NA
Anastasakis15 50/30 OPKO
SD-OCT
45.8 ± 16.3
(15 to 73)
100.1 ± 18.8 –0.65
Sliesoraityte30 24/12 Spectralis 44 ± 14 NA NA
Garcia-Martin 16 42/42 Stratus
Cirrus
Spectralis
40.0 ± 8.6
(35 to 69)
78.1 ± 14.5
76.4 ± 9.3
82.9 ± 10.4
NA
Hwang 13 36/36 Cirrus 23.1 ± 3.6
(20 to 30)
112.8 ± 17.0 NA
NA: Not available 468
469
26
470
Table 2 Previous reports on RNFL thickness of healthy subjects measured with 471
Stratus OCT 472
Report Numbers of
eyes/subjects
Age
(years,
range)
RNFL
thickness (µm)
Rate of decrease in
RNFL thickness
(µm/year)
(95% CI)
Parikh19 187/187 33.0 ± 19.7
(5 to 75)
97.3 ± 11.3 –0.16
(–0.1 to –0.24)
Budenz20 328/328 47.4 ± 15.8
(18 to 85)
100.1 ± 11.6 –0.199
(–0.279 to –0.119)
Sung21 226/124 47.5 ± 15.9
(18 to 85)
100.8 ± 10.5 –0.255
(–0.439 to –0.071)
Feuer22 425/425 46 ± 16
(18 to 85)
104.7 ± 10.8 –0.24
(–0.31 to –0.18)
473