18
LOW RECIRCULATION RATE EVAPORATORS Written by: Jeff Welch President Welch Engineering Corporation WHITE PAPER
LOW RECIRCULATION RATE EVAPORATORS
Written by: Jeff Welch President Welch Engineering Corporation
WHITE PAPER
Abstract Fin coil evaporators with enhanced internal tube surfaces allow for optimum performance with a minimal overfeed
rate. Reducing the overfeed rate requires less pumping power and smaller line sizes to the evaporator.
Additionally, less compressor power is required for the same refrigeration capacity because the wet suction line
pressure drop is reduced. Lower compressor power results in substantial electrical power savings over the life of
the facility. With internal tube enhancement, top-fed evaporators can perform as well as bottom-fed evaporators
while using a reduced refrigerant charge during full and part load operation.
Design history Forced-air, tube, and fin evaporators have been used to refrigerate air for more than 75 years. In the 1960s,
several papers documented the performance advantages of pumping ammonia through tubes with an excess
amount of liquid, and pumped overfeed evaporators have been the popular choice for industrial ammonia
refrigeration systems ever since.
Due to the high latent heat of ammonia, the quantity of liquid that enters an evaporator tube is very small, often
occupying less than 2% of the cross-sectional area of the tube. For efficient heat transfer to result in optimum
performance, excess liquid ammonia is pumped into the evaporator tube. This excess liquid “sloshes” around the
inside perimeter of the tube ensuring a liquid ammonia film coats the inside of the tube to absorb large amounts
of heat. If not for this excess liquid, more areas of the inside of the tube would dry, greatly diminishing the
performance of the evaporator.
Tube and fin evaporators are generally multiple tubes high, and of a set length, to establish the face area of the
evaporator. Typically, 6 to 12 rows of tubes are in the direction of airflow. Determining which of these tubes are in
series and which of these tubes are in parallel relative to the ammonia flow, defined as circuiting, and is the job of
the evaporator designer. Two competing factors must be balanced in any circuiting choice. A longer circuit has
more surface area so it will absorb more heat and vaporize more ammonia, creating a higher velocity within the
tube. Higher-velocity vapor is more turbulent, which distributes the liquid ammonia via agitation against the full
inner perimeter of the tube wall. A shorter circuit has less surface area and does not absorb as much heat or
vaporize as much ammonia, resulting in less turbulence and ammonia liquid that settles along the bottom the
tube. This leaves the upper portions of the inner tube perimeter dry, so no high heat transfer rate due to boiling
can occur, and greatly reduces the evaporator performance.
However, the design factor to balance against velocity and turbulence is pressure drop. If the saturated suction
temperature at the outlet of the circuit is -25 °F, a 1.0 psi internal circuit pressure drop will result in a saturated
evaporating temperature of -23 °F at the entrance of the circuit. This is an 11% loss of log mean temperature
difference with -15 °F air on temperature. Bear in mind that temperature difference drives heat transfer.
Two factors, velocity and mass flow, primarily drive pressure drop within the circuit. Pressure drop is roughly
proportional to the velocity squared. Therefore, in light of the previously described temperature penalties,
pressure drop within the circuit must be great enough to establish turbulent flow, but not in excess of that. Circuit
designers target a lower velocity with less pressure drop by adjusting circuit length or limiting the amount of excess
liquid, referred to as overfeed or recirculation rate. Recirculation rate is defined as the total mass flow into the
circuit or evaporator relative to the evaporated mass flow. As an example, three times the evaporation rate
entering the evaporator is expressed as 3:1 recirculation rate.
Contemporary evaporator designs typically call for 4:1 or 3:1 recirculation rates at the higher temperatures (40 °F
to 0 °F) and favor 3:1 or 2.5:1 at the lower temperatures (-20 °F to -45 °F). The pressure/ temperature relationship
of ammonia at the lower temperatures discourages higher pressure drops within the circuit due to the large effect
on the evaporating temperature.
In addition to wetting the inside perimeter of the tube, the thermal conductivity of the tube and fin material must
be considered. For many years ammonia evaporators were constructed of carbon steel and hot dip galvanized
after assembly, or they were aluminum tubes expanded into aluminum fins. In both instances the fins and the
tubes have the same thermal conductivity. Heat transfer occurs equally along the perimeter of the tube and from
the surrounding fin. Carbon steel has a thermal conductivity of 21 Btu/hr ft °F and that of aluminum is 118 Btu/hr
ft °F.
Design evolution Within the last decade, stainless steel tubes expanded into aluminum fins have become the evaporator materials
of choice. The high-conductance fin transfers heat to the tube very efficiently and uniformly around the tube
perimeter. The thermal path with the least resistance to the liquid ammonia or other refrigerant is directly across
the tube wall. Consequently, tube wetting directly affects thermal performance.
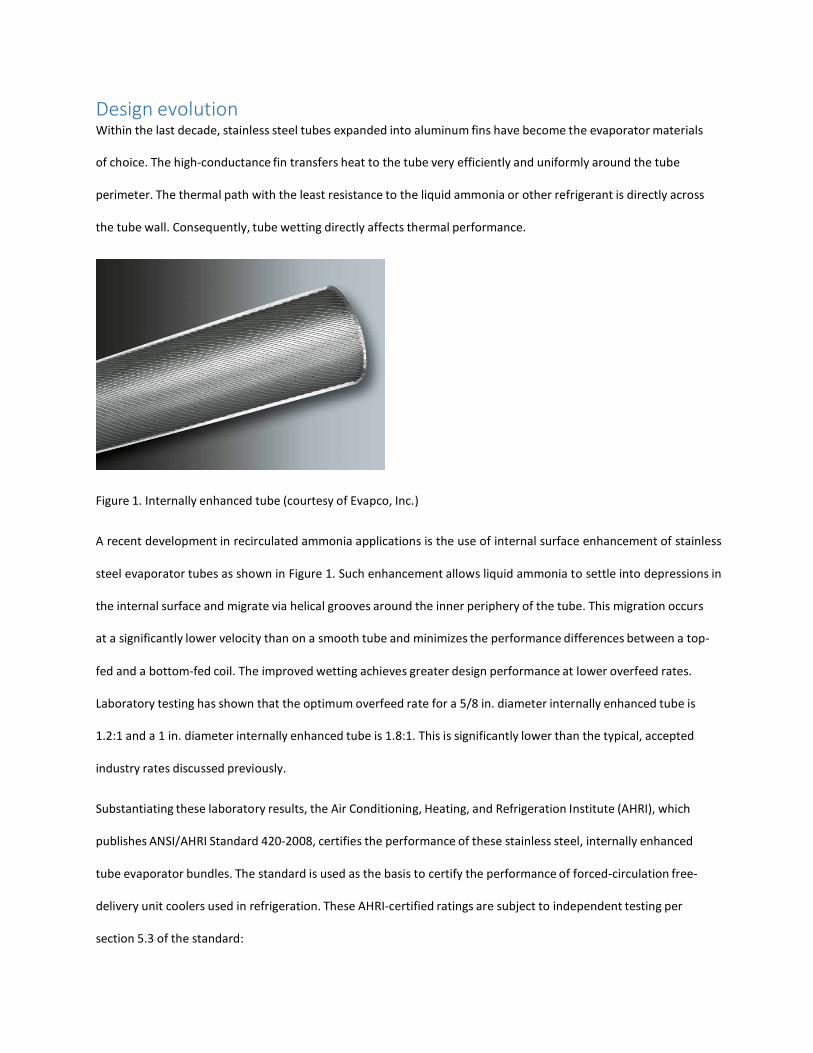
Figure 1. Internally enhanced tube (courtesy of Evapco, Inc.)
A recent development in recirculated ammonia applications is the use of internal surface enhancement of stainless
steel evaporator tubes as shown in Figure 1. Such enhancement allows liquid ammonia to settle into depressions in
the internal surface and migrate via helical grooves around the inner periphery of the tube. This migration occurs
at a significantly lower velocity than on a smooth tube and minimizes the performance differences between a top-
fed and a bottom-fed coil. The improved wetting achieves greater design performance at lower overfeed rates.
Laboratory testing has shown that the optimum overfeed rate for a 5/8 in. diameter internally enhanced tube is
1.2:1 and a 1 in. diameter internally enhanced tube is 1.8:1. This is significantly lower than the typical, accepted
industry rates discussed previously.
Substantiating these laboratory results, the Air Conditioning, Heating, and Refrigeration Institute (AHRI), which
publishes ANSI/AHRI Standard 420-2008, certifies the performance of these stainless steel, internally enhanced
tube evaporator bundles. The standard is used as the basis to certify the performance of forced-circulation free-
delivery unit coolers used in refrigeration. These AHRI-certified ratings are subject to independent testing per
section 5.3 of the standard:
“Tolerances. To comply with this standard, any representative production unit selected at
random, when tested at the Standard Rating Conditions, shall have a Gross Total Cooling Effect
not less than 95% of its published Standard Rating and not exceed 105% of its Rated Power.”
Independent AHRI certification reassures consumers that these reduced recirculation rates are valid and will not
compromise performance.
Most recirculated ammonia evaporators utilize an orifice at the beginning of each circuit to meter the sufficient
amount of ammonia into the circuit with the stated supply pressure in the liquid header. Designing ammonia
evaporators at a 1.2:1 recirculation rate requires the use of smaller orifices. The popularity of screw compressors
with high-efficiency coalescing oil separators and cooler discharge temperatures has resulted in much cleaner
systems. Therefore, where evaporators are applied to new systems, the use of smaller orifices is not a concern.
However, when low recirculation rate coils are applied to older, existing systems with a history of oil carryover or
carbonizing problems, an alternate to small orifices should be considered. In this scenario, the alternate approach
would be to design the replacement coil(s) based on a higher recirculation rate (i.e., 2:1) or, preferably, to utilize a
liquid refrigerant distributor with a single larger orifice and individual distribution tubes. This design works well in
providing uniform flow to each circuit, maximizing capacity as verified by laboratory testing.
Application advantages To illustrate the benefits of lower recirculation rates, low overfeed evaporators are compared with conventional
units for a generic public warehouse facility with a shipping dock, freezer space, and six blast cells per the floor
plan in Figure 2. Refer to Tables 1–3 for the evaporator comparisons, valve selections, and pipe selections.
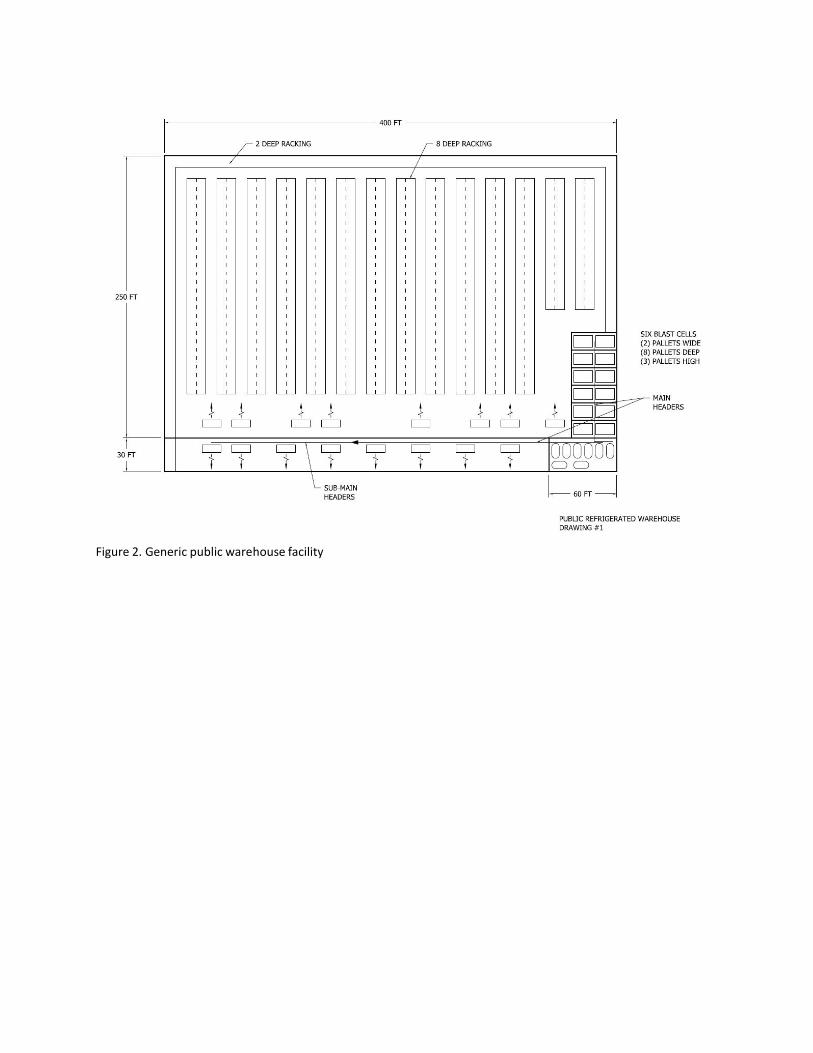
Figure 2. Generic public warehouse facility
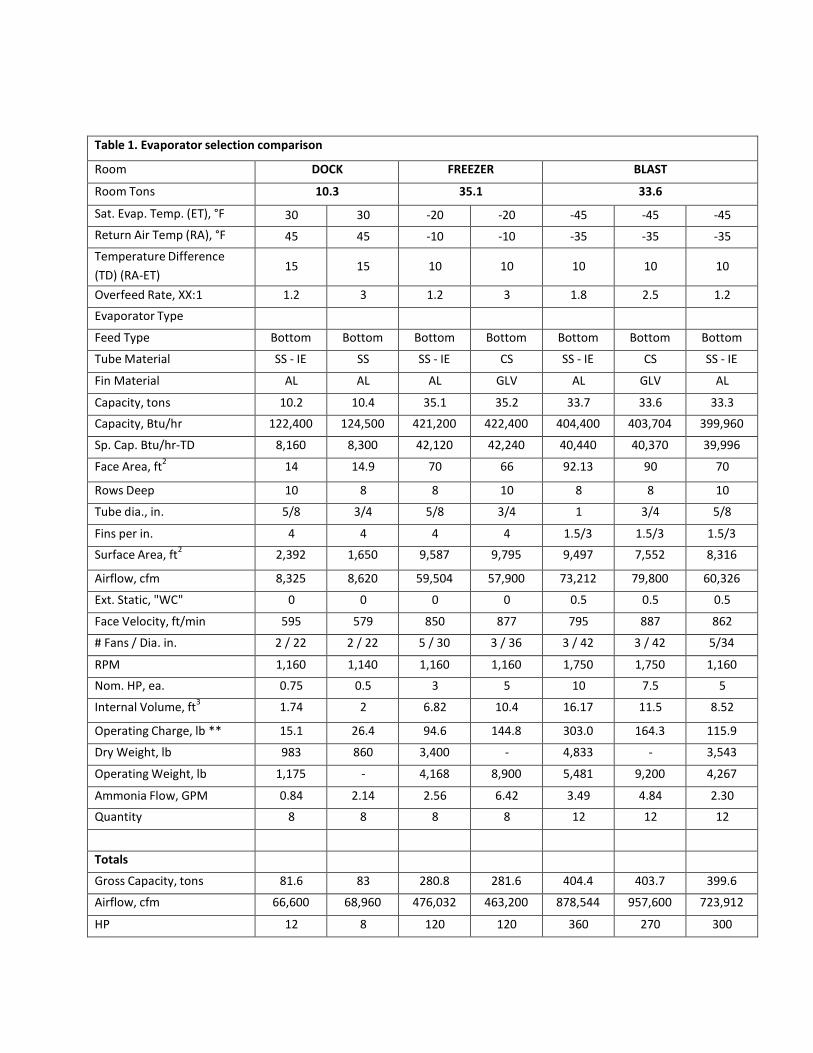
Table 1. Evaporator selection comparison
Room DOCK FREEZER BLAST
Room Tons 10.3 35.1 33.6
Sat. Evap. Temp. (ET), °F 30 30 -20 -20 -45 -45 -45 Return Air Temp (RA), °F 45 45 -10 -10 -35 -35 -35 Temperature Difference (TD) (RA-ET)
15
15
10
10
10
10
10
Overfeed Rate, XX:1 1.2 3 1.2 3 1.8 2.5 1.2
Evaporator Type Feed Type Bottom Bottom Bottom Bottom Bottom Bottom Bottom Tube Material SS - IE SS SS - IE CS SS - IE CS SS - IE
Fin Material AL AL AL GLV AL GLV AL
Capacity, tons 10.2 10.4 35.1 35.2 33.7 33.6 33.3
Capacity, Btu/hr 122,400 124,500 421,200 422,400 404,400 403,704 399,960 Sp. Cap. Btu/hr-TD 8,160 8,300 42,120 42,240 40,440 40,370 39,996 Face Area, ft2
14 14.9 70 66 92.13 90 70
Rows Deep 10 8 8 10 8 8 10 Tube dia., in. 5/8 3/4 5/8 3/4 1 3/4 5/8
Fins per in. 4 4 4 4 1.5/3 1.5/3 1.5/3
Surface Area, ft2 2,392 1,650 9,587 9,795 9,497 7,552 8,316
Airflow, cfm 8,325 8,620 59,504 57,900 73,212 79,800 60,326 Ext. Static, "WC" 0 0 0 0 0.5 0.5 0.5 Face Velocity, ft/min 595 579 850 877 795 887 862 # Fans / Dia. in. 2 / 22 2 / 22 5 / 30 3 / 36 3 / 42 3 / 42 5/34
RPM 1,160 1,140 1,160 1,160 1,750 1,750 1,160
Nom. HP, ea. 0.75 0.5 3 5 10 7.5 5 Internal Volume, ft3
1.74 2 6.82 10.4 16.17 11.5 8.52
Operating Charge, lb ** 15.1 26.4 94.6 144.8 303.0 164.3 115.9 Dry Weight, lb 983 860 3,400 - 4,833 - 3,543 Operating Weight, lb 1,175 - 4,168 8,900 5,481 9,200 4,267
Ammonia Flow, GPM 0.84 2.14 2.56 6.42 3.49 4.84 2.30
Quantity 8 8 8 8 12 12 12
Totals Gross Capacity, tons 81.6 83 280.8 281.6 404.4 403.7 399.6 Airflow, cfm 66,600 68,960 476,032 463,200 878,544 957,600 723,912
HP 12 8 120 120 360 270 300
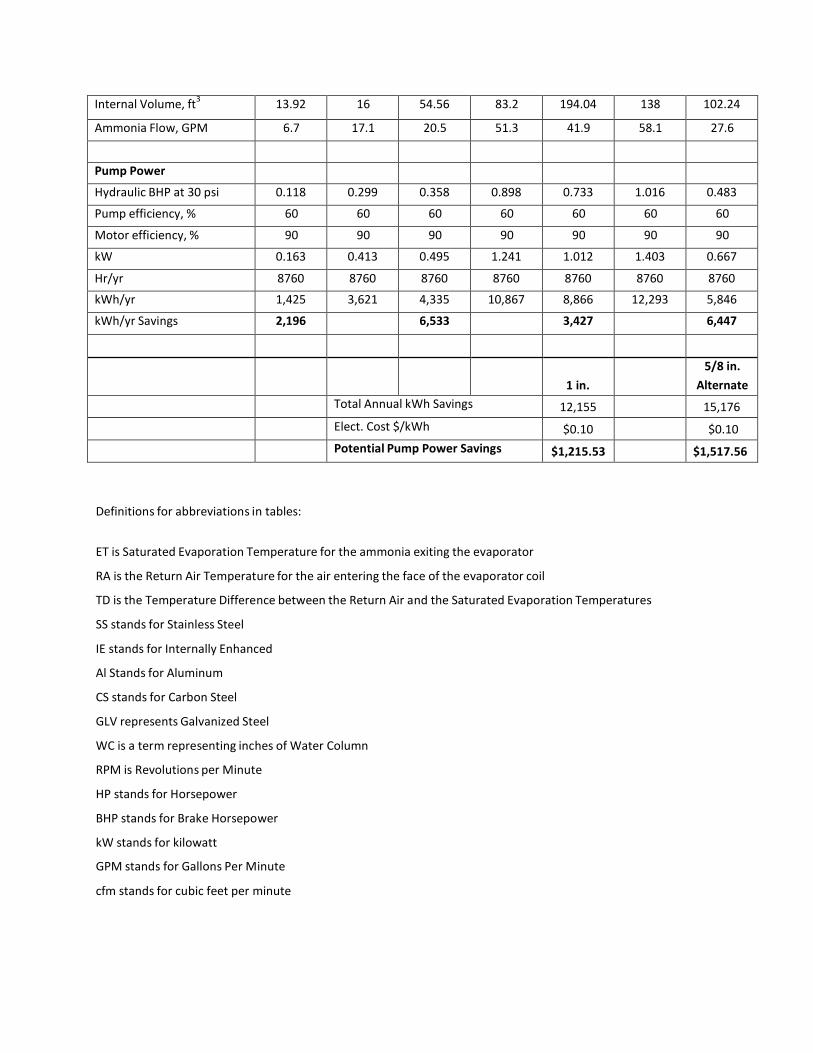
Internal Volume, ft3 13.92 16 54.56 83.2 194.04 138 102.24
Ammonia Flow, GPM 6.7 17.1 20.5 51.3 41.9 58.1 27.6
Pump Power Hydraulic BHP at 30 psi 0.118 0.299 0.358 0.898 0.733 1.016 0.483 Pump efficiency, % 60 60 60 60 60 60 60 Motor efficiency, % 90 90 90 90 90 90 90 kW 0.163 0.413 0.495 1.241 1.012 1.403 0.667
Hr/yr 8760 8760 8760 8760 8760 8760 8760
kWh/yr 1,425 3,621 4,335 10,867 8,866 12,293 5,846 kWh/yr Savings 2,196 6,533 3,427 6,447
1 in. 5/8 in.
Alternate Total Annual kWh Savings 12,155 15,176 Elect. Cost $/kWh $0.10 $0.10 Potential Pump Power Savings $1,215.53 $1,517.56
Definitions for abbreviations in tables:
ET is Saturated Evaporation Temperature for the ammonia exiting the evaporator
RA is the Return Air Temperature for the air entering the face of the evaporator coil
TD is the Temperature Difference between the Return Air and the Saturated Evaporation Temperatures
SS stands for Stainless Steel
IE stands for Internally Enhanced
Al Stands for Aluminum
CS stands for Carbon Steel
GLV represents Galvanized Steel
WC is a term representing inches of Water Column
RPM is Revolutions per Minute
HP stands for Horsepower
BHP stands for Brake Horsepower
kW stands for kilowatt
GPM stands for Gallons Per Minute
cfm stands for cubic feet per minute
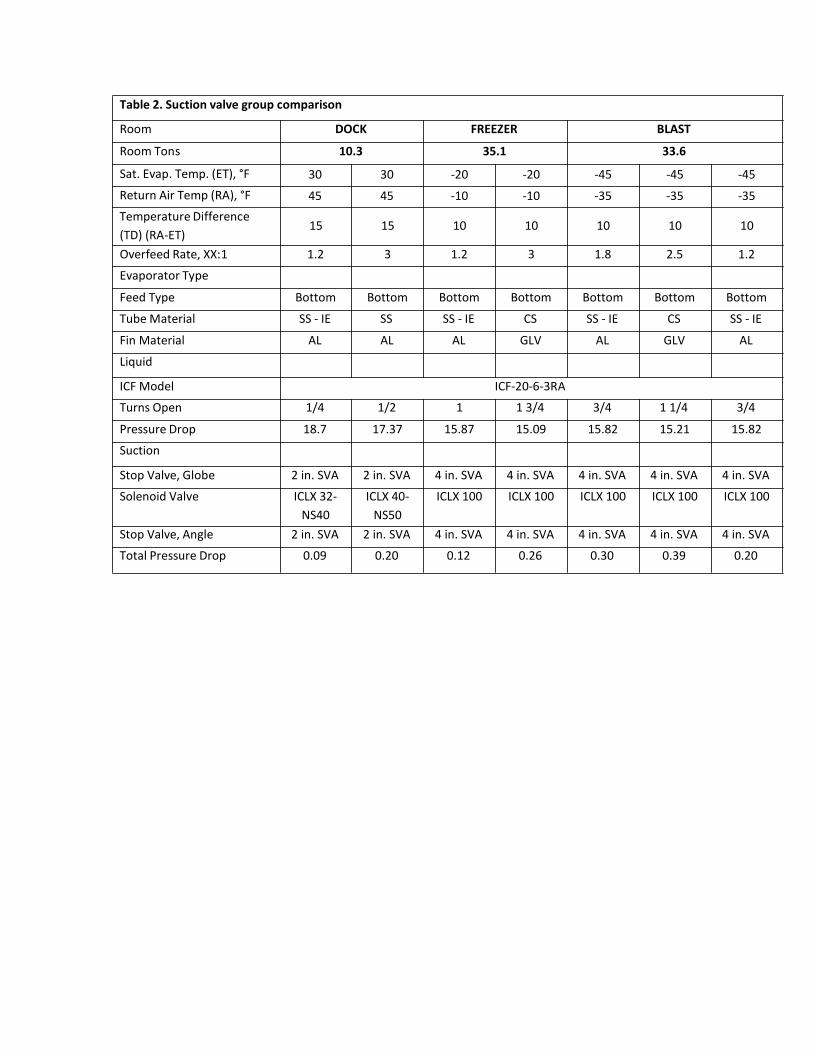
Table 2. Suction valve group comparison
Room DOCK FREEZER BLAST
Room Tons 10.3 35.1 33.6
Sat. Evap. Temp. (ET), °F 30 30 -20 -20 -45 -45 -45 Return Air Temp (RA), °F 45 45 -10 -10 -35 -35 -35 Temperature Difference
(TD) (RA-ET) 15 15 10 10 10 10 10
Overfeed Rate, XX:1 1.2 3 1.2 3 1.8 2.5 1.2
Evaporator Type
Feed Type Bottom Bottom Bottom Bottom Bottom Bottom Bottom
Tube Material SS - IE SS SS - IE CS SS - IE CS SS - IE
Fin Material AL AL AL GLV AL GLV AL
Liquid
ICF Model ICF-20-6-3RA
Turns Open 1/4 1/2 1 1 3/4 3/4 1 1/4 3/4
Pressure Drop 18.7 17.37 15.87 15.09 15.82 15.21 15.82
Suction
Stop Valve, Globe 2 in. SVA 2 in. SVA 4 in. SVA 4 in. SVA 4 in. SVA 4 in. SVA 4 in. SVA
Solenoid Valve ICLX 32- NS40
ICLX 40- NS50
ICLX 100 ICLX 100 ICLX 100 ICLX 100 ICLX 100
Stop Valve, Angle 2 in. SVA 2 in. SVA 4 in. SVA 4 in. SVA 4 in. SVA 4 in. SVA 4 in. SVA
Total Pressure Drop 0.09 0.20 0.12 0.26 0.30 0.39 0.20
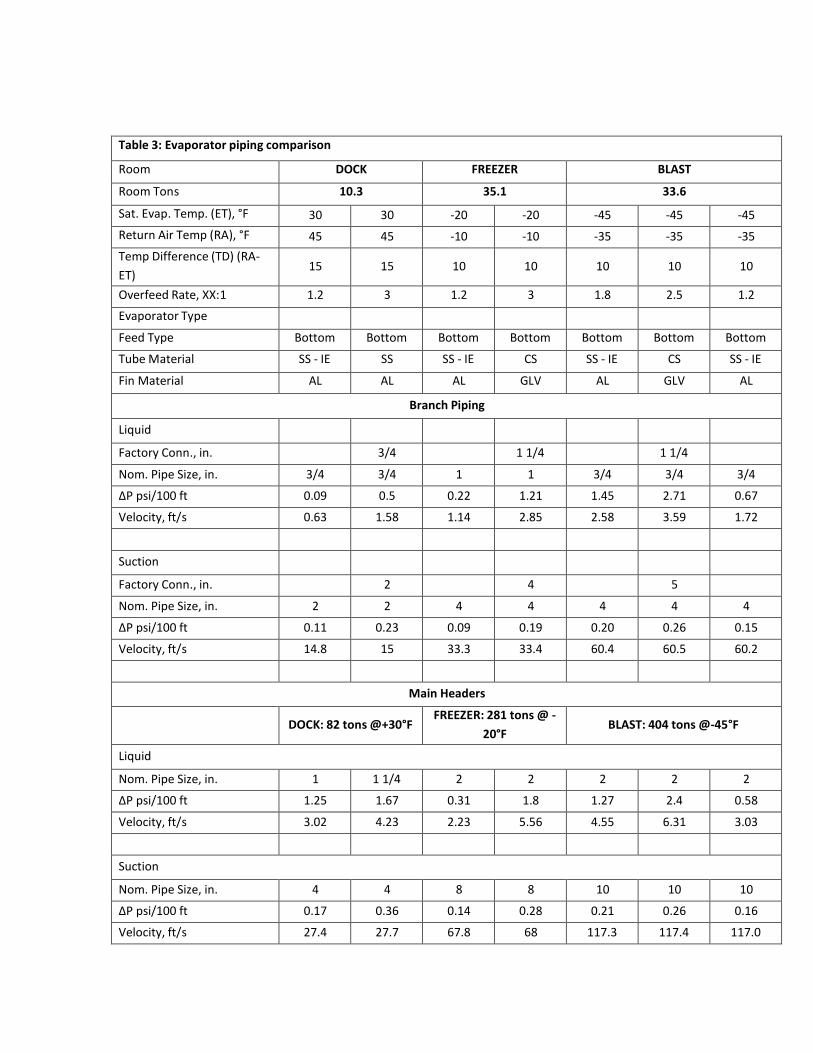
Table 3: Evaporator piping comparison
Room DOCK FREEZER BLAST
Room Tons 10.3 35.1 33.6
Sat. Evap. Temp. (ET), °F 30 30 -20 -20 -45 -45 -45 Return Air Temp (RA), °F 45 45 -10 -10 -35 -35 -35 Temp Difference (TD) (RA- ET)
15
15
10
10
10
10
10
Overfeed Rate, XX:1 1.2 3 1.2 3 1.8 2.5 1.2
Evaporator Type Feed Type Bottom Bottom Bottom Bottom Bottom Bottom Bottom Tube Material SS - IE SS SS - IE CS SS - IE CS SS - IE
Fin Material AL AL AL GLV AL GLV AL
Branch Piping
Liquid
Factory Conn., in. 3/4 1 1/4 1 1/4 Nom. Pipe Size, in. 3/4 3/4 1 1 3/4 3/4 3/4
ΔP psi/100 ft 0.09 0.5 0.22 1.21 1.45 2.71 0.67
Velocity, ft/s 0.63 1.58 1.14 2.85 2.58 3.59 1.72
Suction
Factory Conn., in. 2 4 5 Nom. Pipe Size, in. 2 2 4 4 4 4 4
ΔP psi/100 ft 0.11 0.23 0.09 0.19 0.20 0.26 0.15
Velocity, ft/s 14.8 15 33.3 33.4 60.4 60.5 60.2
Main Headers
DOCK: 82 tons @+30°F FREEZER: 281 tons @ -
20°F
BLAST: 404 tons @-45°F
Liquid
Nom. Pipe Size, in. 1 1 1/4 2 2 2 2 2
ΔP psi/100 ft 1.25 1.67 0.31 1.8 1.27 2.4 0.58
Velocity, ft/s 3.02 4.23 2.23 5.56 4.55 6.31 3.03
Suction
Nom. Pipe Size, in. 4 4 8 8 10 10 10
ΔP psi/100 ft 0.17 0.36 0.14 0.28 0.21 0.26 0.16
Velocity, ft/s 27.4 27.7 67.8 68 117.3 117.4 117.0
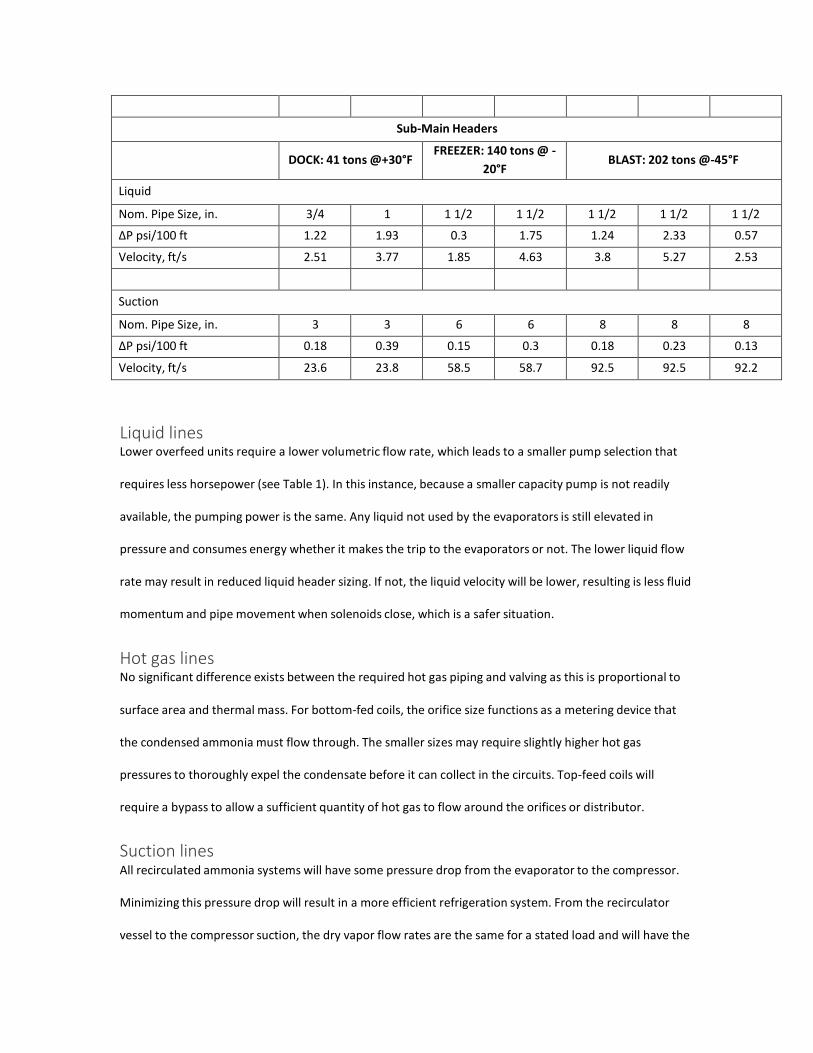
Sub-Main Headers
DOCK: 41 tons @+30°F FREEZER: 140 tons @ -
20°F
BLAST: 202 tons @-45°F
Liquid
Nom. Pipe Size, in. 3/4 1 1 1/2 1 1/2 1 1/2 1 1/2 1 1/2
ΔP psi/100 ft 1.22 1.93 0.3 1.75 1.24 2.33 0.57
Velocity, ft/s 2.51 3.77 1.85 4.63 3.8 5.27 2.53
Suction
Nom. Pipe Size, in. 3 3 6 6 8 8 8
ΔP psi/100 ft 0.18 0.39 0.15 0.3 0.18 0.23 0.13
Velocity, ft/s 23.6 23.8 58.5 58.7 92.5 92.5 92.2
Liquid lines Lower overfeed units require a lower volumetric flow rate, which leads to a smaller pump selection that
requires less horsepower (see Table 1). In this instance, because a smaller capacity pump is not readily
available, the pumping power is the same. Any liquid not used by the evaporators is still elevated in
pressure and consumes energy whether it makes the trip to the evaporators or not. The lower liquid flow
rate may result in reduced liquid header sizing. If not, the liquid velocity will be lower, resulting is less fluid
momentum and pipe movement when solenoids close, which is a safer situation.
Hot gas lines No significant difference exists between the required hot gas piping and valving as this is proportional to
surface area and thermal mass. For bottom-fed coils, the orifice size functions as a metering device that
the condensed ammonia must flow through. The smaller sizes may require slightly higher hot gas
pressures to thoroughly expel the condensate before it can collect in the circuits. Top-feed coils will
require a bypass to allow a sufficient quantity of hot gas to flow around the orifices or distributor.
Suction lines All recirculated ammonia systems will have some pressure drop from the evaporator to the compressor.
Minimizing this pressure drop will result in a more efficient refrigeration system. From the recirculator
vessel to the compressor suction, the dry vapor flow rates are the same for a stated load and will have the
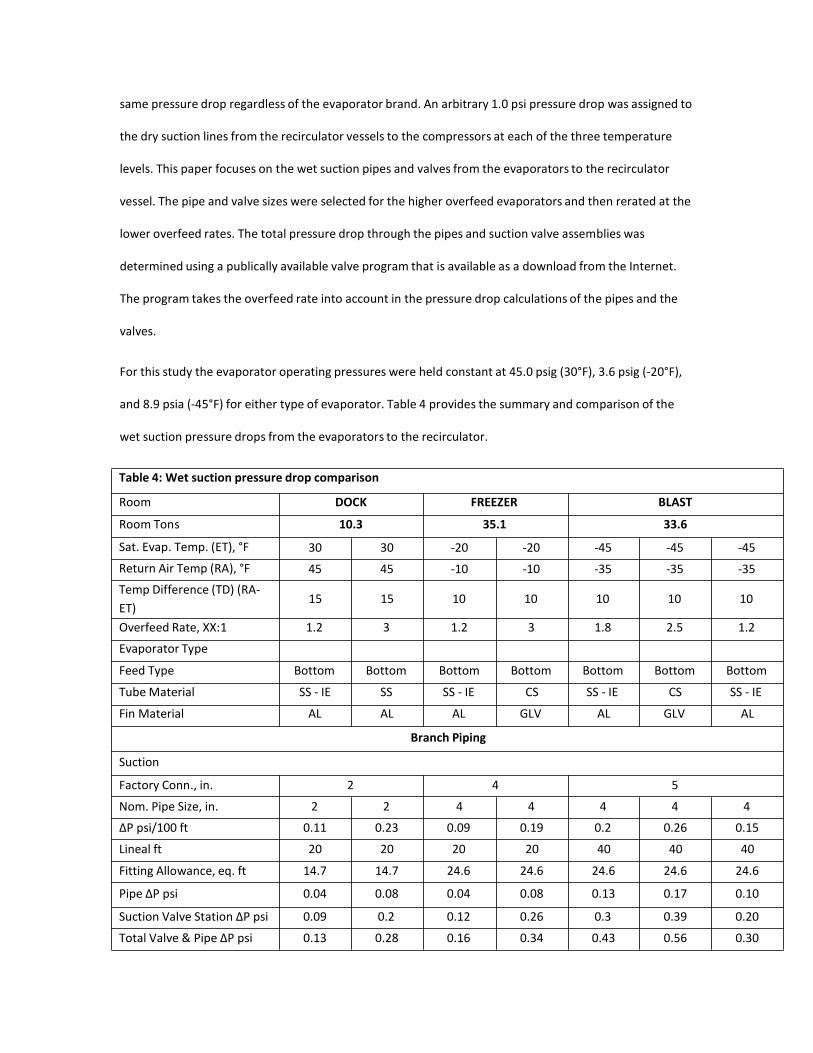
same pressure drop regardless of the evaporator brand. An arbitrary 1.0 psi pressure drop was assigned to
the dry suction lines from the recirculator vessels to the compressors at each of the three temperature
levels. This paper focuses on the wet suction pipes and valves from the evaporators to the recirculator
vessel. The pipe and valve sizes were selected for the higher overfeed evaporators and then rerated at the
lower overfeed rates. The total pressure drop through the pipes and suction valve assemblies was
determined using a publically available valve program that is available as a download from the Internet.
The program takes the overfeed rate into account in the pressure drop calculations of the pipes and the
valves.
For this study the evaporator operating pressures were held constant at 45.0 psig (30°F), 3.6 psig (-20°F),
and 8.9 psia (-45°F) for either type of evaporator. Table 4 provides the summary and comparison of the
wet suction pressure drops from the evaporators to the recirculator.
Table 4: Wet suction pressure drop comparison
Room DOCK FREEZER BLAST
Room Tons 10.3 35.1 33.6
Sat. Evap. Temp. (ET), °F 30 30 -20 -20 -45 -45 -45 Return Air Temp (RA), °F 45 45 -10 -10 -35 -35 -35 Temp Difference (TD) (RA-
ET) 15 15 10 10 10 10 10
Overfeed Rate, XX:1 1.2 3 1.2 3 1.8 2.5 1.2
Evaporator Type
Feed Type Bottom Bottom Bottom Bottom Bottom Bottom Bottom
Tube Material SS - IE SS SS - IE CS SS - IE CS SS - IE
Fin Material AL AL AL GLV AL GLV AL
Branch Piping
Suction
Factory Conn., in. 2 4 5
Nom. Pipe Size, in. 2 2 4 4 4 4 4
ΔP psi/100 ft 0.11 0.23 0.09 0.19 0.2 0.26 0.15
Lineal ft 20 20 20 20 40 40 40
Fitting Allowance, eq. ft 14.7 14.7 24.6 24.6 24.6 24.6 24.6
Pipe ΔP psi 0.04 0.08 0.04 0.08 0.13 0.17 0.10
Suction Valve Station ΔP psi 0.09 0.2 0.12 0.26 0.3 0.39 0.20
Total Valve & Pipe ΔP psi 0.13 0.28 0.16 0.34 0.43 0.56 0.30
Main Headers
DOCK: 82 tons @+30°F FREEZER: 281 tons @ -
20°F
BLAST: 404 tons @-45°F
Suction
Nom. Pipe Size, in. 4 4 8 8 10 10 10 ΔP psi/100 ft 0.17 0.36 0.14 0.28 0.21 0.26 0.16 Lineal ft 200 200 200 200 66 66 66 Fitting Allowance, eq. ft 12.6 12.6 17.1 21 24 24 24 Pipe ΔP psi 0.36 0.77 0.30 0.62 0.19 0.23 0.14
Suction Valve ΔP psi 0.04 0.08 0.08 0.18 0.24 0.32 0.17
Total Valve & Pipe ΔP psi 0.40 0.85 0.38 0.80 0.43 0.55 0.31
Sub-Main Headers
DOCK: 41 tons @+30°F FREEZER: 140 tons @ -
20°F
BLAST: 202 tons @-45°F
Suction
Nom. Pipe Size, in. 3 3 6 6 8 8 8
ΔP psi/100 ft 0.18 0.39 0.15 0.3 0.18 0.23 0.13
Lineal ft 180 180 180 180 30 30 30 Fitting Allowance, eq. ft 6.8 6.8 11.4 11.4 14 14 14 Pipe ΔP psi 0.34 0.73 0.29 0.57 0.08 0.10 0.06 Wet Suction SUMMARY Total Pipe and Valve ΔP psi 0.87 1.85 0.83 1.72 0.94 1.21 0.67
Savings, psi 0.98 0.89 0.27 0.54
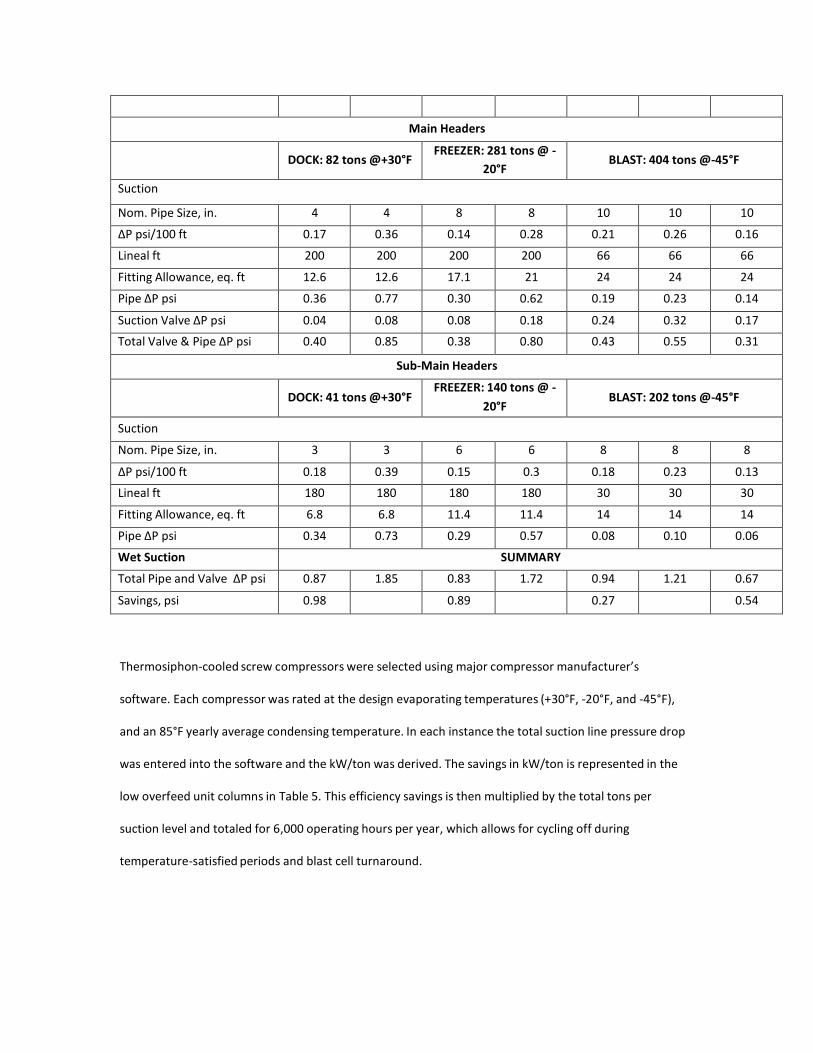
Thermosiphon-cooled screw compressors were selected using major compressor manufacturer’s
software. Each compressor was rated at the design evaporating temperatures (+30°F, -20°F, and -45°F),
and an 85°F yearly average condensing temperature. In each instance the total suction line pressure drop
was entered into the software and the kW/ton was derived. The savings in kW/ton is represented in the
low overfeed unit columns in Table 5. This efficiency savings is then multiplied by the total tons per
suction level and totaled for 6,000 operating hours per year, which allows for cycling off during
temperature-satisfied periods and blast cell turnaround.
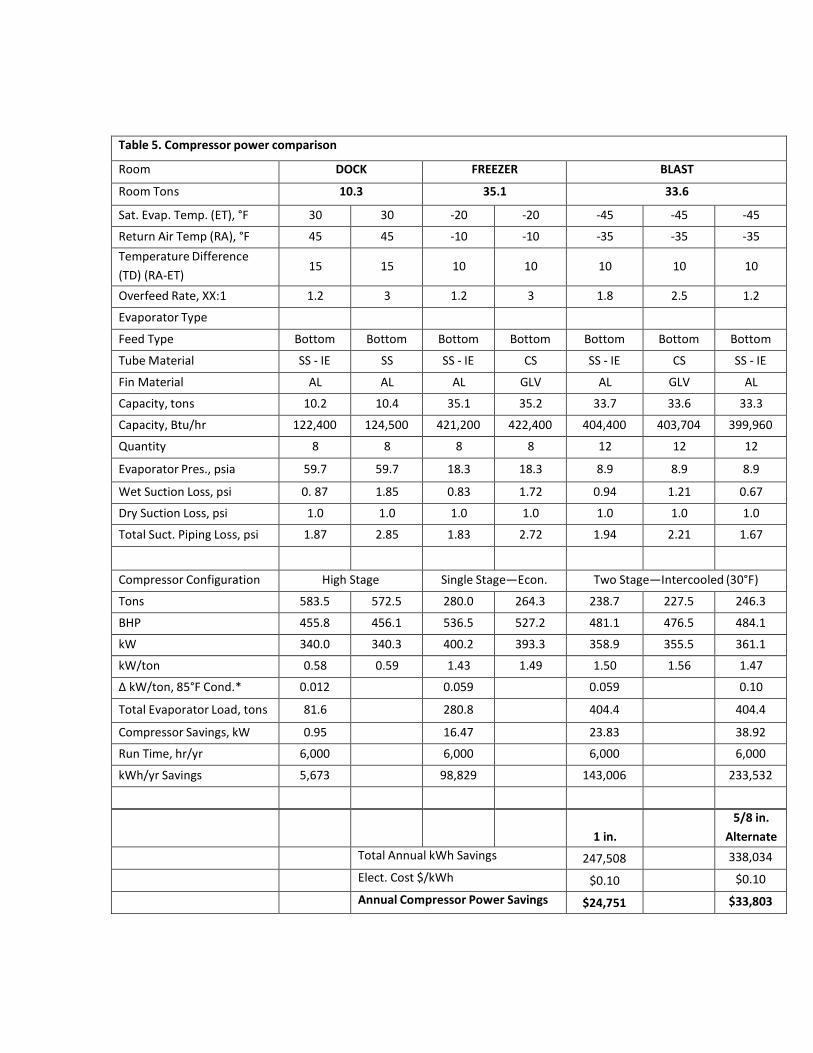
Table 5. Compressor power comparison
Room DOCK FREEZER BLAST
Room Tons 10.3 35.1 33.6
Sat. Evap. Temp. (ET), °F 30 30 -20 -20 -45 -45 -45
Return Air Temp (RA), °F 45 45 -10 -10 -35 -35 -35 Temperature Difference (TD) (RA-ET)
15
15
10
10
10
10
10
Overfeed Rate, XX:1 1.2 3 1.2 3 1.8 2.5 1.2
Evaporator Type Feed Type Bottom Bottom Bottom Bottom Bottom Bottom Bottom
Tube Material SS - IE SS SS - IE CS SS - IE CS SS - IE
Fin Material AL AL AL GLV AL GLV AL
Capacity, tons 10.2 10.4 35.1 35.2 33.7 33.6 33.3
Capacity, Btu/hr 122,400 124,500 421,200 422,400 404,400 403,704 399,960
Quantity 8 8 8 8 12 12 12
Evaporator Pres., psia 59.7 59.7 18.3 18.3 8.9 8.9 8.9
Wet Suction Loss, psi 0. 87 1.85 0.83 1.72 0.94 1.21 0.67
Dry Suction Loss, psi 1.0 1.0 1.0 1.0 1.0 1.0 1.0
Total Suct. Piping Loss, psi 1.87 2.85 1.83 2.72 1.94 2.21 1.67
Compressor Configuration High Stage Single Stage—Econ. Two Stage—Intercooled (30°F)
Tons 583.5 572.5 280.0 264.3 238.7 227.5 246.3
BHP 455.8 456.1 536.5 527.2 481.1 476.5 484.1
kW 340.0 340.3 400.2 393.3 358.9 355.5 361.1
kW/ton 0.58 0.59 1.43 1.49 1.50 1.56 1.47
Δ kW/ton, 85°F Cond.* 0.012 0.059 0.059 0.10
Total Evaporator Load, tons 81.6 280.8 404.4 404.4
Compressor Savings, kW 0.95 16.47 23.83 38.92
Run Time, hr/yr 6,000 6,000 6,000 6,000
kWh/yr Savings 5,673 98,829 143,006 233,532
1 in. 5/8 in.
Alternate Total Annual kWh Savings 247,508 338,034
Elect. Cost $/kWh $0.10 $0.10
Annual Compressor Power Savings $24,751 $33,803
The savings due to less mass flow 1 in the wet suction lines are significant, approximately 247,500 kWh per
year and 338,000 kWh per year if 5/8 in. internally enhanced tube evaporators are used in the blast cells.
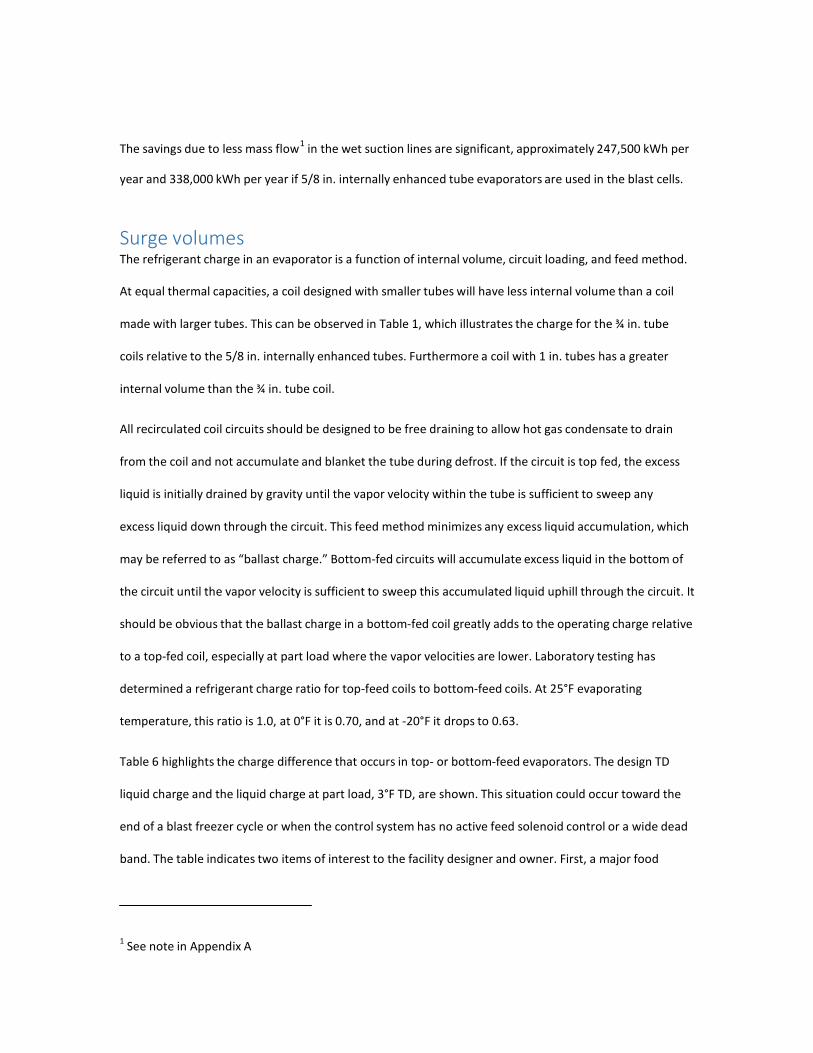
Surge volumes The refrigerant charge in an evaporator is a function of internal volume, circuit loading, and feed method.
At equal thermal capacities, a coil designed with smaller tubes will have less internal volume than a coil
made with larger tubes. This can be observed in Table 1, which illustrates the charge for the ¾ in. tube
coils relative to the 5/8 in. internally enhanced tubes. Furthermore a coil with 1 in. tubes has a greater
internal volume than the ¾ in. tube coil.
All recirculated coil circuits should be designed to be free draining to allow hot gas condensate to drain
from the coil and not accumulate and blanket the tube during defrost. If the circuit is top fed, the excess
liquid is initially drained by gravity until the vapor velocity within the tube is sufficient to sweep any
excess liquid down through the circuit. This feed method minimizes any excess liquid accumulation, which
may be referred to as “ballast charge.” Bottom-fed circuits will accumulate excess liquid in the bottom of
the circuit until the vapor velocity is sufficient to sweep this accumulated liquid uphill through the circuit. It
should be obvious that the ballast charge in a bottom-fed coil greatly adds to the operating charge relative
to a top-fed coil, especially at part load where the vapor velocities are lower. Laboratory testing has
determined a refrigerant charge ratio for top-feed coils to bottom-feed coils. At 25°F evaporating
temperature, this ratio is 1.0, at 0°F it is 0.70, and at -20°F it drops to 0.63.
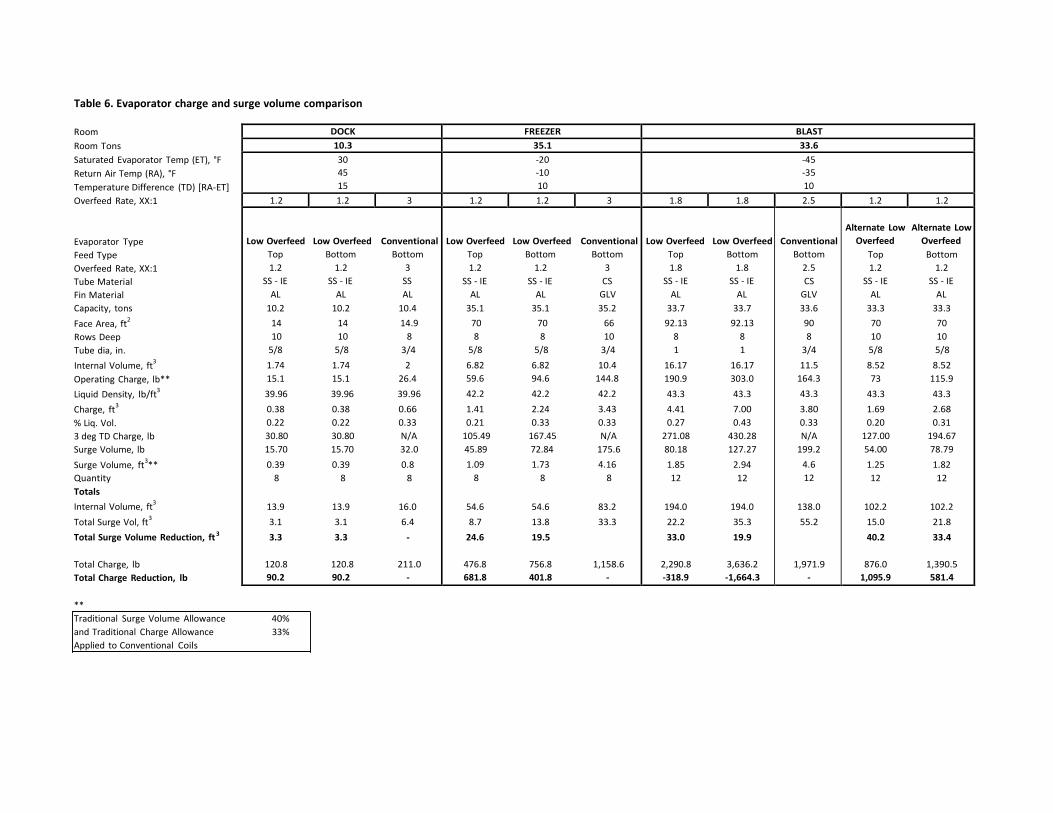
Table 6 highlights the charge difference that occurs in top- or bottom-feed evaporators. The design TD
liquid charge and the liquid charge at part load, 3°F TD, are shown. This situation could occur toward the
end of a blast freezer cycle or when the control system has no active feed solenoid control or a wide dead
band. The table indicates two items of interest to the facility designer and owner. First, a major food
1 See note in Appendix A
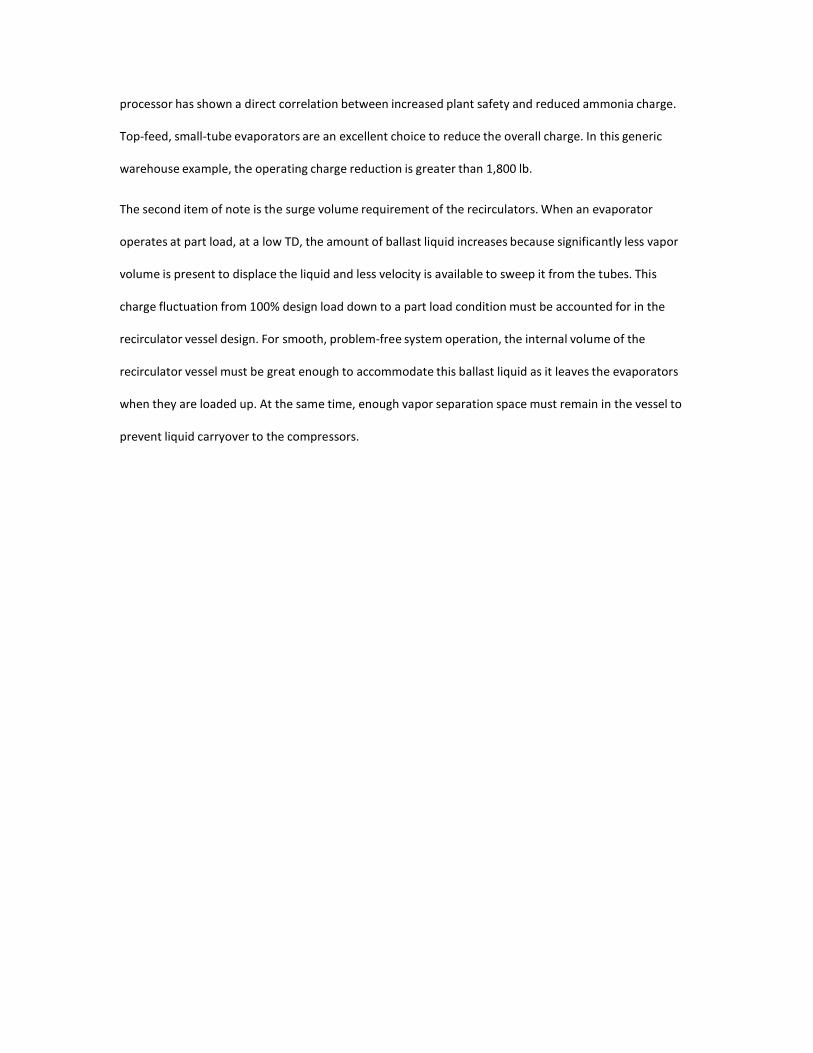
processor has shown a direct correlation between increased plant safety and reduced ammonia charge.
Top-feed, small-tube evaporators are an excellent choice to reduce the overall charge. In this generic
warehouse example, the operating charge reduction is greater than 1,800 lb.
The second item of note is the surge volume requirement of the recirculators. When an evaporator
operates at part load, at a low TD, the amount of ballast liquid increases because significantly less vapor
volume is present to displace the liquid and less velocity is available to sweep it from the tubes. This
charge fluctuation from 100% design load down to a part load condition must be accounted for in the
recirculator vessel design. For smooth, problem-free system operation, the internal volume of the
recirculator vessel must be great enough to accommodate this ballast liquid as it leaves the evaporators
when they are loaded up. At the same time, enough vapor separation space must remain in the vessel to
prevent liquid carryover to the compressors.
DOCK FREEZER BLAST 10.3 35.1 33.6 30 45 15
-20 -10 10
-45 -35 10
1.2 1.2 3 1.2 1.2 3 1.8 1.8 2.5 1.2 1.2 Low Overfeed Low Overfeed Conventional
Top Bottom Bottom 1.2 1.2 3
SS - IE SS - IE SS AL AL AL
10.2 10.2 10.4 14 14 14.9 10 10 8
5/8 5/8 3/4 1.74 1.74 2 15.1 15.1 26.4 39.96 39.96 39.96 0.38 0.38 0.66 0.22 0.22 0.33 30.80 30.80 N/A 15.70 15.70 32.0 0.39 0.39 0.8
8 8 8
13.9 13.9 16.0 3.1 3.1 6.4 3.3 3.3 -
120.8 120.8 211.0 90.2 90.2 -
Low Overfeed Low Overfeed Conventional
Top Bottom Bottom 1.2 1.2 3
SS - IE SS - IE CS AL AL GLV
35.1 35.1 35.2 70 70 66 8 8 10
5/8 5/8 3/4 6.82 6.82 10.4 59.6 94.6 144.8 42.2 42.2 42.2 1.41 2.24 3.43 0.21 0.33 0.33
105.49 167.45 N/A 45.89 72.84 175.6 1.09 1.73 4.16
8 8 8
54.6 54.6 83.2 8.7 13.8 33.3
24.6 19.5
476.8 756.8 1,158.6 681.8 401.8 -
Low Overfeed Low Overfeed
Top Bottom 1.8 1.8
SS - IE SS - IE AL AL
33.7 33.7 92.13 92.13
8 8 1 1
16.17 16.17 190.9 303.0 43.3 43.3 4.41 7.00 0.27 0.43
271.08 430.28 80.18 127.27 1.85 2.94 12 12
194.0 194.0 22.2 35.3 33.0 19.9
2,290.8 3,636.2 -318.9 -1,664.3
Conventional Bottom
2.5 CS
GLV 33.6 90 8
3/4 11.5
164.3 43.3 3.80 0.33 N/A
199.2 4.6 12
138.0 55.2
1,971.9 -
Alternate Low Alternate Low
Overfeed Overfeed Top Bottom 1.2 1.2
SS - IE SS - IE AL AL
33.3 33.3 70 70 10 10 5/8 5/8 8.52 8.52 73 115.9
43.3 43.3 1.69 2.68 0.20 0.31
127.00 194.67 54.00 78.79 1.25 1.82 12 12
102.2 102.2 15.0 21.8 40.2 33.4
876.0 1,390.5
1,095.9 581.4
Table 6. Evaporator charge and surge volume comparison
Room Room Tons Saturated Evaporator Temp (ET), °F Return Air Temp (RA), °F Temperature Difference (TD) [RA-ET] Overfeed Rate, XX:1
Evaporator Type Feed Type Overfeed Rate, XX:1 Tube Material Fin Material Capacity, tons Face Area, ft2
Rows Deep Tube dia, in. Internal Volume, ft3
Operating Charge, lb** Liquid Density, lb/ft3
Charge, ft3
% Liq. Vol. 3 deg TD Charge, lb Surge Volume, lb Surge Volume, ft3** Quantity Totals Internal Volume, ft3
Total Surge Vol, ft3
Total Surge Volume Reduction, ft 3
Total Charge, lb Total Charge Reduction, lb
** Traditional Surge Volume Allowance 40% and Traditional Charge Allowance 33% Applied to Conventional Coils
Vessel designers refer to this as surge volume. Referring back to the blast freezing recirculator of the
generic warehouse, this reduction in surge volume may be in excess of 40 ft3, which will definitely allow
for a smaller vessel diameter and/or length.
The lower overfeed rate places less liquid in the wet suction headers under steady-state load when the
vapor velocity is sufficient to drag liquid through the pipe. However, the liquid volume build-up during
light load is a function of pipe slope. Therefore, surge volumes due to piping are not quantified in this
paper.
Summary Use of low overfeed evaporators will reduce pressure drop in all portions of wet suction piping. This
reduction in pressure drop will significantly reduce the work required at the compressor over the lifespan
of the facility, resulting in electricity savings and lower overhead costs. Additionally, internally enhanced
tubes allow the use of top-fed evaporators for a significant operating charge reduction and surge volume
decrease.
References American National Standards Institute (ANSI) / Air Conditioning, Heating, and Refrigeration Institute
(AHRI) Standard 420 Standard for Performance Rating of Forced-Circulation Free-Delivery Unit
Coolers for Refrigeration (2008).


