Title of Presentation to go here Authors Name Road crashes involving stolen motor vehicles in New South Wales and South Australia Emma Ziersch, Sophie Ransom*, Hedyeh Hedayati IAATI Seminar, Sydney, 3-7 August 2008
Transcript
Title of Presentation to go hereAuthors Name
Road crashes involving stolen motor vehicles in New South Wales and South Australia
Road crashes involving stolen motor vehicles in New South Wales and South Australia
Emma Ziersch, Sophie Ransom*, Hedyeh Hedayati
IAATI Seminar, Sydney, 3-7 August 2008
August 2008
• What is CARS?
• Why look at motor vehicle theft and road crashes?
• Objectives of the research
• Method
• Findings
• Trends
• Severity of accidents
• Temporal characteristics
• Cause of accidents
• Vehicle characteristics
• Summary and discussion
OutlineOutline
August 2008
CARS (Comprehensive Auto-theft Research System) was established in South Australia in 1995 to provide timely and accurate motor vehicle theft data, to enable accurate monitoring of trends and effective policy development.
CARS expanded to become a national collection in 1999 with funding from the National Motor Vehicle Theft Reduction Council (NMVTRC). CARS now provide a range of regular statistical reports, a data service for stakeholders, and conducts research into specific issues relevant to motor vehicle theft in Australia.
CARS was developed and is managed by the Office of Crime Statistics and Research (OCSAR), in the South Australian Attorney General’s Department.
What is CARS?What is CARS?
• Police incident and recovery data from all states and territories
• Currently registered vehicle information from all states and territories
• Policy and claim details from participating insurers
• Detailed vehicle specifications purchased from Polk Automotive Intelligence
• Vehicle security specifications from Insurance Australia Group (IAG)
• Passenger & light commercial vehicle value estimates from Glass’ Guide
• Details of vehicles with DataDots
• ABS demographic and spatial data
What data is held by CARS?What data is held by CARS?
August 2008
Why MVT and road crashes?Why MVT and road crashes?
• Stolen vehicles present a danger on our roads
• There has not been any research conducted previously to indicate the scale or estimate the true cost of crashes involving stolen vehicles
• Examining crashes involving vehicle theft may help in developing strategies to address the problem
August 2008
Why MVT and road crashes?Why MVT and road crashes?
February 13, 2007 – South Australia
The Advertiser – “Speeding driver on bail kills newlywed”
August 2008
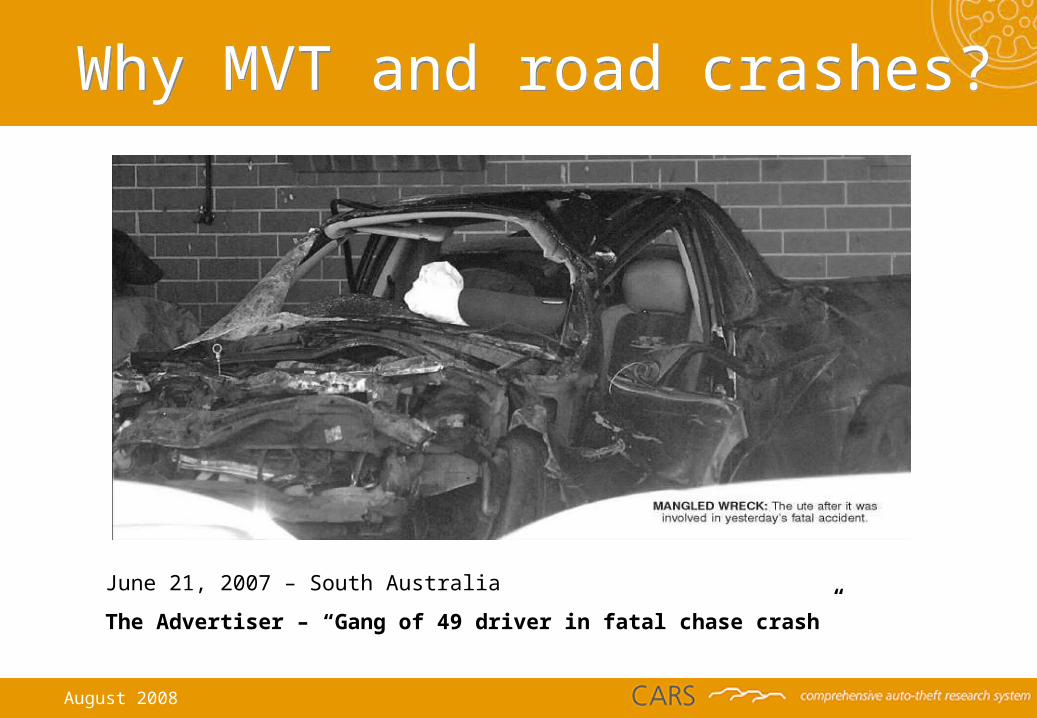
Why MVT and road crashes?Why MVT and road crashes?
June 21, 2007 – South Australia
The Advertiser – “Gang of 49 driver in fatal chase crash”
August 2008
To:
• Examine the relationship between motor vehicle crashes and vehicle theft in two Australian states
• Report on the number of fatalities and injuries for all crashes involving motor vehicle theft
• Assess the economic and social costs of motor vehicle crashes which involve stolen vehicles
Objectives of the researchObjectives of the research
August 2008
MethodMethod
• Police vehicle theft data from the CARS database.
• Crash data:
NSW - New South Wales Roads and Traffic Authority. Data from 1999/2000 to 2006/2007.
SA - South Australian Department of Transport Energy and Infrastructure. Data from 1995 to 2006.
• A crash was considered to have involved vehicle theft if a vehicle was reported stolen and remained outstanding at the time it was involved in a crash.
August 2008
FindingsFindings
NSW and SA: Number of reported vehicle thefts per year, 1999/00 – 2006/07
August 2008
FindingsFindings
NSW: Number of road crashes and percentage involving a stolen vehicle, 1999/00 – 2006/07
August 2008
FindingsFindings
SA: Number of road crashes and percentage involving a stolen vehicle, 1995–2006
August 2008
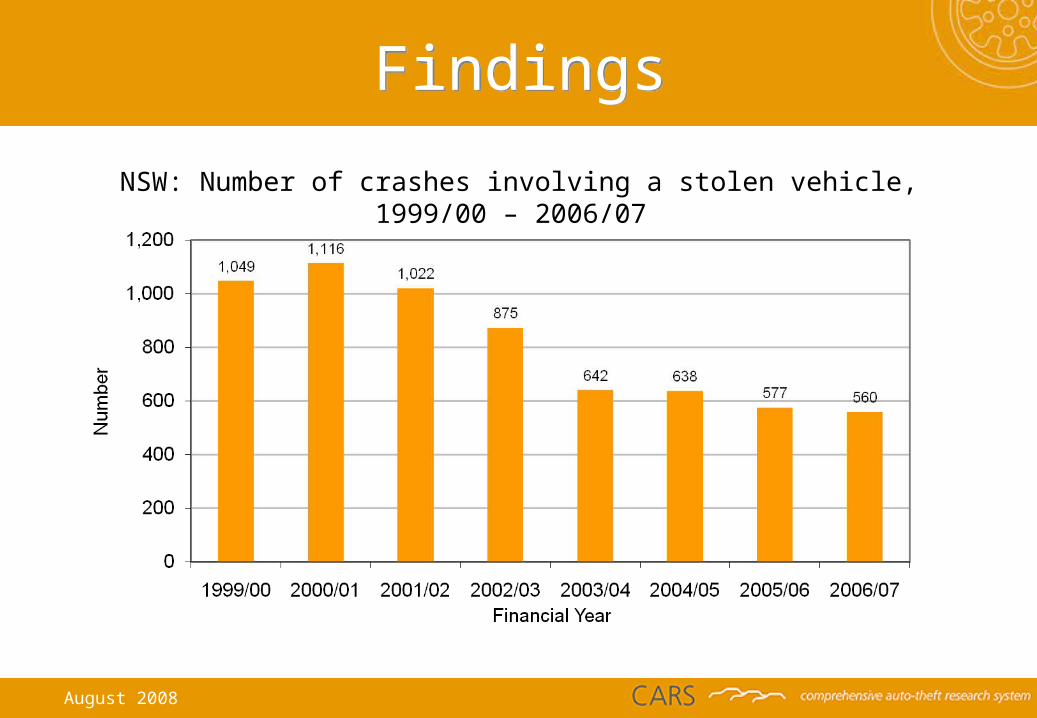
FindingsFindings
NSW: Number of crashes involving a stolen vehicle, 1999/00 – 2006/07
August 2008
FindingsFindings
NSW: Crash severity rating of road crashes over the 8-year period, 1990/00 – 2006/07
August 2008
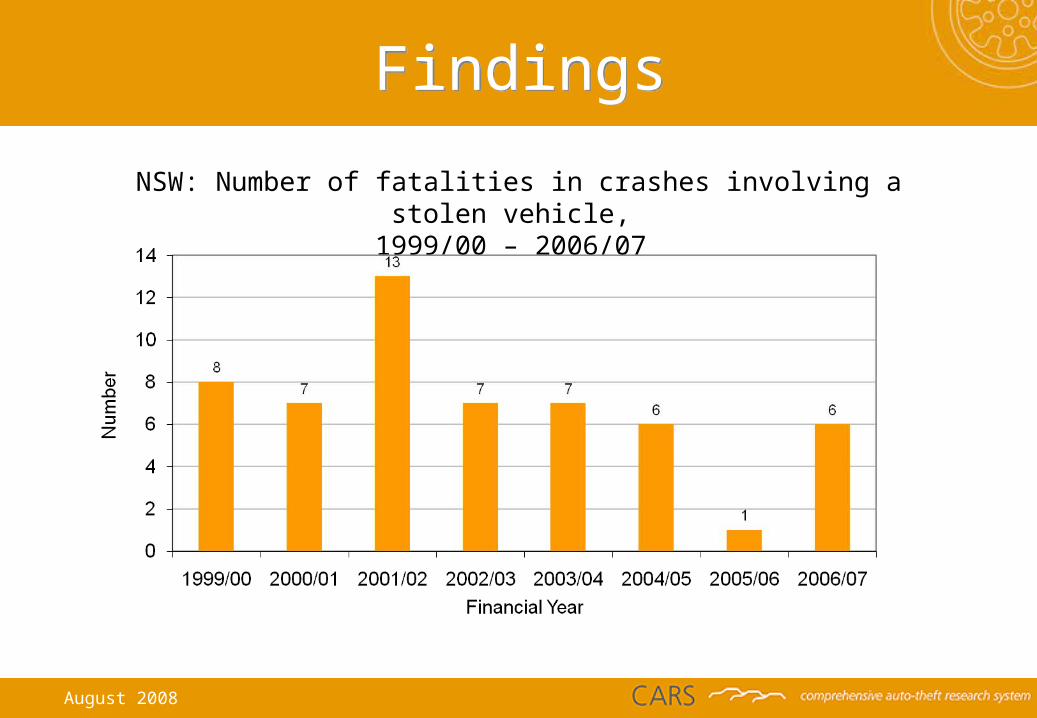
FindingsFindings
NSW: Number of fatalities in crashes involving a stolen vehicle, 1999/00 – 2006/07
August 2008
FindingsFindings
SA: Number of fatalities in crashes involving a stolen vehicle, 1995 – 2006
August 2008
FindingsFindings
NSW: Number of injuries in crashes involving a stolen vehicle, 1999/2000 – 2006/07
August 2008
FindingsFindings
SA: Number of injuries in accidents involving a stolen vehicle, 1995 – 2006
August 2008
NSW: Objects first hit by the key vehicle in road crashes, 2006/07
FindingsFindings
PropertyCrash involving
MVTCrash not
involving MVT
Vehicle, bicycle or pedestrian 48% 77%
Guard rail or fence 16% 6%
Trees or bushes 11% 5%
Pole, post, building etc. 14% 5%
Other fixed objects 6% 3%
August 2008
FindingsFindings
PropertyCrash involving
MVTCrash not
involving MVT
Vehicle, bicycle or pedestrian 48% 77%
Guard rail or fence 16% 6%
Trees or bushes 11% 5%
Pole, post, building etc. 14% 5%
Other fixed objects 6% 3%
NSW: Objects first hit by the key vehicle in road crashes, 2006/07
August 2008
SA: Types of property damaged in crashes involving a motor vehicle at fault, 2006
FindingsFindings
Property Stolen MV at fault MV at fault
Motor Vehicle 32% 78%
Property - Other 29% 9%
Property – Pole/sign post 20% 5%
Tree 16% 5%
Property – Bridge/guard rail 2% 1%
Pedestrian 1% 1%
Cycle 0% 2%
August 2008
FindingsFindings
Property Stolen MV at fault MV at fault
Motor Vehicle 32% 78%
Property - Other 29% 9%
Property – Pole/sign post 20% 5%
Tree 16% 5%
Property – Bridge/guard rail 2% 1%
Pedestrian 1% 1%
Cycle 0% 2%
SA: Types of property damaged in crashes involving a motor vehicle at fault, 2006
August 2008
FindingsFindings
SA: Total estimated property damage cost of crashes involving stolen vehicles, 1995 – 2006
August 2008
FindingsFindings
South Australia:
• Includes human, vehicle and general costs.
• Calculated using 2004 data
• Average $51,500 per crash = $17 million per yearReference: Baldock and McLean (2005)
Total cost estimates
New South Wales
• Includes human, vehicle and general costs.
• Calculated using 2003 data
• Average $53,600 per crash = $44 million per year
Reference: Connelly and Supangan (2006)
August 2008
FindingsFindings
PropertyStolen MV in
crash
MV in crashes not involving vehicle
theft
Excessive speed 38% 16%
Fatigued 27% 8%
Controller error (loss of control)
27% 11%
Vehicle skidding, sliding or aqua-planning
11% 11%
Distraction 6% 10%
NSW: Involvement of controller factors in road crashes, 2006/07
The driver of the stolen vehicle was considered to be at fault in 95% of cases.
August 2008
FindingsFindings
Property Stolen MV at fault MV at fault
Inattention 64% 45%
Dangerous driving 9% <1%
Excessive speed 9% 1%
Fail to give way 2% 12%
Reverse without due care 2% 5%
Follow too closely 2% 8%
Fail to stand 1% 7%
SA: Top causes of crashes for motor vehicles at fault, 2006
The driver of the stolen vehicle was considered to be at fault in 97% of cases.
August 2008
FindingsFindings
NSW: Time of day for road crashes, 2006/07
August 2008
FindingsFindings
NSW: Distance between centroids of theft and crash suburbs, 2006/07
August 2008
FindingsFindings
NSW: Motor vehicles by decade of manufacture, 2006/07
August 2008
FindingsFindings
SA: Motor vehicles by decade of manufacture, 2006
August 2008
• Vehicle theft makes a small but significant contribution to the number of crashes on Australian roads each year – now approximately 1.2% to 1.4% of crashes. This equates to 560 crashes per year in NSW and 272 in South Australia (most recent 12-month period).
• Over the past 8 years, there have been 75 fatalities and 2,397 injuries in two states resulting from crashes involving vehicle theft.
• Total estimated costs of these crashes are $44 million in New South Wales and $17 million in South Australia annually.
• Crashes involving stolen vehicles are less likely to be serious crashes involving fatalities and injuries, but clearly serious harm does occur.
SummarySummary
August 2008
• Crashes involving vehicle theft were more likely to occur at night and to collide with fixed objects which may indicate inexperienced (unlicensed?) drivers.
• Crashes involving stolen vehicles were more likely to involve speed, driver fatigue and dangerous driving meaning considerable risk for other road users.
• Crashes tend to occur within a few kilometres of the location they were stolen from and within hours of being stolen.
• Stolen vehicles involved in crashes are likely to be older model vehicles lacking a range of modern security and safety features.
SummarySummary
August 2008
ImplicationsImplications
• Vehicle theft is not a minor crime and can have very serious outcomes.
• Targeting and reducing vehicle theft helps achieve the important goal of reducing the number of deaths and injuries on our roads.
• Because many crashes occur close to the theft in terms of both time and distance, preventing the crash after the vehicle is stolen may not be an option – better to prevent the theft in the first place.
• Older vehicles are popular theft targets and making them harder targets reduces their risk of being stolen and then involved in a crash.
August 2008
• Immobilise older vehicles
• Education
• Diversionary programs
Policy implicationsPolicy implications
August 2008
Questions or comments?
Sophie Ransom
Senior Research Officer, National CARS ProjectEmail: [email protected]