Page 1
Title: Oracle BAM for REAL TIME Reporting
Version 1.0 September 8, 2008
Introduction
Oracle BAM is a real time reporting tool. Most of you might be well aware of but for those who know less about it, this would be a good
introduction.
What fascinates me about BAM is not only its ability to deliver reports at
Real Time but also alert Business people when they need them most.
This Document covers some of the technical aspects of BAM, which leads to creating a BAM Dashboard.
Agenda for Discussion
• BAM Basics
• Report Planning • Report Creation – BAM Architect
• Report Creation – BAM Studio • Dashboard Creation
• Tips and Tricks BAM Basics
To understand working of BAM some important concepts and terminologies must be understood like
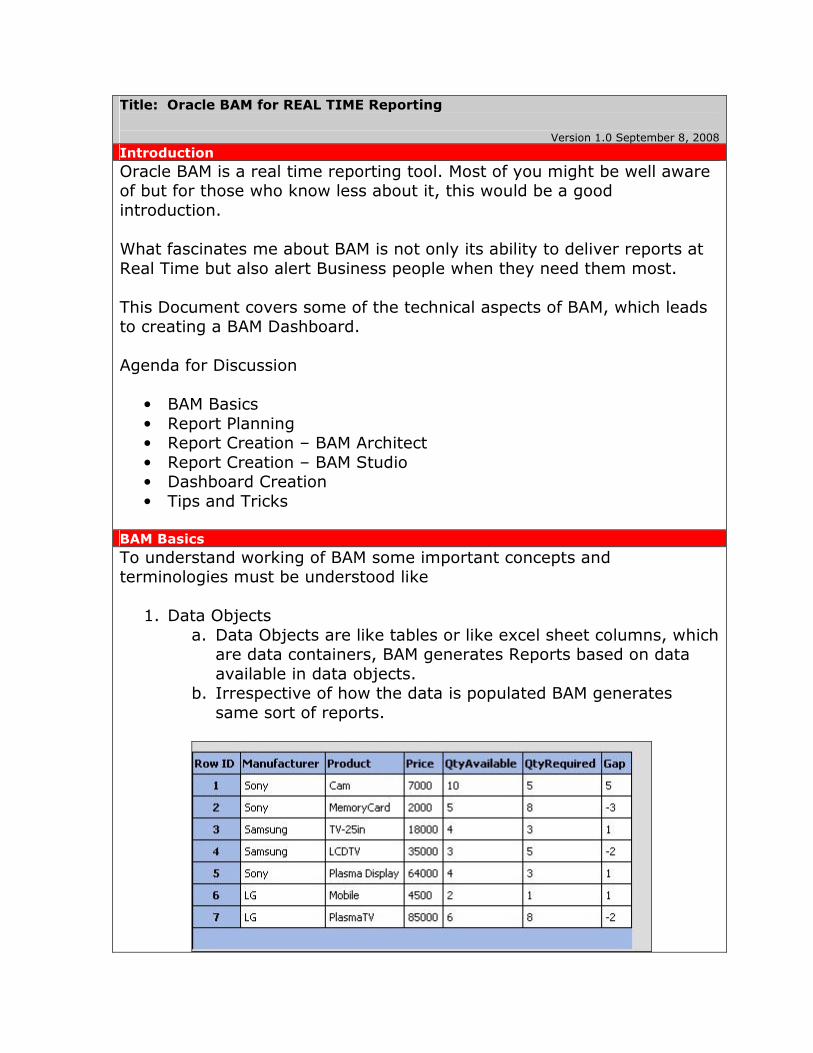
1. Data Objects
a. Data Objects are like tables or like excel sheet columns, which are data containers, BAM generates Reports based on data
available in data objects. b. Irrespective of how the data is populated BAM generates
same sort of reports.
Page 2
2. BAM Console a. It is a web based tool which consists of Active Viewer, Active
Studio, Architect and Designer b. View helps one to view reports in full screen with some
default report buttons such as re-prompt, print etc c. Active Studio is a report building Utility
d. Architect helps in designing of Data Objects and Alerts e. Administrator helps in Plan Monitoring besides some other
house keeping Admin works.
3. Plan
a. Plan is a heart of BAM running of Plan ensures that DATA is real time and planned. For instance data in a database table is
read and populates Data Object. b. Plan Plans are created using BAM Design Studio which is a
Desktop based GUI and is not a web tool. c. Plans can be set to active or sleep mode through BAM console
Page 3
4. Alert
a. If stock is less than 5 send mail to purchase officer, wow that’s a rule backed by an Alert, BAM helps you achieve that
Page 4
5. Dashboard
a. Place to display one or more reports within a framework, that
is one can develop multiple reports and display in a tabbed view within the Dashboard.
6. Reports a. Place to show case data in various graphical forms like Pie
Char, Stacked Bar Graph, Bar Graph, 3 D pie char, Tabular Data etc..
7. BPEL / JMS Sensors a. There are so many ways to populate data with in data object
some of them include sending data from a BPEL Process using BPEL Sensor, or populating data into JMS Queue and reading
from JMS using JMS Sensor. b. Others can be using database tables / views to populate BAM
Data Objects
Page 5
Report Planning
Use Case: Let us take an example store named “ACME Corp” which sells
electronic equipments, the Management not only needs to know what are
the stock level with respect to various company products but also they want to know their re-order level, that is current stock versus current
requirement, they want all this in real time.
In real time we mean every time a product is sold, the current stock level
must be displayed and help setting up necessary rules in case new order needs to be placed by the Management.
We need to start by planning a data object which can hold the data to deliver the Reports needs
Remember: Data Object is not database table, so don’t try to use
Normalizing Principles or DB Design principles here.
So my data object would consist of
1. Manufacturer Name - String 2. Product Name - String
3. Product Selling Price - Number
4. Quantity Available - Number 5. Quantity Required - Number
6. Gap (Calculated Field = Quantity Available - Quantity Required)
Report Types
1. Bar Graph to Indicate Gap v/s Products 2. Pie Chart to Indicate Manufacturers v/s Products
3. Stacked Bar to Indicate Qty Available v/s Qty Required 4. Tabular Data of All Products consisting of Product Data Object
5. Drill Down on any Product to get complete Data Object of that Product.
Report Creation – BAM Architect
To begin Report Creation
1. Ensure that Oracle XE Database Services are Running as this would be needed to start some of the BAM Services, else BAM simply
refuses to start. 2. Start BAM from Start Menu
Page 6
3. Open the BAM console Start page from the web browser
4. Click on BAM Architect to create a data object named
“ProductCatalog”
Page 7
5. The Layout looks like this
6. Populate Data into data object and save. Note that calculated fields
get populated automatically based on calculation criteria.
Page 8
Report Creation – BAM Studio
Lets Create Reports from Data Object now,
7. Click on Create New Report button, select the right kind of report if it’s a single report having one header n footer or two columns etc
8. We select the first one at extreme left and top, and select Chart type (eg. Bar Chart, Pie Chart )
Page 9
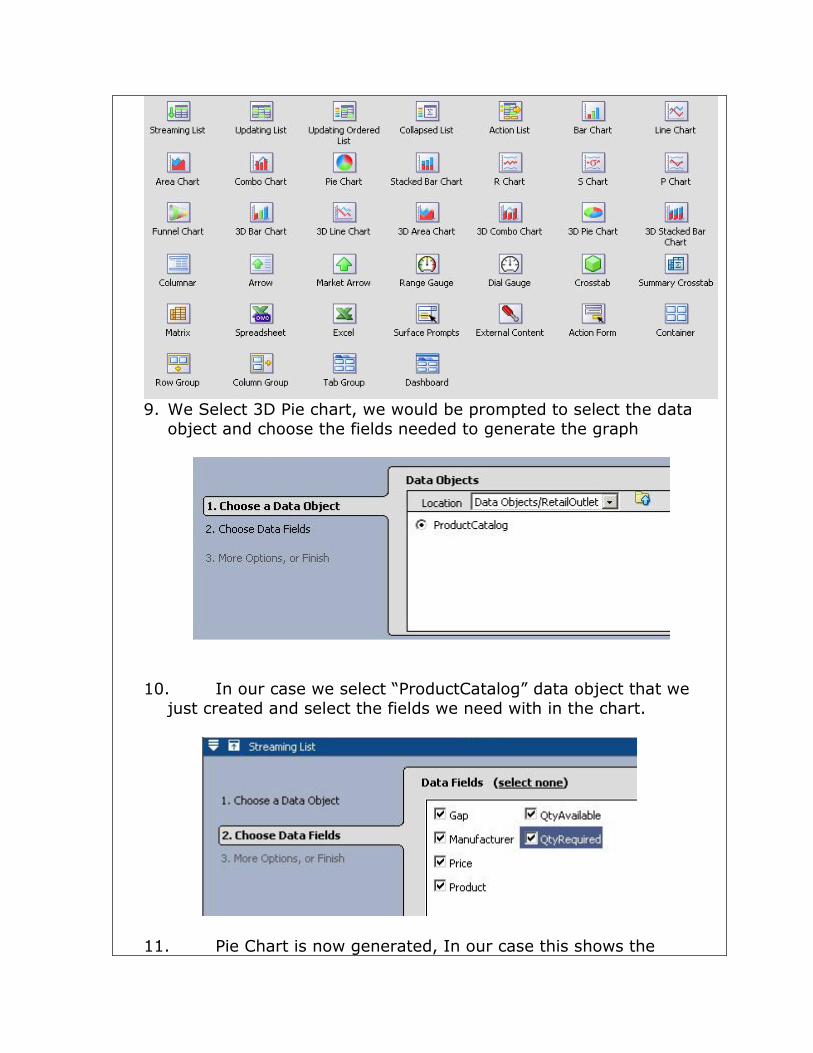
9. We Select 3D Pie chart, we would be prompted to select the data
object and choose the fields needed to generate the graph
10. In our case we select “ProductCatalog” data object that we
just created and select the fields we need with in the chart.
11. Pie Chart is now generated, In our case this shows the
Page 10
Quantity of Products available versus Manufacturer Names
12. One can choose the skin of char, title, font size, display text etc
13. One can also set formulas or group by any column as shown
below
14. We could as well add a view in the same report which can be of type 3 D Bar Chart
Page 11
15. The Above Report View Shows Products v/s Gap that is do we have excess of the given products or we are running shortage of
requirement 16. We could also have tabular display of data as shown below
17. Once we are done with the complete Report and its various views, this report can be opened inside a report viewer.
Page 12
Report Creation – BAM Viewer
Dashboard is an Extension of BAM Reports, which allows multiple reports to be viewed in a Tabbed Pane with in the Dashboard.
Report Creation – BAM Alerts
BAM Data is real time, that is one does not see cached data, what ever is there in data object that’s what is seen
BAM Alerts help to send mails or alert messages to any stakeholder so
that the person takes appropriate action.
Page 13
For example the above alert sends a mail to a configured mail id when the
number of days remaining to complete an activity is less than or equal to
5, we can also send report links to the mail recipient.