20


0
50
100
150
200
N D J F M A M J J A S O
Guest nights (000)
Hawke's Bay RTO Area Monthly Guest Nights
2012/13 2013/14 2014/15
Source: Statistics New Zealand

-20
-10
0
10
20
30
N D J F M A M J J A S O
Percent
Hawke's Bay RTO Area Monthly Guest NightsChange from same month of previous year
2013/14 2014/15
Source: Statistics New Zealand

850
900
950
1,000
1,050O
ct-10
Jan-1
1
Apr-
11
Jul-11
Oct-11
Jan-1
2
Apr-
12
Jul-12
Oct-12
Jan-1
3
Apr-
13
Jul-13
Oct-13
Jan-1
4
Apr-
14
Jul-14
Oct-14
Jan-1
5
Apr-
15
Jul-15
Oct-15
Guest nights (000)
Year ended
Hawke's Bay RTO Area Annual Guest Nights
Source: Statistics New Zealand
-10
-5
0
5
10
Oct-10
Jan-1
1
Apr-
11
Jul-11
Oct-11
Jan-1
2
Apr-
12
Jul-12
Oct-12
Jan-1
3
Apr-
13
Jul-13
Oct-13
Jan-1
4
Apr-
14
Jul-14
Oct-14
Jan-1
5
Apr-
15
Jul-15
Oct-15
Percent
Year ended
Hawke's Bay RTO Area Annual Guest NightsChange from previous year
Source: Statistics New Zealand

Hawke’s Bay Accommodation Variables
By accommodation type Monthly and year ended(1)(2)
2014 2015 October 2014 October 2015
Total guest nights 75,867 79,423 4.7 946,290 1,022,818 8.1
International 17,389 18,651 7.3 234,913 272,985 16.2
Domestic 58,479 60,772 3.9 711,378 749,833 5.4
Hotels 12,384 13,764 11.1 141,438 150,896 6.7
Motels/apartments 40,910 42,049 2.8 502,812 536,936 6.8
Backpackers 10,195 10,513 3.1 118,131 137,742 16.6
Holiday parks 12,379 13,097 5.8 183,909 197,244 7.3
Hotels 44.7 58.9 31.9 45.9 49.8 8.4
Motels/apartments 53.4 55.0 3.0 51.1 55.5 8.5
Backpackers 36.6 34.3 -6.1 36.9 39.5 6.9
Holiday parks 11.0 14.0 27.0 13.3 14.9 12.2
Total 32.3 35.5 9.9 32.9 35.9 8.9
Total excluding holiday parks (4) 46.5 49.1 5.6 46.0 49.4 7.5
Hotels 1.62 1.78 10.1 1.63 1.82 11.7
Motels/apartments 1.81 1.93 6.4 1.95 1.99 1.8
Backpackers 4.23 4.26 0.8 4.91 4.91 0.0
Holiday parks 2.21 2.21 -0.1 2.35 2.41 2.7
Total 1.98 2.09 5.6 2.12 2.21 4.3
Hotels 7,638 7,714 1.0 86,696 82,810 -4.5
Motels/apartments 22,598 21,824 -3.4 257,752 270,298 4.9
Backpackers 2,410 2,465 2.3 24,066 28,054 16.6
Holiday parks 5,590 5,917 5.9 78,395 81,838 4.4
Total 38,236 37,921 -0.8 446,910 463,000 3.6
Hotels 17 15 -11.8 17 15 -11.8
Motels/apartments 78 76 -2.6 78 76 -2.6
Backpackers 18 19 5.6 18 19 5.6
Holiday parks 20 21 5.0 20 21 5.0
Total 133 131 -1.5 133 131 -1.5
Hotels 16,585 15,655 -5.6 192,473 189,779 -1.4
Motels/apartments 42,191 41,478 -1.7 513,209 493,724 -3.8
Backpackers 25,978 26,784 3.1 294,018 311,274 5.9
Holiday parks 56,575 53,165 -6.0 662,151 641,484 -3.1
Total 141,329 137,082 -3.0 1,661,851 1,636,261 -1.5
Guest arrivals
Establishments
Symbol:
C confidential
(1) Reclassif ications, new businesses, ceased businesses, and temporary closures may affect f igures.
(2) Irregular events, such as airshow s and Easter, may affect percentage changes and other f igures.
(3) Occupancy rates are calculated as the ratio of used stay-unit nights to available stay-unit nights.
(4) Holiday parks often have high capacity and can mislead w hen included in total occupancy rates.
(5) Average length of stay is calculated as the ratio of guest nights to guest arrivals.
(6) Capacity is calculated as the number of available stay-units multiplied by the number of days in the month.
Capacity(6)
Accommodation type
Monthly Annual
October Percentage
change
Year ended Percentage
change
Guest nights
Occupancy rates (3) (%)
Average length of stay(5)

0
20
40
60
80
100
120
Oct-14
Nov-
14
Dec-
14
Jan-1
5
Feb
-15
Mar-
15
Apr-
15
May-
15
Jun-1
5
Jul-15
Aug-1
5
Sep-1
5
Oct-15
Guest nights (000)
Hawke's Bay RTO Area Monthly Guest NightsBy origin of guest
Domestic International
Source: Statistics New Zealand

Hawke’s Bay and New Zealand Monthly Guest Nights
By origin of guest
Domestic International Domestic International
Month
2014 Oct 58,479 17,389 75,867 1,736,258 1,017,048 2,753,305
Nov 54,940 27,606 82,547 1,611,536 1,359,683 2,971,219
Dec 76,981 32,098 109,079 2,035,783 1,592,452 3,628,236
2015 Jan 110,775 34,221 144,996 2,833,714 1,732,236 4,565,950
Feb 72,398 35,145 107,543 1,900,787 1,803,851 3,704,638
Mar 81,621 35,119 116,740 1,927,366 1,624,619 3,551,985
Apr 70,961 31,543 102,504 1,877,594 1,246,428 3,124,021
May 49,975 15,356 65,331 1,463,648 874,729 2,338,377
Jun 39,562 11,538 51,099 1,241,206 691,988 1,933,195
Jul 45,479 11,406 56,885 1,597,300 869,716 2,467,016
Aug 38,962 9,603 48,565 1,473,688 827,051 2,300,740
Sep 47,407 10,701 58,107 1,588,557 887,062 2,475,619
Oct 60,772 18,651 79,423 1,772,303 1,061,184 2,833,487
3.9 7.3 4.7 2.1 4.3 2.9
Year ended
October 2014 711,378 234,913 946,290 20,593,430 13,609,241 34,202,669
October 2015 749,833 272,985 1,022,818 21,323,483 14,571,000 35,894,483
5.4 16.2 8.1 3.5 7.1 4.9
(1) Regional tourism organisation
Percent change from the current month of the previous year
Percent change from previous year
Haw ke's Bay RTO(1) area New Zealand
Origin of guest
Total
Origin of guest
Total

Hawke’s Bay and New Zealand Guest Nights
By accommodation type Monthly and year ended
2013 2014 2015 2013 to 2014 2014 to 2015
Hotels 13,178 12,384 13,764 -6.0 11.1
Motels 44,176 40,910 42,049 -7.4 2.8
Backpackers 9,033 10,195 10,513 12.9 3.1
Holiday parks 13,172 12,379 13,097 -6.0 5.8
Total 79,559 75,867 79,423 -4.6 4.7
Hotels 960,727 1,041,532 1,072,634 8.4 3.0
Motels 887,005 912,705 928,148 2.9 1.7
Backpackers 335,365 374,677 388,397 11.7 3.7
Holiday parks 382,540 424,392 444,307 10.9 4.7
Total 2,565,637 2,753,305 2,833,487 7.3 2.9
Hotels 154,099 141,438 150,896 -8.2 6.7
Motels 489,335 502,812 536,936 2.8 6.8
Backpackers 114,731 118,131 137,742 3.0 16.6
Holiday parks 203,391 183,909 197,244 -9.6 7.3
Total 961,556 946,290 1,022,818 -1.6 8.1
Hotels 11,342,733 12,007,195 12,716,852 5.9 5.9
Motels 10,517,458 10,915,714 11,364,114 3.8 4.1
Backpackers 4,312,954 4,725,534 4,917,320 9.6 4.1
Holiday parks 6,251,930 6,554,226 6,896,196 4.8 5.2
Total 32,425,075 34,202,669 35,894,483 5.5 4.9
Hawke's Bay RTO area
New Zealand
October month
Hawke's Bay RTO area
New Zealand
Year ended October
Accommodation
type
Total guest nights Percentage change

Regional Tourism Organisation Areas’ Monthly Guest Nights
By origin of guest
2014 2015
Percent
age
change
2014 2015
Percent
age
change
2014 2015
Percent
age
change
Northland 74,636 78,589 5.3 45,186 45,326 0.3 119,823 123,915 3.4
Auckland 352,920 342,646 -2.9 245,722 249,327 1.5 598,642 591,973 -1.1
Coromandel 33,213 37,778 13.7 18,145 17,575 -3.1 51,358 55,353 7.8
Waikato 83,420 83,993 0.7 21,683 25,676 18.4 105,103 109,669 4.3
Bay of Plenty 63,296 66,070 4.4 19,493 22,106 13.4 82,788 88,176 6.5
Rotorua 94,791 93,704 -1.1 73,997 77,610 4.9 168,789 171,313 1.5
Taupo 59,477 62,561 5.2 21,941 19,723 -10.1 81,418 82,284 1.1
Whakatane-
Kaw erau 13,628 13,896 2.0 2,278 2,183 -4.2 15,906 16,079 1.1
Gisborne 19,072 20,860 9.4 3,601 3,385 -6.0 22,673 24,246 6.9
Taranaki 38,498 42,707 10.9 5,507 5,295 -3.9 44,005 48,002 9.1
Haw ke's Bay 58,479 60,772 3.9 17,389 18,651 7.3 75,867 79,423 4.7
Ruapehu 20,950 23,602 12.7 9,279 10,950 18.0 30,228 34,552 14.3
Manaw atu 42,575 41,171 -3.3 4,146 3,295 -20.5 46,721 44,466 -4.8
Whanganui 13,805 10,627 -23.0 2,352 2,215 -5.8 16,157 12,842 -20.5
Wairarapa 13,205 14,256 8.0 1,618 1,930 19.3 14,823 16,187 9.2
Kapiti-Horow henua 17,878 17,130 -4.2 1,536 1,649 7.4 19,414 18,779 -3.3
Wellington 154,130 171,213 11.1 71,002 63,477 -10.6 225,132 234,690 4.2
Marlborough 29,011 30,243 4.2 19,806 18,670 -5.7 48,817 48,912 0.2
Nelson-Tasman 47,480 53,674 13.0 24,914 27,244 9.4 72,394 80,918 11.8
Canterbury 167,391 168,634 0.7 112,293 115,700 3.0 279,684 284,335 1.7
Hurunui 23,179 23,655 2.1 5,790 6,134 5.9 28,969 29,789 2.8
Mackenzie 12,459 17,391 39.6 27,505 32,599 18.5 39,964 49,990 25.1
Timaru 22,738 21,657 -4.8 4,930 3,785 -23.2 27,668 25,442 -8.0
West Coast 47,429 44,343 -6.5 45,147 50,253 11.3 92,576 94,596 2.2
Wanaka 17,604 18,881 7.3 22,423 24,178 7.8 40,027 43,059 7.6
Queenstow n 76,283 85,336 11.9 131,067 147,390 12.5 207,350 232,726 12.2
Waitaki 16,524 18,579 12.4 6,812 8,733 28.2 23,336 27,312 17.0
Central Otago 16,426 13,870 -15.6 2,536 2,577 1.6 18,962 16,447 -13.3
Dunedin 61,868 52,404 -15.3 20,828 22,080 6.0 82,696 74,484 -9.9
Clutha 3,496 3,848 10.1 1,312 1,165 -11.2 4,808 5,013 4.3
Fiordland 12,105 11,107 -8.2 19,988 21,178 6.0 32,093 32,285 0.6
Southland 28,291 27,104 -4.2 6,825 9,125 33.7 35,116 36,229 3.2
Total 1,736,258 1,772,303 2.1 1,017,048 1,061,184 4.3 2,753,305 2,833,487 2.9
RTO area
October guest nights
Domestic International Total
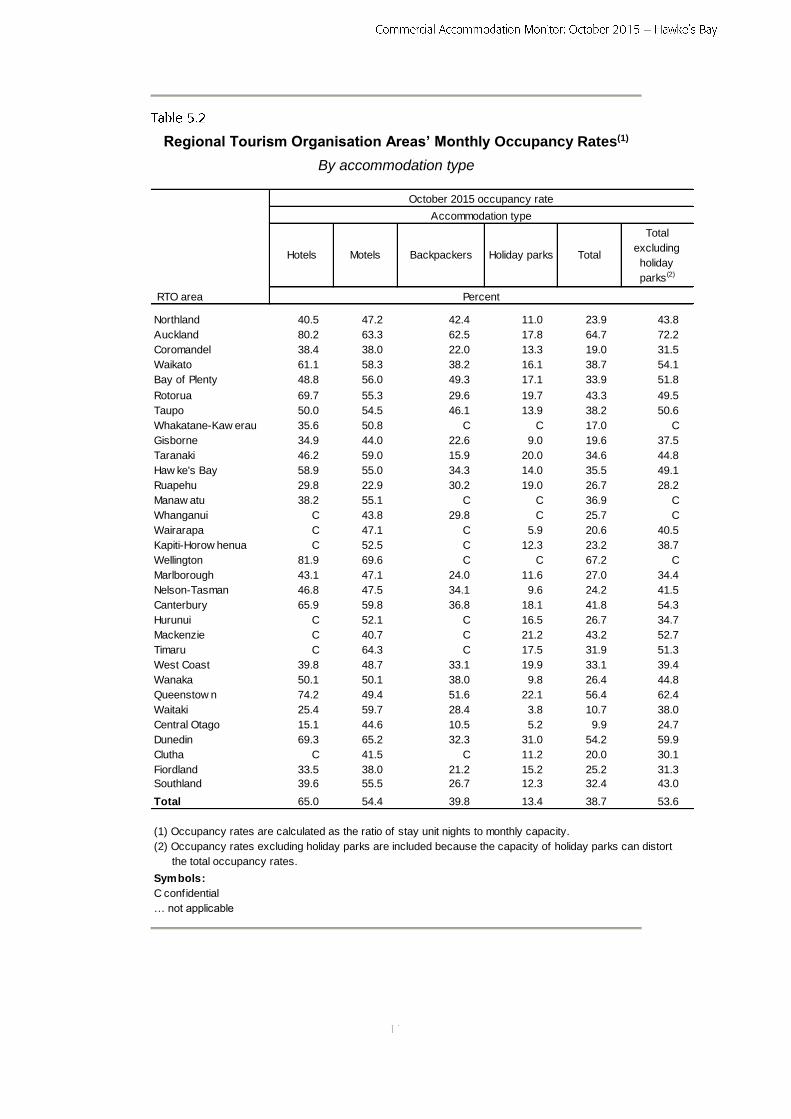
Regional Tourism Organisation Areas’ Monthly Occupancy Rates(1)
By accommodation type
Hotels Motels Backpackers Holiday parks Total
Total
excluding
holiday
parks(2)
Northland 40.5 47.2 42.4 11.0 23.9 43.8
Auckland 80.2 63.3 62.5 17.8 64.7 72.2
Coromandel 38.4 38.0 22.0 13.3 19.0 31.5
Waikato 61.1 58.3 38.2 16.1 38.7 54.1
Bay of Plenty 48.8 56.0 49.3 17.1 33.9 51.8
Rotorua 69.7 55.3 29.6 19.7 43.3 49.5
Taupo 50.0 54.5 46.1 13.9 38.2 50.6
Whakatane-Kaw erau 35.6 50.8 C C 17.0 C
Gisborne 34.9 44.0 22.6 9.0 19.6 37.5
Taranaki 46.2 59.0 15.9 20.0 34.6 44.8
Haw ke's Bay 58.9 55.0 34.3 14.0 35.5 49.1
Ruapehu 29.8 22.9 30.2 19.0 26.7 28.2
Manaw atu 38.2 55.1 C C 36.9 C
Whanganui C 43.8 29.8 C 25.7 C
Wairarapa C 47.1 C 5.9 20.6 40.5
Kapiti-Horow henua C 52.5 C 12.3 23.2 38.7
Wellington 81.9 69.6 C C 67.2 C
Marlborough 43.1 47.1 24.0 11.6 27.0 34.4
Nelson-Tasman 46.8 47.5 34.1 9.6 24.2 41.5
Canterbury 65.9 59.8 36.8 18.1 41.8 54.3
Hurunui C 52.1 C 16.5 26.7 34.7
Mackenzie C 40.7 C 21.2 43.2 52.7
Timaru C 64.3 C 17.5 31.9 51.3
West Coast 39.8 48.7 33.1 19.9 33.1 39.4
Wanaka 50.1 50.1 38.0 9.8 26.4 44.8
Queenstow n 74.2 49.4 51.6 22.1 56.4 62.4
Waitaki 25.4 59.7 28.4 3.8 10.7 38.0
Central Otago 15.1 44.6 10.5 5.2 9.9 24.7
Dunedin 69.3 65.2 32.3 31.0 54.2 59.9
Clutha C 41.5 C 11.2 20.0 30.1
Fiordland 33.5 38.0 21.2 15.2 25.2 31.3
Southland 39.6 55.5 26.7 12.3 32.4 43.0
Total 65.0 54.4 39.8 13.4 38.7 53.6
Symbols:
C confidential
… not applicable
(1) Occupancy rates are calculated as the ratio of stay unit nights to monthly capacity.
(2) Occupancy rates excluding holiday parks are included because the capacity of holiday parks can distort
the total occupancy rates.
RTO area
October 2015 occupancy rate
Accommodation type
Percent

Local Authority and Hawke’s Bay Accommodation Results(1)
Establish-
ments Capacity
Guest
Nights
Average stay
length
Occupancy
rate
Days Percent
Hotels 2 2,480 C C C
Motels 37 16,399 15,871 2.09 53.03
Backpackers 7 9,827 3,068 C 29.42
Holiday parks 10 19,189 C C C
Total 56 47,895 25,002 2.21 30.97
Hotels 8 11,253 11,240 1.76 68.93
Motels 34 22,723 24,374 1.86 56.83
Backpackers 10 16,523 C C C
Holiday parks 5 16,585 C C C
Total 57 67,084 48,610 2.09 45.36
Hotels 5 1,922 C C C
Motels 5 2,356 1,804 1.63 50.38
Backpackers 2 434 C C C
Holiday parks 6 17,391 2,994 1.77 9.17
Total 18 22,103 5,810 1.72 15.42
Hotels 15 15,655 13,764 1.78 58.91
Motels 76 41,478 42,049 1.93 54.96
Backpackers 19 26,784 10,513 4.26 34.34
Holiday parks 21 53,165 13,097 2.21 14.01
Total 131 137,082 79,423 2.09 35.50
Symbol:
C confidential
… not applicable
Accommodation type
October 2015 results
Number
Hastings District
Napier City
Hawke's Bay Regional Tourism Organisation area
(1) The Accommodation Survey is designed at the regional (RTO by accommodation type) level
to meet data quality standards. Care should therefore be taken w ith data at the local
authority level.
Wairoa and Central Hawke's Bay Districts


