1
TITLE PAGE
THE INCIDENCE OF BRAND LOYALTY AMONG
CONSUMERS’ OF CEREAL FOODS
(A CASE STUDY OF PHINOMAR FOODS ENUGU)
BY
UDE FESTUS NWABUEZE
PG/MBA/08/47438
DEPARTMENT OF MARKETING
FACULTY OF BUSINESS ADMINISTRATION
UNIVERSITY OF NIGERIA, ENUGU CAMPUS
SUPERVISOR: DR. I.C NWAIZUGBO
MARCH, 2010.
2
CERTIFICATION
This is to certify that this project was carried out by UDE
FESTUS NWABUEZE with registration number PG/MBA/08/47438
in the department of Marketing, faculty of Business Administration,
University of Nigeria, Enugu Campus.
This research work is an embodiment of original work
and has not be Submitted in partial or in full for any degree of this or
other University.
SINGED:
-----------------------------
DR. I.C. Nwaizugbo ---------------------------
(Project Supervisor) Date
DR. (Mrs.) G.E. Ugwuonah ----------------------------
(Head of Department) Date
4
ACKNOWLEDGEMENTS
My unalloyed gratitude- goes to God, my creator, for His abundant
grace in my life. My special thanks to my supervisor, Dr. I.C.
Nwaizugbo for his academic guidance and patience with me until the
completion of this work. I appreciate your kindness Sir. My appreciation
also goes to Professor Uche Modum; Dean of the faculty of Business
Administration, University of Nigeria, Enugu Campus and the H.O.D.
Department of marketing, UNEC Dr. (Mrs.) G.E. Ugwuonah. I will not
fail to thank my lecturers among who are Professor Julius O. Onah,
Professor Ike Nwosu, Professor (Mrs.) Nnolim, and Professor E.U.I.
Imaga. Dr. Mrs. Nnabuko, Dr. Ewurum, Dr. E.K. Agboeze, Dr.
Onwumere, Dr. Joseph I. Uduji, Chief J. A Eze, Mrs. G. Okpala, Mr.
S.N. Kodjo, Mrs. R.G. Okafor, Mr. C.B. Achison and others who were
all good to me in my academic pursuit. God bless you all.
I sincerely acknowledge the understanding and support of
my lovely wife; Obiageli, my mother Ogo .I also appreciate my children
and my colleagues in the office. May his banner be over us. Of course. I
cannot forget some of my course mate and friends whose
encouragement in one way or the other has kept me going in school.
Among whom are Mr. Leonard, Clement, Yusuf, Linus and many
others. Thank you all.
UDE FESTUS NWABUEZE.
5
ABSTRACT
This research was concerned with the incident of Brand loyalty among
the
consumer of cereal foods in Enugu metropolis, using Phinomar Foods in
Enugu as case study.
Given the background of the problems the study sought to know the
existence and extent of brand loyalty among consumers of cereal foods,
to determine the influence of prices of the products on brand loyalty,
whether consumers perception of the attributes of the cereal foods
influence brand loyalty for particular brands and such attributes includes
thing as taste, Milk content sugar content dissolvability and nutritional
value and finally to ascertain the extent company image and brand name
influence brand loyalty. All the same, this study was restricted to six
popular brands namely; Cornflakes, Golden morn Soy pops, Cocopops,
White oat and Fruit Fiber.
6
Further, among the objectives and significance of study was to
investigate the existence of brands loyalty among consumers of cereal
foods and to find possible solutions to the problems identified.
This work was accomplished through the use of questionnaire oral
interview, revision of previous work by different authors and the use of
Top man’s formula to determine the sample size (288) and analyzed the
findings by the use of Z-test method. At the end of the work it was
discovered that consumers are to a reasonal extent loyal to particular
brand, price, quality, products attributes, company’s brand name and
image exert a significant influence on the loyalty of consumers. Also
consumers have basic expectations in their favorite brands and are not
naïve as advertisers would want us to believe. The orders of importance
of the attributes to consumers are as follows: Nutritional value, Milk
content, Taste Dissolvability and Sugar content. Based on the findings it
was recommended that companies should focus on product quality and
integrated marketing communication (IMC) on popular already existing
brand names in the market. This will help sustainability of consumers’
loyalty.
7
TABLE OF CONTENTS
Title Page: - - - - - - - - i
Certification: - - - - - - - ii
Dedication: - - - - - - - - iii
Acknowledgements: - - - - - - iv
Abstract: - - - - - - - - vii
CHAPTER ONE
1.0 Introduction: - - - - - - - 1
1.1 Background of study: - - - - - 1
1.2 Statement of problem: - - - - - 4
1.3 Objectives of the study: - - - - - 6
1.4 Research questions: - - - - - - 7
1.5 Hypothesis: - - - - - - - 8
1.6 Scope of the study: - - - - - - 9
1.7 Significance of the study: - - - - - 10
1.8 Limitations: - - - - - - - 11
1.9 Operational definition of Terms: - - - - 11
References
8
CHAPTER TWO
Literature Review
2.0 Review of Related Literature: - - - - 14
2.1 Purchase decision making: A choice not change- - 14
2.2 Habit purchase and Brand loyalty: - - - 19
2.3 Models of Consumer Behavior and: - - - 23
consumer learning
2.3.1 The Marshallian (Economic) Model: - - - 24
2.3.2 The Pavlovian (Learning) Model: - - - - 25
2.3.3 The ferudian (Psychoanalytic) Model: - - - 28
2.3.4 Contingency Approach: - - - - - 29
2.4.5 Theoretical Framework: - - - - - 30
References
CHAPTER THREE
Methodology
3.1 Research design: - - - - - - 34
3.2 Source of data collection: - - - - - 34
3.2.1 The primary source: - - - - - 34
3.2.2 The secondary source: - - - - - 35
9
3.3 Research Instruments: - - - - - 35
3.4 Population and simple size determination: - - 35
3.4.1 Population: - - - - - - - 35
3.4.2 Determination of simple size: - - - - 36
CHAPTER FOUR
4.1 Method of Distribution: - - - - - 39
4.2 Presentation Analysis: - - - - - 57
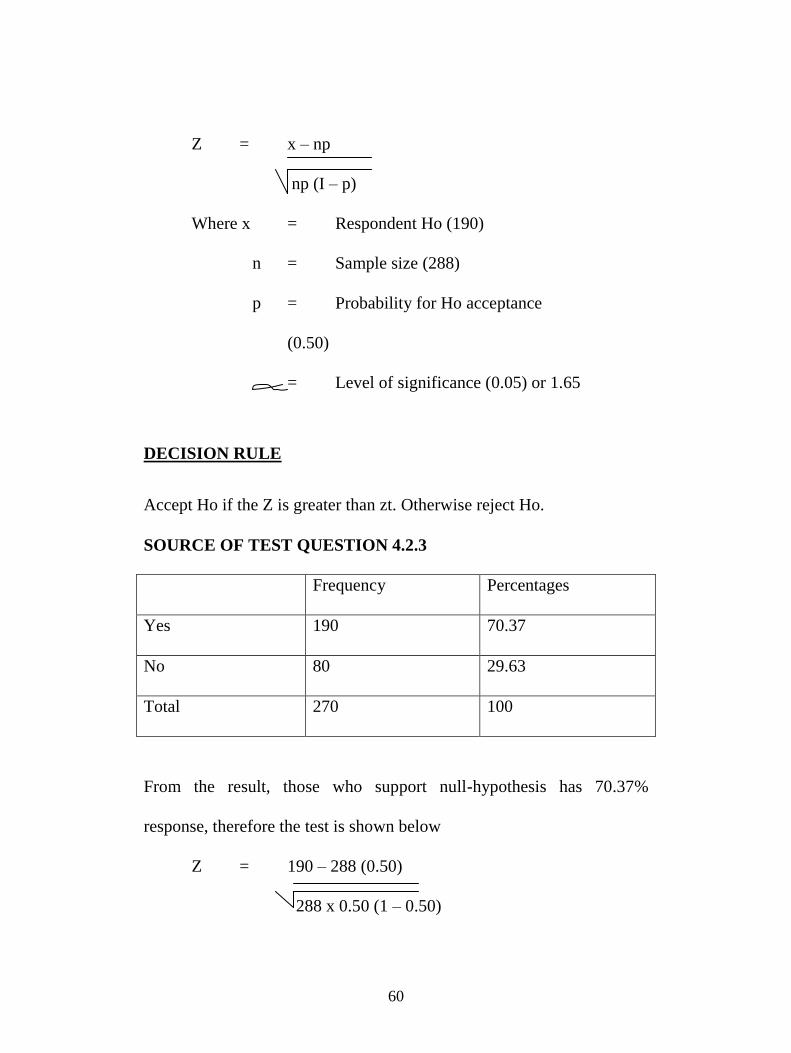
4.3 Test of Hypothesis: - - - - - - 50
CHAPTER FIVE
Summary of Findings, Conclusion and Recommendation
5.1 Summary of Findings: - - - - - 59
5.2 Conclusion: - - - - - - - 60
5.3 Recommendation: - - - - - - 61
Bibliography
Appendix
Questionnaire
CHAPTER ONE
10
INTRODUCTION
1.1 BACKGROUND OF STUDY
Human behaviour is enormously varied and very complex and is
predicted on attitude, learning and habit. Consumers learn from past
experience and future behaviour is conditioned by such learning.
Marketers, the world over differ considerably in their prediction of
human behaviour.
The whole marketing effort is generally centered on the consumers. This
is implied in the marketing concept echoed by most markets which is
consumer satisfaction at a profit as the basis for successful marketing. In
their varied description of consumers as Theodore Levit (1960) puts it,
some people described consumers as unpredictable, varied, fickle,
stupid, shortsighted, stubborn and generally bothersome.
This does not however, in any way make the consumers less important.
Therefore the consumer is still of utmost consideration in the planning
of the marketing mix or any other marketing effort. Product branding is
one of such marketing effort. Products are branded for many reasons,
one of which is identification of the products. Today most of the
11
products are purchased under some particular brand. This contrast with
what obtained when products were once considered simply as
commodities in the early days of marketing. Commodities or goods are
differentiated only by their uses and not by their suppliers. Today’s
marketers recognize that the total product is greater than simply the
physical good itself and believe that all goods and service can be
distinguished by their own unique qualities.
A products brand carries good deal of information, reducing or
eliminating the need to find out about a product before buying it.
Consumers confronted with a familiars brand have information about the
products images as promoted by the company. Even products that are
very similar are now considered distinguishable by brand. Consumer’s
perceptions of different brands of various product categories determine
to a large extent their buying pattern. However O’Shaughnessy, John
(1988) comments on the above claim that “different brands bought at
different times could reflect different occasions, temporary changes in
taste or family or wants rather than picking from a repertoire of brands
with indifference as to which brand is bought. Complete acceptance of
what O’shaushnessy advanced is accepting that their is no brand loyalty.
12
If indeed, there is no brand loyalty, in the buying pattern of consumers,
then one of the main purpose of branding is defeated.
Other researchers are of the view that consumers gain experience in
purchasing and consuming products, they learn what brands they like
and do not like and the features they like most in particular brands. The
consumers adjust purchase behaviors based on past experience. The
existence of brand loyalty among consumers of a product or non-
existence of it thereof could depend on the extent of consumers covered,
the product under consideration and the approach employed in the
search for this important consideration is product marketing.
This study seeks to find out the existence or non existence of brand
loyalty among the consumer of cereal foods. The researcher is aware of
the fact that brand loyalty is an exhibition of consumer’s attitude to
products which is some what difficult to measure. However it is
believed that just as David Relbstein (1985) puts it, the buying pattern of
the product, and the proportion of purchase a particular brand bought are
indications of brand loyalty.
1.2 STATEMENT OF PROBLEM
13
The cereal foods industry in the country is experiencing a continuous
increase in the number of brands competing for consumers income.
From the record of importation of white oat, fruit and fiber in the early
sixties as the only food cereals in the country, there has been a continual
increase in the number of cereal foods in the country. Today there are no
less than six different brands of cereal foods available in the market.
In those early days the beverage market was the seller’s market. Initially
it was white oat is the leading brand. But because it was imported as a
wholly finished product, it lost its position to corn flakes following the
ban placed on the importation of beverages at the beginning of the
Nigeria Civil war in 1967.
Corn flakes, the product of NASCO foods Nigeria PLC, dominated the
market for a long time. Consumers were multiplying, buying more of
the brand. However, more firms have continued to enter the market with
local plants each producing different brands of instant cereal foods. It is
therefore unrealistic for any company to rest on a mere assumption of
market leadership without considering the changing market share.
14
In today’s factored market place, things like branding products and
markets share for instance no longer guarantee loyal customer. In one
case after another, the old established brands have been supplemented
by the rise of other brands. No single company can claim largest share
of any product market in a competitive environment. These days, the
idea of market share is a trap that can lull business people into a false
sense of security. Managers should wake up every morning uncertain
about the market place because it is invariably changing.
Companies should however not be caught in the excitement of selling
things just to increase their market share. As Regis Mckenna (1991) puts
its, the real goal of marketing is to own the market, not just to make or
sell products. Smart marketing means defining what of the whole pie is
yours. This is not just an issue of defining your market share. The
company should rather be sure what share of the market is loyal to their
product(s). Stopping at the idea of market share “turns marketing into an
expensive fight over crumbs rather than a smart effort to own the whole
pie.
Owning the market demands some responsibilities such as bringing into
your camp third parties who want to develop their own products, or offer
15
new features or add-ons to argument your product. You get the first look
at new ideas that others are testing in the market, you attract the most
talented people because of your acknowledge leadership position.
This is why it has become necessary to investigate the existence or
otherwise of brand loyalty among the consumers of cereal foods drink in
Enugu metropolis.
1.3 OBJECTIVES OF THE STUDY
The research is basically directed towards the investigation of an
existence of brand loyalty among consumers of cereal foods. To this
end, therefore, the objectives of the study are to seek and possibly find
solutions to the problems identified above, the extent and basis of
consumer loyalty.
1. To determine the existence and extent of brand loyalty among
consumers of cereal foods drinks.
2. To determine the influence of price of the products on brand
loyalty.
3. To determine the extent consumers perception of the attributes of
the cereal food drinks influence brand loyalty for particular
brands. Attributes includes such things are:
16
(i) Taste
(ii) Milk content
(iii) Sugar content
(iv) Dissolvability
(v) Nutritional value
4. To ascertain the extent company image and brand name influence
brand loyalty.
1.4 RESEARCH QUESTIONS
Based on the research objectives, we shall face with the following
questions:
1. Does the consumer of cereal foods drink in Enugu metropolis
loyal to particular brands?
2. To what extent does price of the brands influence loyalty to a
particular brand?
3. Does consumers’ perception of attributes or quality of the brands
influence loyalty?
4. What roles does company image and brand name play in the
promotion of loyalty to particular brands?
1.5 HYPOTHESIS
17
The rationale behind this research was to determine the existence of
brand loyalty among consumers of cereal foods in Enugu metropolis.
For this reason, therefore the following hypotheses were made.
1. Ho: Cereal foods consumers are loyal to particular brands.
Hi: Consumers of cereal foods are not loyal to particular
brands.
2. Ho: Price is an important influence in the choice product brand
loyalty.
Hi: price is not an important influence in the choice product
brand loyalty
3. Ho: Company image and brand name contribute significantly
to consumers’ loyalty to particular brands.
Hi: Company image and brand name do not contribute
significantly to consumers’ loyalty to particular brands.
4. Ho: Consumers perceptions of the quality of the food drinks
have significant impact on brand loyalty.
Hi: Consumers perceptions of the quality of the food drinks
have no significant impact on brand loyalty.
1.6 SCOPE OF THE STUDY
18
This study is restricted to Enugu metropolis in Enugu State of Nigeria.
The surrounding cities are (Uwani, Abakpa, Coal Camp, Achara-Layout,
Awkunanaw, Trans Ekulu, Independent-Layout and Iva Valley). The
rational was that Enugu was the capital of the defunct Eastern Region
which accounted for a substantial population of the food drink market in
Nigeria. Now the capital of Enugu State it is still very populous because
its cosmopolitan nature.
This strategic position of Enugu Metropolis in Eastern Nigeria is a fair
basis for moderate generalizations of the findings of this study for the
Nigeria cereal foods market. Nevertheless, brands of cereal food drinks
covered include:
1. Corn Flakes
2. Golden mourn
3. Soy pops
4. Coco pops
5. White (quicker) oats
6. Fruit & Fiber.
1.7 SIGNIFICANCE OF THE STUDY
The percentage of consumers of cereal foods continues to drop as the
economy becomes tougher and general financial melt down continue to
19
increase the poor performance of companies. Brand loyalty therefore
becomes important in the managerial areas of marketing mix and market
research. This study will therefore be of immense significance to firms
in the industry in the area of manipulation of their market share, price
changes of products, investment in research and development and
improvement on the quality of the products.
The various positions of the brands in the perception of the consumers
will emerge and enable them to assess their relative position as leaders,
followers and niches in the industry.
The study will also be of great benefit to the advertising agencies, the
print and electronic media whose input in the promotion of those
products depends so much in the market position of the product.
Also to benefit from this study are companies seeking to introduce new
products. With the identification of existence of brand loyalty or not
among consumers and the factors contributing to it, the company can
now find out a suitable unique selling proposition (USP) to use and
appeal to their desired target market. This will also enable them decide
whether to enter the market competing with the leaders, challengers, or
be a follower or even niches in the industry.
20
Finally the study will also be of great benefit to distributors and retailers
who will be opportune to know the popular brands by the consumer’s
assessment and take advantage of it in stocking their inventory.
1.8 LIMITATIONS
This study is restricted to Enugu metropolis and since brands loyalty is
an attitude and behavioral measurement, the findings cannot be
generalized to other environments which might be influenced by other
factors in their environment.
The researcher also will choose the samples for the survey on the
assumption that the brand choice of the cereal foods purchased were
made by such respondent.
1.9 OPERATIONAL DEFINITION OF TERMS
(A) CEREAL FOODS:
These are all members of the monocotyledonous family grain
crops such as maize, wheat barley, rice, oats, rye and sorghum.
(B) METROPOLIS:
Major or chief city of a state or country in other words a capital.
(C) COSMOPOLITAN:
21
From many part of the world.
(D) CONSUMERS:
These are people who make use of the product directly.
(E) BRAND:
A term use to differentiate or identify a product from the same
product class.
(F) BRAND Loyalty
This implies continuous patronage or consummation of a
particular product all the time. It gives sellers some protection
from competition and greater control planning their marketing
mix.
(G) CITY
This implies a concentration of people in a geographic area who
can support themselves from the city’s economic activities on a
fairly permanent basis.
REFERENCES
Adrika E.O et al (2001) Principles and Practice of Marketing 2nd
Ed.
(John Jacob’s classic Publisher LTD. Enugu.
22
David J. Rubsterin (1985) “Marketing Concepts, Strategies and
Decisions, (Englewood cliffs, prentice Hall Inc.) pp 284 – 285.
John Oshaughnessy (1988). Competitive Marketing 2nd
Edition,
(London: Bridles Ltd Guilford and King Lyn) P.109
Reges Mickenna (1991), Marketing is everything Harvard Business
Review (Pager back no. 90087) P.8
Theodore Levit (1960), Marketing myopia, Harvard Business Review
(July-August) p.60.
23
CHAPTER TWO
2.0 REVIEW OF RELATED LITERATURE
2.1 PURCHASE DECISION MAKING: A CHOICE NOT
CHANGE
A lot of marketing efforts over the years are channeled towards
unraveling of what goes on in the buyers black box. Researchers have
explored factors that determine the choice of a particular information
processing strategy. Prominent among them Rowlay J, Daves (2000)
proposed that the eventual strategy employed is upon characteristics of
the consumer, the market place, the social environment and the physical
environment. Though they vary in details, there are five stages which
consistently occur; problem recognition, information search, evaluation
of alternative/brand evaluation, purchase decision and post purchase
behaviour. Henry Assael (1993, p.25-42) outlined the details of the
processes the consumer passes through at each stage. The first stage of
the traditional decision model in the need arousal stage and this
describes the consumers state of mind which in the ‘psychological set’
toward the prospective purchase. Consumer’s psychological set is based
on the product benefit and his attitude towards the various brands.
24
The hierarchy of effects model of decision making shows that the
consumer goes through sequential stages involving ‘thinking’ (belief)
feelings (evaluation) and ‘action’ (the intention to buy the brand). Also
important in the buyers psychological set is the benefit criteria. This is
important in deciding which brand to buy. Depending on the product
class, there are various attributes which consumers conceive important.
For example in;
Beer – Taste, alcohol content and price, foaming, price,
Toot paste- Taste, foaming, price, dental protection, (fluoride content)
and colour.
Powered milk – dissolvability, taste, price, conge ability.
Cereal food drink – milk and sugar content, dissolvability nutritive
value, taste and price. Non-alcoholic soft drink – Taste, price, brand
name.
Need recognition produces the consumer to embark on information
search and this involves exposure, Organisation and search for
information. Consumer information search varies directly with the
extent of consumer involvement and the consumers attention to the
marketing stimuli-which has to receive attention, be comprehended and
25
retained in memory to be able to affect consumers psychological set.
The consumer first recognizes the whole information and chooses the
one related to his particular need. The message having been understood
is interpreted to agree with their beliefs. However the consumer chooses
to retain only those things that are considered important to him in the
need satisfaction. There may or may not be any need for further
information search. Brand evaluation is a direct consequence of
information search. Various brands are associated with different benefit
criteria and consumers will choose brands considered to offer those
benefit. The consumer evaluates the brands based on his/her priority of
desired benefits and relates the brand characteristics to these benefits.
The outcome of brand evaluation is the intention to buy. The final
sequence in the complex decision making model is purchasing the
intended brand, evaluating the brand consumption and storing this
information in the psychological set.
The extent of cognitive effort expended in the decision making process
depends on the level of involvement of the product. According to Assael
(1993), high involvement products are those that are important to the
consumers, products that are “closely tied to the consumers, ego and self
26
image” and involve some reasonable amount of risk to the consumer.
Low involvement purchase is one where the consumer does not consider
the product sufficiently important to his / her belief system and does not
strongly identify with the product. Most purchase decision is low in
consumer involvement and as such does not involve cognitive effort in
making a choice of the brands.
One cannot say yet if cereal foods are low involvement or high
involvement product. But because only a small portion of income is
expended on them and because there seem to be little functional
differences in the brands the indication is that it may not be high
involvement product. The study by Benett, R. and Rundle Thiele, S.
(2005) reveal that consumers level of involvement with a product
depends no t just on risk of wrong choice, amount of income spent or
even uncertainly about the product but also on product importance to the
particular consumer, interest, value and emotions. The above line of
thought therefore implies that it may not only be the proportion of
income or risk that classifies a product as low or high involvement one
but other things such as interest and emotion could play vital roles.
Product involvement could be situational or enduring depending on the
27
emotional attachment of the consumer to the product. Both situational
and enduring involvements are likely to result in complex decision
making. This is why Celis and Oslon (1988) argue that emphasis should
be on the product itself and the inherent satisfaction, its usage rather
than on some situational goals. Thus cereal foods can by all implication
be a high involvement product for some families, but whether it is low
or high is level of involvement; emotional attachment and interest can
still lead to a complex decision making process. This is true for most
product categories.
Finally, the ‘valence’ refers to the preference for attaining one outcome
over another. Thus valence implies that there exist for the individual
consumer, a meaningful preference hierarchy. The argument though is
that this may not apply to low involvement products earlier discussed.
The controversy of involvement not withstanding, there is no doubt that
before making a choice of a particular brand from alternatives brands,
the aroused consumer becomes alert to or sometimes actively searches
for information bearing on his need and its gratification.
28
2.2 HABIT PURCHASE AND BRAND LOYALTY
Habit purchase in repeat purchase of a product due to consumer
learning. According into Assael (1993) habit purchase is the opposite of
complex purchase decision making. In his opinion a consumer finds
little need for evaluating brand alternatives and prior satisfaction with a
brand leads to repeat purchases. Oslon however believes the contrary
about the level of decision making involved in habit purchase. He
opined that even when little consideration is given to other brands,
cognitive activity must occur; decisions have to be made about where
and when to purchase the product, some knowledge of the product and
its availability must be activated from memory. The implication of this
therefore is that no purchase decision is really a chance.
Several authors differ in their opinion of consumer’s exhibition of habit
purchases. These authors describe the habit purchase patterns as brand
loyalty, or brand commitment. Assael defines brand loyalty as repeat
purchase/buying because of commitment to a certain brand. There has to
be a level of commitment for a consumer to be brand royal. Inertia on
the other hand is developed habit purchase due to consumer passive
learning especially for low involvement products as developed by
29
Krugman. In a simple illustration using mortion salt, the author
describes a consumer response to the salt advertisement initially, as the
consumer is exposed to the advertisement there is no evaluation of the
advertisement since the consumer is not highly involved. However,
overtime, due to repeated exposure, the consumer begins to associate
some pieces of information picked up casually and stored in the
information set with the salt. The consumer may therefore repeatedly
buy mortion salt not because of commitment to be brand royal but were
familiarity and acceptance.
Another author, described “Brand loyalty as the biased (i.e. non random)
behavioural response is purchase expressed overtime by some decision
making unit with respect to one or more alternative brand out of a set, of
such brand and includes a strong positive attitude toward the brand.
Brand commitment on the other hand is defined “as
emotion/psychological attachment to a brand within a product class. The
author considers Brand royalty more of repeat purchase behaviour and
different from brand commitment. This contrasts with Assael’s approach
of considering brand commitment as a basic ingredient of brand loyalty.
In this study however, the researcher is focusing on brands loyalty as a
30
combination of brand commitment and /or inertia leading to repeat
purchase behaviour.
Another important consideration is the question of whether brand loyalty
is a behavioural and/or attitudinal concept. The behavioural theorists
believe that brand loyalty is repeat purchase behaviour with or without
commitment. Some other authors like London (1993) et al Peter Oslon
and Leon Schiffman (2000) et al agree that brand loyalty is summarily
described by repeat purchase behaviour. Repeat purchase behaviour is
assumed to reflect reinforcement and a strong stimulus – to – response
link. These researchers take the approach that uses probalistic models of
consumer learning to estimate the probability of a consumer buying the
same brand again given a number of past purchases of that brand.
However, what people do, does not say anything about why they dos it.
This is why the cognitive learning theorists believe that repeat purchase
and frequency of purchase or even proportion of total purchases lack
precision since they do not distinguish between real brand loyal buyer
who is intentionally faithful and the spurious buyer who repeats a brand
purchase because it is the only one available or affordable.
31
The argument of the cognitive approach to brand loyalty is that mere
repeat purchase can not be synonymous with consumers who are
emotionally committed to a product. Day recognizes that consumers
might continue to buy the same brand because other brands are not
readily available, or a brand offers a long series of price deals, or the
consumer wants to minimize decisions making. In a study where
behavioural measures alone were used in predicting brand loyalty, over
70% of the sample would have been defined as brand loyal, but adding
the attitudinal component reduced the proportion of brand loyal
consumers to less than 50%.
Assael still argues that the measurement of brand loyalty based on past
behaviour may be misleading. In his example, the consumer may buy
one brand of soypops for personal consumption, another brand for the
spouse and occasionally a third higher priced brand to have around the
house for quests. This consumer may be highly loyal to the preferred
brand but this is a multidimensional concept that must incorporate the
consumer commitment to the brand. The very term loyalty implies
commitment rather than just repetitive behaviour which suggest that
there is need for a cognitive as well as a behavioural concepts. Even
32
behavioural theorists of brand loyalty concedes that there is a need for
attitudinal measure. This is clearly seen in O’Shaughnessy’s argument
on measuring brand loyalty. The appropriate description includes both
behavioural and attitudinal views. This is therefore the line of thought
and basis of this study.
2.3 MODELS OF CONSUMER BEHAVIOUR AND
CONSUMER LEARNING
Consumer behaviour can be defined as those acts of individuals directly
involved in obtaining and using economic goods and services including
the decision process that precede and determined these act or as the
buying habits or patterns of behaviour of consuming public either in
general or in specific groups. Brand loyalty an aspect linked to some
behavioural models and learning theories. A closer look at the concepts
and marketing implications of these consumer behavioural models and
learning theories will shade some light of Understanding developing and
sustaining brand loyalty.
Kotter (1991) has identified five behavioral models for analyzing buyers
namely;
33
The Marchallian (Economic) model, the Pavlovlan (Learning) model,
the Freudian (psycho-analytic) model, the Veblenian (Social
psychological) model and the Hobbessian – (Organisation factor) model.
Only the models considered relevant to the concept of brand loyalty will
be discussed.
2.3.1 THE MARSHALLIAN (ECONOMIC) MODEL
This model proposes that purchasing decisions are the results of largely
rational and conscious economic calculations. The consumer seeks to
spend his income on those goods and services that will deliver the
greatest utility according to his taste and relative prices. This he does by
carefully calculating and weighing the expected pains and pleasures of
every contemplated action. Thus he is always trying to maximize
satisfaction with his limited resources. The factors that influence the
consumer therefore are likely to be price, income and durability. And
obvious deduction from this model is that a man faced with two brands
of instant cereal foods which are identical in all respect would definitely
buy the cheaper brand. This consumer can only buy the brand that costs
more if and only if the later has any attribute or quality which justifies
the extra expenditure on it. This is purely an economic consideration and
34
does not take into recognition any other psychological variable which
may motivate the consumer to buy the more costly brand even when
their perceived attributes are the same.
Some assumptions from this model include.
1. The lower the price, the higher the sales and vice versa.
2. The lower the price of a substitute A, the lower the sales of B
and vice versa. However, economic considerations alone
cannot explain the behaviour of the consumer.
The assumption from this model implies that an increase in price will
lead to a fall in sales. This is not always the case and this is why the
model is criticized for ignoring the fundamental questions of how
product preferences are formed. The other mysteries involved in
consumer choice and not taken into consideration rather.
2.3.2 THE PAVLOVIAN (LEARNING) MODEL
This model which comprises of classical and instrumental conditioning
was pioneered by Pavlov, a Russian psychologist who performed
experiments on dogs. The model is based on the conditioned reactions of
dogs to bells rang before they were fed. A variant of classical
35
conditioning was instrumental conditioning by B.F. Skinner who
introduced an aversive stimuli of electric shocks to the food bell
response of the dog. Both Parlov and skinner concluded that learning is
an associative process based on four learning concepts.
a) Drives: Motives or Needs: These refer to strong internal
stimuli or dissatisfaction to the individual which impels action
b) Cues: These are weaker stimuli in the environment and/or in
the individual which determine when, where and how the
subject reacts. For example, a food drink advertisement can
serve as a are because it stimulates the thirst drive in a
housewife. But her response will depend on this cue and other
cues-time of day and cues intensity.
c) Response: This is the persons reaction to the configuration of
cues. It depends on the degree to which the experience is
rewarding that is drive reducing.
d) Reinforcement: If the experience is rewarding, a particular
response is reinforced or strengthened, and there is a tendency
for it to be repeated when the same configuration of cues
appear again. Otherwise, the response is not reinforced and
36
the strength of the habit diminished and may be extinguished
eventually.
He therefore hypothesized that the consumer does not have to
be rational in all his purchase decisions. There is rather a
greater tendency for the consumer to purchase by habit. This
is a direct contrast of the Marshallean model of the economic
rational man.
There are many marketing implications of this model. There
is a need for strong cues (such as free samples, advertisement)
in the food drink market and other such products where
competition is keen. However, sufficient product quality is
necessary to serve as reinforcement and to build up habit in
the consumers. Firms introducing new brands can as well
identify those cues that have helped in building up such brand
preferences since consumers are likely to transfer allegiance
to similar brands.
Again the model provides justification for repeat advertising
to generate repeat purchase and fight dissonance. It also
provides useful guidelines to advertising practitioner and copy
writers by helping to identify product drives that must be
37
emphasized. In food drinks for instance, drives like “vitality
and thirst” may be suggested as strong related drives.
2.3.3 THE FREUDIAN (PSYCHOANALYTIC) MODEL
Sigmund Freud, based on his study on child behaviour,
hypothesized that a child enters the world with instrumental needs that
cannot be satisfied by the immediate environment. According to him,
the mind consists of three parts namely.
1. The Id- houses the basic instruction drives, most of them, anti,
social.
2. The Ego-a conscious, rational control centre that maintains a
balance between the uninhibited instincts of the Id and social
oriented super ego.
3. The super Ego-the conscious, accepts moral standards and
directs instinctive drives into acceptable channels.
The basic implication of the above model to marketing is that the real
motive of a consumer for buying a specific product or brand may well
be hidden. Manufacturer should provide enough social rationalizations
for product purchase and present brand appeals directed to the sub-
conscious, to the consumers’ dreams, hopes and fears.
38
2.3.4 A CONTINGENCY APPROACH
The above models clearly show that there is no single explanation for
certain consumer behaviour. In buying a product, the consumer seeks to
satisfy a variety of needs, psychological, social, physiological and even
spiritual needs. In any case the development of brand loyalty as a pattern
of consumer behaviour could arise from rational or irrational purchase
decisions.
It is possible that in one case a consumer purchase out of habit those
products perceived to posses the highest utility value based on his
limited resources. It is also possible that the consumers preference is a
complex function of the Lewinian dictum B = F (P, E), meaning that
behaviour is a function of the interruption of the person P with
environment E. The expectancy model’s implicit assumption of a value
structure as a description of P and a belief structure as an environmental
measure of E can no longer be accepted as adequate in explaining
consumer behaviour.
Other evidences now abound that there are significant influence of
psychological variables in the behavioural pattern of the consumers.
Therefore a cheaper understanding of consumer behaviour requires a
39
combination of both conscious rational hypothesis and the psychological
related hypothesis
2.4.5 THEORETICAL FRAMEWORK
Consumers will repeatedly buy what satisfies them. The satisfaction thus
obtained is reinforcement and increases the probability of repurchasing.
Thus habit purchasing pattern is developed. Most brands in different
product categories enjoy a degree of loyalty. This is not just buying due
to resignation. But could rather be associated with commitment and
prior satisfaction with the brand.
In the study by Blatterg identified for types of loyalty segment using
proportion of purchase.
1. High National Brand Loyal: These groups of consumers are
loyal to one brand. Over 90% of all purchases are developed
to this brand.
2. National Brand Loyal: These segments also are developed to
one brand but degree of loyalty is not as high as 90%.
3. Private Label Loyal: Consumers in this group are loyal to a
private label and most likely purchased from a particular
40
store. Hence private label loyal customers are also store loyal
consumers.
4. Last Purchase Loyal: These consumers buy one brand on
successive occasions and switches to another after which he
switches to yet another brand.
On the other hand George H. Brown (Kotler 2002), buyers can be
divided into four groups:
1. Hard Core Loyals: Always buy the same brand.
2. Split loyals: Loyal to two or three brands.
3. Shifting Loyals: Loyal to one brand for a period of time, but
easily shifting from one brand to another, due to certain
advantages offered by the new brand.
4. Switches: Show no loyalty to any brand, switching the brand
with almost any buying situation.
Both Blatterg, and Brown classification reflect behavioural measures
of loyalty. Such classifications as a matter of fact could leave us with
the conclusion that most consumers are loyal to a particular brand
even in this study of food drinks which is more appropriately
classified as a low involvement product.
41
REFERENCES
Benett, R. Rundle – Thiele, S. (2005). The Brand Loyalty Life Cycle
Implication for Markets, Journal of Brand Management Vol.12
No.4
Henry Assael (1993) Consumer Behaviour and Marketing Action. 4th
ed. Boston Kent pp 25-52
Kotler P. (1991), Marketing Management Analysis, Planning,
Implementation and Control 6th
ed. Englewood cliffs. N.J Prentice
Hall Inc. pp. 262- 263
Kotler P. (2002) Marketing Management, Melenium Edition, Prentice
Hall Inc. Upper Saddle River, New Jerssey
Kunde J. (2002) Unique Now or Never: the Brand is Company Driver
in the New Value Economy, Financial Time Prentice Hall London
Leon G. Schiffman and Leslie Lazar Kanuk (2002), Consumer
Behaviour 6th
ed. India Prentice Hall Inc. October p. 195
Richard Celsi and Jerry C. Oslon (1988) The Role of Involvement in
Attention and Comprehensive Process, Journal of Consumer
Research 15 September pp. 210-224
Rowley J. Daves (2000), Disloyalty. A Closer Look at
Non Loyal, Journal of Consumer Marketing Vol. 17 No.6.
43
CHAPTER THREE
METHODOLOGY
3.1 RESEARCH DESIGN
This chapter shows the systematic, formal, technical ways or steps
adopted by the researcher in his research work. It is an axiom that two
persons can research on a particular subject but view it from different
perspectives and approaches. Thus this research work involves the
qualitative and analysis from both the primary and secondary data.
3.2 SOURCES OF DATA COLLECTION
The source of data for this research work consists of both primary and
secondary.
3.2.1 THE PRIMARY SOURCE
This is data collected on non-existed information
or record. Infarct it is raw data.
44
3.2.2 THE SECONDARY SOURCE:
This is data from already existing events or written and recorded or
unpublished.
3.3 RESEARCH INSTRUMENTS
Major instruments used in this research work were questionnaires and
oral interview.
QUESTIONNAIRE: These were designed and administered for
purpose of conducting the research. The questionnaire was structured to
illicit information aimed at finding out brands of food drinks under
study. The questionnaires was concentrated on consumers in such areas
as Uwani, Abakpa, Coal Camp etc, that does not mean that
questionnaires were not administered to consumers outside these areas.
ORAL INTERVIEWS: Since it would have been unreliable for the
purpose of this work to design only a questionnaire as instrument of data
collection. Due to this reason, oral interview was also used.
3.4 POPULATION AND SIMPLE SIZE DETERMINATION
3.4.1 POPULATION
The targeted populations in Enugu metropolis include all adults who
take food drinks. This includes housewives, students, bachelors and
45
spinsters who play a definite role in the purchase of the food drinks
consumed in their homes.
3.4.2 DETERMINATION OF SAMPLE SIZE
The fact that the information for this research study is from Enugu
metropolis and the population is too large which cannot be exhaustive.
The researcher decided to adopt pilot survey to arrive at the sample size
for the consumers.
In pilot survey conducted by the researcher 20 questionnaires were
distributed and out of which 15 were correctly filled and returned hence
regard as positive response. The remaining 5 were not returned. This
gives 75% for the returned questionnaires and 25% for the rejected ones.
TO CALCULATE THE SAMPLE SIZE- TOPMAN’S
FORMULAR IS USED: -
n = Z2 Pq
E2
Where n = Sample size
z = Standard deviation for desired level of confidence
(1.96)
46
p = probability of positive response
q = probability of negative response
e = 5%, the limit of tolerable error
Therefore:
n = Z2 Pq
E2
n2 1.962
(.75 x .25)
0.052
= 3.8416 x .0.1875
0.0025
= 0.7203
0.0025
= 288.12
= 288
TEST TECHNIQUES
In testing the hypothesis in this research work zt method was used. This
enables the researcher to arrive at a significance result.
z = x - np
np (1 – p)
47
Where
x = Respondent Ho
n = sample size
l = Level of significance (5%)
p = probability for Ho acceptance (0.05)
Note level of significance = 0.05 or 1.65
48
CHAPTER FOUR
DATA ANALYSIS AND DISTRIBUTION
4.1 METHOD OF DISTRIBUTION ANALYSIS
The data being presented here were collected from primary source
through questionnaire.
A total of 288 copies consumer survey questionnaire were administered
in the field survey out of which 278 were returned representing a
response rate of 96.5%, while 10 representing. 3.5% did not return their
questionnaire. However out of the number of questionnaire returned 8
questionnaires representing 2.9% could not pass the validity test after
editing. This either because of non-completion or contradictory
information. Thus we were left with 270 valid questionnaire
representing a usage rate of 97.1%
49
TABLE 4.1
CONSUMERS QUESTIONRE DISTRIBUTION IN ENUGU
METROPOLIS.
PLACE CONSUMERS PERCENTAGES
Uwani 40 13.9
Abakpa 40 13.9
Coal Camp 35 12.2
Achara Layout 35 12.2
Awkunanaw 33 11.5
Trans Ekulu 40 13.9
Independent Layout 40 13.9
Iva Valley 25 8.7
Total 288 100
Source: Field survey 2009
Table 4.1 shows that out of 288 consumer questionnaire, 13.9% each
were distributed in the four cities (Uwani, Abakpa, Trans Ekulu,
Independent Layout), while 12.2% were distributed to consumers in
Coal Camp Achara layout respectively. However, 11.5% and 8.7% were
distributed to consumers in Awkunanw and Iva valley.
50
TABLE 4.1.2
RESPONDENT RATIO OF SURVEY QUESTIONNAIRE
Total No of Number PERCENTAGES
Questionnaires 288 100
Returned 278 96.5
Unreturned 10 3.5
Source: Field Survey 2009.
Table 4.1.2 shows the respondent questionnaire distributed, 96.5% out
of 100% questionnaire distributed were filled and returned.
TABLE 4.1.3
USAGE RATIO OF SURVEY QUESTIONNAIRE
Number PERCENTAGES
Accepted 270 97.1
Rejected 8 2.9
Total 278 100%
Source: Field Survey
Table 4.1.3 shows the usage ratios of survey questionnaire, 97.1% of the
questionnaire were accepted, while 2.9% were rejected.
51
4.2: PRESENTATION ANALYSIS
TABLE 4.2.1:
RESPONDENT WHO TAKE CEREAL FOODS IN THEIR
HOME.
Source: Survey 2009
The response of those who take cereal foods, (100%) of consumers
indicated that they take cereal foods in their home. This shows that this
item is virtually found in every home.
TABLE 4.2.2:
RESPONDENT STATUS IN THE FAMILY.
Status Frequency Percentages
Husband 60 22.22
Wife 100 37.04
Daughter/son 70 29.63
House help 30 11.11
Total 270 100
Source: Survey 2009
From table 4.2.2 above, the majority of the consumers were wives,
which represent (37.04%). Others in the family status were
Frequency Percentages
Yes 270 100
No - -
Total 270 100
52
Daughter/son (29.63%), the next were Husbands (22.22%), while
(11.11%) represents house help.
TABLE 4.2.3
RESPONDENT BRAND LOYAL/SWITCHERS OF CEREAL
FOODS?
Frequency Percentages
Yes 190 70:37
No 80 29.63
Total 270 100
Source: Survey 2009.
Table 4.2.3 shows that great number of consumers interviewed agreed
that they are brand loyal to a particular brand of cereal foods represents
(70:37%).Which means; there were consumers who were committed to
the consumption of a particular brand. However, (29.63%) could go to
the market or shops to purchase any brand that is affordable.
TABLE 4.2.4:
RESPONDENT BRAND PREFERENCES.
Brands Frequency Percentages
Corn Flakes 90 33.33
Golden morn 60 22.22
Soy pops 50 18.52
53
Coco pops 30 11.11
White Oat 20 7.41
Fruit & fiber 20 7.41
Total 270 100
Source: Survey 2009.
The above result on the brand consumers would preferably buy,
(33.33%) indicated cornflakes giving a large proportion of consumers of
cereal foods, the next is (22.22%) representing Golden morn and
(18.52%) for soy pops, (11.11%) preferred cocoa pops, (7.41%) each
represents white Oat and fruit-fiber.
TABLE 4.2.5
RESPONDENT WHO AT TIMES SWITCH TO OTHER BRANDS
Frequency Percentages
Yes 270 100
No - -
Total 270 100
Source: Survey 2009.
From table 4.2.5, the result shows that, (100%) of consumer could
switch to other brands of cereal foods.
54
TABLE 4.2.6:
REASONS RESPONDENT SWITCH BRAND SOMETIMES
Frequency Percentages
Price of the product 165 61.11
Lack of the product 70 25.93
Others 35 12.96
Total 270 100
Source: Survey 2009.
From table 4.2.6 above, the highest percentage among reasons
consumers switch brands is the product price which represents
(61.11%). This implies that most of the consumers were price sensitive
and this can influence them a lot. Other influences are non availability of
the brand (25.93%) and others (12.96%).
TABLE 4.2.7:
RESPONDENT CHOICE OF BRANDS AT EQUAL PRODUCT
PRICES
Brands Frequency Percentages
Corn Flakes 100 37.04
Golden morn 55 20.37
Soy pops 55 20.37
Coco pops 40 14.81
White Oat 15 5.56
Fruit & fiber 5 1.85
Total 270 100
Source: Survey 2009.
55
From the response on which brands they will buy if prices were the
same, (37.04%) of consumers indicated that they would buy cornflakes,
(20.37%) for Golden morn and soy pops respectively and for others
some indicated cocoa pop (14.81%) and white Oat (5.56%).
TABLE 4.2.8:
OBSERVED PERCEPTION OF RESPONDENT
Frequency Percentages
Yes 220 81.48
No 50 18.52
Total 270 100
Source: Survey 2009.
From the table 4.2.8, the consumers who said that their choice of cereal
foods depend on perceived attributes of the brand were (81.48%). But
for those who have no knowledge of product attributes as a result of
their level of literacy were (18.52%).
56
TABLE 4.2.9
RESPONDENT WHOSE CHOICE WERE INFLUENCED BY
CEREAL FOODS ATTRIBUTES
Attributes Frequency Percentages
Milk content 70 25.93
Taste 60 22.22
Sugar content 20 7.41
Dissolvability 30 11.11
Nutritional value 90 33.33
Total 270 100
Source: Survey 2009.
From the table above, consumers were also interviewed on which
attributes determines their choice of brand. The result of the analysis
shows that Nutritional value was their most preferred attributes
(33.33%) Similar to this, mentioned milk content (25.93%), and Taste
(22.22%). Other issues mentioned by them include dissolvability
(11.11%) and sugar content (7.41%).
57
TABLE 4.2.10:
THE EXTENT TO WHICH COMPANY’S IMAGE INFLUENCED
CHOICE OF CEREAL FOODS.
Frequency Percentages
Very strongly 75 27.78
Strongly 65 24.07
Slightly 65 24.07
Very slightly 65 24.07
Total 270 100
Source: Survey 2009.
From the table 4.2.10, the response on the influence of image of the
company (27.78%) of consumers indicated very strongly that company’s
image and brand name influence their choice of cereal foods. (24.070)
for strongly to very slightly. As long as the company maintains her
corporate image and brand name the choice of their product will prevail
above others.
TABLE 4.2.11:
RESPONDENT CHOICE OF CEREAL FOODS BASED ON QUALITY.
Frequency Percentages
Yes 180 66.67
No 90 33.33
Total 270 100
Source: Survey 2009.
58
From table 4.2.11 above, the analysis of data shows that (66.67%) of
consumer were influenced by quality in the choice of the brand. As long
as the company is quality conscious of the brand of their product, the
company will maintain a good percentage market share and this is an
added advantage to the existence of the company. However, (33.33%)
does not perceive quality in the choice of their brand.
TABLE 4.2.12:
RESPONDENT LEVEL OF INCOME.
Income level Frequency Percentages
Low income 60 22.22
Middle income 95 35.19
Upper income 115 42.59
Total 270 100
Source: Survey 2009.
From the response on the level of income, (42.59%) of consumers were
of upper income earners, followed by those in the middle income
(35.19%) and few of low income earner (22.22%) this may be associated
with their level of hierarchy of need which is solid foods.
59
TABLE 4.2.13:
RESPONDENT LEVEL OF EDUCATION
Qualification Frequency Percentages
B.Sc and above 45 16.67
HND 45 16.67
OND/NCE 46 17.64
GCE/SSCE 50 18.52
Primary six/others 84 31.11
Total 270 100
Source: Survey 2009
The result of the analysis reveals that consumers sees cereal foods as
instant food that add nutritional value and vitality to the body and
energy build up. The percentage recorded shows (31.11%) of respondent
attained primary six. A reasonable percentage hold GCE/SSCE
(18.52%), next on the table were holders of OND/NCE (17.04%), while
(16.67%) for HND and B.Sc Certificates.
4.3 TEST OF HYPOTHESIS ONE
Ho: cereal food consumers are loyal to particular brands
Hi: Consumers of cereal foods are not loyal to particular brands.
60
Z = x – np
np (I – p)
Where x = Respondent Ho (190)
n = Sample size (288)
p = Probability for Ho acceptance
(0.50)
= Level of significance (0.05) or 1.65
DECISION RULE
Accept Ho if the Z is greater than zt. Otherwise reject Ho.
SOURCE OF TEST QUESTION 4.2.3
Frequency Percentages
Yes 190 70.37
No 80 29.63
Total 270 100
From the result, those who support null-hypothesis has 70.37%
response, therefore the test is shown below
Z = 190 – 288 (0.50)
288 x 0.50 (1 – 0.50)
61
= 46
72
= 46
8.49
Calculated value = 5.42
DECISION TAKEN
Since calculated value (z) is greater than table of value (zt) 5.42 > 1.65
accept Ho, which means that cereal foods consumers are loyal to
particular brands.
TEST OF HYPOTHESIS TWO
Ho: Price is an important influence in the choice of product brand
loyalty.
Hi: Price is not an important influence in the choice of product brand
loyalty.
Z = x – np
np(I – p)
Where x = Respondent Ho
n = Sample size (288)
P = Probability for Ho acceptance (0.50)
62
= Level of significance (0.05) or 1.65
DECISION RULE
Accept Ho if Z is greater than zt. Otherwise reject Ho.
SOURCE OF TEST QUESTION 4.2.6
Frequency Percentage
Price of the Product 165 61.71
Lack of the Product 70 25.93
Others 35 12.96
270 100
From the table, those who support null hypothesis has the highest
percentage response of 61.71% therefore the test is shown below
Z = 165 – 288 (0.50)
288 x 0.50 (1 – 0.50)
= 21
72
= 21
8.49
63
Calculated value = 2.47
DECISION TAKEN
Since calculated value (z) is greater than table of value (zt) 2.47 > 1.65
accept Ho, which means that price is an important influence in the
choice of product brand loyalty.
TEST OF HYPOTHESIS THREE
Ho: Company image and brand name contribute significantly to
consumers loyalty to particular brands.
Hi: Company image and brand name do not contribute significantly
to consumers loyalty to particular brands.
Z = x – np
np(I – p)
Where x = Respondent Ho
n = Sample size (288)
P = Probability for Ho acceptance
(0.50)
= Level of significance (0.05) or 1.65
64
DECISION RULE
Accept Ho if the Z is greater than zt. Otherwise reject Ho.
SOURCE OF TEST QUESTION 4.2.10
Frequency Percentages
Very strongly 75 27.78
Strongly 65 24.07
Slightly 65 24.07
Very slightly 65 24.07
Total 270 100
From the table all the response supports null hypothesis, the test is
shown below
Z = 270 – 288 (0.50)
288 x 0.50 (1 – 0.50)
= 126
72
= 126
8.49
Calculated value = 14.84.
65
DECISION TAKEN
Since the calculated value (z) is greater than table of value (zt), 14.84 >
1.65 accept Ho which means that company image and brand name
contribute significantly to consumer’s loyalty to particular brands.
TEST OF HYPOTHESIS FOUR
Ho: Consumers perceptions of the quality of the cereal foods have
significant impact on brand loyalty.
Hi: Consumers perceptions of the quality of the cereal foods have no
significant impact on brand loyalty.
Z = x – np
np (I – p)
Where x = Respondent Ho
n = Sample size (288)
P = Probability for Ho acceptance (0.50)
= Level of significance (0.05) or 1.65
DECISION RULE
Accept Ho if the Z is greater than zt. Otherwise reject Ho.
66
SOURCE OF TEST QUESTION 4.2.11
Frequency Percentage
Yes 180 66.67
No 90 33.33
Total 270 100
From the table, those who support null hypothesis has 66.67% response,
therefore the test is shown below
Z = 180 – 288 (0.50)
288 x 0.50 (1 – 0.50)
= 36
72
= 36
8.49
Calculated value = 4.24
67
DECISION TAKEN
Since the calculated value (z) is greater than table of value (zt), 4.24 >
1.65 accept Ho which means that consumers perception of the quality of
the cereal foods have significant impact on brand loyalty.
68
CHAPTER FIVE
SUMMARY OF FINDINGS, CONCLUSION AND
RECOMMENDATION
5.1 SUMMARY OF FINDINGS
The research work which was involved the incidence of brand loyalty
among the consumers of cereal foods in Enugu metropolis revealed so
many interesting findings which were derived from the analysis of
consumer’s questionnaire, and oral interview.
Among the findings made are:
Consumers of cereal foods were to a reasonable extent loyal to
particular brands. In every ten consumers of cereal foods, six of
them were loyal to particular brands.
Price of the various brands exerts a significant influence on the
loyalty of consumers though there was no relationship between
the income of consumers and the extent of influence exerted by
price.
It was also discovered that consumers perception of the quality of
the preferred brands have a significant impact on the brand
loyalty as almost 67% the consumers consider quality in the
69
choice of their brands. Further brand name was an important
influence on consumers loyalty to particular brands.
Consumers have basic expectations in their favorite brands.
Consumers consider the attributes important in the following
order:
Nutritional value
Milk content
Taste
Dissolvability
Sugar content
The claims of loyalty to particular brands were true and real since they
were able to identify their most preferred brands.
5.2 CONCLUSION
This study has been a painstaking effort geared towards ensuring
authentic results.
This study has vindicated the claim of brand loyalty to particular brands,
an obvious indication of the conservatism of consumers. Without a
deeper customer insight marketers will be limited in their ability to do
meaningful predictive modeling, market segmentation and revenue
70
forecasting. Better understanding of consumer behaviour, predisposes
intentions and preferences enables more effective and relevant
messaging. It is also an essential part of customer revenue optimization
and life value building.
5.3 RECOMMENDATIONS
This study established the existence of brand loyalty amongst cereal
foods consumers. An important implication of this result is that new
entrants into the market will have difficult task penetrating the market.
Such companies will relatively make little impact in the cereal foods
market. Existing brands also will need to exert a more than average
effort increase their market share.
It is obvious from the result that the extent of loyalty is a result of
combination of many marketing variables.
Therefore companies should further ascertain what about their brands
is/are of utmost importance to consumers and exploit it to build and/or
improve the loyalty of consumers to their brands.
71
Another important deduction from the study is that price is an important
influence on brand loyalty. The economic hardship in the country is
biting hard across all the income groups. Most consumers will switch to
cheaper brands as their favorite brands become more expensive. This
may be explaining why there are so many new and cheap brands in the
market now. Though these new brands may not constitute such a threat,
it is not good development when your loyal consumers have an easy
opportunity to try other brands. Many of the big names in the industry
like Nestle foods have sensed the danger and resorted to product
differentiation.
Effort should be increased on the local sourcing of raw materials so that
price of these products can be kept at affordable level and thereby
encourage brand loyalty.
Equally important is that consumers perception of quality (measured by
the attributes) that influence loyalty hinges very much on the Nutritional
value.
However, it is not likely that firms if left alone in seeking their own goal
of profit maximization will offer brands with high nutritional value
which contribute to the grooming of a healthy community. One way of
72
formalizing responsibility in this regard is with industry code of ethical
conduct or policy that prescribes and enforces minimum nutrient
requirements in instant foods. Also, National Agency for Food and Drug
Administration and Control (NAFDAC) should enforce to the letter the
basic nutrient requirements of cereal foods especially in the new brands
being introduced into the Nigerian market.
Another interesting conclusion drawn from the study is that company
brand name exerts a great influence on loyalty. Companies that are keen
on introducing new brands should therefore bear in mind that brand
name attract patronage and loyalty to the new brands. They should also
recognized that the cost of producing a new product seems to be rising
with inflation. This has resulted in a more cautions management of
existing products instead of the development of new ones. Companies
should focus on good quality of the product and integrated marketing
communication (IMC) on popular brand names already existing in the
market. This will help sustain loyalty of consumers.
73
BIBLIOGRAPHY
Adrika E.O et al (2001) Principles and Practice of Marketing 2nd
Ed.
(John Jacob’s classic Publisher LTD. Enugu.
Bennett, R. Rundle – Thiele, S. (2005). The Brand Loyalty Life Cycle
Implication for Markets, Journal of Brand Management Vol.12
No.4
David J. Rubsterin (1985) “Marketing Concepts, Strategies and
Decisions, (Englewood cliffs, prentice Hall Inc.) pp 284 – 285.
Henry Assael (1993) Consumer Behaviour and Marketing Action. 4th
ed. Boston Kent pp 25-52
John Oshaughnessy (1988). Competitive Marketing 2nd
Edition,
(London: Bridles Ltd Guilford and King Lyn) P.109
Kotler P. (1991), Marketing Management Analysis, Planning,
Implementation and Control 6th
ed. Englewood cliffs. N.J Prentice
Hall Inc. pp. 262- 263
Kunde J. (2002) Unique Now or Never: the Brand is Company Driver
in the New Value Economy, Financial Time Prentice Hall London
Leon G. Schiffman and Leslie Lazar Kanuk (2002), Consumer
Behaviour 6th
ed. India Prentice Hall Inc. October p. 195
74
Kotler P. (2002) Marketing Management, Melenium Edition, Prentice
Hall Inc. Upper Saddle River, New Jerssey
Reges Mickenna (1991), Marketing is everything Harvard Business
Review (Pager back no. 90087) P.8
Richard Celsi and Jerry C. Oslon (1988) The Role of Involvement in
Attention and Comprehensive Process, Journal of Consumer
Research 15 September pp. 210-224
Rowley J. Daves (2000), Disloyalty. A Closer Look at
Non Loyal, Journal of Consumer Marketing vol. 17 No.6
Theodore Levit (1960), Marketing myopia, Harvard Business Review
(July-August) p.60.
Wale Alabi (2010), Royalty programmes; Rewards without connection.
The Nation 29 January P. 23.
75
QUESTIONNAIRE
School of Postgraduate Studies
Mba Marketing University of
Nigeria Enugu Campus
Dear Respondent
Questionnaire on cereal foods. This questionnaire is intended for use in
research work. Please answer each question sincerely your answers will
be used only for research and nothing else and we promise on our
honour to treat the information given with the strictest confidence.
Indicate your responses by ticking ( ) where applicable. Cereal foods
refer to such drinks as Corn flakes, Golden mourn, Soypos While Oat,
etc).
1. Do you take cereal foods in your home?
Yes………………………… No……………………
2. What is your status in the family?
(a) Husband…………………… (b) Wife………………
(c) Daughter/Son…………………………
(d) House help………………..
3. Do you go to buy any particular brand of cereal foods.?
76
Yes………………………….. No…………………..
4. Mention the brand you will preferably buy…………….
5. Do you at times switch over to other brand
Yes ………. No……………….
6. If yes what do you think was responsible for this?
a) Price of the product
b) Lack of the product
c) Others
7 Which of the following brands will you buy if the prices are the
same? (Tick just one).
Corn flakes
Golden Mourn
Soypos
Cocoa pops
White Oat
Fruit & fiber
8 Does your choice of cereal foods depend on perceived attributes
of the brand?
Yes ……………………….. No…………………
77
9 Which of these attributes determines most importantly your
choice of food drink (choose only one)
(a) Milk content
(b) Taste
(c) Sugar Content/Level
(d) Dissolvability
(e) Nutritional value.
10. To what extent are you influenced by company image in your
choice of cereal foods?
Very strongly
Strongly
Slightly
Very slightly
11. Does the quality of your choice of cereal foods influence you?
Yes ………………… No……………….
12. Please state the level of your income
(a) Low income
(b) Middle income
(c) Upper income
13. What is the level of your education?
79
APENDIX II
COMPUTATION OF Z VIA ZT -TEST FOR
HYPOTHESIS 1
Z= x - np
√np (1-p)
Where x = Respondent (190)
n = Sample size (288)
p = Probability for ho acceptance (0.50)
∞ = Level of significance (0.05) or 1.65
Z = 190 – 288 (0.50)
√288 x 0.50 (1-0.50)
= 46
√ 72
= 46
8.49
= 5.42
80
COMPUTATION OF Z VIA ZT- TEST FOR
HYPOTHESIS II
Z = x - np
√ np (1-p)
Where x = 165
n = 288
p = 0.50
Z = 165-288 (0.50)
√288 x 0.50 (1-0.50)
= 21
√ 72
= 21
8.49
= 2.47
81
COMPUTATION OF Z VIA ZT- TEST FOR
HYPOTHESIS III
Z = x – np
√ np (1-p)
Where x = 270
n = 288
p = 0.50
Z = 270 – 288 (0.50)
√288 x 0.50 (1.050)
= 126
√ 72
= 126
8.49
82
COMPUTATION OF Z VIA Z-TEST FOR
HYPOTHESIS IV
Z = x - np
√np (1 - p)
Where x = 180
n = 288
p = 0.50
Z = 180 – 288 (0.50)
√288 x 0.50 (1 – 0.50)
= 36
√ 72
= 36
8.49
= 4.24