1
Title page
Title: The Prevalence of Depression in Primary Health Care Centers in Iraq
Authors:
1 Professor Dr. Ali Obaid Al-Hamzawi/ M.B.Ch.B., F.I.C.M.S./Consultant
Psychiatrist/ Iraq/ Al-Dewaniyah province/ University of Al-Qadisiyah/ College of
Medicine
2 Dr. Zainab Ali Abed/ M.B.Ch.B………………
Email of the corresponding author:
2
Abstract
Background
The prevalence of depressive symptoms is more frequent among patients
than in the general population. There is psychoneuro-immunology connection
between chronic illnesses and depression. Little is known about the prevalence rate
of depressive symptoms in Iraqi patients attending primary health centers, in
addition there under diagnosis and under estimation of depressive symptoms in
clinical settings. For that reason, this study was designed and carried out at the
department of Family medicine and Community medicine in the faculty of
medicine/ Al-Qadisiyah University.
Aim of the study: The aim was to estimate the prevalence of depressive disorders
among Iraqi patients attending primary health centers and to measure the severity
of depressive disorders among those patients.
Patients and Methods: The study was designed to be a cross sectional study
involving a cohort of Iraqi patients attending primary health centre. Patients were
selected in a systemic random way from the population of patients already visiting
the primary health care centre aiming at a target of at least 100 patients during the
short period of this study. Any patient visiting the primary health center was
included in the current without previous limitations with respect to age or gender.
Any patient who was already diagnosed by a specialist to have depressive disorder
was excluded from this study. The study was carried out at Al-Saniyah primary
health centre. The beginning of data collection was dated on the 10th January 2018
and ended on the 1st may 2018.
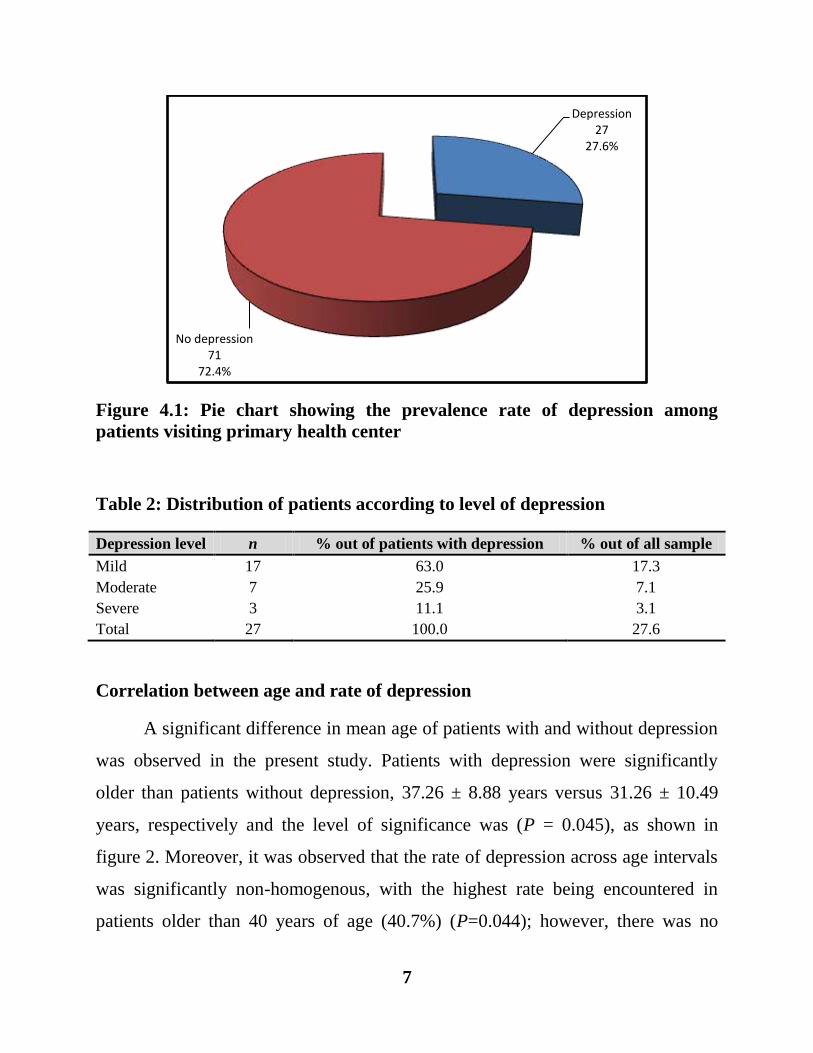
Results: Out of 98 patients participating in the current study, 27 (27.6%) fulfilled
the criteria of a diagnosis of depressive disorders. There were 17 (17.3%), 7 (7.1%)
and 3 (3.1%) patients with mild, moderate and severe depression. A significant
difference in mean age of patients with and without depression was observed in the
present study. Patients with depression were significantly older than patients
without depression, 37.26 ± 8.88 years versus 31.26 ± 10.49 years, respectively
and the level of significance was (P = 0.045). Moreover, it was observed that the
rate of depression across age intervals was significantly non-homogenous, with the
highest rate being encountered in patients older than 40.
Conclusion: The rate of depressive disorders among patients attending primary
health care centers is higher than that of the general population.
Key words: Depression, primary health care center, Iraq
3
Introduction
Depressive disorders are common with a prevalence rate of 5-10% in
primary care centers (1). The majority of patients will present to primary health
care centers with problems other than low mood (2). The diagnosis of depression
will reside of eliciting of core and other symptoms. The criteria for diagnosis are:
Symptoms must present for at least 2 weeks and represent a change from normal;
symptoms are not secondary to the effect of drugs, alcohol misuse, medication or
medical intervention; symptoms may cause significant distress and/ or impairment
of social, occupational, or general function. Core symptoms include: depressed
mood, anhedonia” diminished interest or pleasure in all, or almost all activities
most of the day”, weight change of more than 5% of body weight in a month, sleep
disturbance “insomnia or hypersomnia”, psychomotor agitation or retardation
observable by others, fatigue, or loss of energy or reduced libido, feeling of
worthlessness or excessive or inappropriate guilt, diminished ability to think or to
concentrate or indecisiveness, recurrent thoughts of death or suicide (3). The
prevalence of depressive symptoms is more frequent among patients than in the
general population (4). There is psychoneuro-immunology connection between
chronic illnesses and depression (5). Little is known about the prevalence rate of
depressive symptoms in Iraqi patients attending primary health centers, in addition
there under diagnosis and under estimation of depressive symptoms in clinical
settings. For that reason, this study was designed and carried out at the department
of Family medicine and Community medicine in the faculty of medicine/ Al-
Qadisiyah University.
4
Patients and Methods
The study was designed to be a cross sectional study involving a cohort of
Iraqi patients attending primary health centre. Patients were selected in a systemic
random way from the population of patients already visiting the primary health
care centre aiming at a target of at least 100 patients during the short period of this
study. Any patient visiting the primary health center was included in the current
without previous limitations with respect to age or gender. Any patient who was
already diagnosed by a specialist to have depressive disorder was excluded from
this study. The study was carried out at Al-Saniyah primary health centre. The
beginning of data collection was dated on the 10th January 2018 and ended on the
1st may 2018. A total of 140 days was the length of the period required to collect
data from involved patients. The questionnaire form was based on the following:
International (ICD-10) diagnostic check list for the diagnosis of depressive
symptoms (6), Beck depressive inventory-II to measure the severity of depression,
Sociodemographic data including age, gender, residency, address, occupation,
education level and income in addition to any chronic medical illness. Data were
collected, summarized, analyzed and presented using two software programs; these
were the Statistical package for social sciences (SPSS) version 23 and Microsoft
Office excel 2013. Numeric variables were presented as mean, standard deviation
(SD) and range, whereas, categorical variables were expressed as number and
percentage. Prevalence rate of depression was expressed as percentage.
Association between categorical variables was assessed using either Chi-Square
test or Yates correction for continuity when more than 20% of cells have expected
counts less than 5. Comparison of mean values between three groups was done
using one way analysis of variance (ANOVA). The level of significance was
considered at P ≤ 0.05.
5
Results
Sociodemographic characteristics of the study sample
The current study included 98 patients, 48 (49.0%) males and 50 (51.0%)
females. The mean age of patients was 33.22 ±14.76 years and it ranged from 13-
65 years. According to marital status, there were 68 (69.4%), 23 (23.5%), 5 (5.1%)
and 2 (2.0%), married, single, widowed and divorced patients respectively.
According to level of education, the study included 20 (20.4%), 32 (32.7%), 21
(21.4%) and 25 (25.5%), illiterate, primary, secondary and higher education
patients respectively. All patients were from Al-Sahiyah district. With respect to
occupation, patients were distributed as 38 (38.8%), 14 (14.3%), 21 (21.4%), 19
(19.4%), 4 (4.1%) and 2 (2.0%), housewives, student, free worker, employee,
military and retired respectively. Economically speaking, the study included 49
(50.0%), 46 (46.9%) and 3 (3.1%) patients of poor, moderate and good income
respectively. The study, included 7 (7.1 %), 3 (3.1 %), 1 (1.0 %) and 1 (1.0 %)
patients with hypertension, diabetes mellitus, post-partum hemorrhage and
psychiatric illness respectively, as shown in table 1.
Prevalence rate and level of depressive disorders
Out of 98 patients participating in the current study, 27 (27.6%) fulfilled the
criteria of a diagnosis of depressive disorders, as shown in figure 4.1. There were
17 (17.3%), 7 (7.1%) and 3 (3.1%) patients with mild, moderate and severe
depression, as shown in table 2.
Table 4.1: Demographic characteristics of the study sample
Characteristic Value
Number of cases 98
Age
Mean SD (years) 33.22 ±14.76
6
Range (Min.-Max.) years 52 (13-65)
Gender
Male 48 (49.0)
Female 50 (51.0)
Marital status
Married 68 (69.4)
Single 23 (23.5)
Widowed 5 (5.1)
Divorced 2 (2.0)
Education
Illiterate 20 (20.4)
Primary 32 (32.7)
Secondary 21 (21.4)
Higher education 25 (25.5)
Address
Alsaniyah 98 (100.0)
Occupation
Housewife 38 (38.8)
Student 14 (14.3)
Free worker 21 (21.4)
Employee 19 (19.4)
Military 4 (4.1)
Retired 2 (2.0)
Income
Poor 49 (50.0)
Moderate 46 (46.9)
Good 3 (3.1)
Health centre
Alsaniyah 98 (100.0)
Other medical problem
Hypertension 7 (7.1)
Diabetes mellitus 3 (3.1)
Post-Partum Hemorrhage 1 (1.0)
Psychiatric 1 (1.0)
7
Figure 4.1: Pie chart showing the prevalence rate of depression among
patients visiting primary health center
Table 2: Distribution of patients according to level of depression
Depression level n % out of patients with depression % out of all sample
Mild 17 63.0 17.3
Moderate 7 25.9 7.1
Severe 3 11.1 3.1
Total 27 100.0 27.6
Correlation between age and rate of depression
A significant difference in mean age of patients with and without depression
was observed in the present study. Patients with depression were significantly
older than patients without depression, 37.26 ± 8.88 years versus 31.26 ± 10.49
years, respectively and the level of significance was (P = 0.045), as shown in
figure 2. Moreover, it was observed that the rate of depression across age intervals
was significantly non-homogenous, with the highest rate being encountered in
patients older than 40 years of age (40.7%) (P=0.044); however, there was no
Depression 27
27.6%
No depression 71
72.4%
8
significant difference in mean age among patients with mild, moderate and severe
depression respectively (P = 0.432), as shown in table 3.
Figure 2: Bar chart showing mean age of patients with and without depression
Table 3: Correlation between rate of depression and age of patients
Age interval n % P* Mild Moderate Severe P†
≤ 20 years (n=26) 9 34.6
0.044
Significant
5 (19.2) 3 (11.5) 1 (3.8)
21-40 years (n =45) 7 15.6 4 (8.9) 2 (4.4) 1 (2.2)
> 40 years (n = 27) 11 40.7 8 (29.6) 2 (7.4) 1 (3.7)
Mean age ± SD
40.65 ±19.59 29.71± 14.40 35.67 ±21.36 0.432
Not significant
n: number of cases; SD: standard deviation; *Chi-Square test; † One way ANOVA
Association between depression rate and gender
The rate of depression among male patients was (22.9%), whereas, among
female patients it was (32.0%). Although, rate of depression was slightly higher in
31.69 ±8.88 37.26 ±10.49
0.00
10.00
20.00
30.00
40.00
50.00
60.00
70.00
No depression Depression
Me
an a
ge ±
SD
(ye
ars)
P =0.045
Significant
9
female patients compared to male patients, the difference was not statistically
significant (P = 0.314), as shown in table 4.
Table 4: Association between depression rate and gender
Gender n % P* Mild Moderate Severe
Male (n = 48) 11 22.9 0.314
Not significant
8 (16.7%) 3 (6.3%) 0 (0.0%)
Female (n = 50) 16 32.0 9 (18.0%) 4 (8.0%) 3 (6.0%)
n: number of cases; *Chi-Square test
Association between depression rate and marital status
Rate of depression according to marital status was as following: 26.5%,
26.1%, 60.0% and 0.0% among married, single, widowed and divorced patients,
respectively. Despite some differences in rate of depression among patients with
respect to marital status, there was no statistical significance, (P > 0.05), as shown
in table 5.
Table 5: Association between depression rate and marital status
Marital status n % P Mild Moderate Severe
Married (n = 68) 18 26.5 0.719*
NS 12 (17.6%) 4 (5.9%) 2 (2.9%)
Single (n = 23) 6 26.1 0.857*
NS 3 (13.0%) 3 (13.0%) 0 (0.0%)
Widowed (n = 5) 3 60.0 0.249†
NS 2 (40%) 0 (0.0%) 1 (20.0%)
Divorced (n = 2) 0 0.0 0.935†
NS 0 (0.0%) 0 (0.0%) 0 (0.0%)
n: number of cases; *Chi-Square test; † Yates correction for continuity; NS: not significant
6 Association between depression rate and education level
The rate of depression according to education level was as following: 35.0%,
25.0%, 28.6% and 24.0% in patients who are illiterate, with primary, secondary
10
and with higher level of education respectively. The rate of depression rate in
illiterate patients was the highest; however, no group showed statistically
significant difference than other groups (P > 0.05), as shown in table 6.
Table 6: Association between depression rate and education
Education n % P * Mild Moderate Severe
Illiterate 7 35.0 0.403
NS 5 (25.0%) 0 (0.0%) 2 (10.0%)
Primary 8 25.0 0.694
NS 5 (15.6%) 2 (6.3%) 1 (3.1%)
Secondary 6 28.6 0.783
NS 4 (19.0%) 2 (9.5%) 0 (0.0%)
Higher education 6 24.0 0.645
NS 3 (12.0%) 3 (12.0%) 0 (0.0%)
n: number of cases; *Chi-Square test; NS: not significant
7 Association between depression rate and occupation
The rate of depression according to occupation was as following: 29.0 %,
35.7 %, 23.8 %, 15.7 %, 25.0 % and 100.0% in housewives, student, free worker,
employee, military and retired respectively. The rate of depression rate showed
differences according to occupation; however, no group showed statistically
significant difference than other groups (P > 0.05), as shown in table 7.
Table 7: Association between depression rate and occupation
Occupation n % P Mild Moderate Severe
Housewife (n = 38) 11 29.0 0.806*
NS 6 (15.8%) 2 (5.3%) 3(7.9%)
Student (n = 14) 5 35.7 0.678†
NS 3 (21.4%) 2 (14.3%) 0 (0.0%)
Free worker (n =21) 5 23.8 0.665†
NS 4 (19.0%) 1 (4.8%) 0 (0.0%)
Employee (n = 19) 3 15.7 0.201* 1 (5.3%) 2 (10.5%) 0 (0.0%)
11
NS
Military (n = 4) 1 25.0 1.000†
NS 1 (25.0%) 0 (0.0%) 0 (0.0%)
Retired (n = 2) 2 100.0 0.129†
NS 2 (100.0%) 0 (0.0%) 0 (0.0%)
n: number of cases; *Chi-Square test; † Yates correction for continuity; NS: not significant
Association between depression rate and income
The rate of depression according to income was as following: 34.7 %, 21.7
% and 0.0 % in patients with poor, moderate and good income respectively.
Despite the fact that patients with good income reported 0.0% rate of depression,
there was no statistical significance among groups (P > 0.05), as shown in table 8.
Table 8: Association between depression rate and income
Income n % P* Mild Moderate Severe
Poor (n = 49) 17 34.7 0.113
NS 11 (22.4%) 4 (8.2%) 2 (4.1%)
Moderate (n = 46) 10 21.7 0.226
NS 6 (13.0%) 3 (6.5%) 1 (2.2%)
Good (n = 3) 0 0.0 0.668
NS 0 (0.0%) 0 (0.0%) 0 (0.0%)
n: number of cases; *Chi-Square test; NS: not significant
Association between depression rate and other medical problem
The rate of depression among patients with chronic illnesses was
significantly higher than that in patients without chronic medical illnesses, 75.0 %
versus 26.5 % (P <0.001), as shown in table 10. The risk of having depression, in
terms of Odds ratio, in patients with chronic medical illnesses was 10.83 folds than
patients without chronic medical illnesses and the 95% confidence interval was
(2.65 to 44.24). The etiologic contribution, measured by etiologic fraction, of
12
depression to chronic medical illnesses was 0.68, as shown in table 9. The severity
of depression in patients with chronic illnesses is shown in table 10.
Table 9: Association between depression rate and other medical problem
Other
medical problem
Patients with
depression
n = 27
Patients with
no depression
n = 71
P† OR 95% CI EF
Positive (n = 12) 9 (75.0%) 3 (25%) <0.001
HS 10.83 2.65- 44.24 0.68
Negative (n = 68) 18 (26.5%) 68 (73.5%)
n: number of cases; † Yates correction for continuity; HS: highly significant; OR: Odds Ratio; CI: confidence
interval
Table 4.10: Level of depression according to medical illness
Levels of
depression
Number of patients
with medical illness %
Mild (n = 17) 5 29.4
Moderate (n = 7) 2 28.6
Severe (n = 3) 2 66.7
Total (n = 27) 9 33.3
Discussion
In the present study, an objective was directed toward exploring prevalence
rate of depressive disorders in Iraqi patients attending primary health centers, in
addition to an attempt to figure out the possible association between a number of
demographic factors and depression and to evaluate the probable risk exerted by
these factors, such as age, gender, occupation, economic status, level of education
and the presence of concomitant medical and / or psychiatric illness, in terms of
Odds ratio and etiologic fraction in association with depressive disorders. The
13
estimated prevalence rate of depression in primary health center, in the present
study, of 27.6% seems relatively high. However, it should be emphasized that this
rate was calculated based on clinical rather than community setting. This may
explain the relatively high prevalence rate of depression in Iraqi patients visiting
primary health care centers. It has been stated in published literatures that mental
disorders are more common in clinical than in community settings, one study in
Kenya found that up to 40% of the patients in general medical and surgical wards
were depressed and required treatment (7). Prevalence of depression was 30.3%.
Direct comparison of prevalence studies for depressive disorders is difficult
because of a lack of uniformity as studies differ in terms of culture, patient
population, socio-demographic factors, diagnostic instrument, and methodology
(8). Furthermore, some studies focus on a subset of depressive disorder while
others include all forms of mental disorders. Given these limitations, the
prevalence figures determined in this study are consistent with most findings
reported elsewhere. The Prevalence of depression found in the present study
(30.3%) was significant and in keeping with the results from both developed and
developing countries. For instance, the results were congruous with the prevalence
rate of 29.6% reported among Kuwait PHC patients (9); the 29.2% reported in
primary care setting in Thailand (10); the 28.4% reported among primary care
attendees in South India (11). Interestingly the prevalence is somehow similar to
that of the international study (12) where the prevalence was 33.5%, the 31.6%
prevalence rate of current major depressive episode at PHC centres in Uganda (13),
and also the 32% prevalence rate of depressive disorder at a Community Health
Centre in South Africa (8). In one study, the prevalence of depression among the
patients attending the outpatients department was found to be 30.3%, which is
approximately similar to that found in the present study, moreover, Udedi stated
that detection rate of depression by clinician was 0% (2). Despite this evidence that
14
depression contribute a significant percentage of disease burden in the clinical
setting there is also evidence which indicates that depression often goes
unrecognized (14). World Health Organization report on mental health suggest that
undiagnosed depression places a significant socio-economic burden on individuals,
families and communities, in terms of increased service needs, lost employment,
reduced productivity, poor parental care with the risk of transgenerational effects
and an increased burden on care givers (15). Although depression-related health
problems are estimated to be huge, a gap in the provision of services has been
highlighted by various studies (16). The problem is said to be even more serious in
settings that are already labouring under the burden of inadequate resources and
shortage of health care personnel (17). Delays, misdiagnosis and non-specific
treatments have been typical pathways to care for people with depression (18). It is
evident that delays in seeking treatment, misdiagnosis and non-specific treatments
have compromised appropriate care for people with depression hence depression is
among the leading causes of disability in the world and cause of years of health
lost to disease in both men and women (19).
References
1 Timonen M, Liukkonen T. Management of depression in adults. BMJ : British
Medical Journal. 2008;336(7641):435-439.
2 Udedi M. The Prevalence of Depression among patients and its detection by
Primary Health Care Workers at Matawale Health Centre (Zomba). Malawi
Medical Journal. 2014;26(2):34-37.
3 McCarter T. Depression Overview. American Health and Drug Benefits.
2008;1(3):44-51.
15
4 Wang J, Wu X, Lai W, et al. Prevalence of depression and depressive symptoms
among outpatients: a systematic review and meta-analysis. BMJ.
2017;7(8):e017173.
5 Jaremka LM, Lindgren ME, Kiecolt-Glaser JK. Synergistic Relationships
Among Stress, Depression, and Troubled Relationships: Insights from
Psychoneuroimmunology. Depression and anxiety. 2013;30(4):10.1002/da.22078.
6 World Health Organization (WHO). The ICD-10 Classification of Mental and
Behavioral Disorders. Clinical descriptions and diagnostic guidelines. Geneva,
Switzerland: World Health Organization; 1992
7 Ndetei DM, et al. The prevalence of mental disorders in adults in different level
general medical facilities in Kenya: a cross-sectional study. Annals of General
Psychiatry. 2009;8:1.
8 Triant VA. The Recognition and Determinants of Depression at a South African
Primary Care Clinic, in School of Medicine. Yale University; 2002.
9 Al-Nakkas EM, Al-Mutar MS. Prevalence of Depression among Kuwaiti Patients
attending the Sawaber Health Center. Kuwait Medical Journal. 2004;36(2):113–
116.
10 Lotrakul M, S R Psychiatric services in primary care settings: a survey of
general practitioners in Thailand. BMC Family Practice. 2006;7:48.
11 Pothen M, et al. Common mental disorders among primary care attenders in
Vellore, South India: nature, prevalence and risk factors. International Journal of
Social Psychiatry. 2003;49(2):119–125.
12 Barkow K, et al. Identification of items which predict later development of
depression in primary health care. European Archives of Psychiatry & Clinical
Neuroscience. 2001;251(Suppl 2):21–26.
13 Muhwezi WW, Agren H, Musisi S. Detection of major depression in Ugandan
primary health care settings using simple questions from a subjective well-being
(SWB) subscale. Social Psychiatry and Psychiatric Epidemiology. 2007;42:61–69.
14 Licht-Strunk E, et al. The prognosis of undetected depression in older general
practice patients. A one year follow-up study. Journal of Affective
Disorders. 2009;114(1–3):310–315.
16
15 Okello ES, Neema S. Explanatory models and help-seeking behavior: Pathways
to psychiatric care among patients admitted for depression in Mulago hospital,
Kampala, Uganda. Qualitative Health Research. 2007;17(1):14–25.
16 Owen S, Milburn C. Implementing research findings into practice: improving
and developing services for women with serious and enduring mental health
problems. Journal of Psychiatric and Mental Health Nursing. 2001;8:221–231.
17 WHO, author. WHO Policy Perspective on Medicines-Traditional Medicine-
Growing needs and potentials. Geneva: World Health Organization Press; 2002.
18 Mechanic D. Barriers to help-seeking, detection, and adequate treatment for
anxiety and mood disorders: implications for health care policy. Journal of Clinical
Psychiatry. 2007;68(Suppl 2):20–26.
19 WHO, author. The global burden of diseases: 2004 update. Geneva: World
Health Organization Press; 2008.