84
READ RESEARCH PRESENTATION APRIL 19-21 2017

READRESEARCH
PRESENTATION
APRIL 19-21 2017
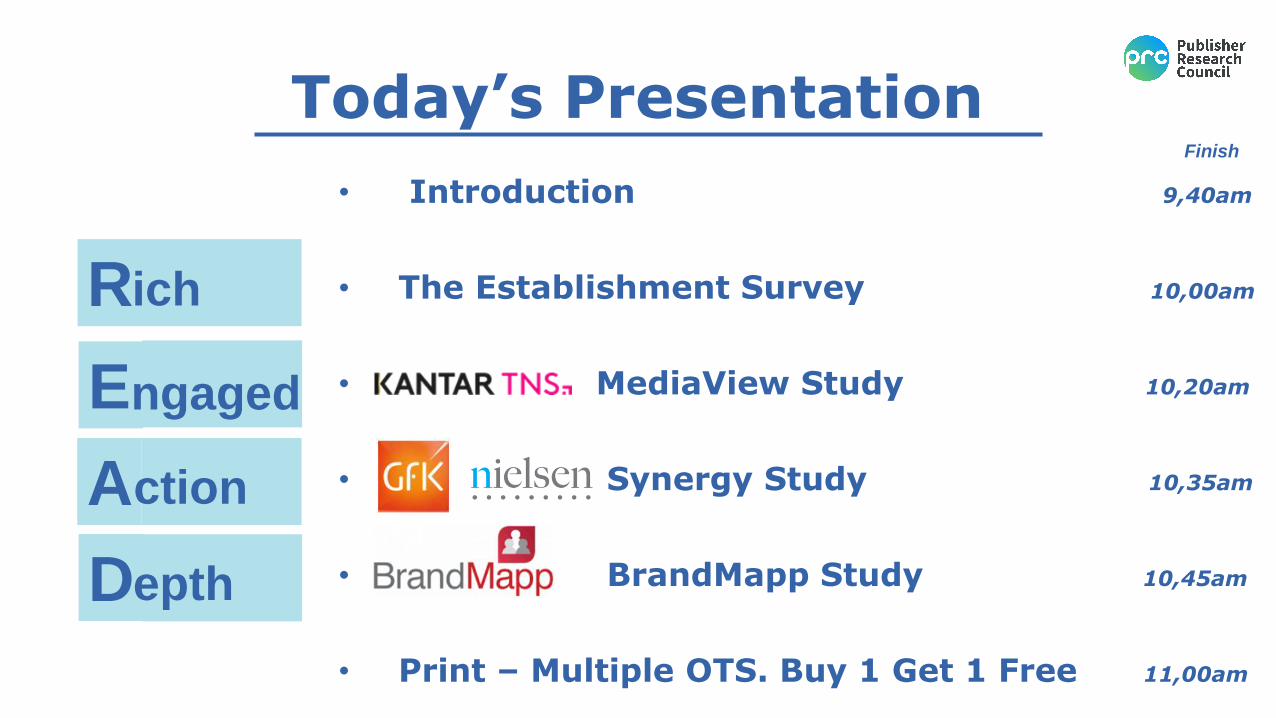
• Introduction 9,40am
• The Establishment Survey 10,00am
• MediaView Study 10,20am
• Synergy Study 10,35am
• BrandMapp Study 10,45am
• Print – Multiple OTS. Buy 1 Get 1 Free 11,00am
Today’s Presentation
R
E
D
A
ngaged
ich
ction
epth
Finish
You have to begin to lose your memory, if only in bits & pieces, to realise that memory is what makes our lives.
Life without memory is no life at all… Our memory is our coherence, our reason, our feeling, even our action.
Without it, we are nothing
MEMORY MAKES LIFE PRC Strategy
So just as memory is central to an individual
The written word and reading forms the collective memory of our species.
Without the ability to write down and share our experiences, knowledge & collective learnings in a form that can be consumed by any literate person at any other time or place in any language, we would still be gathering nuts.
Our ability to share, read, remember and learn is what separates us from all other creatures. Knowledge transfer and civilisation would not be possible without reading.
Reading gives humanity a memory.
PRC Strategy READING IS HUMAN’S MEMORY
PRC Strategy SYNERGY WITH TV
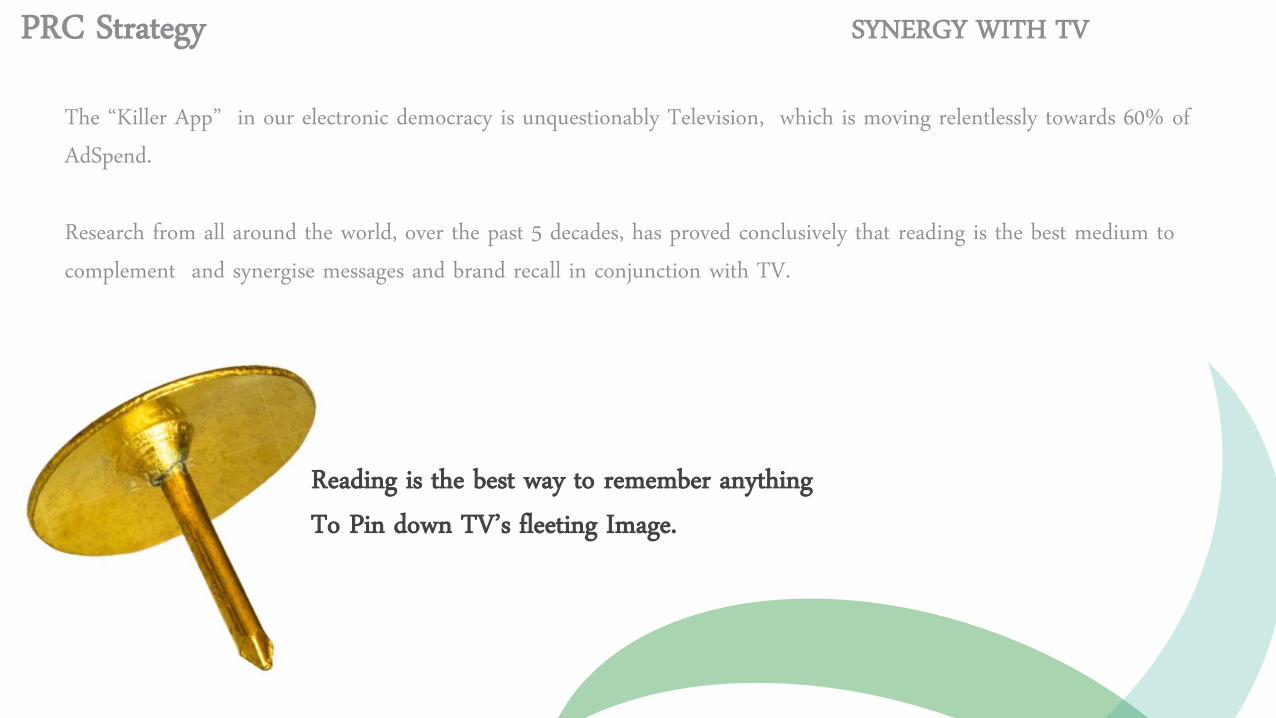
Reading is the best way to remember anything To Pin down TV’s fleeting Image.
The “Killer App” in our electronic democracy is unquestionably Television, which is moving relentlessly towards 60% of AdSpend.
Research from all around the world, over the past 5 decades, has proved conclusively that reading is the best medium to complement and synergise messages and brand recall in conjunction with TV.

INSIGHTS FROM THE ESTABLISHMENT SURVEY
R ich
3.14 X AXIS
6.65 BASE MARGIN
5.95 TOP MARGIN
4.52 CHART TOP
11.90LEFT MARGIN
11.90RIGHT MARGIN DO NOT ALTER SLIDE MASTERS – THIS IS A TNS APPROVED TEMPLATE
7
INTRODUCING THE NEW SOCIO-ECONOMIC SEGMENTATION SYSTEM:
SEM
3.14 X AXIS
6.65 BASE MARGIN
5.95 TOP MARGIN
4.52 CHART TOP
11.90LEFT MARGIN
11.90RIGHT MARGIN DO NOT ALTER SLIDE MASTERS – THIS IS A TNS APPROVED TEMPLATE
A measure that depicts how you live, not necessarily what you have
8
THE SEM CONCEPTUAL STARTING POINT
3.14 X AXIS
6.65 BASE MARGIN
5.95 TOP MARGIN
4.52 CHART TOP
11.90LEFT MARGIN
11.90RIGHT MARGIN DO NOT ALTER SLIDE MASTERS – THIS IS A TNS APPROVED TEMPLATE
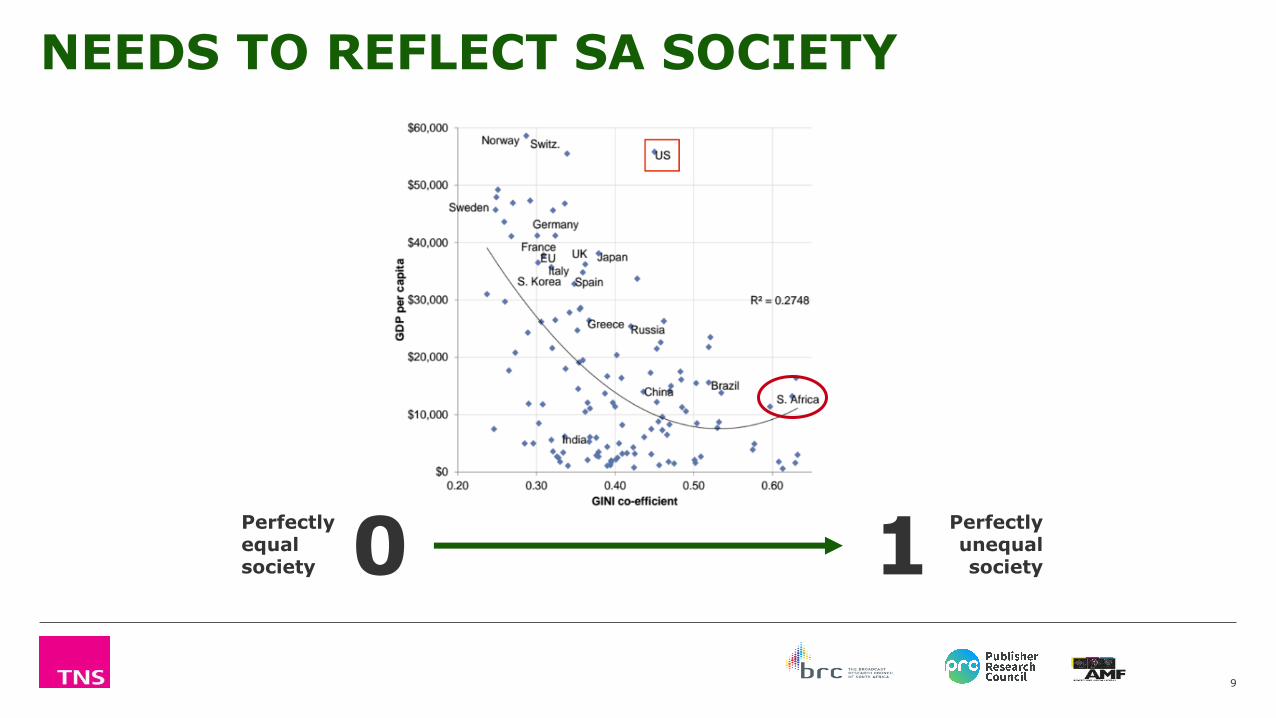
0 1Perfectly equal society
Perfectly unequal society
NEEDS TO REFLECT SA SOCIETY
9
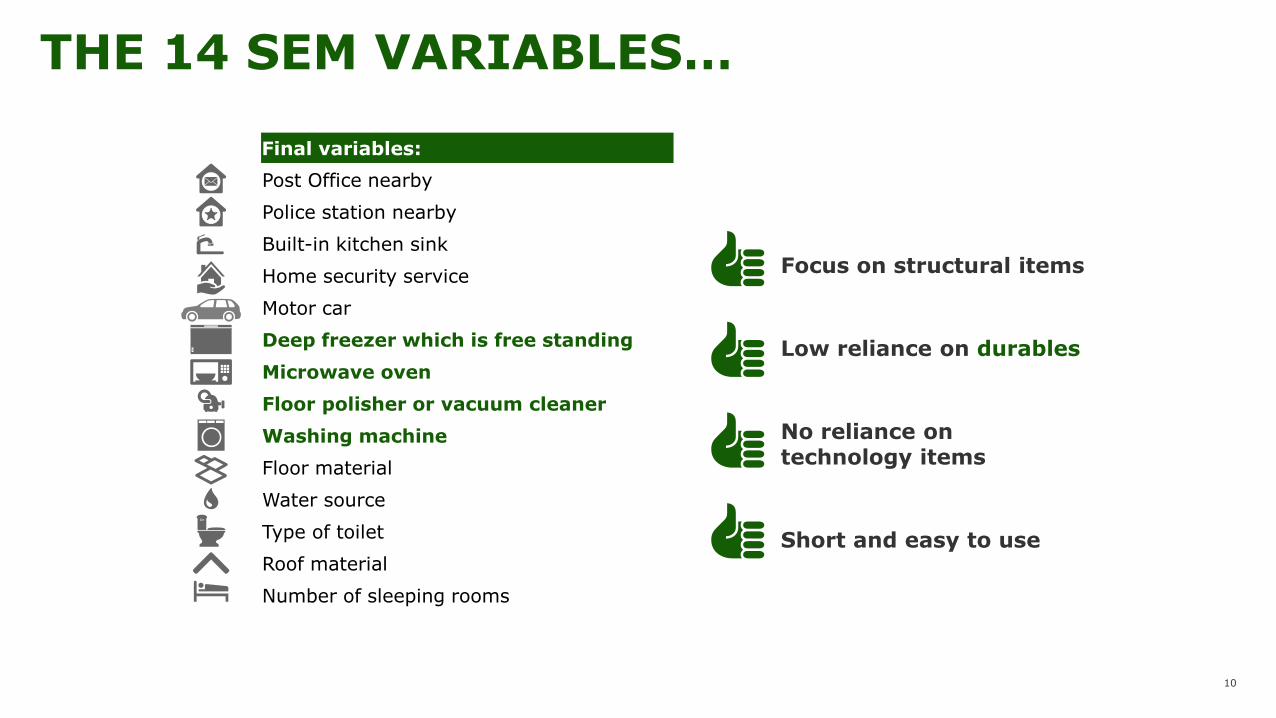
Focus on structural items
Low reliance on durables
No reliance on technology items
Short and easy to use
THE 14 SEM VARIABLES…
Final variables:
Post Office nearby
Police station nearby
Built-in kitchen sink
Home security service
Motor car
Deep freezer which is free standing
Microwave oven
Floor polisher or vacuum cleaner
Washing machine
Floor material
Water source
Type of toilet
Roof material
Number of sleeping rooms
10
3.14 X AXIS
6.65 BASE MARGIN
5.95 TOP MARGIN
4.52 CHART TOP
11.90LEFT MARGIN
11.90RIGHT MARGIN DO NOT ALTER SLIDE MASTERS – THIS IS A TNS APPROVED TEMPLATE
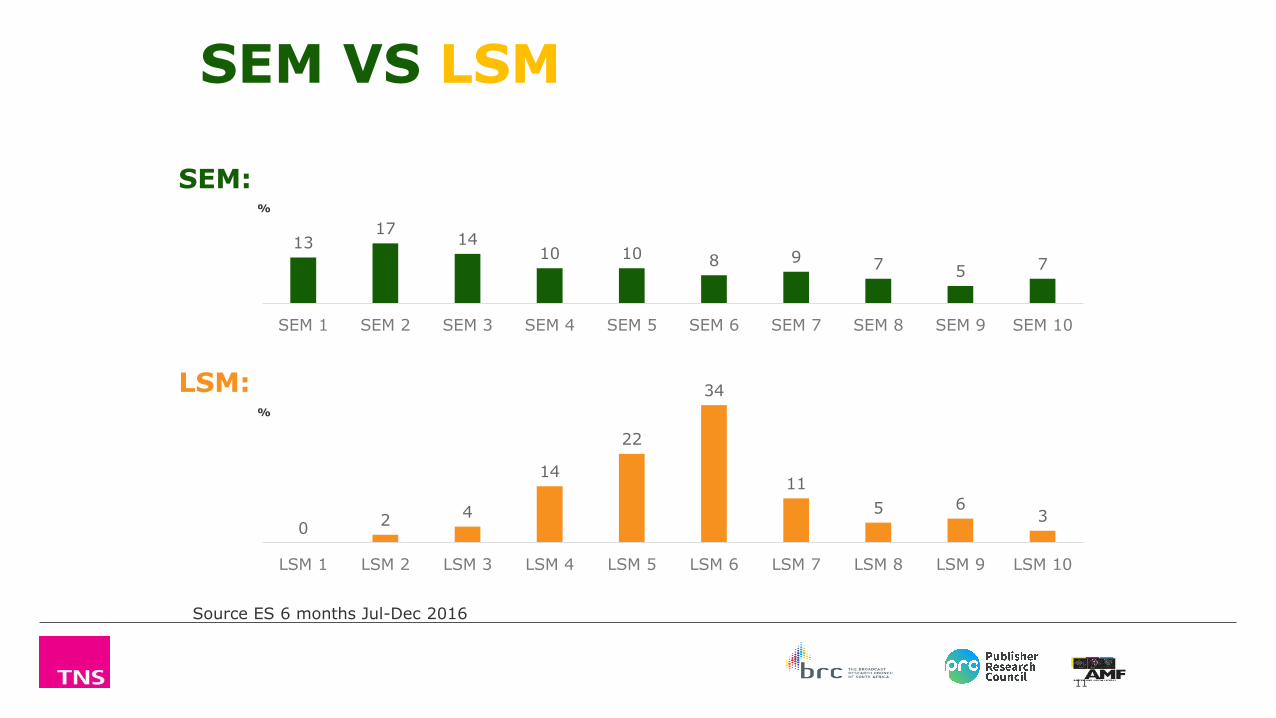
SEM VS LSM
11
13 17
14 10 10 8 9 7 5 7
SEM 1 SEM 2 SEM 3 SEM 4 SEM 5 SEM 6 SEM 7 SEM 8 SEM 9 SEM 10
SEM:
LSM:
0 2
4
14
22
34
11
5 6 3
LSM 1 LSM 2 LSM 3 LSM 4 LSM 5 LSM 6 LSM 7 LSM 8 LSM 9 LSM 10
%
%
Source ES 6 months Jul-Dec 2016
3.14X AXIS
6.65BASE MARGIN
5.95TOP MARGIN
4.52CHART TOP
11.90LEFT MARGIN
11.90RIGHT MARGINDO NOT ALTER SLIDE MASTERS – THIS IS A TNS APPROVED TEMPLATE
0 2 4 6 8
10
12
14
16
18
20
22
24
26
28
30
32
34
36
38
40
42
44
46
48
50
52
54
56
58
60
62
64
66
68
70
72
74
76
78
80
82
84
86
88
90
92
94
96
98
100
%
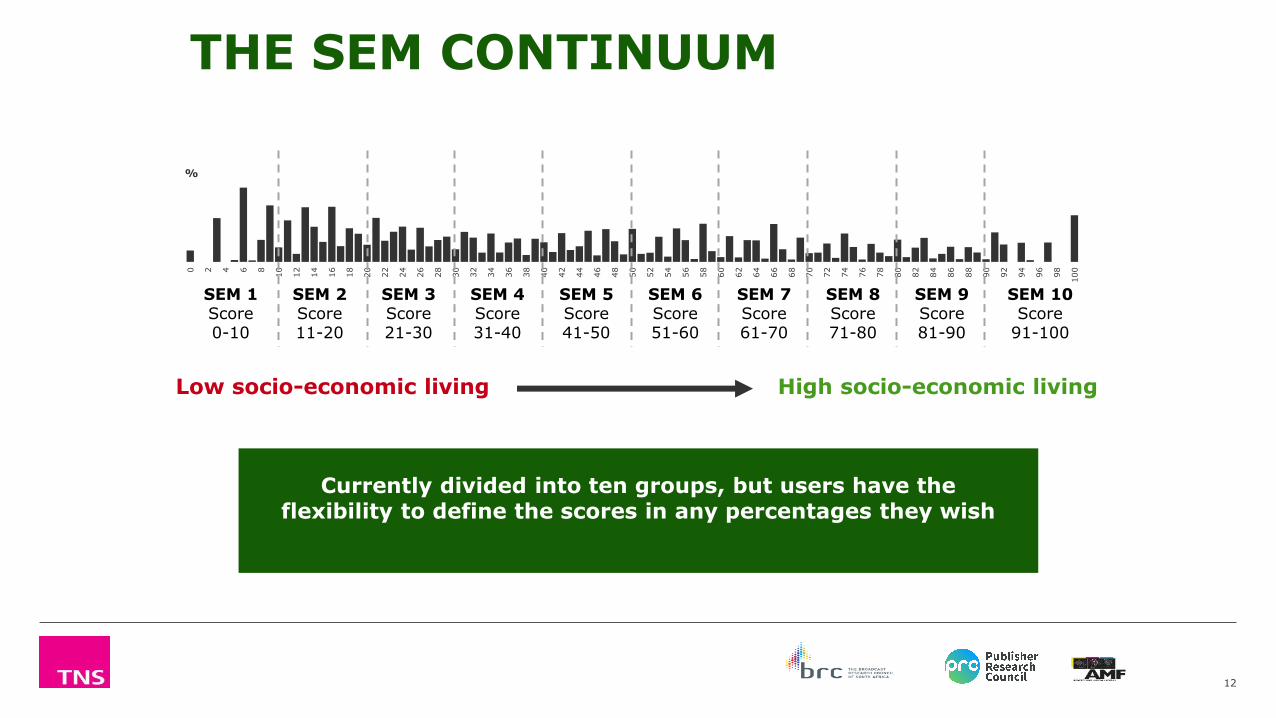
SEM 10 Score
91-100
SEM 9 Score 81-90
SEM 8 Score 71-80
SEM 7 Score 61-70
SEM 6 Score 51-60
SEM 5 Score 41-50
SEM 4 Score 31-40
SEM 3 Score 21-30
SEM 2 Score 11-20
SEM 1 Score 0-10
Low socio-economic living High socio-economic living
Currently divided into ten groups, but users have the flexibility to define the scores in any percentages they wish
THE SEM CONTINUUM
12
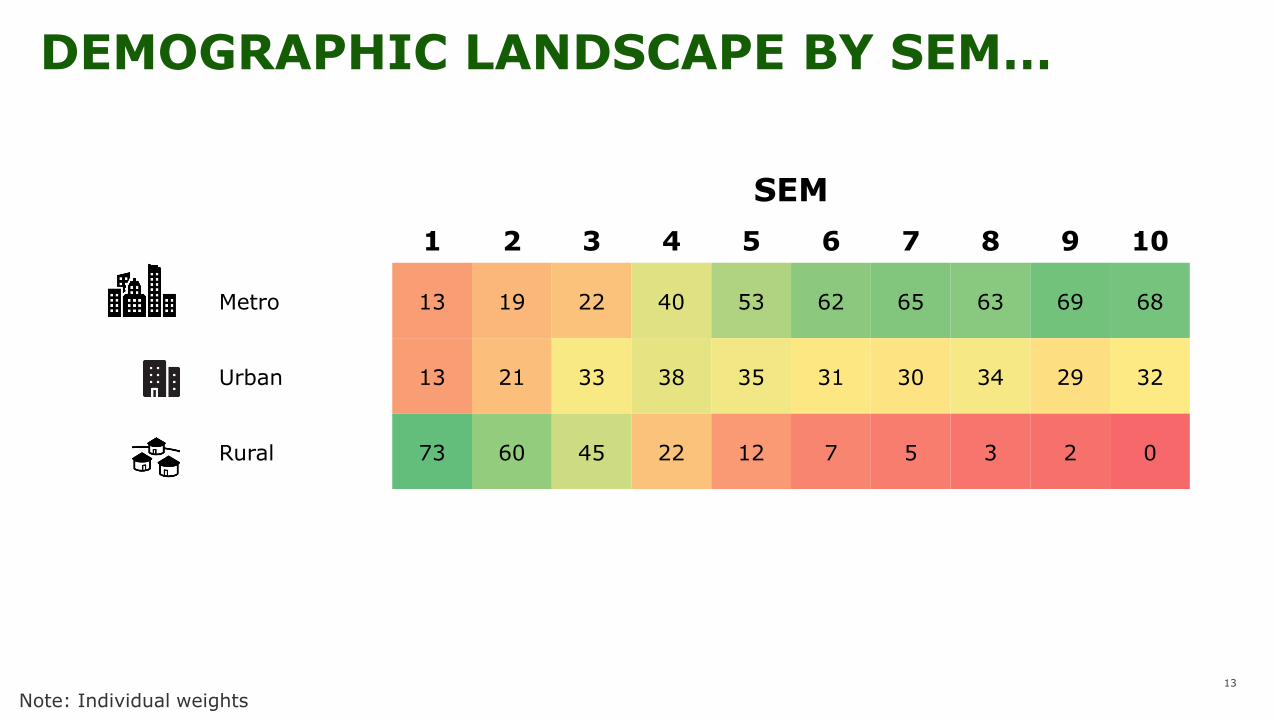
DEMOGRAPHIC LANDSCAPE BY SEM…
SEM
1 2 3 4 5 6 7 8 9 10
Metro 13 19 22 40 53 62 65 63 69 68
Urban 13 21 33 38 35 31 30 34 29 32
Rural 73 60 45 22 12 7 5 3 2 0
13
Note: Individual weights
14
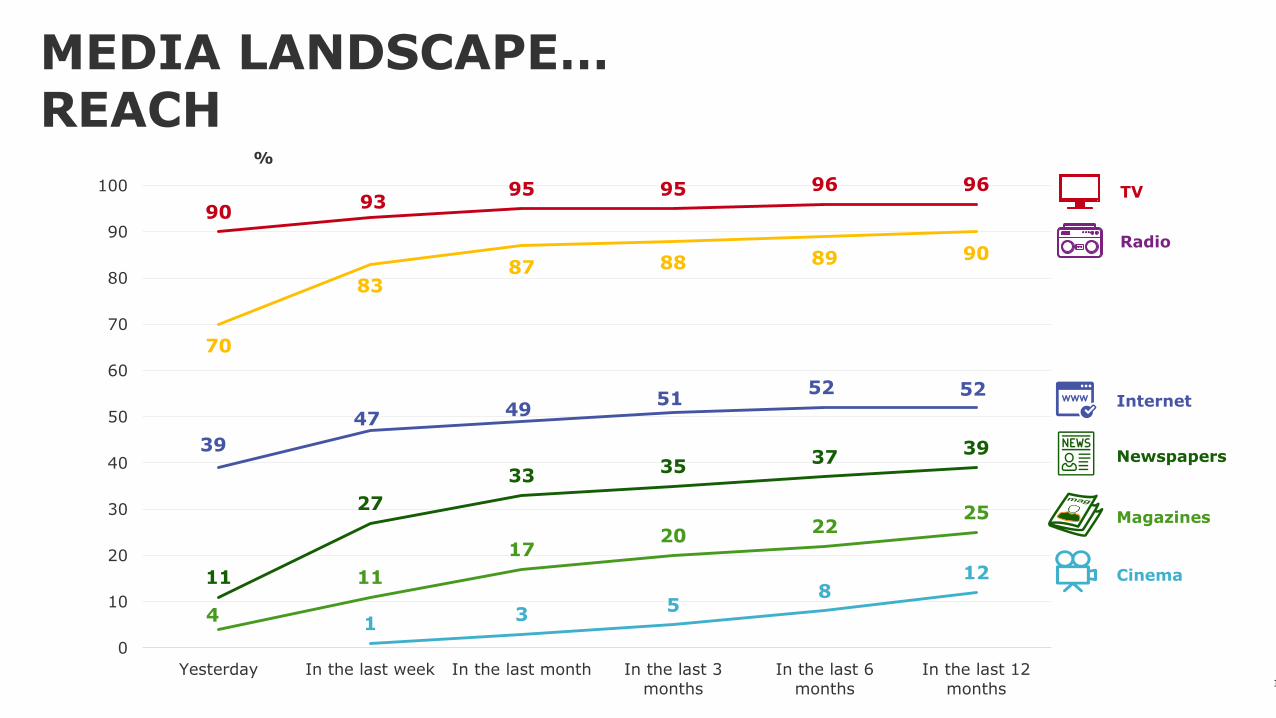
MEDIA LANDSCAPE… REACH
1 3
5 8
12 11
27
33 35
37 39
4
11
17 20
22 25
90 93
95 95 96 96
70
83 87 88 89 90
39
47 49
51 52 52
0
10
20
30
40
50
60
70
80
90
100
Yesterday In the last week In the last month In the last 3
months
In the last 6
months
In the last 12
months
%
TV
Radio
Newspapers
Magazines
Internet
Cinema
Don’t Count the People you Reach
Reach the People that Count
15
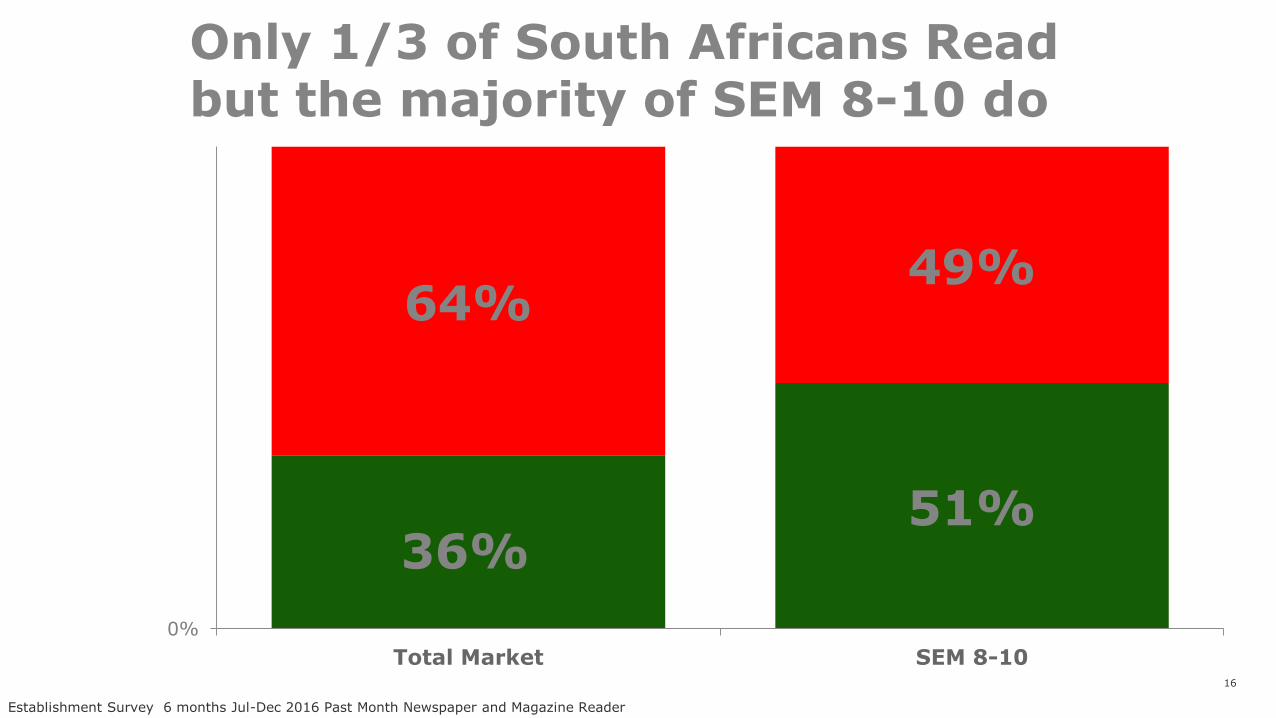
Only 1/3 of South Africans Read but the majority of SEM 8-10 do
36% 51%
64% 49%
0%
Total Market SEM 8-1016
Establishment Survey 6 months Jul-Dec 2016 Past Month Newspaper and Magazine Reader
17
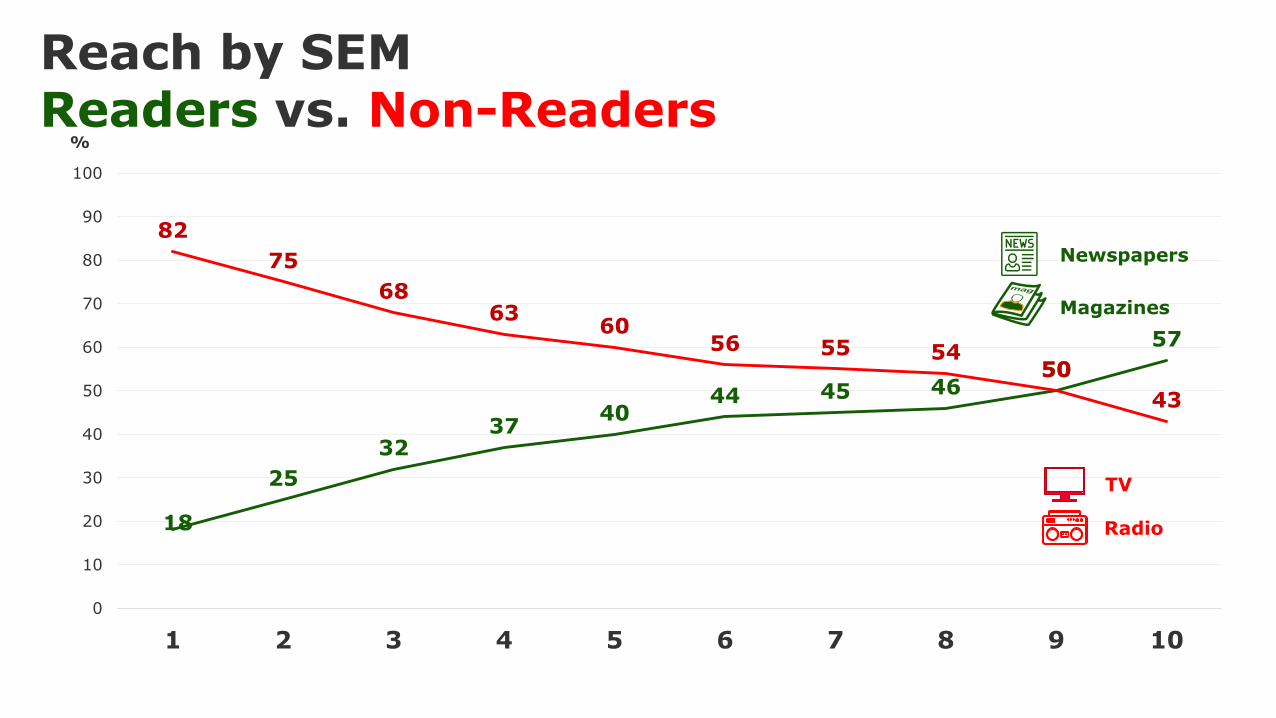
Reach by SEM Readers vs. Non-Readers
18
25
32 37
40 44 45 46
50
57
82
75
68 63
60 56 55 54
50
43
0
10
20
30
40
50
60
70
80
90
100
1 2 3 4 5 6 7 8 9 10
%
TV
Radio
Newspapers
Magazines
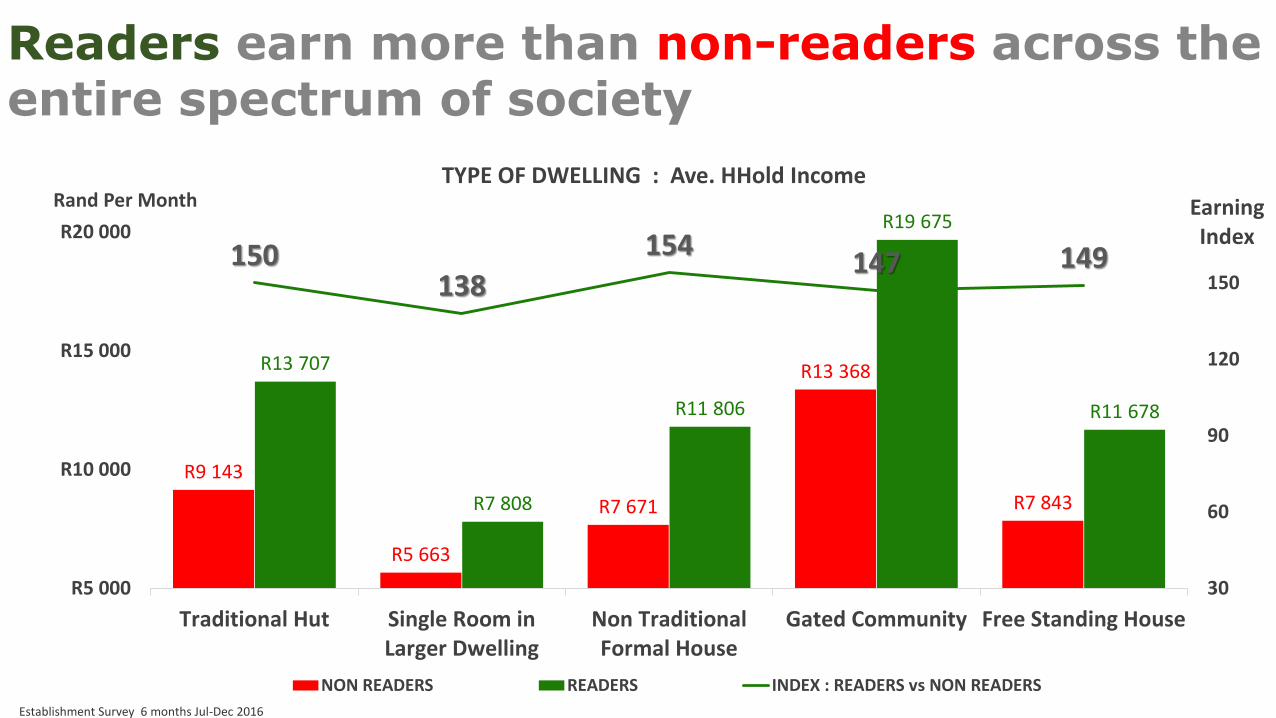
R9 143
R5 663
R7 671
R13 368
R7 843
R13 707
R7 808
R11 806
R19 675
R11 678
150 138
154 147 149
30
60
90
120
150
R5 000
R10 000
R15 000
R20 000
Traditional Hut Single Room inLarger Dwelling
Non TraditionalFormal House
Gated Community Free Standing House
Earning Index
Rand Per Month TYPE OF DWELLING : Ave. HHold Income
NON READERS READERS INDEX : READERS vs NON READERS
Readers earn more than non-readers across the entire spectrum of society
Establishment Survey 6 months Jul-Dec 2016
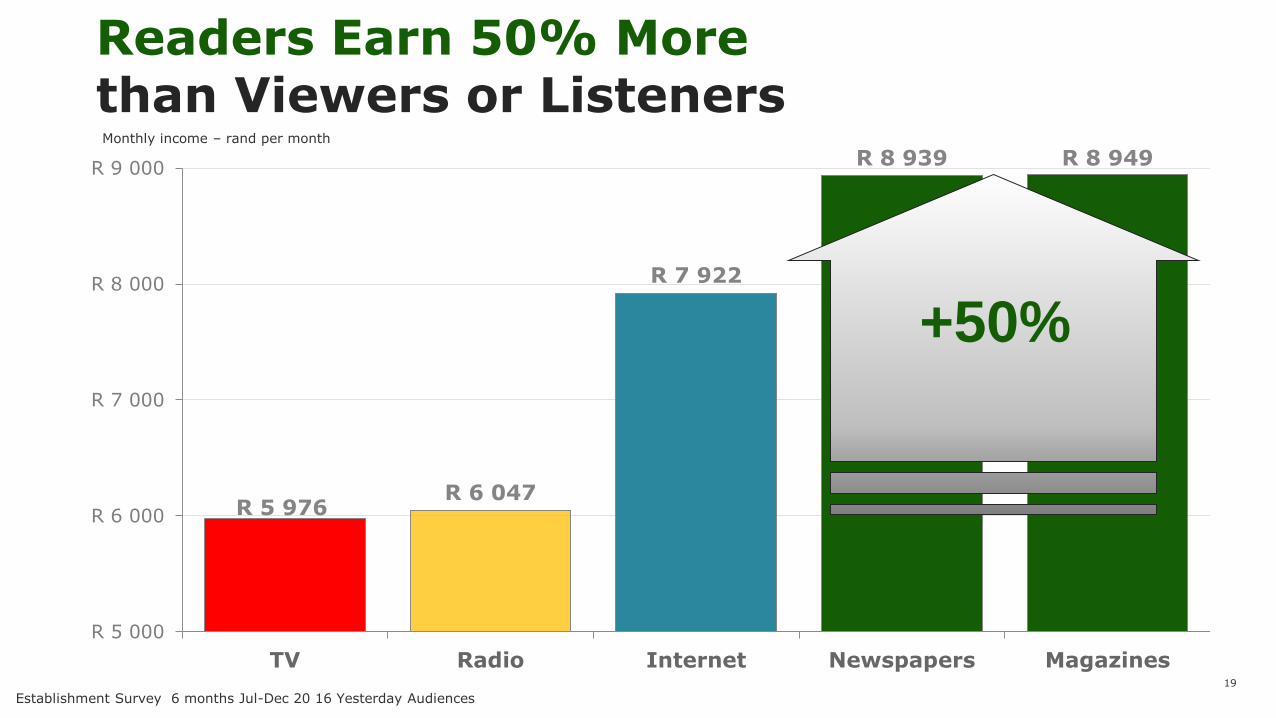
Readers Earn 50% More than Viewers or Listeners
R 5 976 R 6 047
R 7 922
R 8 939 R 8 949
R 5 000
R 6 000
R 7 000
R 8 000
R 9 000
TV Radio Internet Newspapers Magazines19
Establishment Survey 6 months Jul-Dec 20 16 Yesterday Audiences
+50%
Monthly income – rand per month
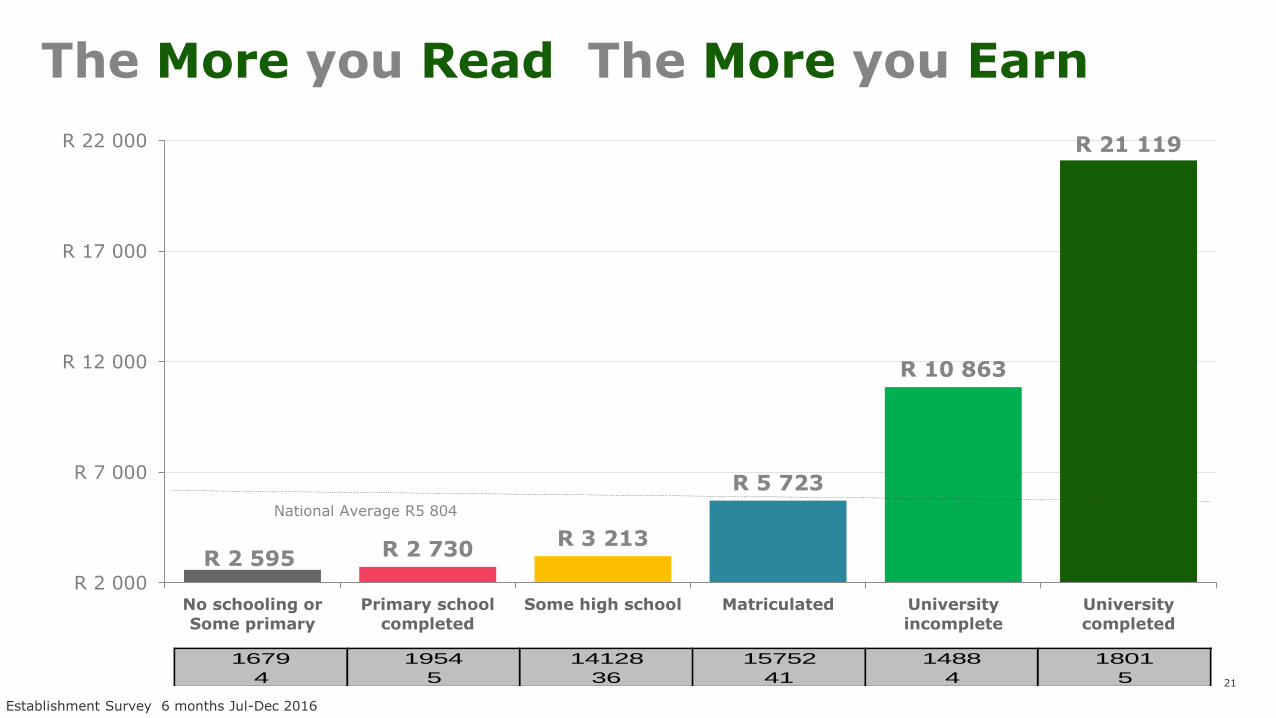
The More you Read The More you Earn
R 2 595 R 2 730 R 3 213
R 5 723
R 10 863
R 21 119
R 2 000
R 7 000
R 12 000
R 17 000
R 22 000
No schooling or
Some primary
Primary school
completed
Some high school Matriculated University
incomplete
University
completed
21
1679 1954 14128 15752 1488 1801
4 5 36 41 4 5
National Average R5 804
Establishment Survey 6 months Jul-Dec 2016
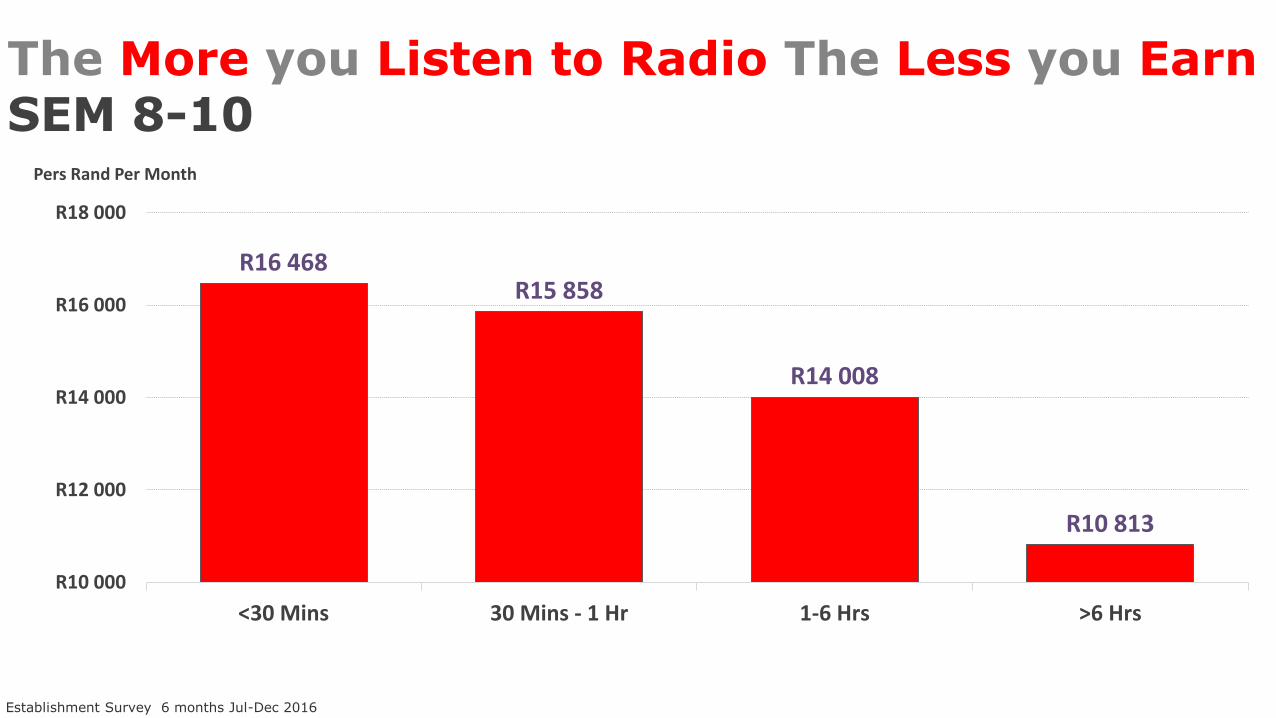
R16 468 R15 858
R14 008
R10 813
R10 000
R12 000
R14 000
R16 000
R18 000
<30 Mins 30 Mins - 1 Hr 1-6 Hrs >6 Hrs
Pers Rand Per Month
Establishment Survey 6 months Jul-Dec 2016
The More you Listen to Radio The Less you Earn SEM 8-10
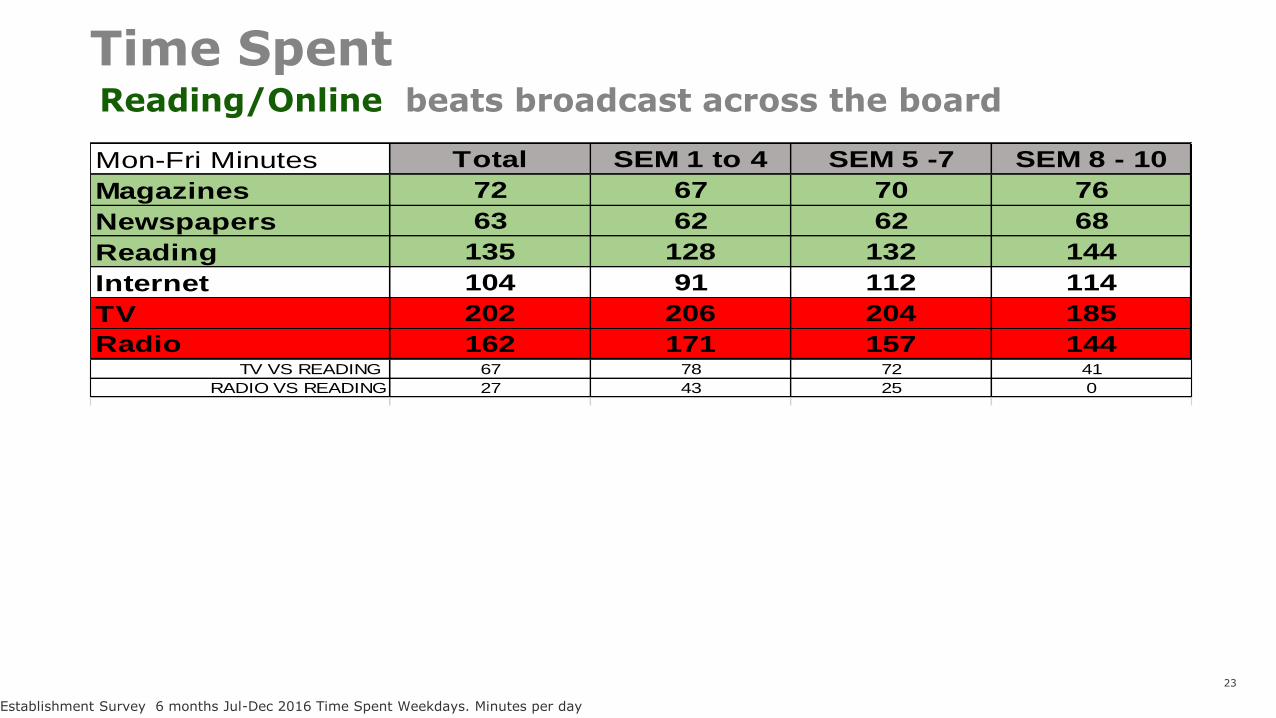
Time Spent Reading Matches Radio at top end
23
Establishment Survey 6 months Jul-Dec 2016 Time Spent Weekdays. Minutes per day
Mon-Fri Minutes Total SEM 1 to 4 SEM 5 -7 SEM 8 - 10
Magazines 72 67 70 76
Newspapers 63 62 62 68
Reading 135 128 132 144
Internet 104 91 112 114
TV 202 206 204 185
Radio 162 171 157 144TV VS READING 67 78 72 41
RADIO VS READING 27 43 25 0
Mon-Fri Minutes Total SEM 1 to 4 SEM 5 -7 SEM 8 - 10
Magazines 72 67 70 76
Newspapers 63 62 62 68
Internet 104 91 112 114
Reading/ Online 239 220 244 258
TV 202 206 204 185
Radio 162 171 157 144TV VS READ/ ONLINE -38 -13 -40 -74
RADIO VS READ/ONLINE -77 -49 -87 -114
Reading/Online beats broadcast across the board
24
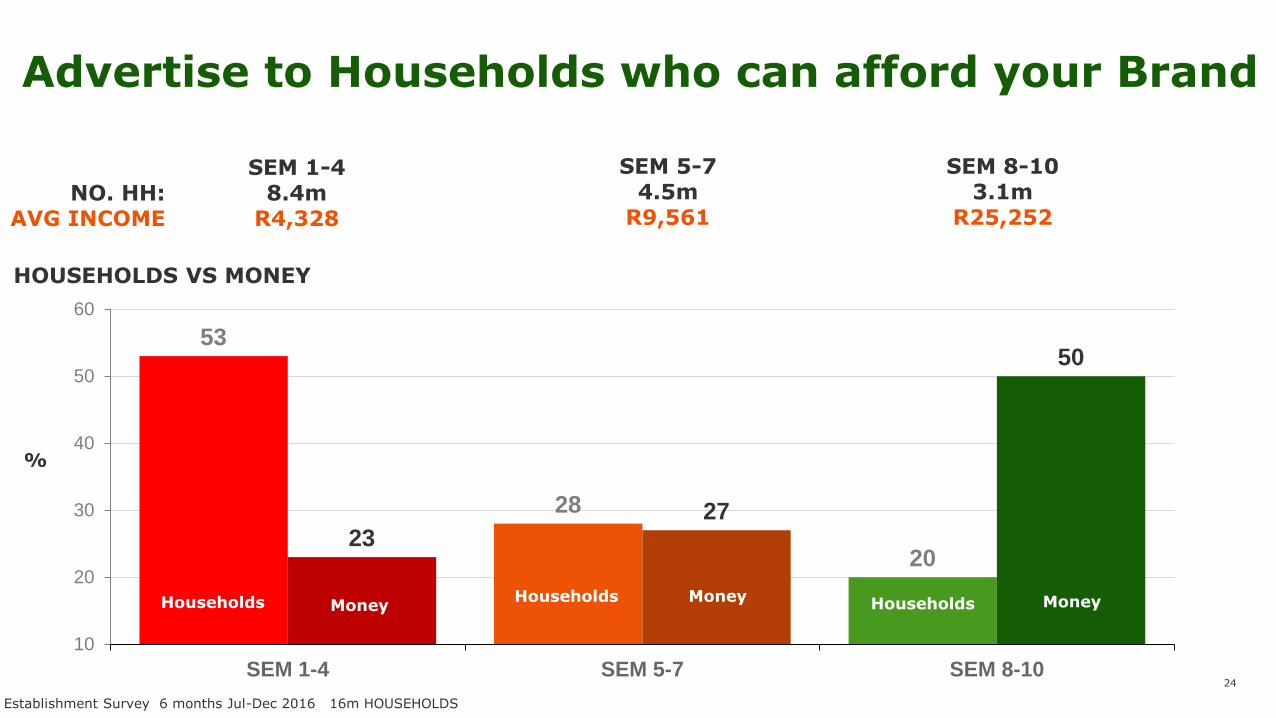
Advertise to Households who can afford your Brand
SEM 1-4 8.4m
R4,328
SEM 5-7 4.5m
R9,561
SEM 8-10 3.1m
R25,252
53
28
20 23
27
50
10
20
30
40
50
60
SEM 1-4 SEM 5-7 SEM 8-10
Households Money Households Money Households Money
HOUSEHOLDS VS MONEY
%
NO. HH: AVG INCOME
Establishment Survey 6 months Jul-Dec 2016 16m HOUSEHOLDS
25
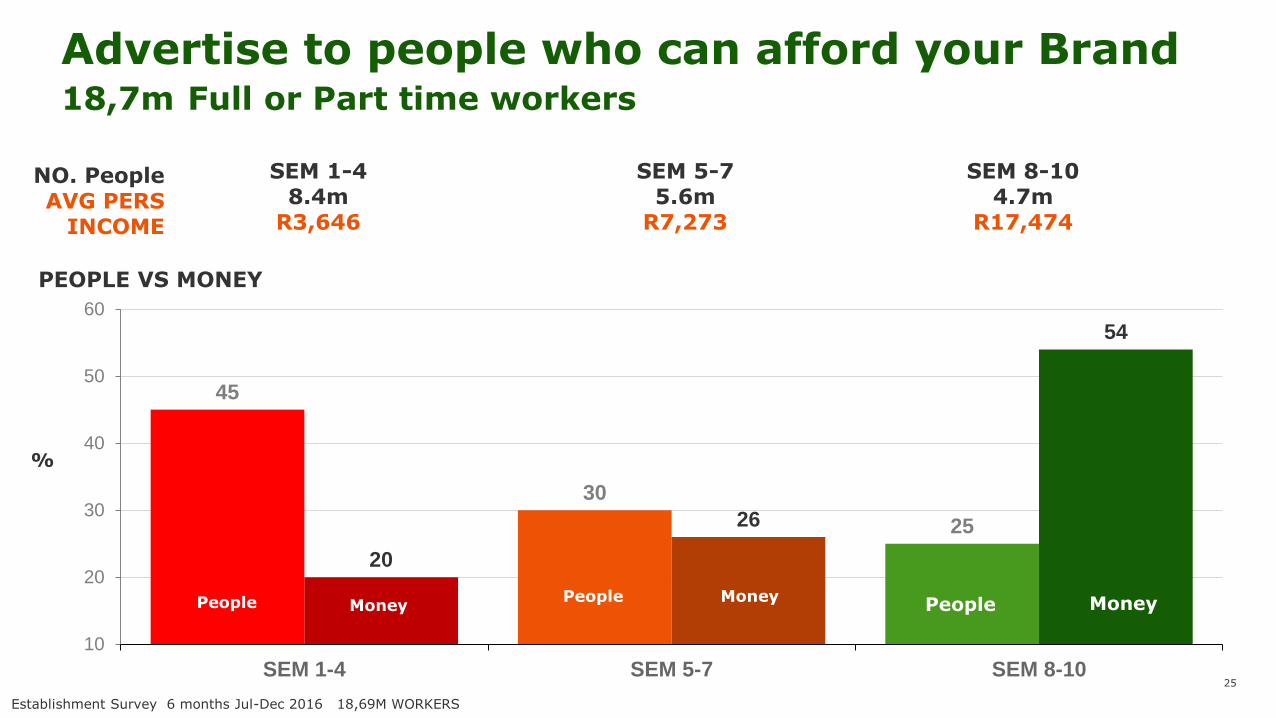
Advertise to people who can afford your Brand 18,7m Full or Part time workers
SEM 1-4 8.4m
R3,646
SEM 5-7 5.6m
R7,273
SEM 8-10 4.7m
R17,474
45
30
25
20
26
54
10
20
30
40
50
60
SEM 1-4 SEM 5-7 SEM 8-10
People Money People Money People Money
PEOPLE VS MONEY
%
NO. People AVG PERS
INCOME
Establishment Survey 6 months Jul-Dec 2016 18,69M WORKERS
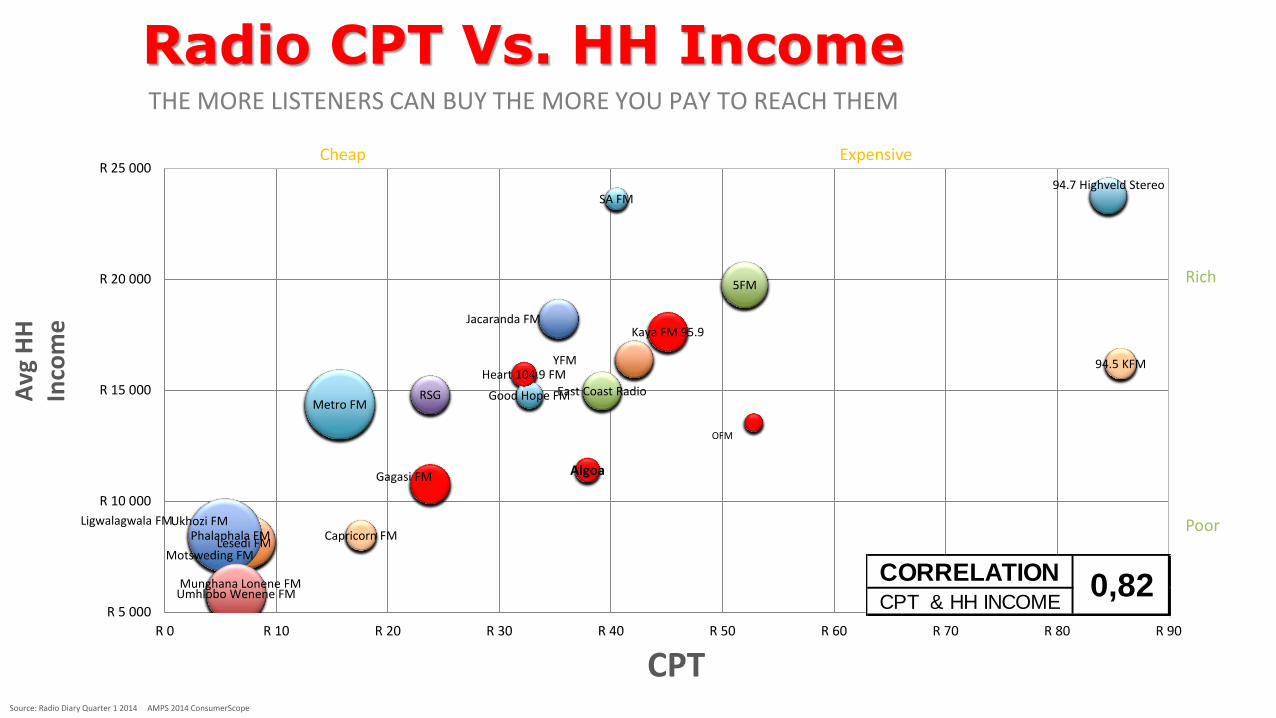
THE MORE LISTENERS CAN BUY THE MORE YOU PAY TO REACH THEM
Umhlobo Wenene FM
5FM
94.5 KFM
94.7 Highveld Stereo
YFM
Algoa
Capricorn FM
East Coast Radio
Gagasi FM
Good Hope FM
Heart 104.9 FM
Jacaranda FM Kaya FM 95.9
Lesedi FM
Ligwalagwala FM
Metro FM
Motsweding FM
Munghana Lonene FM
OFM
Phalaphala FM
RSG
SA FM
Ukhozi FM
R 5 000
R 10 000
R 15 000
R 20 000
R 25 000
R 0 R 10 R 20 R 30 R 40 R 50 R 60 R 70 R 80 R 90
CPT
Avg
HH
In
com
e
Rich
Poor
Cheap Expensive
Source: Radio Diary Quarter 1 2014 AMPS 2014 ConsumerScope
CORRELATIONCPT & HH INCOME
0,82
Radio CPT Vs. HH Income

Magazine Platform Overlap…
27
PAST MONTH READERS (Universe 6.9m)
PAPER 6.2m 90%
ONLINE 2.1m 31%
Average Age 33 34 36
PAPER ONLY
4.9m
71%
ONLINE ONLY
700k
10%
BOTH
1.3m
19%
Project Media View: evaluation
of media engagement
Research to determine the attitudes
and perceptions consumers have of
reading relative to other media
April 2017
E ngaged
3.16cm
4.75cm
6.34cm
7.93cm
9.52cm
11.11cm
12.70cm
14.29cm
15.87cm
17.00cm
1.00cm 3.70cm 6.40cm 9.10cm 11.80cm 14.50cm 17.20cm 9.90cm 22.60cm 25.30cm 27.99cm 30.69cm 32.85cm30.16cm27.46cm24.76cm22.07cm19.37cm16.67cm13.98cm11.28cm8.59cm5.89cm3.19cm
Content Bottom
Content Top
Heading
Baseline
Left Margin Right Margin
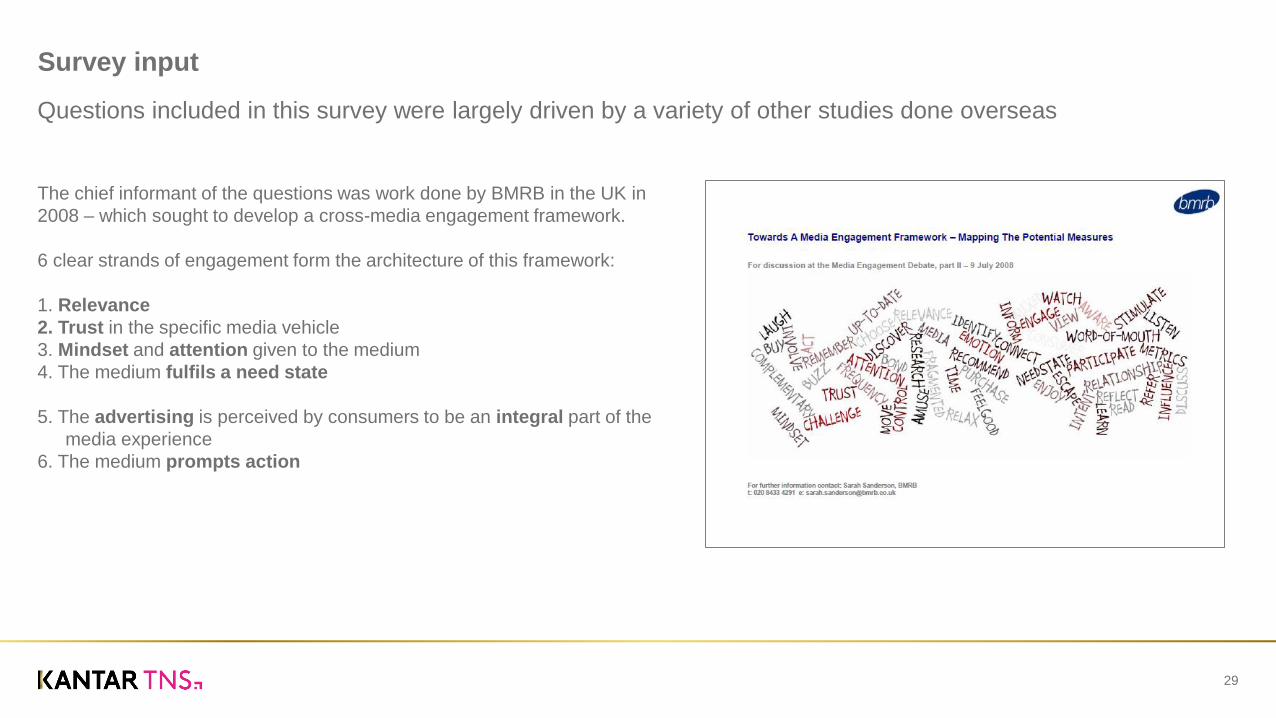
Survey input
29
Questions included in this survey were largely driven by a variety of other studies done overseas
The chief informant of the questions was work done by BMRB in the UK in
2008 – which sought to develop a cross-media engagement framework.
6 clear strands of engagement form the architecture of this framework:
1. Relevance
2. Trust in the specific media vehicle
3. Mindset and attention given to the medium
4. The medium fulfils a need state
5. The advertising is perceived by consumers to be an integral part of the
media experience
6. The medium prompts action

3.16cm
4.75cm
6.34cm
7.93cm
9.52cm
11.11cm
12.70cm
14.29cm
15.87cm
17.00cm
1.00cm 3.70cm 6.40cm 9.10cm 11.80cm 14.50cm 17.20cm 9.90cm 22.60cm 25.30cm 27.99cm 30.69cm 32.85cm30.16cm27.46cm24.76cm22.07cm19.37cm16.67cm13.98cm11.28cm8.59cm5.89cm3.19cm
Content Bottom
Content Top
Heading
Baseline
Left Margin Right Margin
What aspects of ‘engagement’ did we cover?
30
The survey included both attitudinal as well as behavioural variables – complemented by full demographics
Topic Dimensions
Media consumption Frequency of consuming media
Media attention Time spent on media
Quality of attention Other activities usually doing
Information source Media used for different types
of information
Topic Dimensions
Satisfaction Overall rating
Depth of information Deeper understanding rating
Media positioning Media associations
Media positioning Advertising associations
Behaviour Attitudinal perceptions
3.16cm
4.75cm
6.34cm
7.93cm
9.52cm
11.11cm
12.70cm
14.29cm
15.87cm
17.00cm
1.00cm 3.70cm 6.40cm 9.10cm 11.80cm 14.50cm 17.20cm 9.90cm 22.60cm 25.30cm 27.99cm 30.69cm 32.85cm30.16cm27.46cm24.76cm22.07cm19.37cm16.67cm13.98cm11.28cm8.59cm5.89cm3.19cm
Content Bottom
Content Top
Heading
Baseline
Left Margin Right Margin
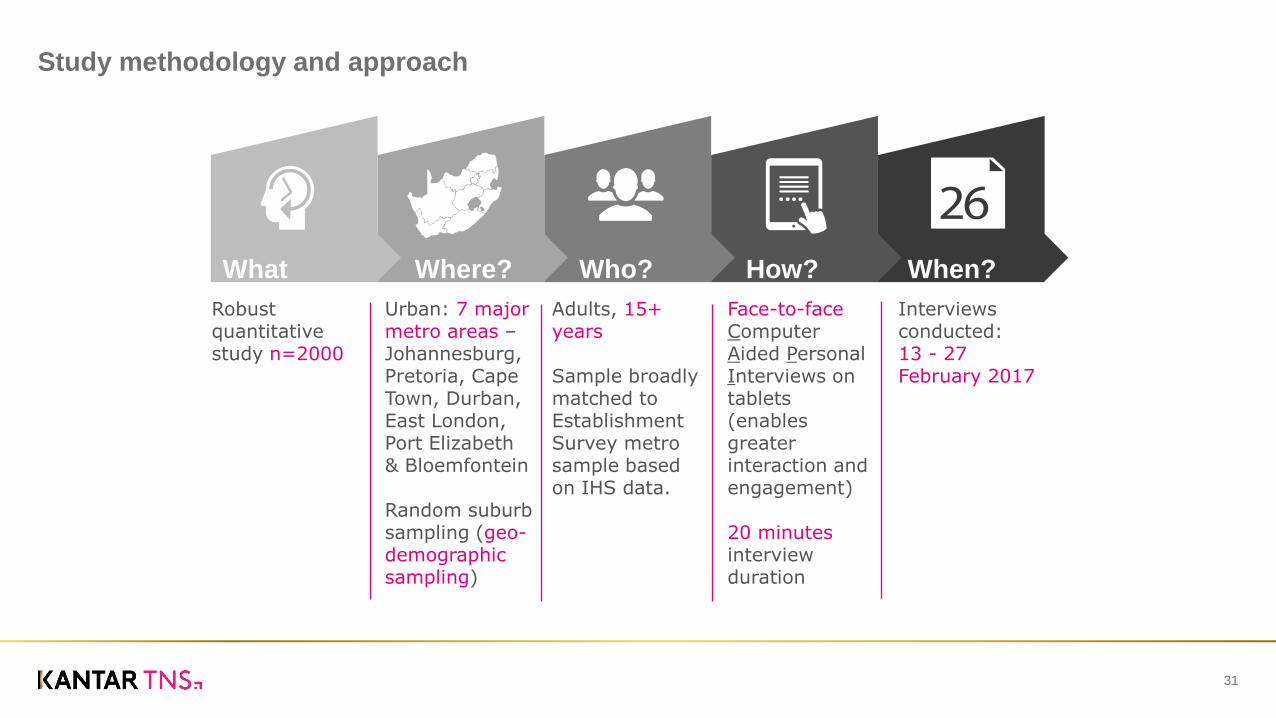
Study methodology and approach
31
What How? When? Who? Where?
Robust quantitative study n=2000
Urban: 7 major metro areas – Johannesburg, Pretoria, Cape Town, Durban, East London, Port Elizabeth & Bloemfontein
Random suburb sampling (geo-demographic sampling)
Interviews conducted: 13 - 27 February 2017
Adults, 15+ years
Sample broadly matched to Establishment Survey metro sample based on IHS data.
Face-to-face Computer Aided Personal Interviews on tablets (enables greater interaction and engagement)
20 minutes interview duration
3.16cm
4.75cm
6.34cm
7.93cm
9.52cm
11.11cm
12.70cm
14.29cm
15.87cm
17.00cm
1.00cm 3.70cm 6.40cm 9.10cm 11.80cm 14.50cm 17.20cm 9.90cm 22.60cm 25.30cm 27.99cm 30.69cm 32.85cm30.16cm27.46cm24.76cm22.07cm19.37cm16.67cm13.98cm11.28cm8.59cm5.89cm3.19cm
Content Bottom
Content Top
Heading
Baseline
Left Margin Right Margin
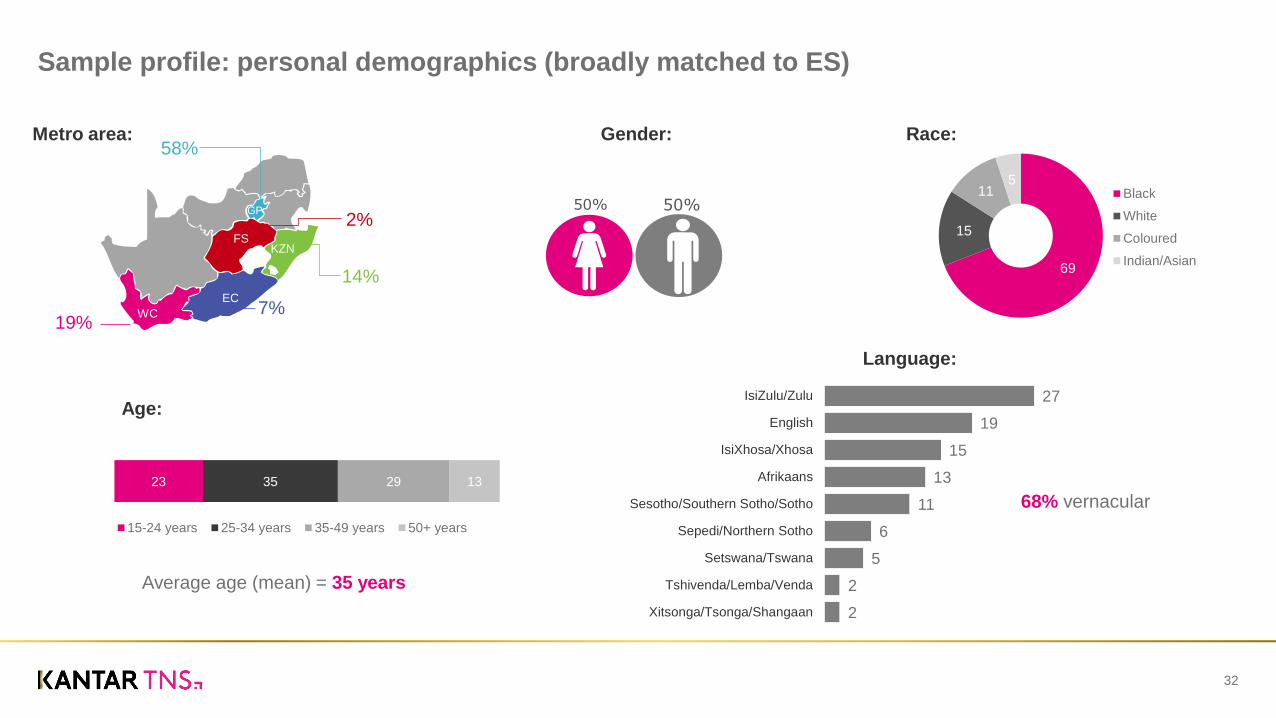
Sample profile: personal demographics (broadly matched to ES)
32
GP
WC
EC
FS KZN
58%
19%
14%
2%
7%
Metro area:
50% 50%
Gender:
23 35 29 13
15-24 years 25-34 years 35-49 years 50+ years
Age:
69
15
11 5
Black
White
Coloured
Indian/Asian
Race:
Language:
Average age (mean) = 35 years
27
19
15
13
11
6
5
2
2
IsiZulu/Zulu
English
IsiXhosa/Xhosa
Afrikaans
Sesotho/Southern Sotho/Sotho
Sepedi/Northern Sotho
Setswana/Tswana
Tshivenda/Lemba/Venda
Xitsonga/Tsonga/Shangaan
68% vernacular
3.16cm
4.75cm
6.34cm
7.93cm
9.52cm
11.11cm
12.70cm
14.29cm
15.87cm
17.00cm
1.00cm 3.70cm 6.40cm 9.10cm 11.80cm 14.50cm 17.20cm 9.90cm 22.60cm 25.30cm 27.99cm 30.69cm 32.85cm30.16cm27.46cm24.76cm22.07cm19.37cm16.67cm13.98cm11.28cm8.59cm5.89cm3.19cm
Content Bottom
Content Top
Heading
Baseline
Left Margin Right Margin
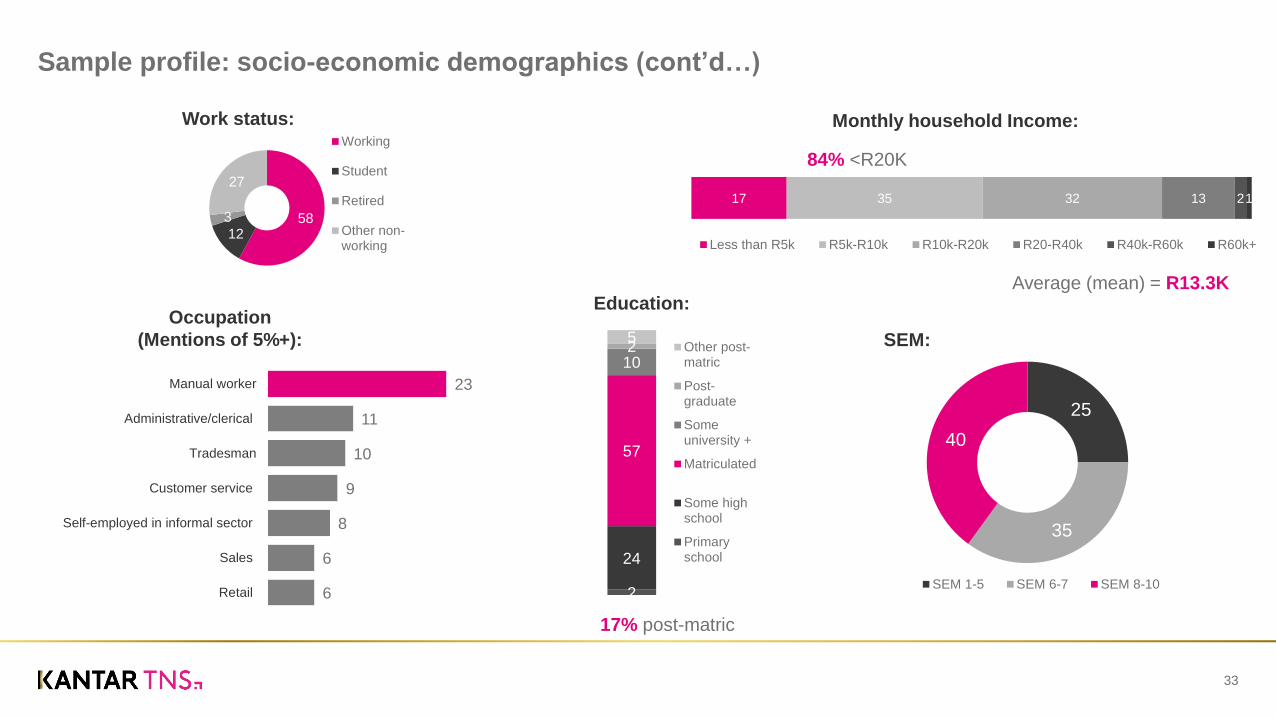
17 35 32 13 2 1
Less than R5k R5k-R10k R10k-R20k R20-R40k R40k-R60k R60k+
Sample profile: socio-economic demographics (cont’d…)
33
58 12
3
27
Working
Student
Retired
Other non-working
Work status:
Occupation
(Mentions of 5%+):
Monthly household Income:
25
35
40
SEM 1-5 SEM 6-7 SEM 8-10
SEM:
23
11
10
9
8
6
6
Manual worker
Administrative/clerical
Tradesman
Customer service
Self-employed in informal sector
Sales
Retail
Education:
2
24
57
10 2 5
Other post-matric
Post-graduate
Someuniversity +
Matriculated
Some highschool
Primaryschool
17% post-matric
Average (mean) = R13.3K
84% <R20K
3.16cm
4.75cm
6.34cm
7.93cm
9.52cm
11.11cm
12.70cm
14.29cm
15.87cm
17.00cm
1.00cm 3.70cm 6.40cm 9.10cm 11.80cm 14.50cm 17.20cm 9.90cm 22.60cm 25.30cm 27.99cm 30.69cm 32.85cm30.16cm27.46cm24.76cm22.07cm19.37cm16.67cm13.98cm11.28cm8.59cm5.89cm3.19cm
Content Bottom
Content Top
Heading
Baseline
Left Margin Right Margin
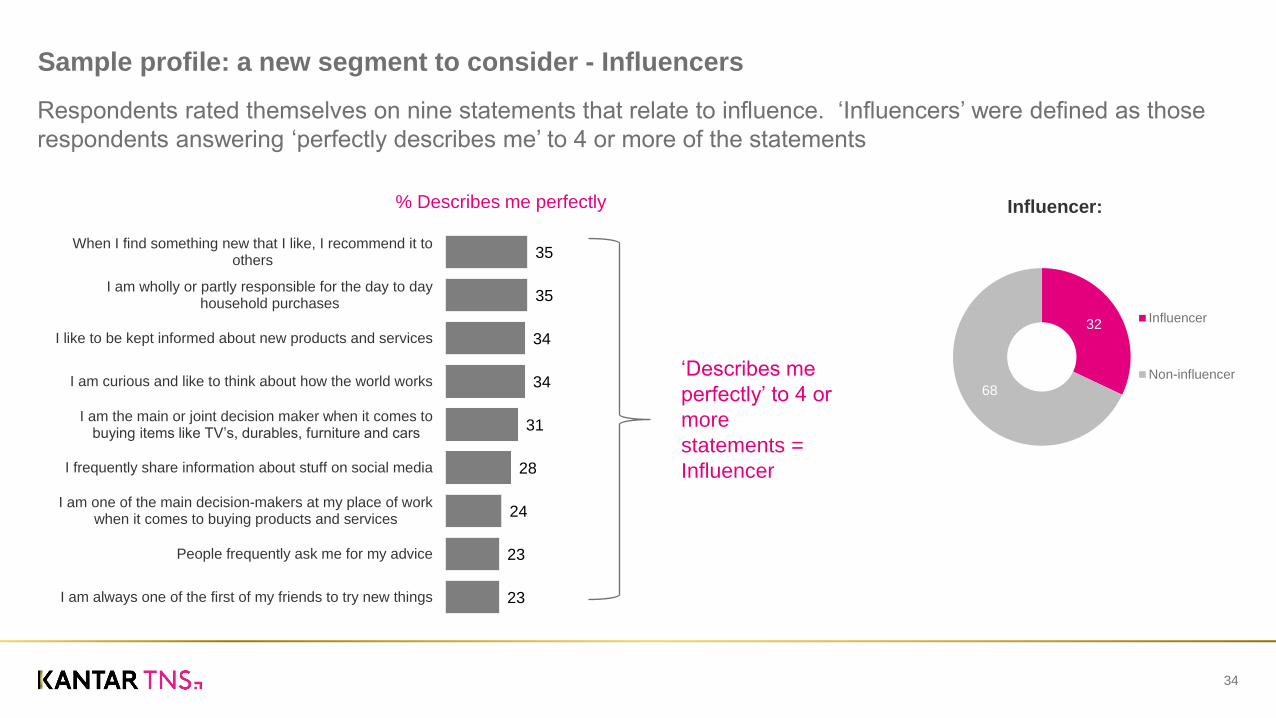
Sample profile: a new segment to consider - Influencers
34
32
68
Influencer
Non-influencer
Influencer:
35
35
34
34
31
28
24
23
23
When I find something new that I like, I recommend it toothers
I am wholly or partly responsible for the day to dayhousehold purchases
I like to be kept informed about new products and services
I am curious and like to think about how the world works
I am the main or joint decision maker when it comes to buying items like TV’s, durables, furniture and cars
I frequently share information about stuff on social media
I am one of the main decision-makers at my place of workwhen it comes to buying products and services
People frequently ask me for my advice
I am always one of the first of my friends to try new things
% Describes me perfectly
‘Describes me
perfectly’ to 4 or
more
statements =
Influencer
Respondents rated themselves on nine statements that relate to influence. ‘Influencers’ were defined as those
respondents answering ‘perfectly describes me’ to 4 or more of the statements
3.16cm
4.75cm
6.34cm
7.93cm
9.52cm
11.11cm
12.70cm
14.29cm
15.87cm
17.00cm
1.00cm 3.70cm 6.40cm 9.10cm 11.80cm 14.50cm 17.20cm 9.90cm 22.60cm 25.30cm 27.99cm 30.69cm 32.85cm30.16cm27.46cm24.76cm22.07cm19.37cm16.67cm13.98cm11.28cm8.59cm5.89cm3.19cm
Content Bottom
Content Top
Heading
Baseline
Left Margin Right Margin
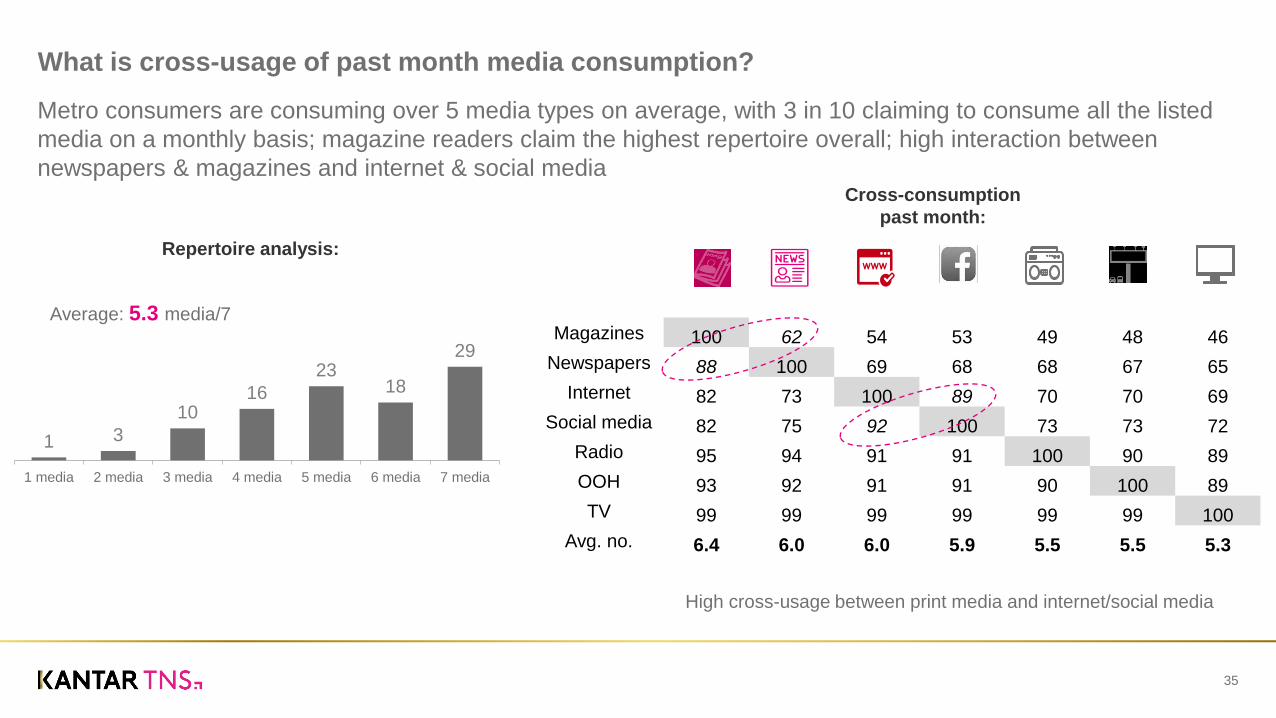
What is cross-usage of past month media consumption?
35
Metro consumers are consuming over 5 media types on average, with 3 in 10 claiming to consume all the listed
media on a monthly basis; magazine readers claim the highest repertoire overall; high interaction between
newspapers & magazines and internet & social media
1 3
10 16
23 18
29
1 media 2 media 3 media 4 media 5 media 6 media 7 media
Repertoire analysis:
Average: 5.3 media/7 Magazines 100 62 54 53 49 48 46
Newspapers 88 100 69 68 68 67 65
Internet 82 73 100 89 70 70 69
Social media 82 75 92 100 73 73 72
Radio 95 94 91 91 100 90 89
OOH 93 92 91 91 90 100 89
TV 99 99 99 99 99 99 100
Avg. no. 6.4 6.0 6.0 5.9 5.5 5.5 5.3
Cross-consumption
past month:
High cross-usage between print media and internet/social media
3.16cm
4.75cm
6.34cm
7.93cm
9.52cm
11.11cm
12.70cm
14.29cm
15.87cm
17.00cm
1.00cm 3.70cm 6.40cm 9.10cm 11.80cm 14.50cm 17.20cm 9.90cm 22.60cm 25.30cm 27.99cm 30.69cm 32.85cm30.16cm27.46cm24.76cm22.07cm19.37cm16.67cm13.98cm11.28cm8.59cm5.89cm3.19cm
Content Bottom
Content Top
Heading
Baseline
Left Margin Right Margin
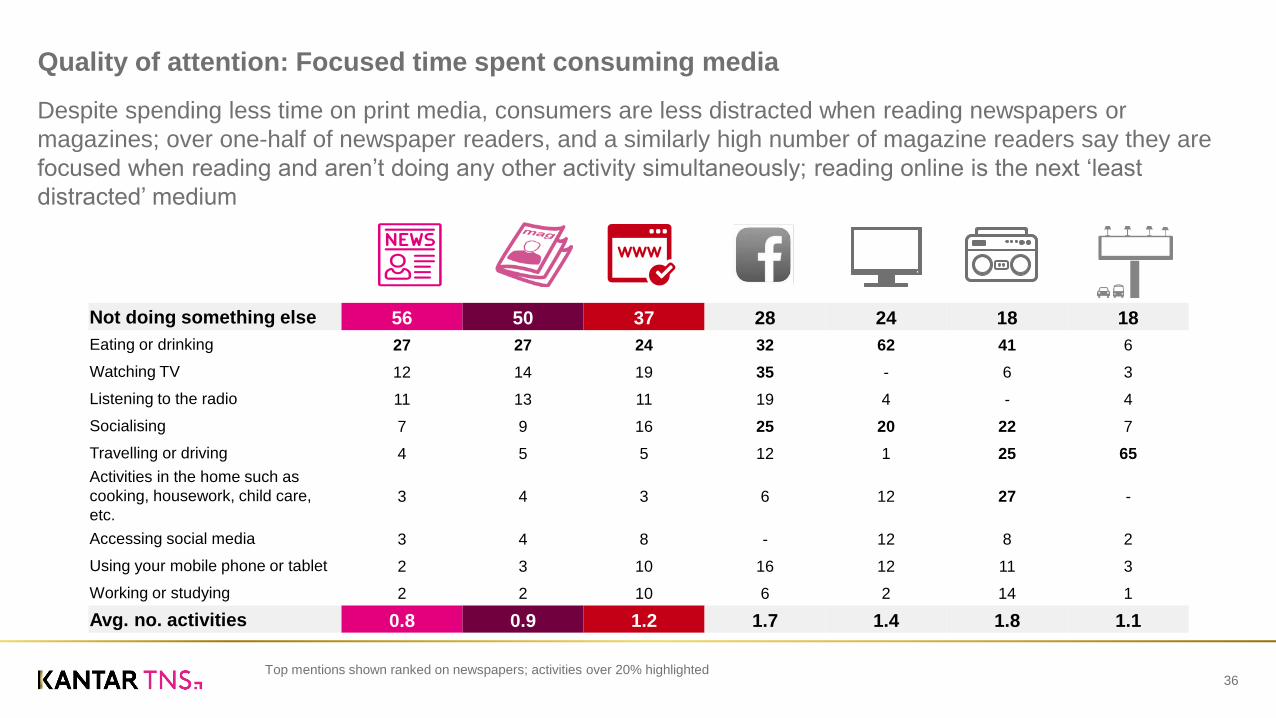
Quality of attention: Focused time spent consuming media
36
Despite spending less time on print media, consumers are less distracted when reading newspapers or
magazines; over one-half of newspaper readers, and a similarly high number of magazine readers say they are
focused when reading and aren’t doing any other activity simultaneously; reading online is the next ‘least
distracted’ medium
Not doing something else 56 50 37 28 24 18 18
Eating or drinking 27 27 24 32 62 41 6
Watching TV 12 14 19 35 - 6 3
Listening to the radio 11 13 11 19 4 - 4
Socialising 7 9 16 25 20 22 7
Travelling or driving 4 5 5 12 1 25 65
Activities in the home such as
cooking, housework, child care,
etc. 3 4 3 6 12 27 -
Accessing social media 3 4 8 - 12 8 2
Using your mobile phone or tablet 2 3 10 16 12 11 3
Working or studying 2 2 10 6 2 14 1
Avg. no. activities 0.8 0.9 1.2 1.7 1.4 1.8 1.1
Top mentions shown ranked on newspapers; activities over 20% highlighted
3.16cm
4.75cm
6.34cm
7.93cm
9.52cm
11.11cm
12.70cm
14.29cm
15.87cm
17.00cm
1.00cm 3.70cm 6.40cm 9.10cm 11.80cm 14.50cm 17.20cm 9.90cm 22.60cm 25.30cm 27.99cm 30.69cm 32.85cm30.16cm27.46cm24.76cm22.07cm19.37cm16.67cm13.98cm11.28cm8.59cm5.89cm3.19cm
Content Bottom
Content Top
Heading
Baseline
Left Margin Right Margin
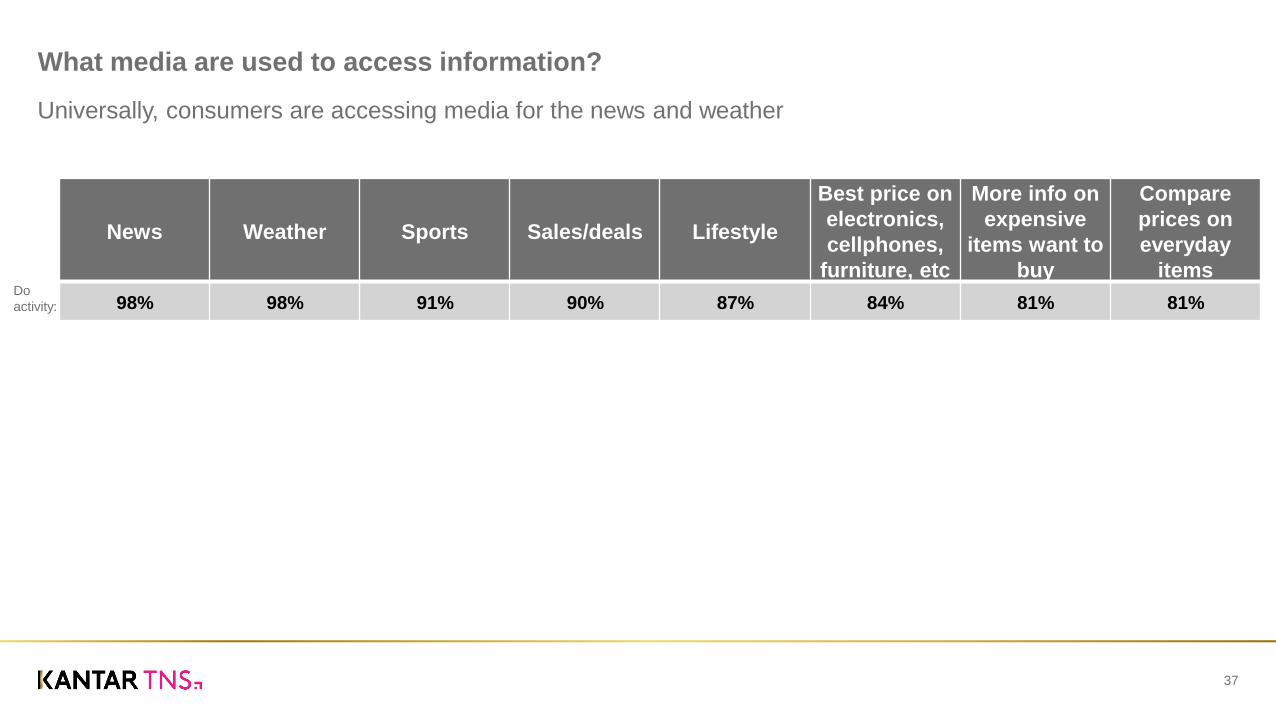
News Weather Sports Sales/deals Lifestyle
Best price on
electronics,
cellphones,
furniture, etc
More info on
expensive
items want to
buy
Compare
prices on
everyday
items
98% 98% 91% 90% 87% 84% 81% 81%
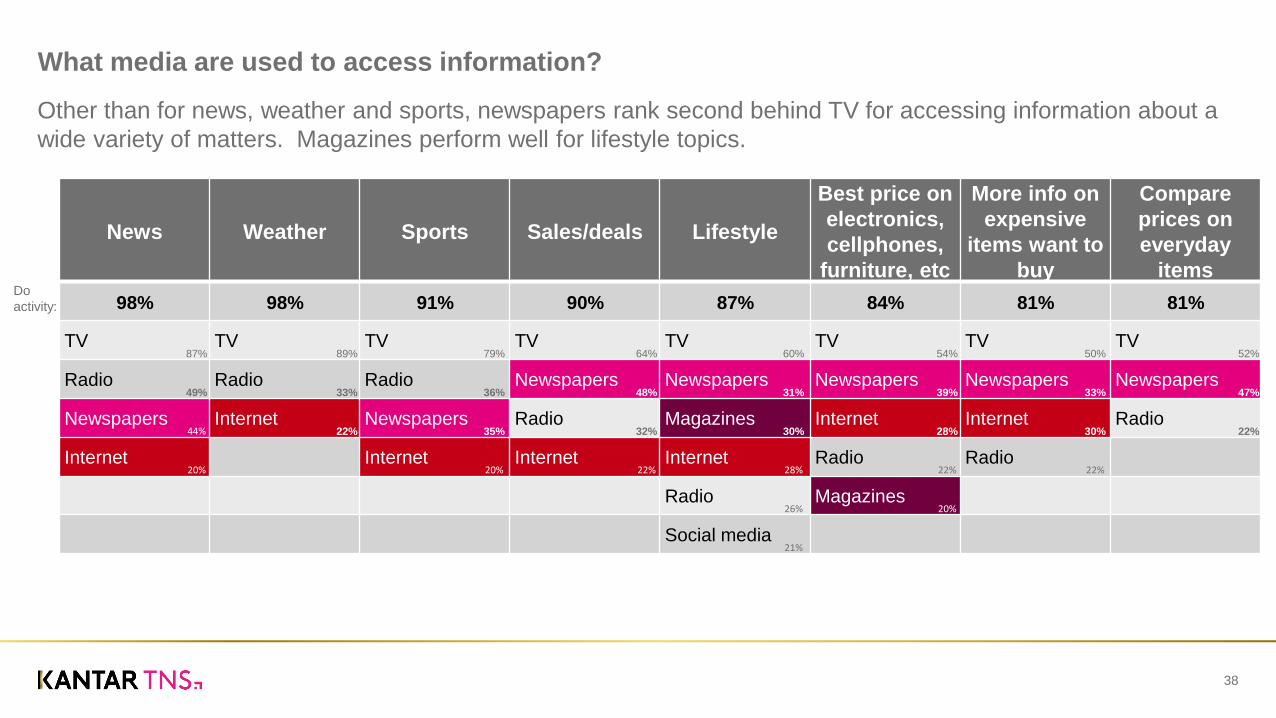
What media are used to access information?
37
Universally, consumers are accessing media for the news and weather
Do
activity:
3.16cm
4.75cm
6.34cm
7.93cm
9.52cm
11.11cm
12.70cm
14.29cm
15.87cm
17.00cm
1.00cm 3.70cm 6.40cm 9.10cm 11.80cm 14.50cm 17.20cm 9.90cm 22.60cm 25.30cm 27.99cm 30.69cm 32.85cm30.16cm27.46cm24.76cm22.07cm19.37cm16.67cm13.98cm11.28cm8.59cm5.89cm3.19cm
Content Bottom
Content Top
Heading
Baseline
Left Margin Right Margin
News Weather Sports Sales/deals Lifestyle
Best price on
electronics,
cellphones,
furniture, etc
More info on
expensive
items want to
buy
Compare
prices on
everyday
items
98% 98% 91% 90% 87% 84% 81% 81%
TV TV TV TV TV TV TV TV
Radio Radio Radio Newspapers Newspapers Newspapers Newspapers Newspapers
Newspapers Internet Newspapers Radio Magazines Internet Internet Radio
Internet Internet Internet Internet Radio Radio
Radio Magazines
Social media
What media are used to access information?
38
Other than for news, weather and sports, newspapers rank second behind TV for accessing information about a
wide variety of matters. Magazines perform well for lifestyle topics.
Do
activity:
87%
49%
44%
20%
89%
33%
22%
79%
36%
35%
20%
64%
48%
32%
22%
60%
31%
30%
28%
26%
21%
54%
39%
28%
22%
20%
50%
33%
30%
22%
52%
47%
22%
3.16cm
4.75cm
6.34cm
7.93cm
9.52cm
11.11cm
12.70cm
14.29cm
15.87cm
17.00cm
1.00cm 3.70cm 6.40cm 9.10cm 11.80cm 14.50cm 17.20cm 9.90cm 22.60cm 25.30cm 27.99cm 30.69cm 32.85cm30.16cm27.46cm24.76cm22.07cm19.37cm16.67cm13.98cm11.28cm8.59cm5.89cm3.19cm
Content Bottom
Content Top
Heading
Baseline
Left Margin Right Margin
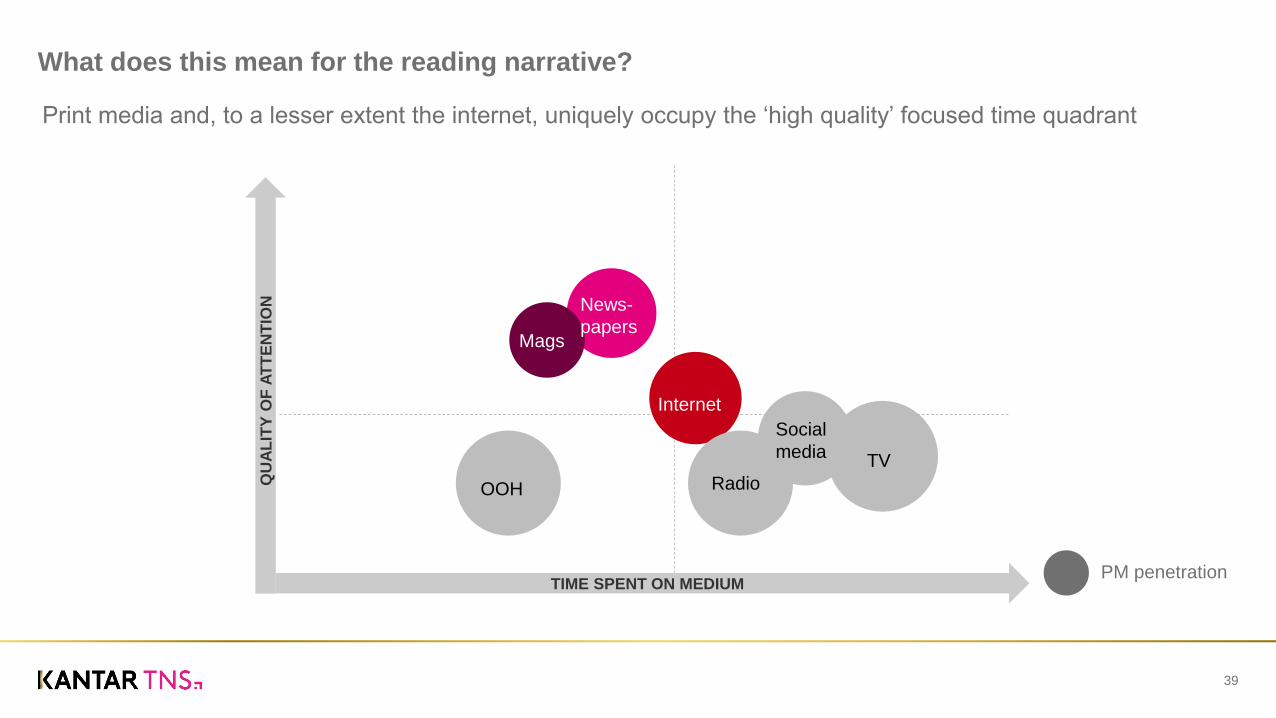
What does this mean for the reading narrative?
39
QU
AL
ITY
OF
AT
TE
NT
ION
TIME SPENT ON MEDIUM
OOH
TV
Radio
Social
media
Internet
News-
papers Mags
Print media and, to a lesser extent the internet, uniquely occupy the ‘high quality’ focused time quadrant
PM penetration
3.16cm
4.75cm
6.34cm
7.93cm
9.52cm
11.11cm
12.70cm
14.29cm
15.87cm
17.00cm
1.00cm 3.70cm 6.40cm 9.10cm 11.80cm 14.50cm 17.20cm 9.90cm 22.60cm 25.30cm 27.99cm 30.69cm 32.85cm30.16cm27.46cm24.76cm22.07cm19.37cm16.67cm13.98cm11.28cm8.59cm5.89cm3.19cm
Content Bottom
Content Top
Heading
Baseline
Left Margin Right Margin
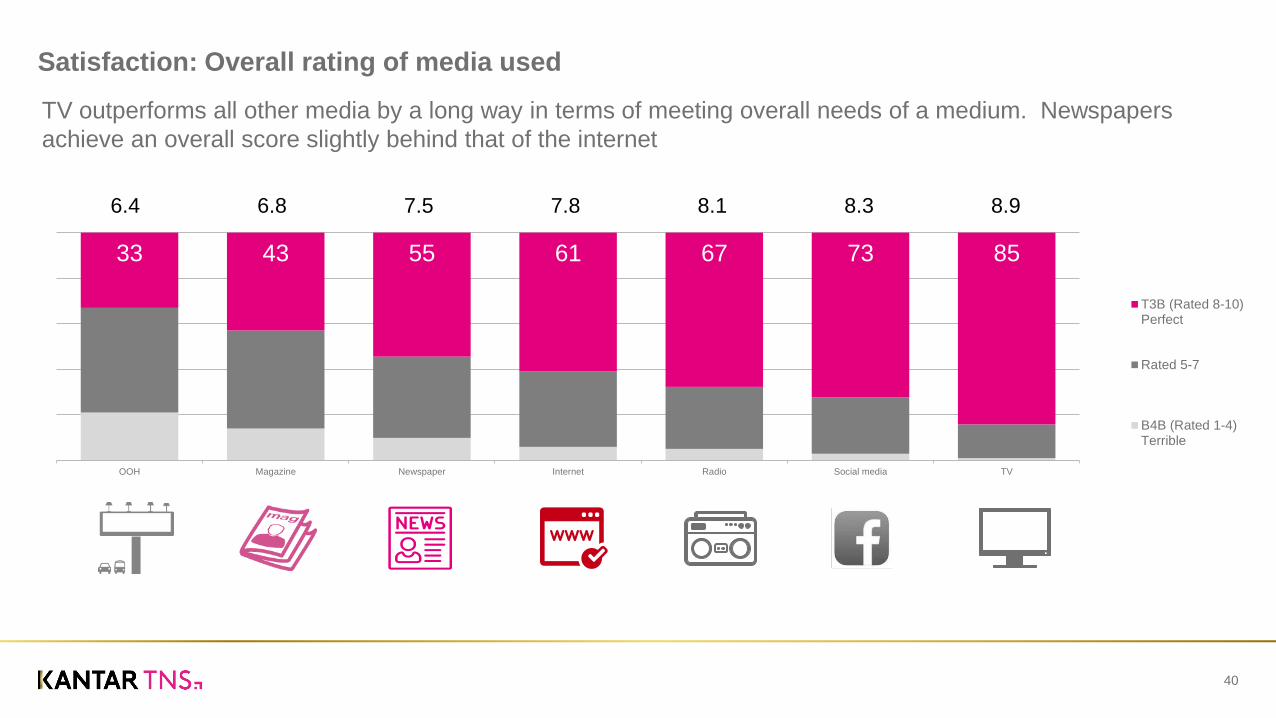
Satisfaction: Overall rating of media used
40
TV outperforms all other media by a long way in terms of meeting overall needs of a medium. Newspapers
achieve an overall score slightly behind that of the internet
33 43 55 61 67 73 85
OOH Magazine Newspaper Internet Radio Social media TV
T3B (Rated 8-10)Perfect
Rated 5-7
B4B (Rated 1-4)Terrible
6.4 6.8 7.5 7.8 8.1 8.3 8.9
3.16cm
4.75cm
6.34cm
7.93cm
9.52cm
11.11cm
12.70cm
14.29cm
15.87cm
17.00cm
1.00cm 3.70cm 6.40cm 9.10cm 11.80cm 14.50cm 17.20cm 9.90cm 22.60cm 25.30cm 27.99cm 30.69cm 32.85cm30.16cm27.46cm24.76cm22.07cm19.37cm16.67cm13.98cm11.28cm8.59cm5.89cm3.19cm
Content Bottom
Content Top
Heading
Baseline
Left Margin Right Margin
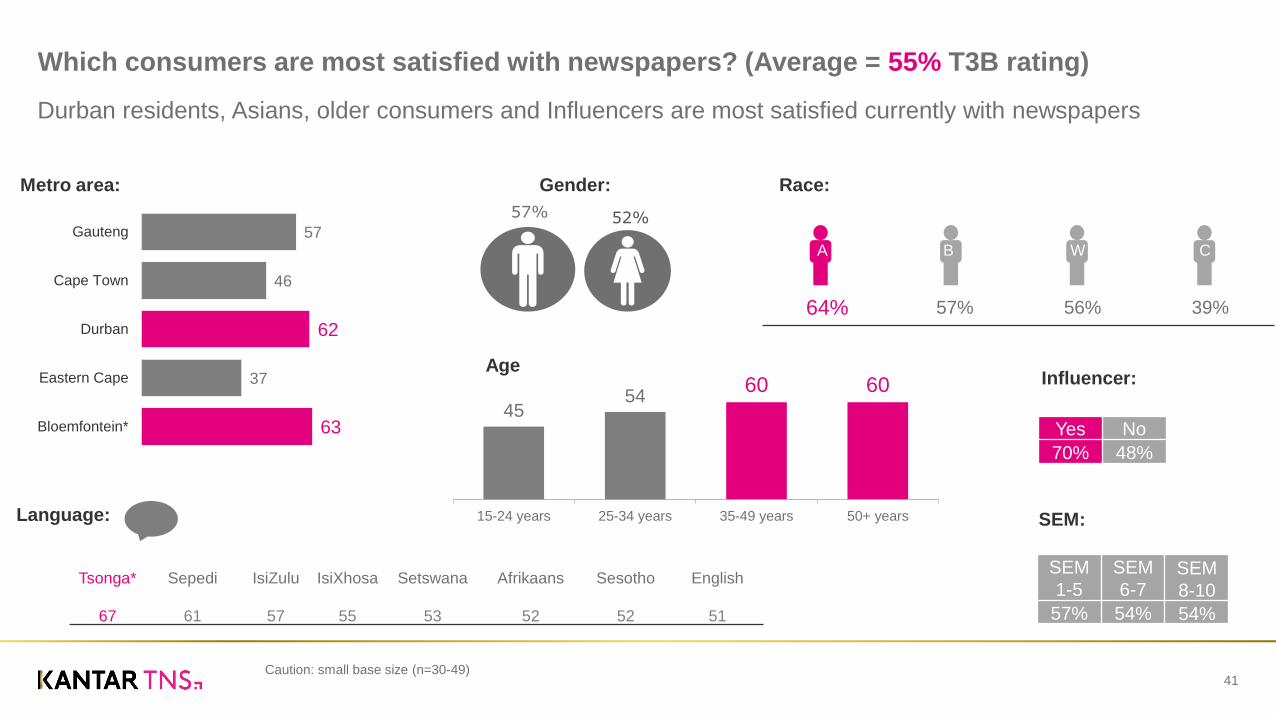
Which consumers are most satisfied with newspapers? (Average = 55% T3B rating)
41
Durban residents, Asians, older consumers and Influencers are most satisfied currently with newspapers
57
46
62
37
63
Gauteng
Cape Town
Durban
Eastern Cape
Bloemfontein*
52% 57%
Gender: Metro area:
Tsonga* Sepedi IsiZulu IsiXhosa Setswana Afrikaans Sesotho English
67 61 57 55 53 52 52 51
A B W C
Race:
Language:
45 54
60 60
15-24 years 25-34 years 35-49 years 50+ years
Age
SEM
1-5
SEM
6-7SEM
8-10
57% 54% 54%
SEM:
Caution: small base size (n=30-49)
Yes No
70% 48%
Influencer:
64% 57% 56% 39%
3.16cm
4.75cm
6.34cm
7.93cm
9.52cm
11.11cm
12.70cm
14.29cm
15.87cm
17.00cm
1.00cm 3.70cm 6.40cm 9.10cm 11.80cm 14.50cm 17.20cm 9.90cm 22.60cm 25.30cm 27.99cm 30.69cm 32.85cm30.16cm27.46cm24.76cm22.07cm19.37cm16.67cm13.98cm11.28cm8.59cm5.89cm3.19cm
Content Bottom
Content Top
Heading
Baseline
Left Margin Right Margin
Drivers of the ideal (media type) (advertising medium)
Relative performance
Differentiation
Imagery perceptions
42
We look at the image associations in 3 different ways …
3.16cm
4.75cm
6.34cm
7.93cm
9.52cm
11.11cm
12.70cm
14.29cm
15.87cm
17.00cm
1.00cm 3.70cm 6.40cm 9.10cm 11.80cm 14.50cm 17.20cm 9.90cm 22.60cm 25.30cm 27.99cm 30.69cm 32.85cm30.16cm27.46cm24.76cm22.07cm19.37cm16.67cm13.98cm11.28cm8.59cm5.89cm3.19cm
Content Bottom
Content Top
Heading
Baseline
Left Margin Right Margin
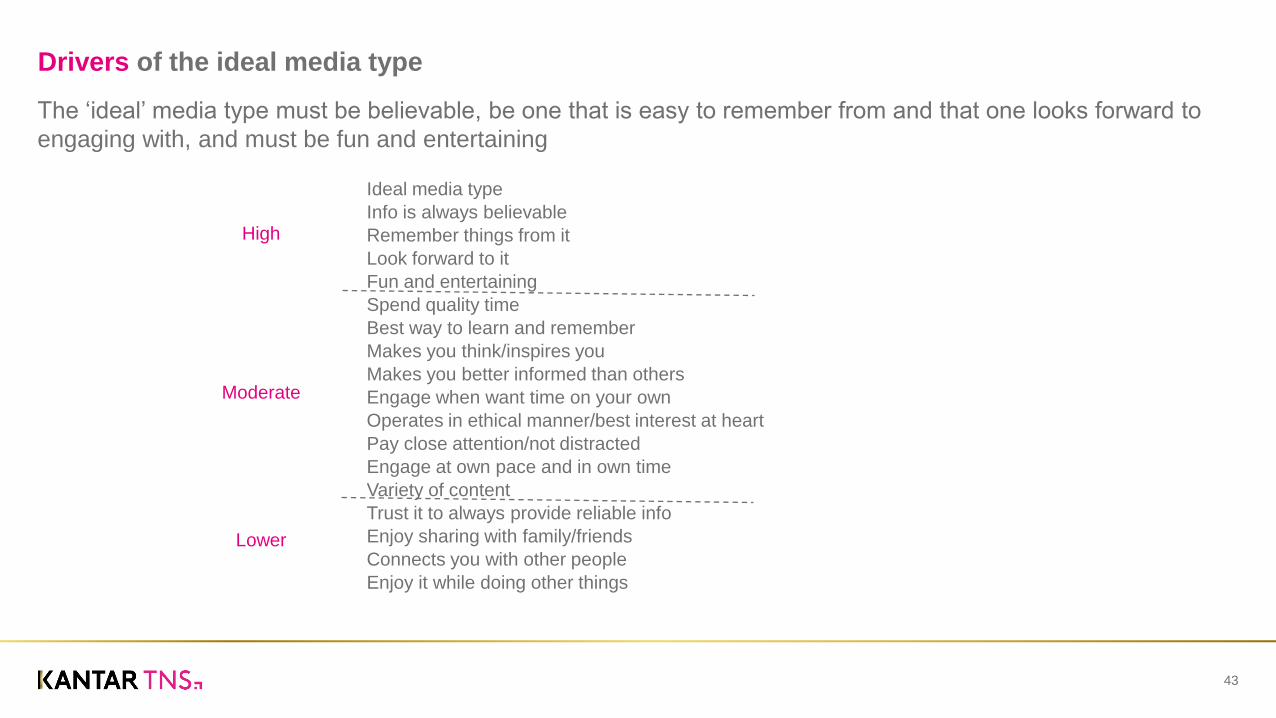
Drivers of the ideal media type
43
The ‘ideal’ media type must be believable, be one that is easy to remember from and that one looks forward to
engaging with, and must be fun and entertaining
Ideal media type
Info is always believable
Remember things from it
Look forward to it
Fun and entertaining
Spend quality time
Best way to learn and remember
Makes you think/inspires you
Makes you better informed than others
Engage when want time on your own
Operates in ethical manner/best interest at heart
Pay close attention/not distracted
Engage at own pace and in own time
Variety of content
Trust it to always provide reliable info
Enjoy sharing with family/friends
Connects you with other people
Enjoy it while doing other things
High
Moderate
Lower
3.16cm
4.75cm
6.34cm
7.93cm
9.52cm
11.11cm
12.70cm
14.29cm
15.87cm
17.00cm
1.00cm 3.70cm 6.40cm 9.10cm 11.80cm 14.50cm 17.20cm 9.90cm 22.60cm 25.30cm 27.99cm 30.69cm 32.85cm30.16cm27.46cm24.76cm22.07cm19.37cm16.67cm13.98cm11.28cm8.59cm5.89cm3.19cm
Content Bottom
Content Top
Heading
Baseline
Left Margin Right Margin
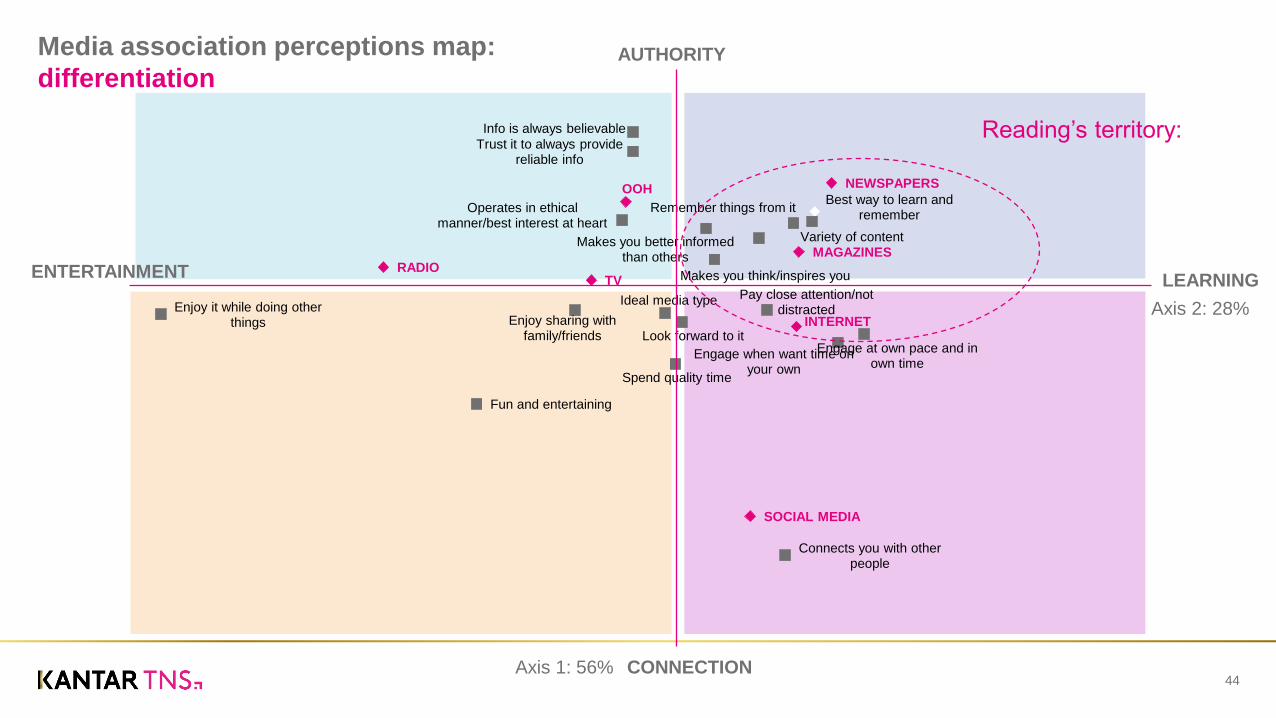
Media association perceptions map:
differentiation
44
NEWSPAPERS
MAGAZINES
TV RADIO
OOH
INTERNET
SOCIAL MEDIA
Ideal media type
Variety of content
Trust it to always provide reliable info
Spend quality time
Look forward to it Enjoy sharing with
family/friends
Pay close attention/not distracted
Best way to learn and remember
Makes you better informed than others
Makes you think/inspires you
Remember things from it
Fun and entertaining
Info is always believable
Connects you with other people
Engage when want time on your own
Operates in ethical manner/best interest at heart
Engage at own pace and in own time
Enjoy it while doing other things
Reading’s territory:
Axis 1: 56%
Axis 2: 28%
ENTERTAINMENT
CONNECTION
LEARNING
AUTHORITY
3.16cm
4.75cm
6.34cm
7.93cm
9.52cm
11.11cm
12.70cm
14.29cm
15.87cm
17.00cm
1.00cm 3.70cm 6.40cm 9.10cm 11.80cm 14.50cm 17.20cm 9.90cm 22.60cm 25.30cm 27.99cm 30.69cm 32.85cm30.16cm27.46cm24.76cm22.07cm19.37cm16.67cm13.98cm11.28cm8.59cm5.89cm3.19cm
Content Bottom
Content Top
Heading
Baseline
Left Margin Right Margin
0 10 20 30 40 50 60 70 80 90 100
Newspaper ads
Magazine ads
TV ads
Radio ads
Ads on Internet notsocial media
Ads on social media(e.g. Facebook)
Inserts, leaflets andpamphlets
Ideal medium
Notice/pay attention to ads
Advertising is relevant/useful
Like the ads
Trust the advertising
Provides info to make best purchase decision
Advertising is entertaining
Able to only look at advertising of interest
Discussed advertising seen/heard
Discussed brand/product after seeing advertising
Bought/used product/service as result of advertising
Looked for more info about product/brand
Allows price comparison
Visited/store outlet result of seeing advertising
Just enough ads to not get annoyed
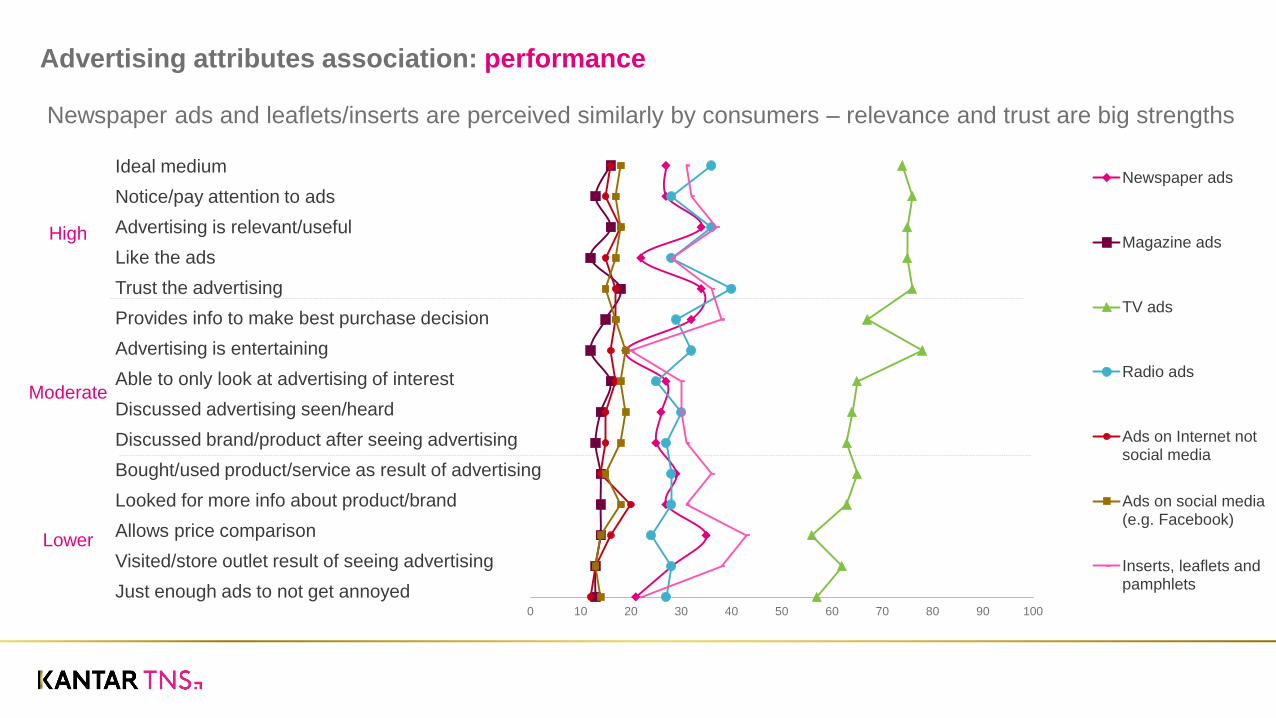
Advertising attributes association: performance
Newspaper ads and leaflets/inserts are perceived similarly by consumers – relevance and trust are big strengths
High
Moderate
Lower

3.16cm
4.75cm
6.34cm
7.93cm
9.52cm
11.11cm
12.70cm
14.29cm
15.87cm
17.00cm
1.00cm 3.70cm 6.40cm 9.10cm 11.80cm 14.50cm 17.20cm 9.90cm 22.60cm 25.30cm 27.99cm 30.69cm 32.85cm30.16cm27.46cm24.76cm22.07cm19.37cm16.67cm13.98cm11.28cm8.59cm5.89cm3.19cm
Content Bottom
Content Top
Heading
Baseline
Left Margin Right Margin
What is advertising in each media type known for?
46
Each media type is known for slightly different aspects
Allows price
comparison
Trust the advertising
Advertising is
relevant/useful
Provides info to make
best purchase decision
Trust the advertising
Able to only look at
advertising of interest
Advertising is
relevant/useful
Ideal medium
Advertising is
entertaining
Trust the advertising
Notice/pay attention to
ads
Advertising is
relevant/useful
Like the ads
Trust the advertising
Ideal medium
Advertising is
relevant/useful
Advertising is
entertaining
Looked for more info
about product/brand
Advertising is
relevant/useful
Able to only look at
advertising of interest
Provides info to make
best purchase decision
Trust the advertising
Discussed advertising
seen/heard
Advertising is
entertaining
Allows price
comparison
Provides info to make
best purchase decision
Visited/store outlet
result of seeing
advertising
Advertising is
relevant/useful
SALE
3.16cm
4.75cm
6.34cm
7.93cm
9.52cm
11.11cm
12.70cm
14.29cm
15.87cm
17.00cm
1.00cm 3.70cm 6.40cm 9.10cm 11.80cm 14.50cm 17.20cm 9.90cm 22.60cm 25.30cm 27.99cm 30.69cm 32.85cm30.16cm27.46cm24.76cm22.07cm19.37cm16.67cm13.98cm11.28cm8.59cm5.89cm3.19cm
Content Bottom
Content Top
Heading
Baseline
Left Margin Right Margin
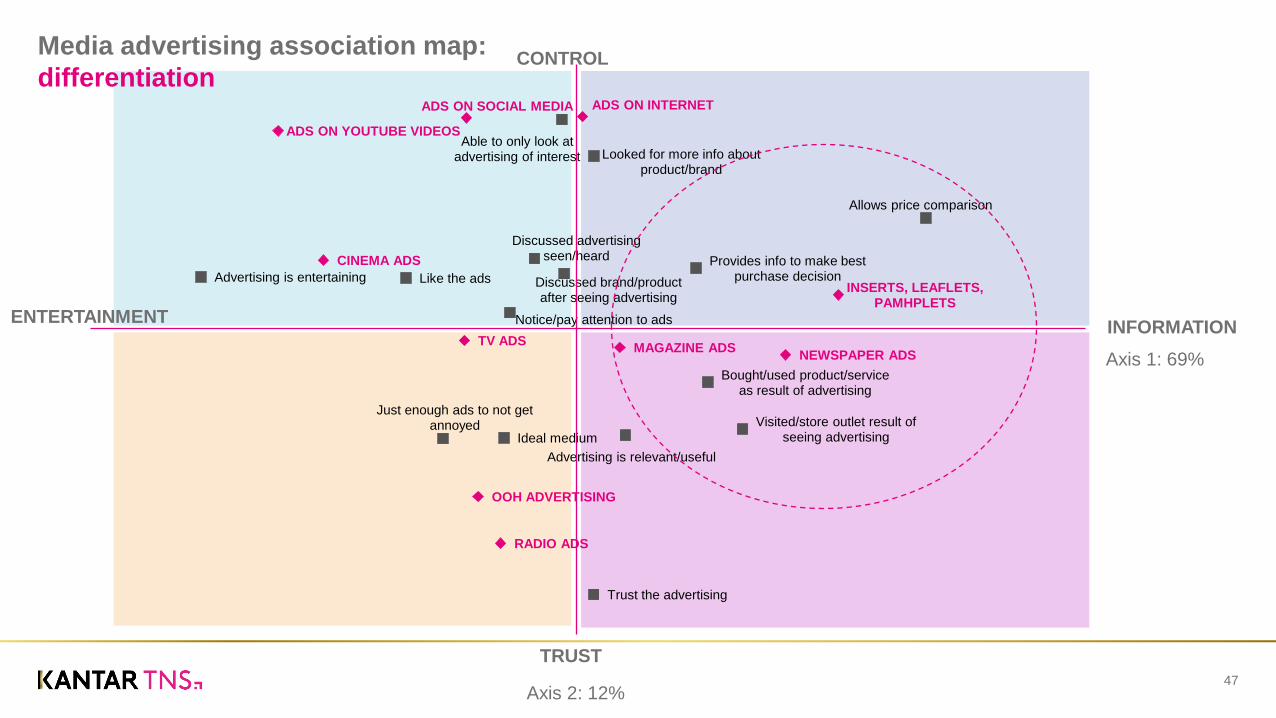
Media advertising association map:
differentiation
47
NEWSPAPER ADS MAGAZINE ADS
TV ADS
RADIO ADS
OOH ADVERTISING
ADS ON INTERNET ADS ON SOCIAL MEDIA
INSERTS, LEAFLETS, PAMHPLETS
CINEMA ADS
ADS ON YOUTUBE VIDEOS
Ideal medium
Notice/pay attention to ads
Trust the advertising
Like the ads
Advertising is relevant/useful
Just enough ads to not get annoyed
Bought/used product/service as result of advertising
Visited/store outlet result of seeing advertising
Discussed brand/product after seeing advertising
Discussed advertising seen/heard
Looked for more info about product/brand
Advertising is entertaining
Allows price comparison
Provides info to make best purchase decision
Able to only look at advertising of interest
Axis 1: 69%
Axis 2: 12%
CONTROL
TRUST
INFORMATION ENTERTAINMENT

3.16cm
4.75cm
6.34cm
7.93cm
9.52cm
11.11cm
12.70cm
14.29cm
15.87cm
17.00cm
1.00cm 3.70cm 6.40cm 9.10cm 11.80cm 14.50cm 17.20cm 9.90cm 22.60cm 25.30cm 27.99cm 30.69cm 32.85cm30.16cm27.46cm24.76cm22.07cm19.37cm16.67cm13.98cm11.28cm8.59cm5.89cm3.19cm
Content Bottom
Content Top
Heading
Baseline
Left Margin Right Margin
What does this mean for the reading narrative?
48
Reading media channels uniquely sit in the ‘learning and information’ territory
Entertainment Information, learning and recall
Reading
media
Broadcast
media
3.16cm
4.75cm
6.34cm
7.93cm
9.52cm
11.11cm
12.70cm
14.29cm
15.87cm
17.00cm
1.00cm 3.70cm 6.40cm 9.10cm 11.80cm 14.50cm 17.20cm 9.90cm 22.60cm 25.30cm 27.99cm 30.69cm 32.85cm30.16cm27.46cm24.76cm22.07cm19.37cm16.67cm13.98cm11.28cm8.59cm5.89cm3.19cm
Content Bottom
Content Top
Heading
Baseline
Left Margin Right Margin
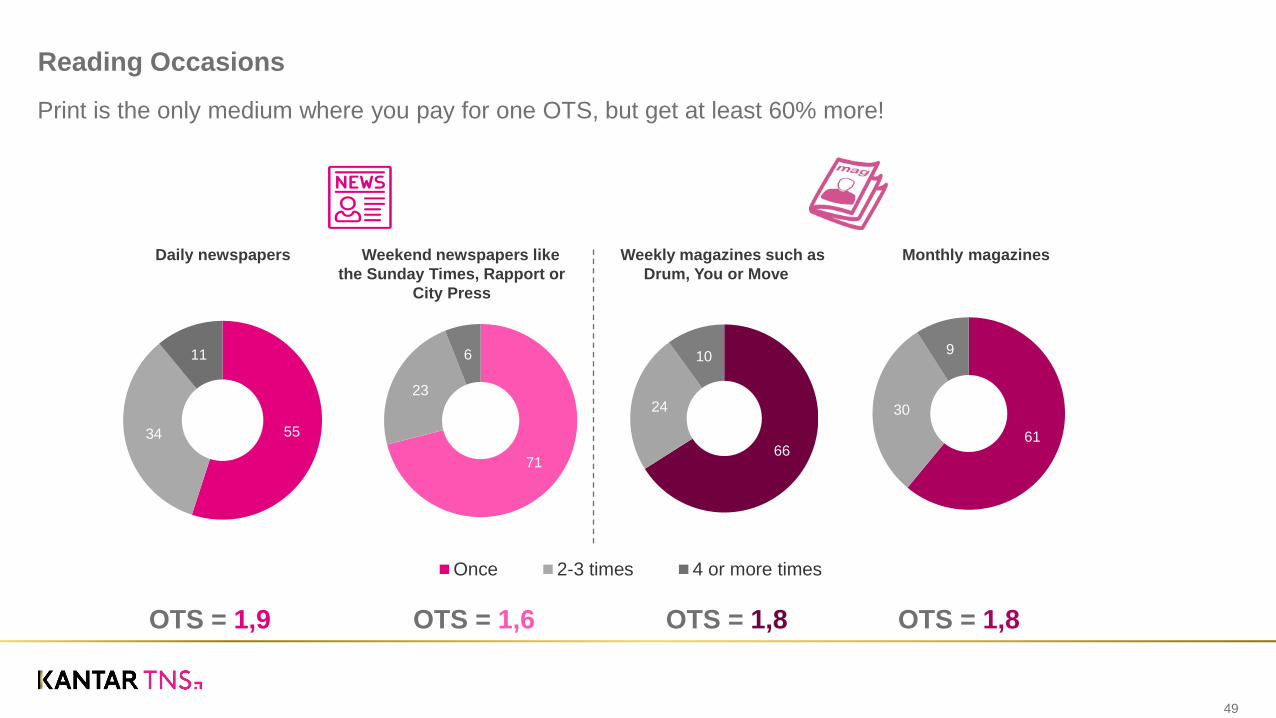
Reading Occasions
49
Print is the only medium where you pay for one OTS, but get at least 60% more!
55 34
11
Once 2-3 times 4 or more times
71
23
6
66
24
10
61
30
9
Daily newspapers Weekend newspapers like
the Sunday Times, Rapport or
City Press
Weekly magazines such as
Drum, You or Move
Monthly magazines
OTS = 1,9 OTS = 1,6 OTS = 1,8 OTS = 1,8
3.16cm
4.75cm
6.34cm
7.93cm
9.52cm
11.11cm
12.70cm
14.29cm
15.87cm
17.00cm
1.00cm 3.70cm 6.40cm 9.10cm 11.80cm 14.50cm 17.20cm 9.90cm 22.60cm 25.30cm 27.99cm 30.69cm 32.85cm30.16cm27.46cm24.76cm22.07cm19.37cm16.67cm13.98cm11.28cm8.59cm5.89cm3.19cm
Content Bottom
Content Top
Heading
Baseline
Left Margin Right Margin
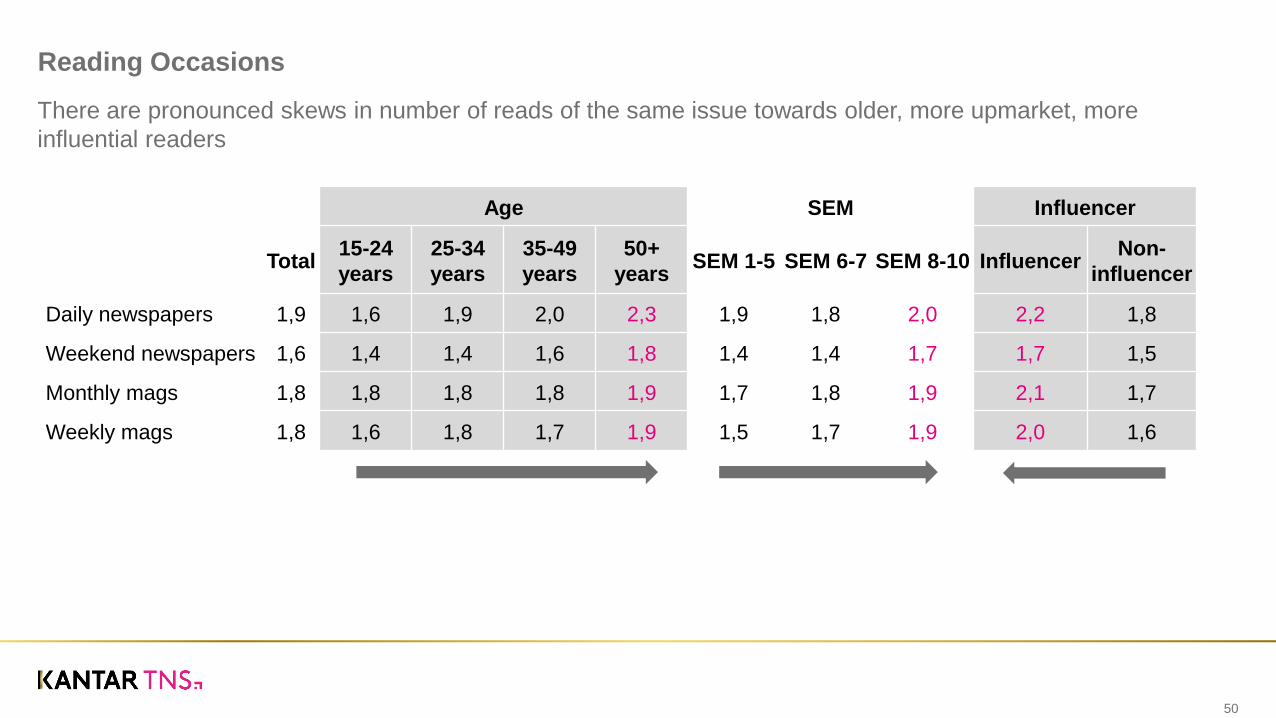
Reading Occasions
50
There are pronounced skews in number of reads of the same issue towards older, more upmarket, more
influential readers
Age SEM Influencer
Total 15-24
years
25-34
years
35-49
years
50+
years SEM 1-5 SEM 6-7 SEM 8-10 Influencer
Non-
influencer
Daily newspapers 1,9 1,6 1,9 2,0 2,3 1,9 1,8 2,0 2,2 1,8
Weekend newspapers 1,6 1,4 1,4 1,6 1,8 1,4 1,4 1,7 1,7 1,5
Monthly mags 1,8 1,8 1,8 1,8 1,9 1,7 1,8 1,9 2,1 1,7
Weekly mags 1,8 1,6 1,8 1,7 1,9 1,5 1,7 1,9 2,0 1,6
3.16cm
4.75cm
6.34cm
7.93cm
9.52cm
11.11cm
12.70cm
14.29cm
15.87cm
17.00cm
1.00cm 3.70cm 6.40cm 9.10cm 11.80cm 14.50cm 17.20cm 9.90cm 22.60cm 25.30cm 27.99cm 30.69cm 32.85cm30.16cm27.46cm24.76cm22.07cm19.37cm16.67cm13.98cm11.28cm8.59cm5.89cm3.19cm
Content Bottom
Content Top
Heading
Baseline
Left Margin Right Margin
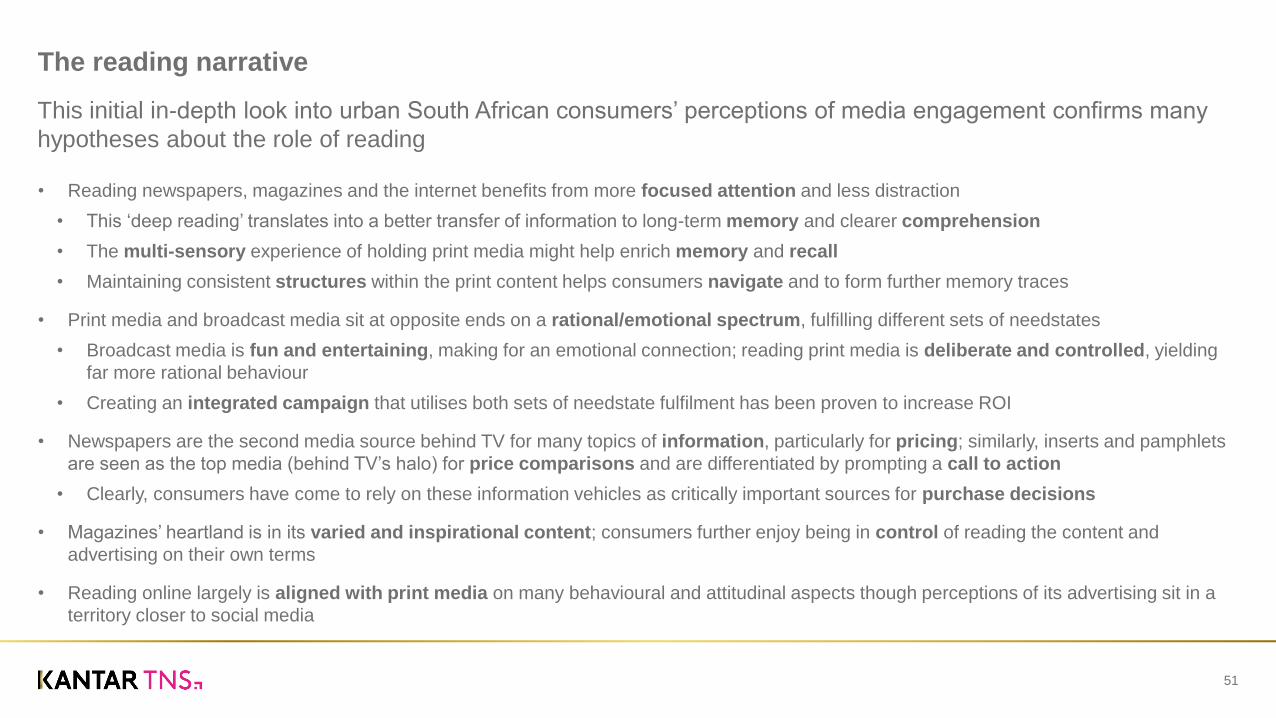
• Reading newspapers, magazines and the internet benefits from more focused attention and less distraction
• This ‘deep reading’ translates into a better transfer of information to long-term memory and clearer comprehension
• The multi-sensory experience of holding print media might help enrich memory and recall
• Maintaining consistent structures within the print content helps consumers navigate and to form further memory traces
• Print media and broadcast media sit at opposite ends on a rational/emotional spectrum, fulfilling different sets of needstates
• Broadcast media is fun and entertaining, making for an emotional connection; reading print media is deliberate and controlled, yielding
far more rational behaviour
• Creating an integrated campaign that utilises both sets of needstate fulfilment has been proven to increase ROI
• Newspapers are the second media source behind TV for many topics of information, particularly for pricing; similarly, inserts and pamphlets
are seen as the top media (behind TV’s halo) for price comparisons and are differentiated by prompting a call to action
• Clearly, consumers have come to rely on these information vehicles as critically important sources for purchase decisions
• Magazines’ heartland is in its varied and inspirational content; consumers further enjoy being in control of reading the content and
advertising on their own terms
• Reading online largely is aligned with print media on many behavioural and attitudinal aspects though perceptions of its advertising sit in a
territory closer to social media
The reading narrative
51
This initial in-depth look into urban South African consumers’ perceptions of media engagement confirms many
hypotheses about the role of reading

3.16cm
4.75cm
6.34cm
7.93cm
9.52cm
11.11cm
12.70cm
14.29cm
15.87cm
17.00cm
1.00cm 3.70cm 6.40cm 9.10cm 11.80cm 14.50cm 17.20cm 9.90cm 22.60cm 25.30cm 27.99cm 30.69cm 32.85cm30.16cm27.46cm24.76cm22.07cm19.37cm16.67cm13.98cm11.28cm8.59cm5.89cm3.19cm
Content Bottom
Content Top
Heading
Baseline
Left Margin Right Margin
Final words: the power of an integrated campaign
52 http://www.printpower.eu/Why-Print-Media
53 © GfK March 2017 | PRC Marketing Mix Evaluator
GfK Marketing Mix Evaluator (MME) How we evaluate advertising effectiveness
GfK South Africa
+60
-50
+70
-65
+25
Action
54 © GfK March 2017 | PRC Marketing Mix Evaluator
Elements of the perfect marketing mix
Why is it so important to get your mix right?
Time to remix
1
2
4
55 © GfK March 2017 | PRC Marketing Mix Evaluator
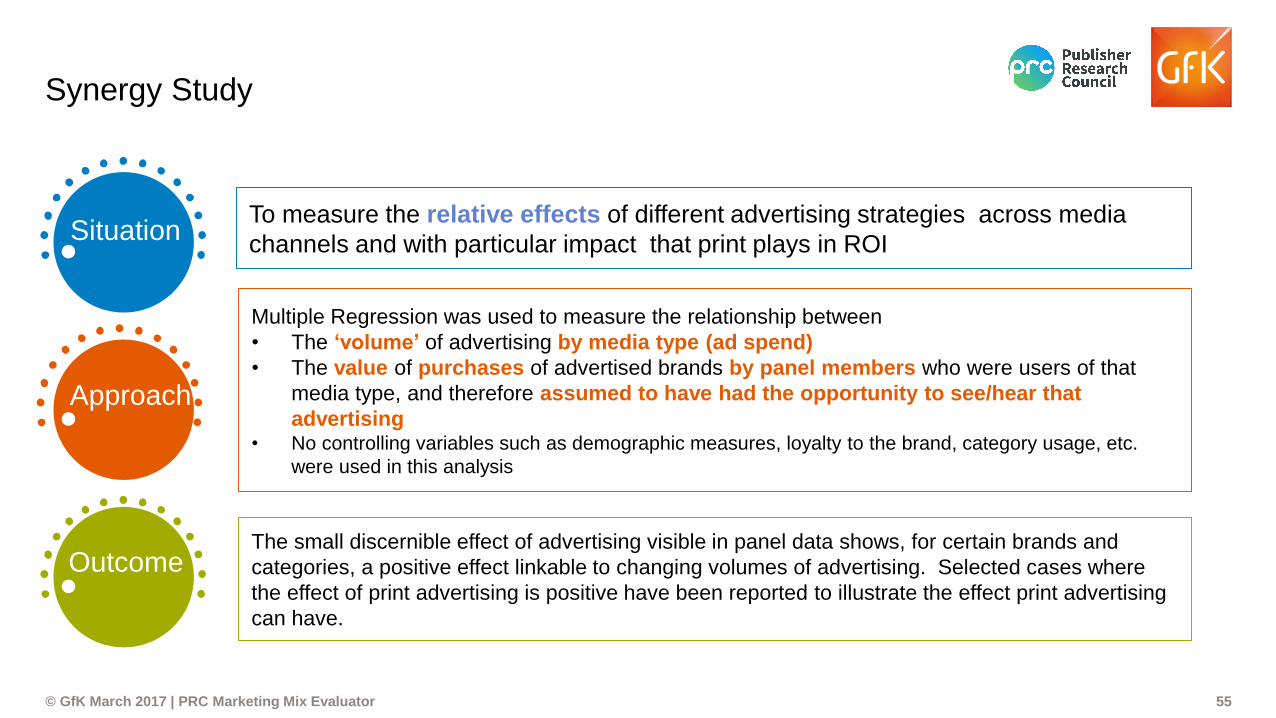
Synergy Study
To measure the relative effects of different advertising strategies across media
channels and with particular impact that print plays in ROI
Multiple Regression was used to measure the relationship between
• The ‘volume’ of advertising by media type (ad spend)
• The value of purchases of advertised brands by panel members who were users of that
media type, and therefore assumed to have had the opportunity to see/hear that
advertising• No controlling variables such as demographic measures, loyalty to the brand, category usage, etc.
were used in this analysis
The small discernible effect of advertising visible in panel data shows, for certain brands and
categories, a positive effect linkable to changing volumes of advertising. Selected cases where
the effect of print advertising is positive have been reported to illustrate the effect print advertising
can have.
Situation
Situatio
n
Situation
Approach
Outcome

56 © GfK December 15, 2016 | Remaster your trade marketing to create the perfect promotional tune
How did we get all this valuable data?
GfK Consumer Panel across 9 Provinces, LSM 4 – 10, Urban and Rural HH’s, scanning all household purchases made on a day to day basis
3000 Households with either a cell phone or internet connection using demographic profiles from AMPS 2015B and Stats SA annual mid-year population estimates fully representing13.1 million South African Households
Technology is scanners placed in Panelist homes and Quality checked through stringent Global standards
Interviews conducted with Main Household Purchaser to determine media consumption patterns across TV, Radio, Digital and Print 2250 Household
incidence across 6 months data used
• PRC supplied GfK with Adex advertising spend
• Recording spend total by month
• By main media type – TV, Radio, Print
• For all advertised brands in the Food, Personal Care and
Beverages Adex product groups
56 © GfK March 2017 | PRC Marketing Mix Evaluator

57 © GfK March 2017 | PRC Marketing Mix Evaluator
Multiple Regression formed the core analysis
Multiple Regression was used to measure the relationship between volume of advertising by media type as represented by
advertising spend in Rands, and value of purchases of advertised brands by panel members who were users of that media
type, and therefore assumed to have had the opportunity to see/hear that advertising
No background or controlling variables such as demographic
measures, loyalty to the brand, category usage, etc. were used in
this analysis
Allowing the constant of the regression equation and the residual
of the r2 to account for all such background influencers of brand
spend
This analysis was only intended to measure the relative effects of
different advertising strategies and especially the effect of
including print advertising in the strategy
57 © GfK March 2017 | PRC Marketing Mix Evaluator
58 © GfK March 2017 | PRC Marketing Mix Evaluator
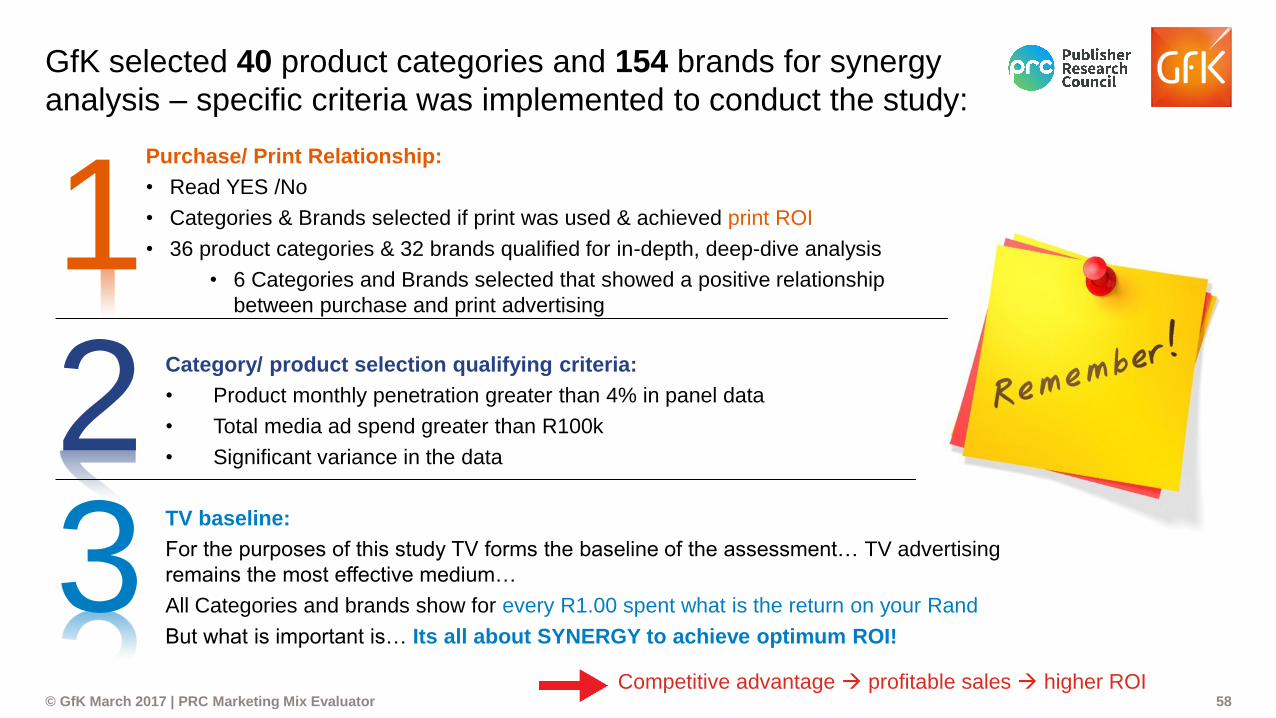
GfK selected 40 product categories and 154 brands for synergy
analysis – specific criteria was implemented to conduct the study:
1 2 3
Category/ product selection qualifying criteria:
• Product monthly penetration greater than 4% in panel data
• Total media ad spend greater than R100k
• Significant variance in the data
TV baseline:
For the purposes of this study TV forms the baseline of the assessment… TV advertising
remains the most effective medium…
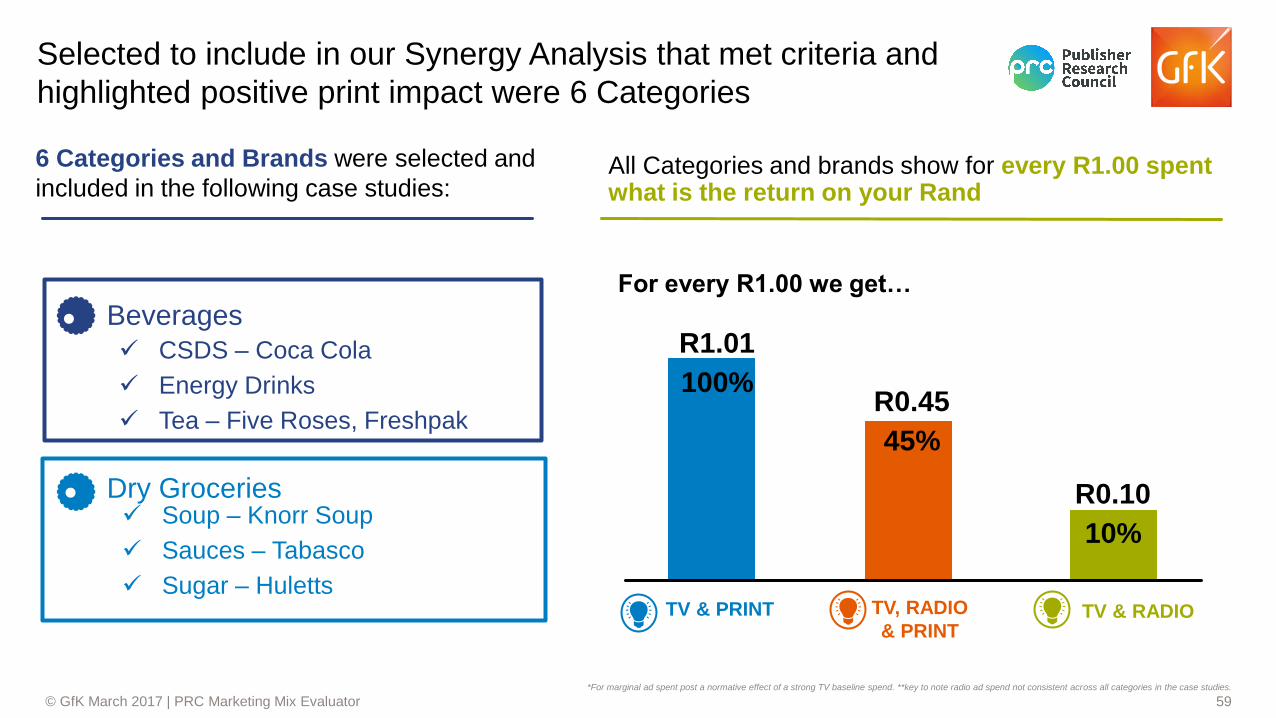
All Categories and brands show for every R1.00 spent what is the return on your Rand
But what is important is… Its all about SYNERGY to achieve optimum ROI!
Purchase/ Print Relationship:
• Read YES /No
• Categories & Brands selected if print was used & achieved print ROI
• 36 product categories & 32 brands qualified for in-depth, deep-dive analysis
• 6 Categories and Brands selected that showed a positive relationship
between purchase and print advertising
Competitive advantage profitable sales higher ROI
59 © GfK March 2017 | PRC Marketing Mix Evaluator © GfK March 2017 | PRC Marketing Mix Evaluator 59
Beverages
Dry Groceries
CSDS – Coca Cola
Energy Drinks
Tea – Five Roses, Freshpak
Soup – Knorr Soup
Sauces – Tabasco
Sugar – Huletts
For every R1.00 we get…
Selected to include in our Synergy Analysis that met criteria and
highlighted positive print impact were 6 Categories
All Categories and brands show for every R1.00 spent what is the return on your Rand
6 Categories and Brands were selected and
included in the following case studies:
TV & PRINT TV & RADIO TV, RADIO
R1.01
100% R0.45
45%
R0.10
10%
*For marginal ad spent post a normative effect of a strong TV baseline spend. **key to note radio ad spend not consistent across all categories in the case studies.
60 © GfK March 2017 | PRC Marketing Mix Evaluator
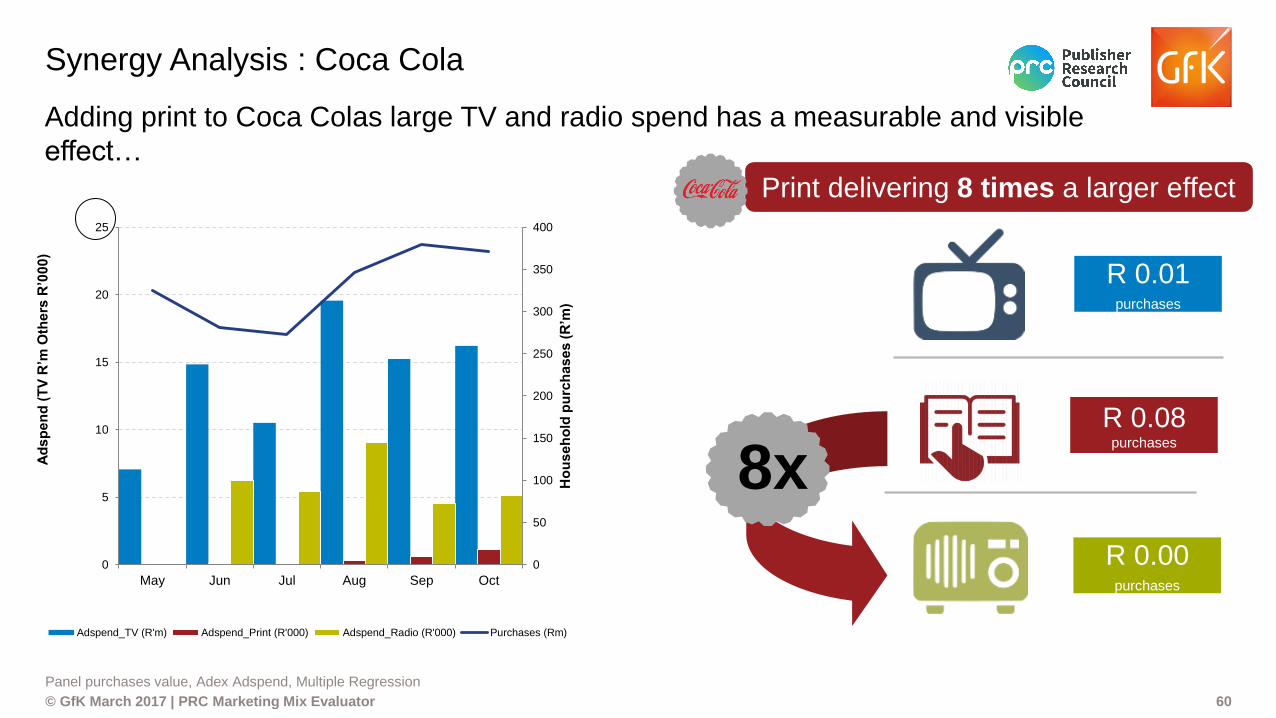
Panel purchases value, Adex Adspend, Multiple Regression
Synergy Analysis : Coca Cola
R 0.08 purchases
R 0.01 purchases
R 0.00 purchases
0
50
100
150
200
250
300
350
400
0
5
10
15
20
25
May Jun Jul Aug Sep OctH
ou
se
ho
ld p
urc
ha
se
s (
R’m
)
Ad
sp
en
d (
TV
R’m
Oth
ers
R’0
00
)
Adspend_TV (R'm) Adspend_Print (R'000) Adspend_Radio (R'000) Purchases (Rm)
Print delivering 8 times a larger effect
Adding print to Coca Colas large TV and radio spend has a measurable and visible
effect…
8x
61 © GfK March 2017 | PRC Marketing Mix Evaluator
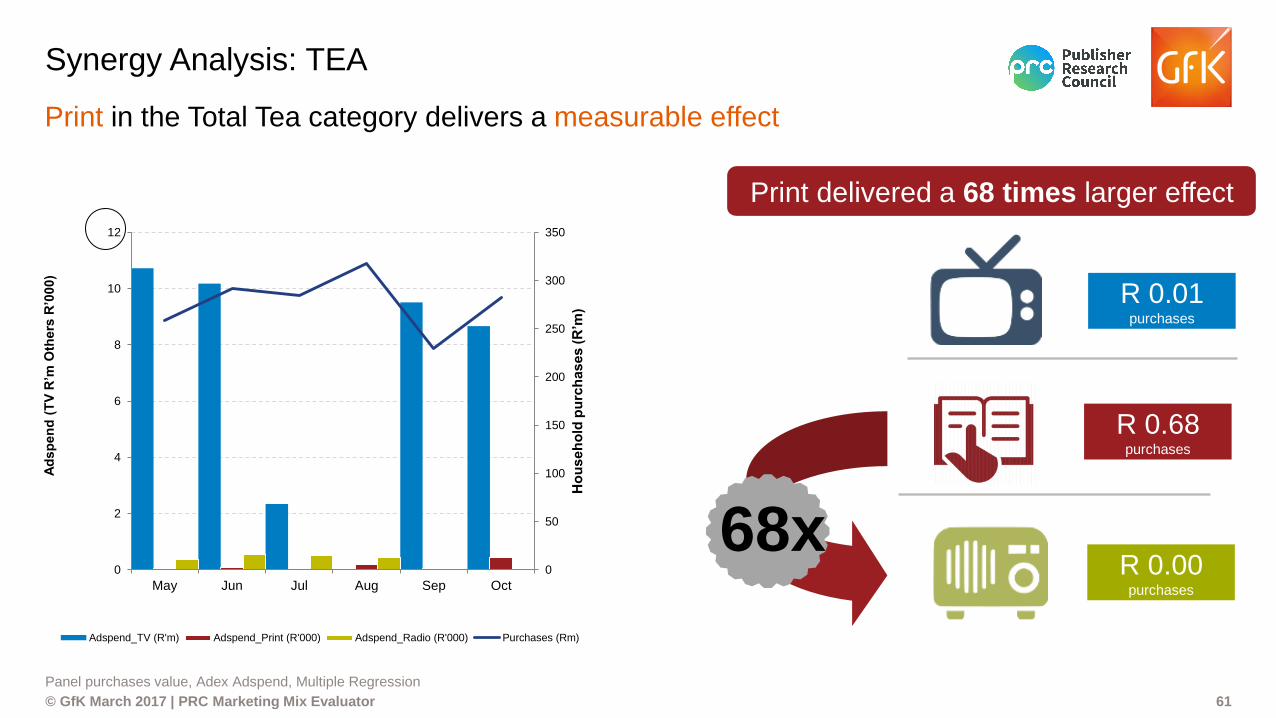
Panel purchases value, Adex Adspend, Multiple Regression
Synergy Analysis: TEA
Print in the Total Tea category delivers a measurable effect
R 0.68 purchases
R 0.00 purchases
R 0.01 purchases
0
50
100
150
200
250
300
350
0
2
4
6
8
10
12
May Jun Jul Aug Sep OctH
ou
se
ho
ld p
urc
ha
se
s (
R’m
)
Ad
sp
en
d (
TV
R’m
Oth
ers
R’0
00)
Adspend_TV (R'm) Adspend_Print (R'000) Adspend_Radio (R'000) Purchases (Rm)
Print delivered a 68 times larger effect
68x

62 © GfK March 2017 | PRC Marketing Mix Evaluator
Panel purchases value, Adex Adspend, Multiple Regression
Synergy Analysis : Five Roses Tea
Print advertising delivers 36 times the effect of TV advertising!
R0.36 purchases
R0.00 purchases
0
10
20
30
40
50
60
70
0
0.5
1
1.5
2
2.5
May Jun Jul Aug Sep OctH
ou
se
ho
ld p
urc
ha
se
s (
R’m
)
Ad
sp
en
d (
TV
R’m
Oth
ers
R’0
00
)
Adspend_TV (R'm) Adspend_Print (R'000) Adspend_Radio (R'000) Purchases (Rm)
Print delivered a 36 times larger effect
36x

63 © GfK March 2017 | PRC Marketing Mix Evaluator
Panel purchases value, Adex Adspend, Multiple Regression
Brand Case Study : Freshpak
Print advertising delivers 33 times the effect of TV advertising!
R 0.05 purchases
R 1.65 purchases
33x
0
10
20
30
40
50
60
70
80
0
0.5
1
1.5
2
2.5
May Jun Jul Aug Sep Oct
Ho
us
eh
old
pu
rch
as
es
(R
’m)
Ad
sp
en
d (
TV
R’m
Oth
ers
R’0
00
)
Adspend_TV (R'm) Adspend_Print (R'000) Adspend_Radio (R'000) Purchases (Rm)
Print delivered a 33 times larger effect
33x
64 © GfK March 2017 | PRC Marketing Mix Evaluator
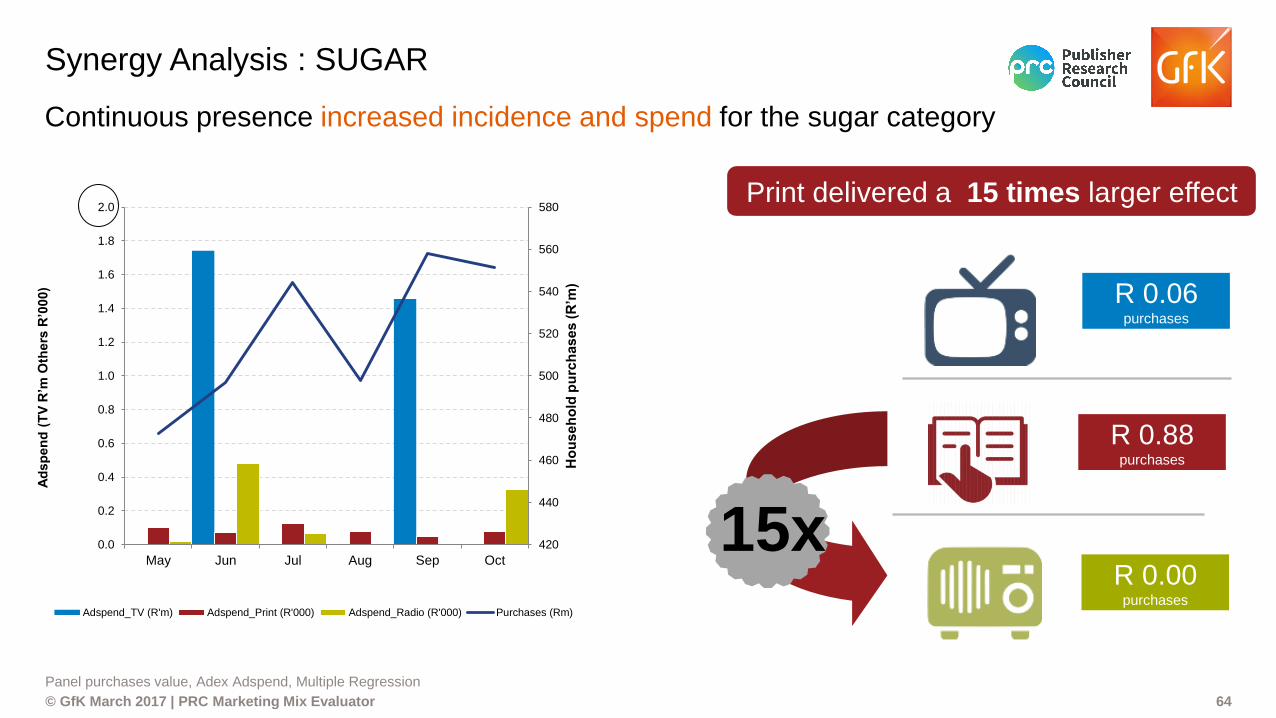
Panel purchases value, Adex Adspend, Multiple Regression
Synergy Analysis : SUGAR
Continuous presence increased incidence and spend for the sugar category
R 0.88 purchases
R 0.00 purchases
R 0.06 purchases
420
440
460
480
500
520
540
560
580
0.0
0.2
0.4
0.6
0.8
1.0
1.2
1.4
1.6
1.8
2.0
May Jun Jul Aug Sep OctH
ou
se
ho
ld p
urc
ha
se
s (
R’m
)
Ad
sp
en
d (
TV
R’m
Oth
ers
R’0
00)
Adspend_TV (R'm) Adspend_Print (R'000) Adspend_Radio (R'000) Purchases (Rm)
Print delivered a 15 times larger effect
15x
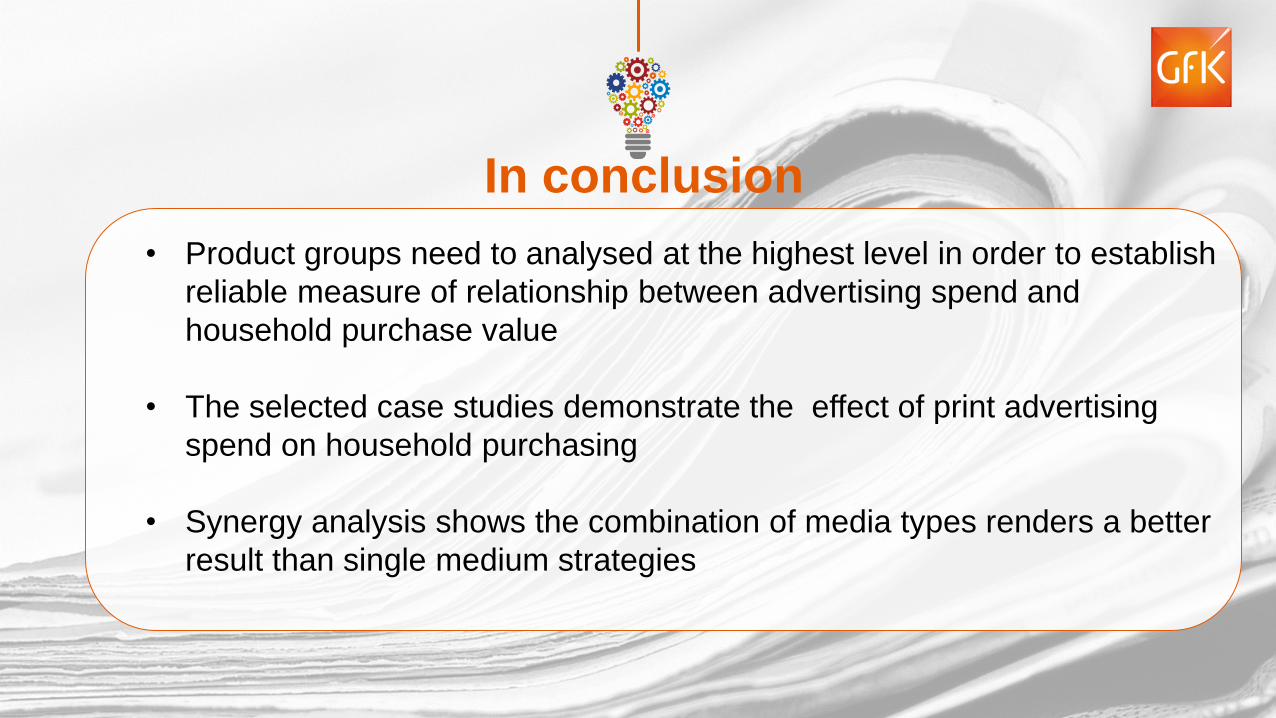
In conclusion
• Product groups need to analysed at the highest level in order to establish
reliable measure of relationship between advertising spend and
household purchase value
• The selected case studies demonstrate the effect of print advertising
spend on household purchasing
• Synergy analysis shows the combination of media types renders a better
result than single medium strategies
Insights into Wealthy South African’s Reading
D epth April 2017

17%
21%
23%
24%
24%
24%
26%
27%
27%
30%
30%
31%
32%
35%
43%
47%
52%
58%
59%
61%
Book clubs
Running
Wine tasting / clubs
Fashion
Beauty and grooming
Arts and crafts
Photography
Music Festivals
Theatre
Gardening
DIY
Concerts
Socialising
Home decor
Dining out
Cooking
Travel
Reading
Music
Movies
Q: WHICH OF THE FOLLOWING ACTIVITIES AND PASTIMES ARE YOU INTERESTED IN? (Top 20 only)
Wealthy South Africans are more interested in reading
than traveling, gardening, eating out and socializing!
01
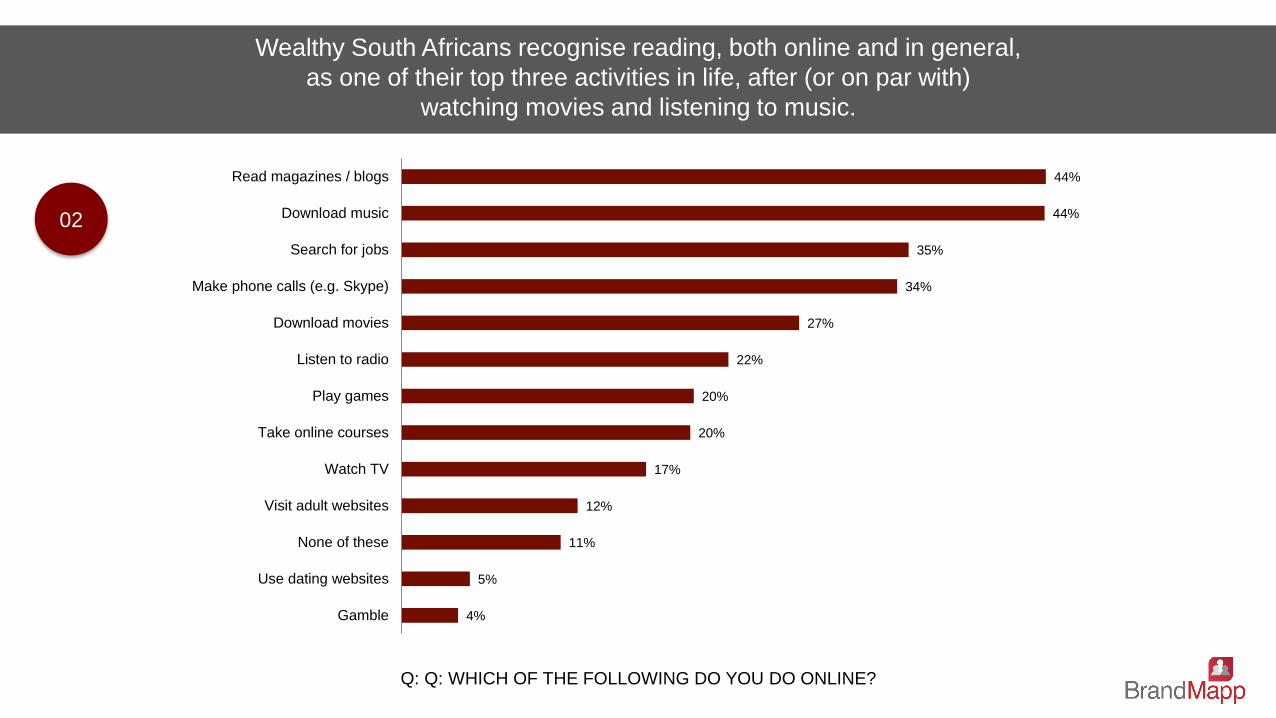
Q: Q: WHICH OF THE FOLLOWING DO YOU DO ONLINE?
Wealthy South Africans recognise reading, both online and in general,
as one of their top three activities in life, after (or on par with)
watching movies and listening to music.
4%
5%
11%
12%
17%
20%
20%
22%
27%
34%
35%
44%
44%
Gamble
Use dating websites
None of these
Visit adult websites
Watch TV
Take online courses
Play games
Listen to radio
Download movies
Make phone calls (e.g. Skype)
Search for jobs
Download music
Read magazines / blogs
02
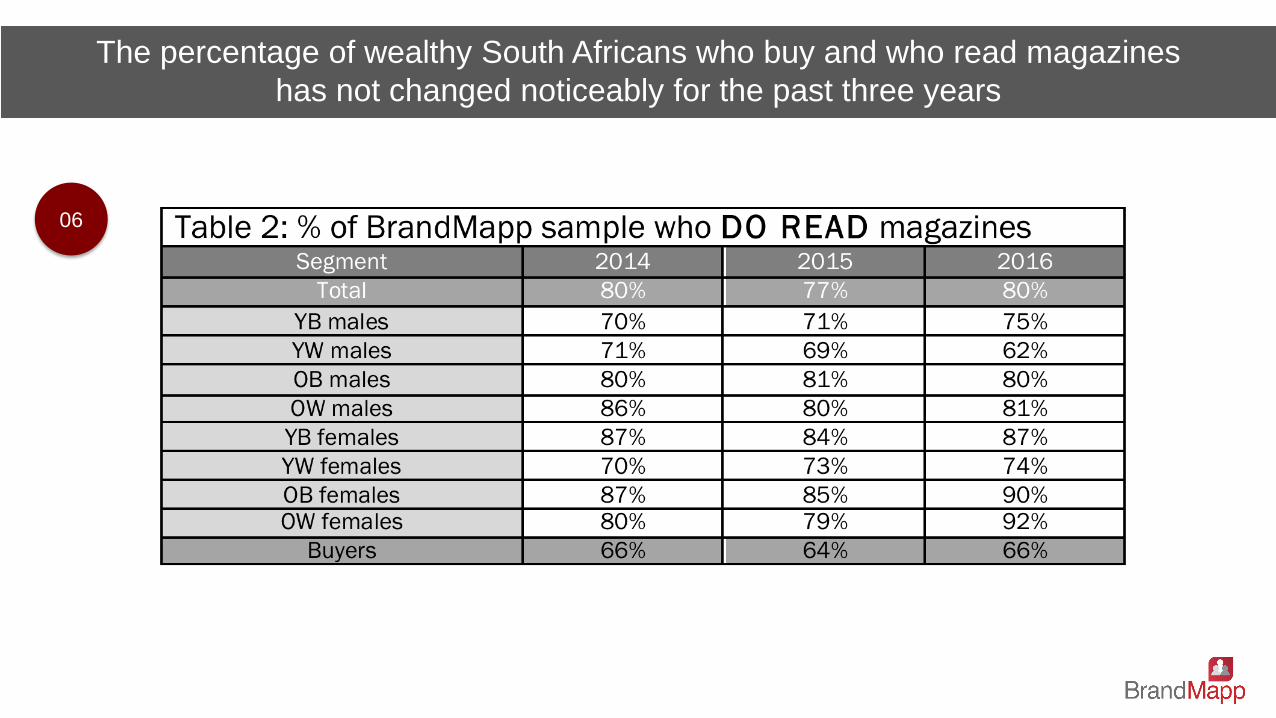
The percentage of wealthy South Africans who buy and who read magazines
has not changed noticeably for the past three years
06

Q. ARE YOU BUYING MAGAZINES MORE, SAME OR LESS THAN YOU WERE A YEAR AGO?
87% of wealthy South Africans read magazines
and 64% still buy magazines
More
5%
Same
23%
Less 36%
I don’t buy magazines (but still read magazines)
23%
I don’t read magazines at all
13%
07
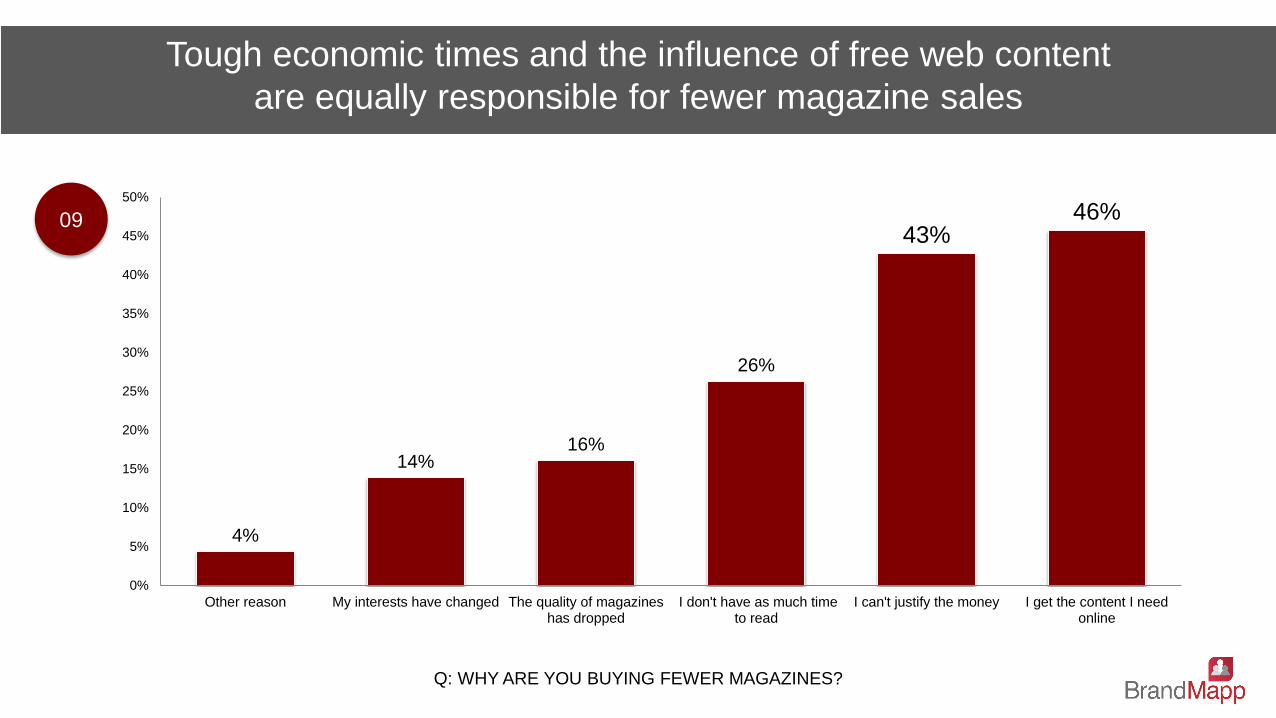
Q: WHY ARE YOU BUYING FEWER MAGAZINES?
Tough economic times and the influence of free web content
are equally responsible for fewer magazine sales
4%
14% 16%
26%
43% 46%
0%
5%
10%
15%
20%
25%
30%
35%
40%
45%
50%
Other reason My interests have changed The quality of magazineshas dropped
I don't have as much timeto read
I can't justify the money I get the content I needonline
09
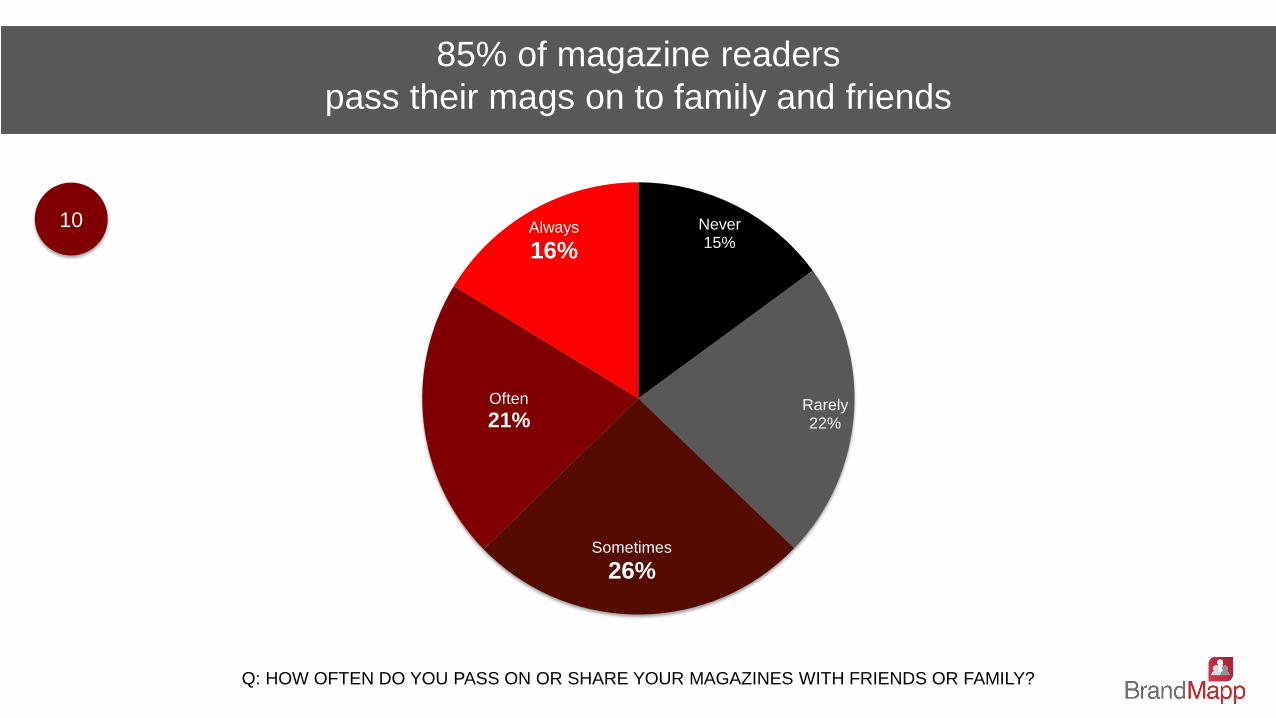
Q: HOW OFTEN DO YOU PASS ON OR SHARE YOUR MAGAZINES WITH FRIENDS OR FAMILY?
85% of magazine readers
pass their mags on to family and friends
Never 15%
Rarely 22%
Sometimes
26%
Often
21%
Always
16%
10
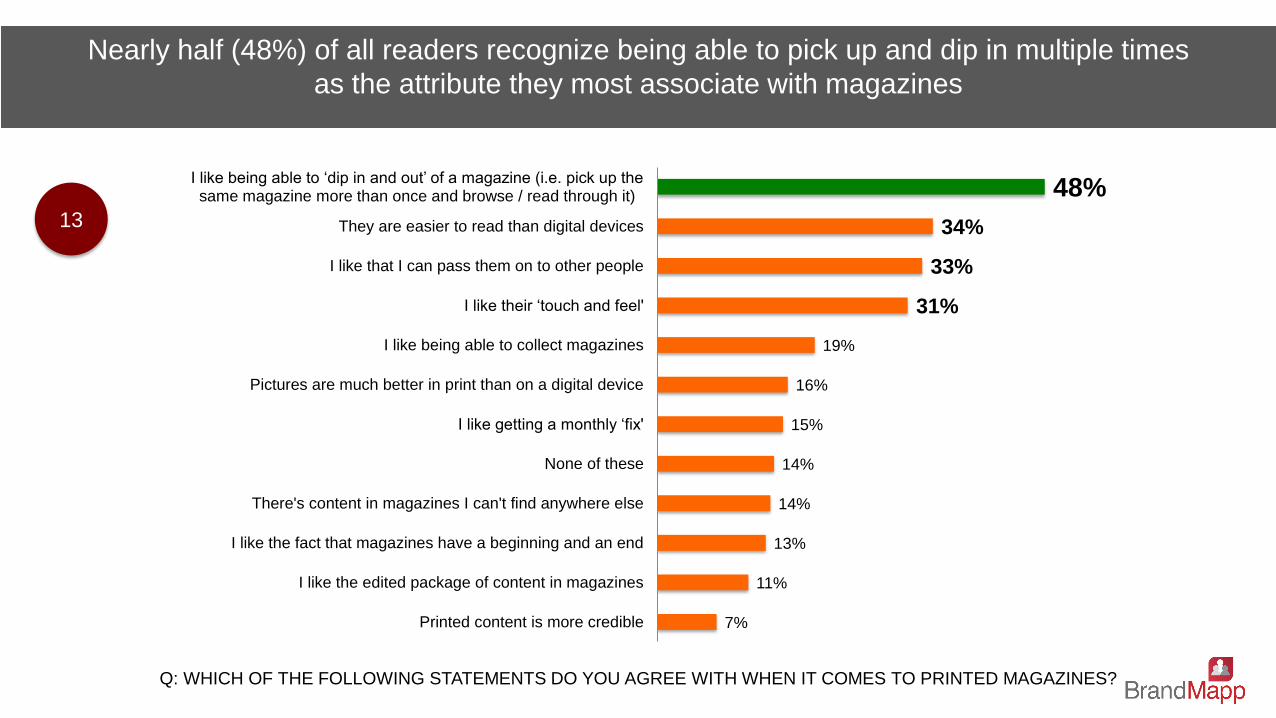
Q: WHICH OF THE FOLLOWING STATEMENTS DO YOU AGREE WITH WHEN IT COMES TO PRINTED MAGAZINES?
Nearly half (48%) of all readers recognize being able to pick up and dip in multiple times
as the attribute they most associate with magazines
7%
11%
13%
14%
14%
15%
16%
19%
31%
33%
34%
48%
Printed content is more credible
I like the edited package of content in magazines
I like the fact that magazines have a beginning and an end
There's content in magazines I can't find anywhere else
None of these
I like getting a monthly ‘fix'
Pictures are much better in print than on a digital device
I like being able to collect magazines
I like their ‘touch and feel'
I like that I can pass them on to other people
They are easier to read than digital devices
I like being able to ‘dip in and out’ of a magazine (i.e. pick up the same magazine more than once and browse / read through it)
13
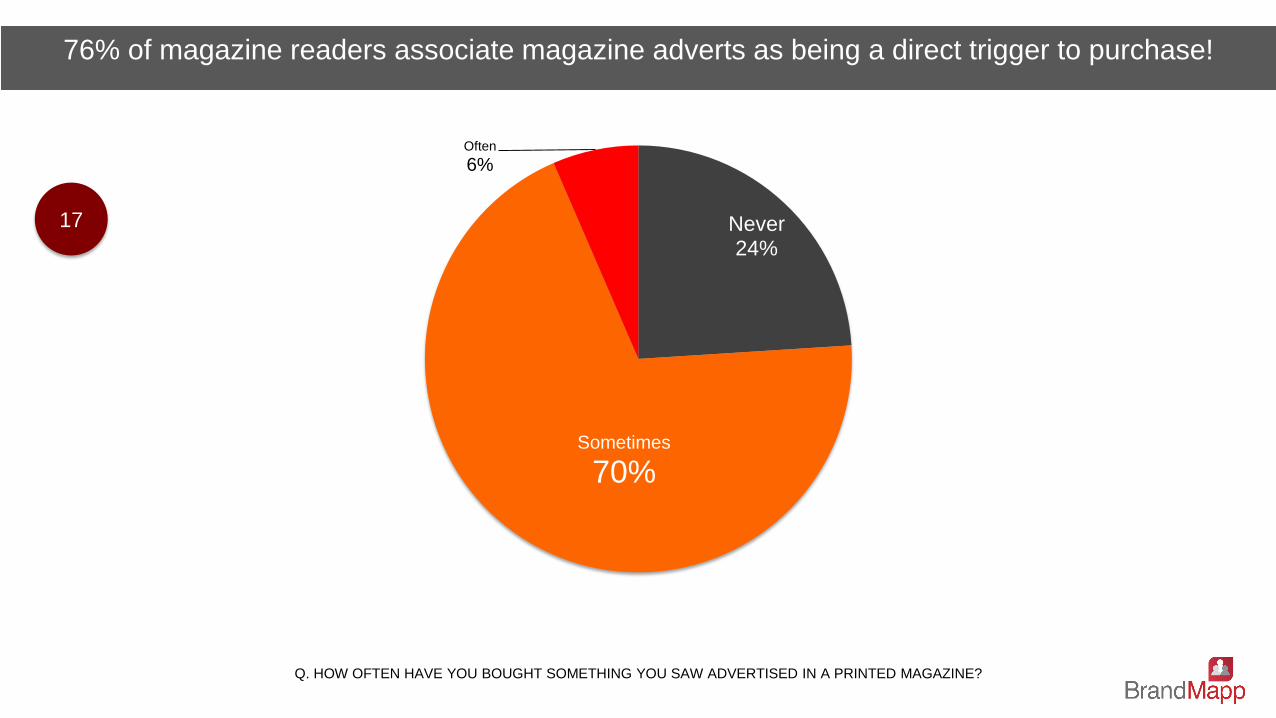
Q. HOW OFTEN HAVE YOU BOUGHT SOMETHING YOU SAW ADVERTISED IN A PRINTED MAGAZINE?
76% of magazine readers associate magazine adverts as being a direct trigger to purchase!
.
Never 24%
Sometimes
70%
Often
6%
17
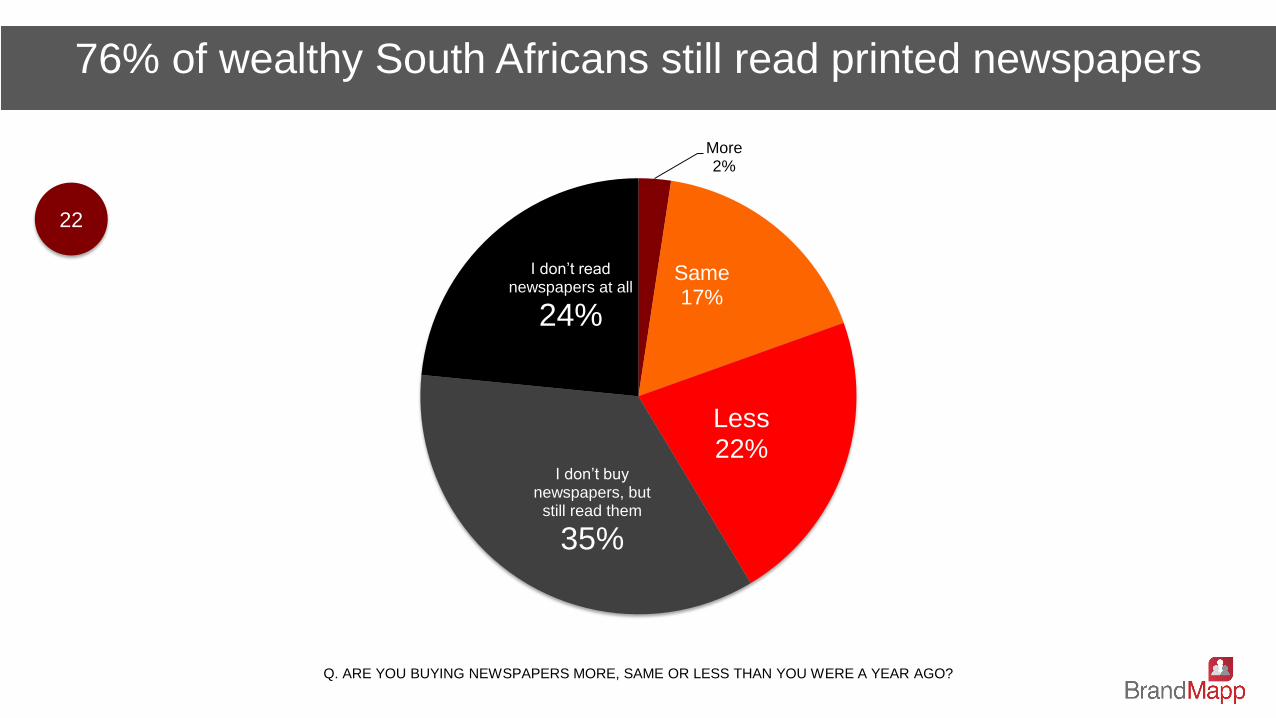
Q. ARE YOU BUYING NEWSPAPERS MORE, SAME OR LESS THAN YOU WERE A YEAR AGO?
76% of wealthy South Africans still read printed newspapers
More 2%
Same 17%
Less 22%
I don’t buy newspapers, but
still read them
35%
I don’t read newspapers at all
24%
22

Q: WHICH OF THE FOLLOWING STATEMENTS DO YOU AGREE WITH WHEN IT COMES TO NEWSPAPERS?
1 in 4 wealthy South Africans like the ritual of a printed newspaper
6%
8%
9%
13%
14%
21%
24%
24%
25%
32%
Pictures are much better in print than on a digital device
I like the edited package of content in a newspaper
Printed content is more credible than digital
I like the fact that newspapers have a beginning and an end
There's content in newspapers I can't find anywhere else
I like their ‘touch and feel'
I like that I can pass them on to other people
They are easier to read than digital devices
I like the ritual of a daily or weekly paper
None of these
24
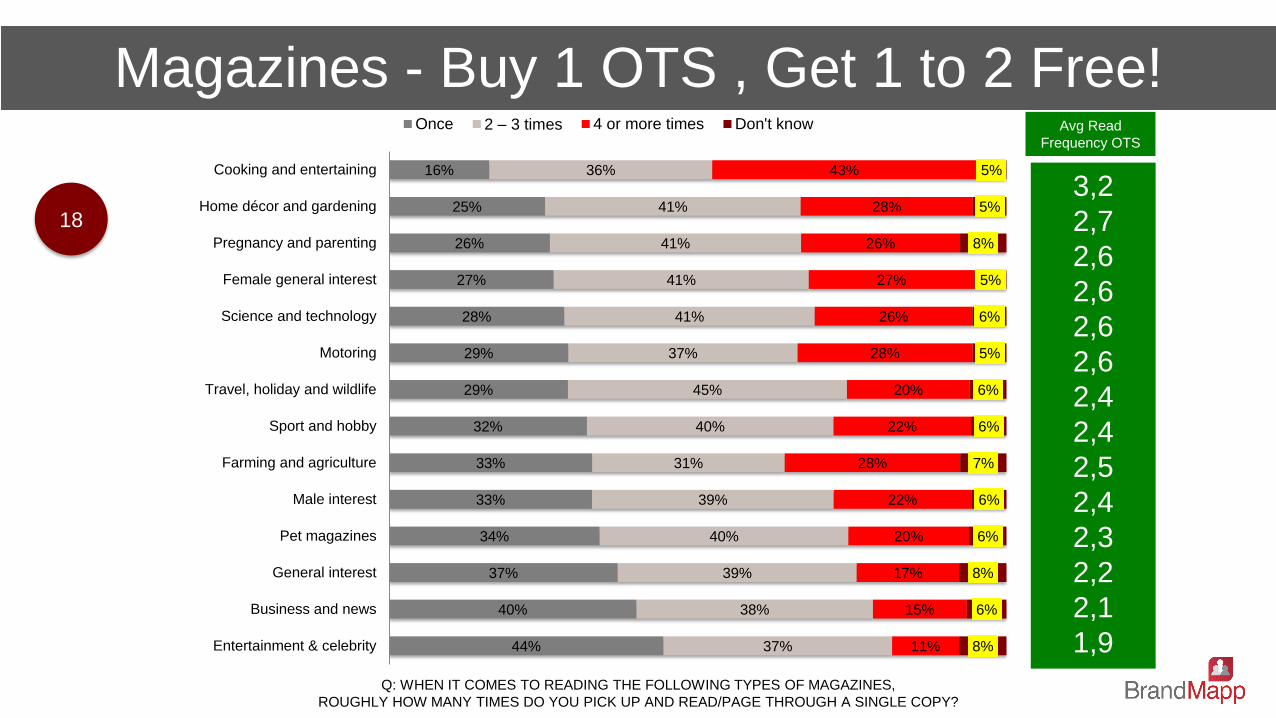
Q: WHEN IT COMES TO READING THE FOLLOWING TYPES OF MAGAZINES,
ROUGHLY HOW MANY TIMES DO YOU PICK UP AND READ/PAGE THROUGH A SINGLE COPY?
Magazines - Buy 1 OTS , Get 1 to 2 Free!
44%
40%
37%
34%
33%
33%
32%
29%
29%
28%
27%
26%
25%
16%
37%
38%
39%
40%
39%
31%
40%
45%
37%
41%
41%
41%
41%
36%
11%
15%
17%
20%
22%
28%
22%
20%
28%
26%
27%
26%
28%
43%
8%
6%
8%
6%
6%
7%
6%
6%
5%
6%
5%
8%
5%
5%
Entertainment & celebrity
Business and news
General interest
Pet magazines
Male interest
Farming and agriculture
Sport and hobby
Travel, holiday and wildlife
Motoring
Science and technology
Female general interest
Pregnancy and parenting
Home décor and gardening
Cooking and entertaining
Once 2 – 3 times 4 or more times Don't know
18
3,2
2,7
2,6
2,6
2,6
2,6
2,4
2,4
2,5
2,4
2,3
2,2
2,1
1,9
Avg Read
Frequency OTS
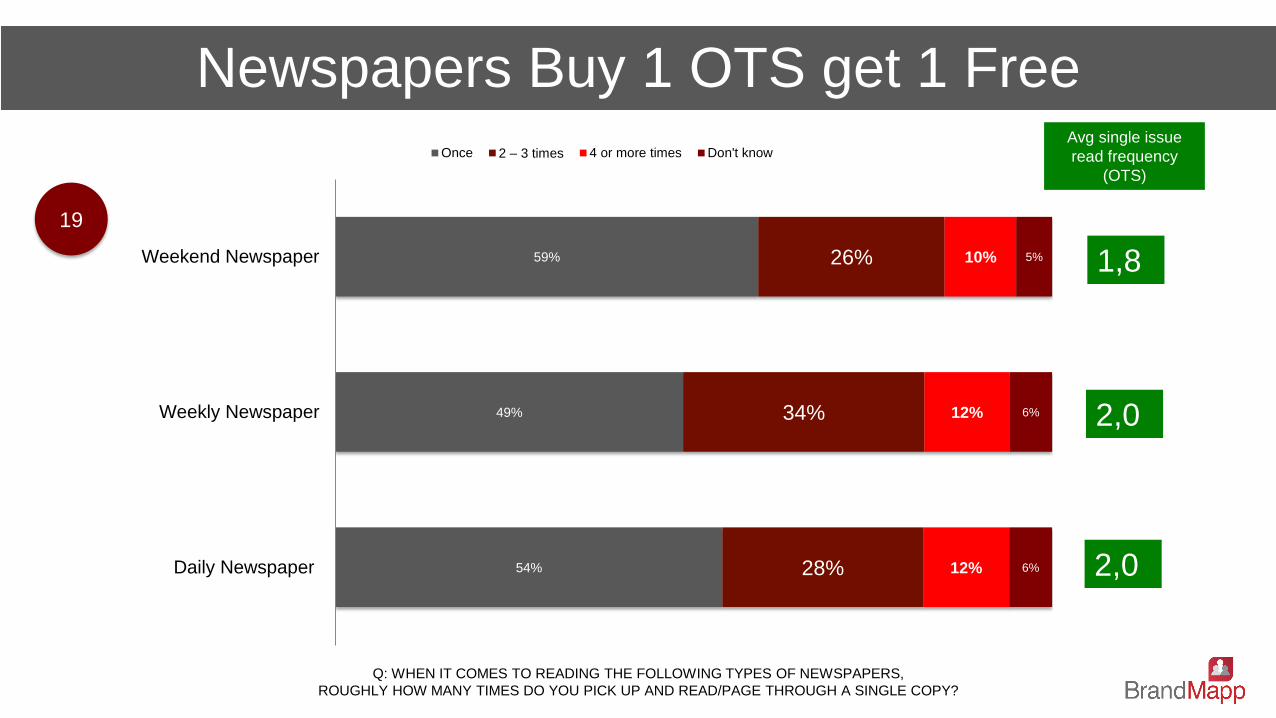
Q: WHEN IT COMES TO READING THE FOLLOWING TYPES OF NEWSPAPERS,
ROUGHLY HOW MANY TIMES DO YOU PICK UP AND READ/PAGE THROUGH A SINGLE COPY?
Newspapers Buy 1 OTS get 1 Free
54%
49%
59%
28%
34%
26%
12%
12%
10%
6%
6%
5%
Daily Newspaper
Weekly Newspaper
Weekend Newspaper
Once 2 – 3 times 4 or more times Don't know
19
1,8
2,0
2,0
Avg single issue
read frequency
(OTS)
Media Planning Crash Course
April 19-21 2017
D epth

MEDIA PERFORMANCE HOW DOES EACH MEDIA TYPE PERFORM AGAINST THE TARGET MARKET
How many people can we reach for each R1 spent?
How impactful (memorable) is each medium compared to the other?
To answer these questions and give the PRC members insight into how
and why media planners choose each medium we are going to use the
Echo MCC® (Media Comparison Calculator)
DEFINITION
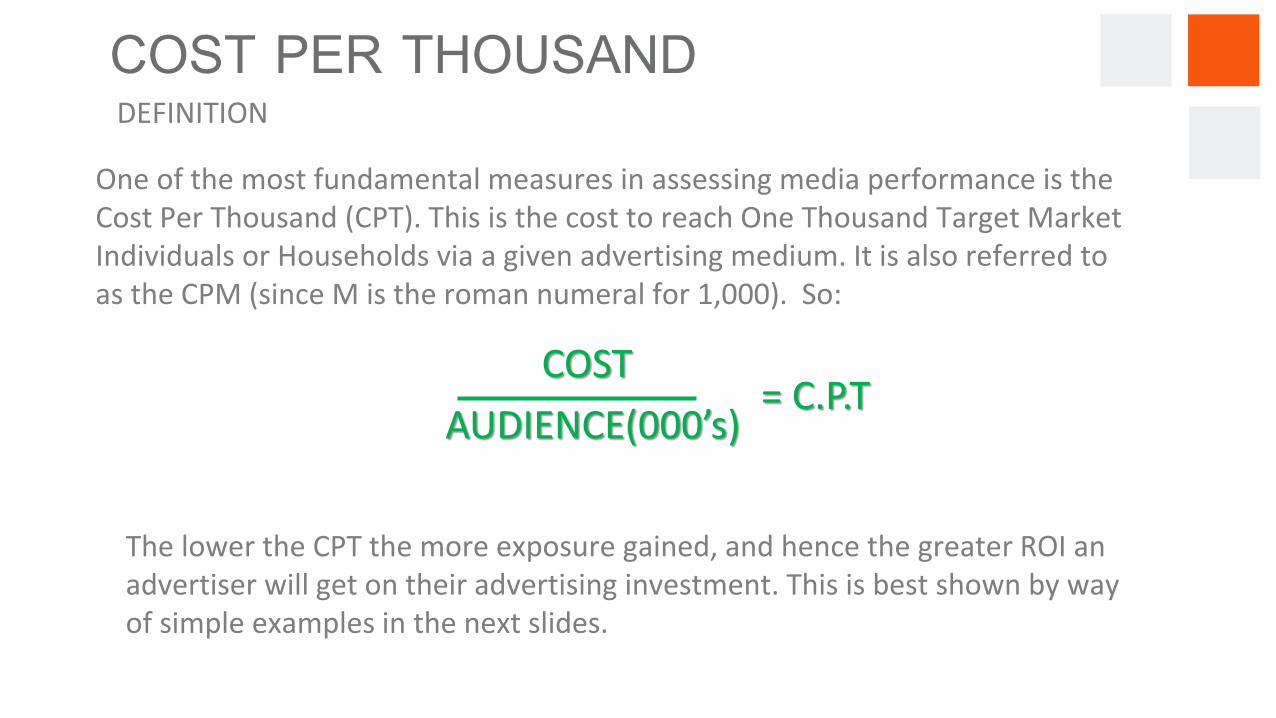
One of the most fundamental measures in assessing media performance is the Cost Per Thousand (CPT). This is the cost to reach One Thousand Target Market Individuals or Households via a given advertising medium. It is also referred to as the CPM (since M is the roman numeral for 1,000). So:
The lower the CPT the more exposure gained, and hence the greater ROI an advertiser will get on their advertising investment. This is best shown by way of simple examples in the next slides.
COST
AUDIENCE(000’s)
= C.P.T
COST PER THOUSAND
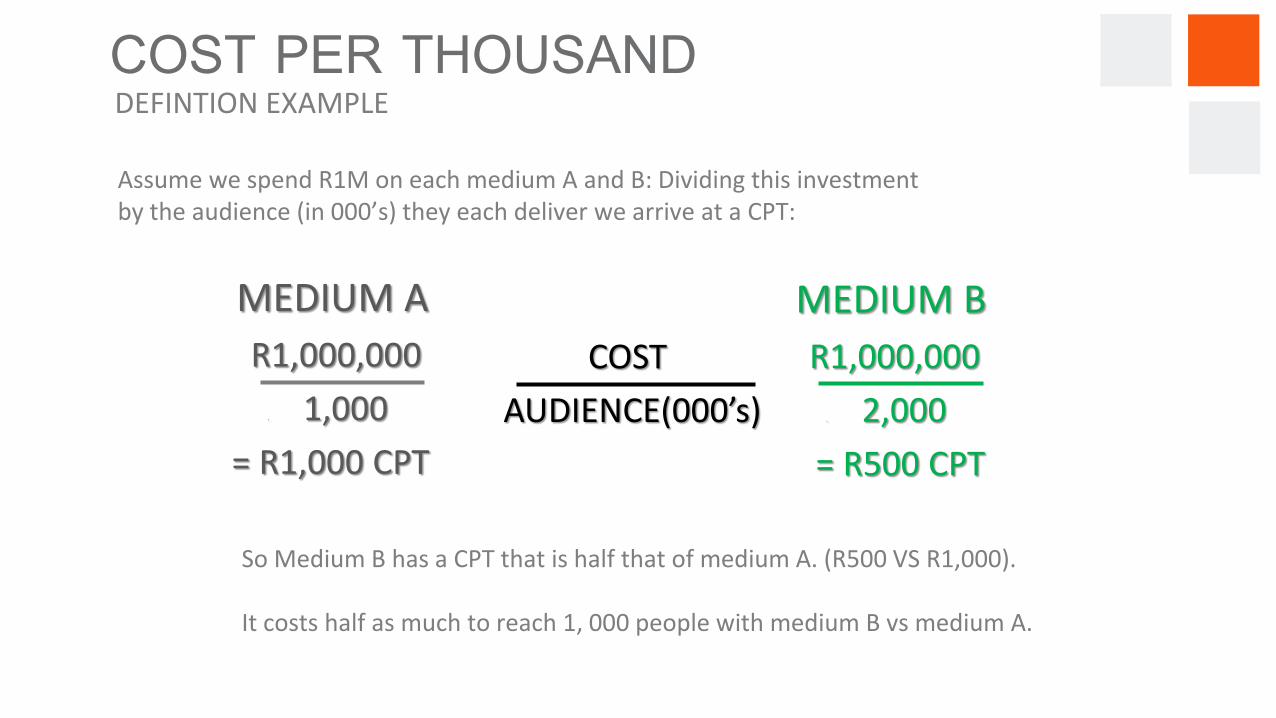
Assume we spend R1M on each medium A and B: Dividing this investment by the audience (in 000’s) they each deliver we arrive at a CPT:
MEDIUM A
R1,000,000
. 1,000
= R1,000 CPT
MEDIUM B
R1,000,000
. 2,000
= R500 CPT
COST
AUDIENCE(000’s)
So Medium B has a CPT that is half that of medium A. (R500 VS R1,000).
It costs half as much to reach 1, 000 people with medium B vs medium A.
COST PER THOUSAND DEFINTION EXAMPLE
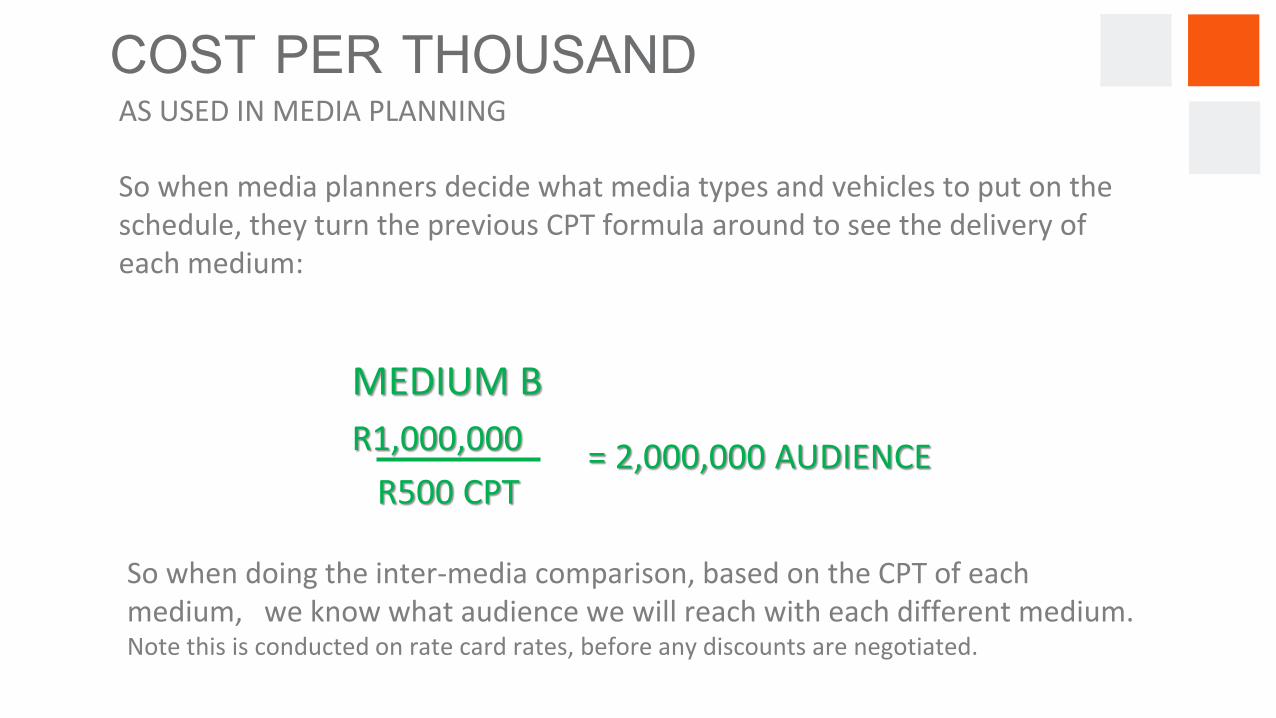
So when media planners decide what media types and vehicles to put on the schedule, they turn the previous CPT formula around to see the delivery of each medium:
= AUDIENCE (GRP’S) COST
C. P. T.
So when doing the inter-media comparison, based on the CPT of each medium, we know what audience we will reach with each different medium. Note this is conducted on rate card rates, before any discounts are negotiated.
COST PER THOUSAND AS USED IN MEDIA PLANNING
MEDIUM A
R1,000,000
R1,000 CPT
= 1,000,000 AUDIENCE
MEDIUM B
R1,000,000
R500 CPT
= 2,000,000 AUDIENCE
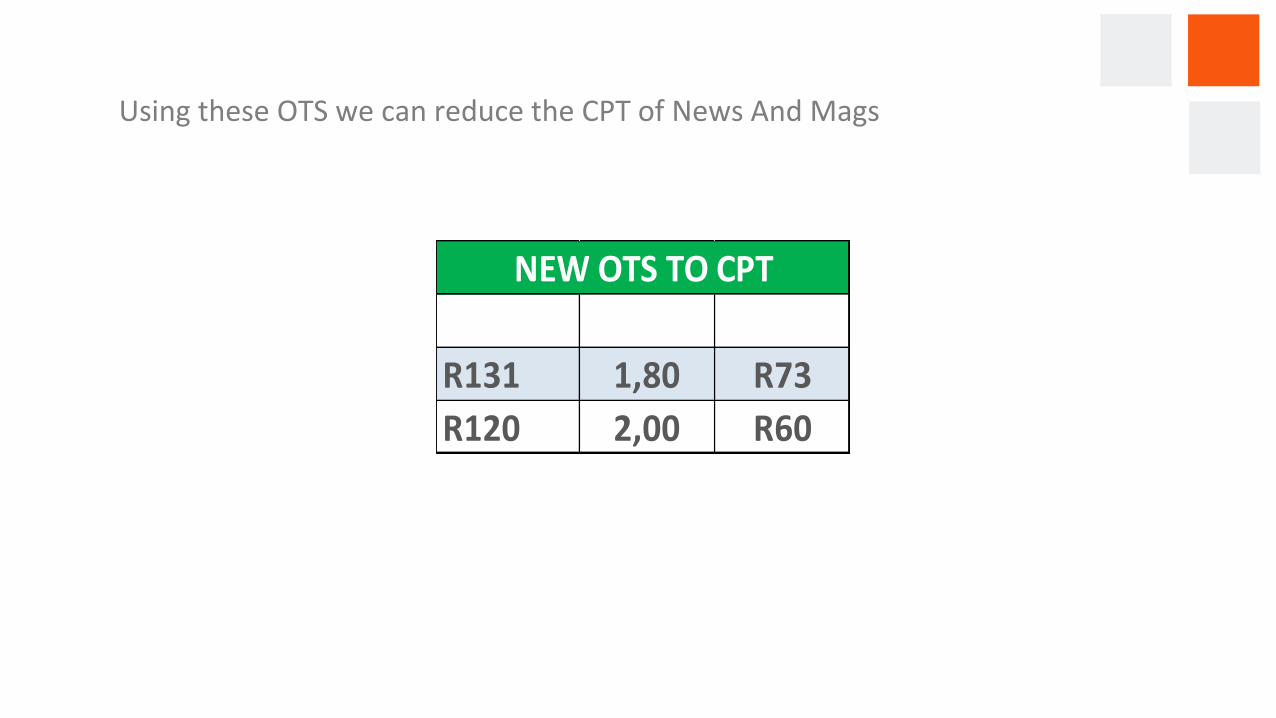
Using these OTS we can reduce the CPT of News And Mags
R131 1,80 R73
R120 2,00 R60
NEW OTS TO CPT
TV
RADIO
OUTDOOR
WEB
DIRECT
WOM
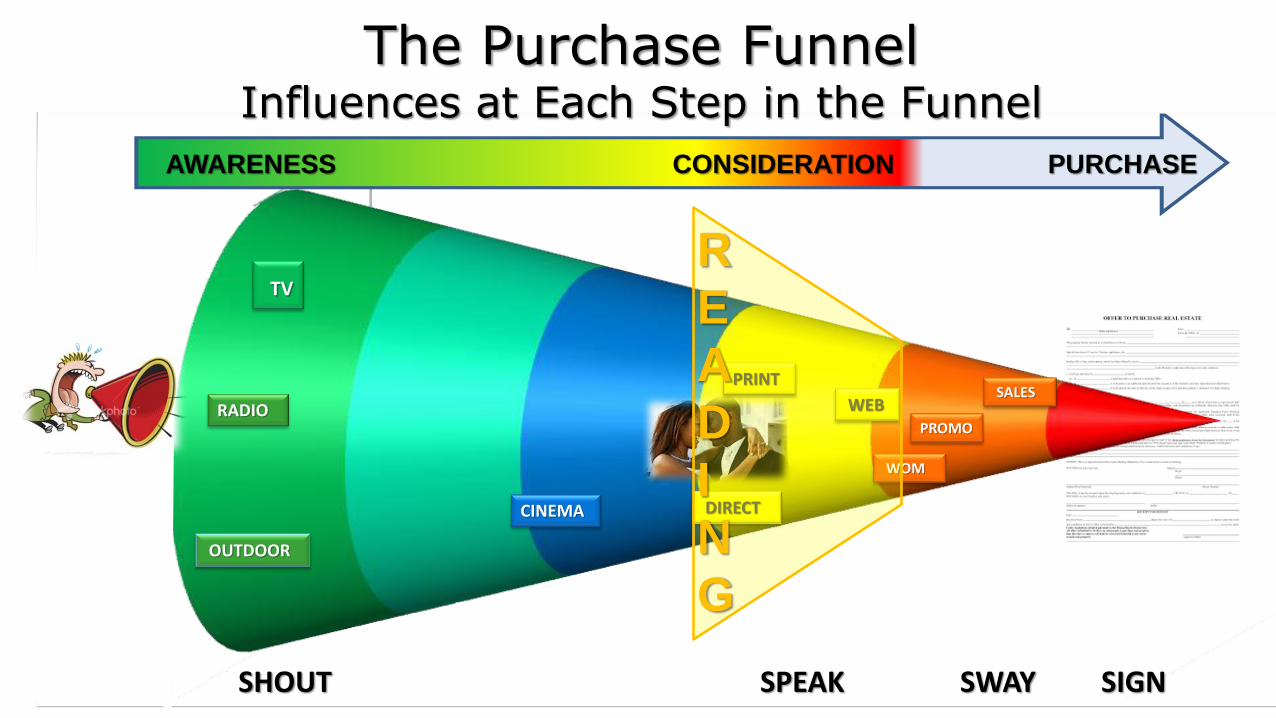
SHOUT SPEAK SWAY SIGN
SALES
CINEMA
AWARENESS CONSIDERATION PURCHASE
The Purchase Funnel Influences at Each Step in the Funnel
PROMO
R
E
A
D
I
N
G


