Page 1
Titre:Title:
Impacts of collaboration and network indicators on patent quality: The case of Canadian nanotechnology innovation
Auteurs:Authors: Catherine Beaudry et Andrea Schiffauerova
Date: 2011
Référence:Citation:
Beaudry, Catherine et Schiffauerova, Andrea (2011). Impacts of collaboration and network indicators on patent quality: The case of Canadian nanotechnology innovation. European Management Journal, 29(5), p. 362-376. doi:10.1016/j.emj.2011.03.001
Document en libre accès dans PolyPublieOpen Access document in PolyPublie
URL de PolyPublie:PolyPublie URL: http://publications.polymtl.ca/2302/
Version: Version finale avant publication / Accepted versionRévisé par les pairs / Refereed
Conditions d’utilisation:Terms of Use: CC BY-NC-ND
Document publié chez l’éditeur commercialDocument issued by the commercial publisher
Titre de la revue:Journal Title: European Management Journal
Maison d’édition:Publisher: Elsevier
URL officiel:Official URL: http://dx.doi.org/10.1016/j.emj.2011.03.001
Mention légale:Legal notice:
In all cases accepted manuscripts should link to the formal publication via its DOI
Ce fichier a été téléchargé à partir de PolyPublie, le dépôt institutionnel de Polytechnique Montréal
This file has been downloaded from PolyPublie, theinstitutional repository of Polytechnique Montréal
http://publications.polymtl.ca
Page 2
Impacts of collaboration and network indicators on patent quality: The case of Canadian
Nanotechnology Innovation
Catherine Beaudryab* and Andrea Schiffauerovac aÉcole Polytechnique of Montréal
bCenter for Interuniversity Research on Science and Technology (CIRST) cConcordia University
Abstract
This article studies the impact of collaboration and co-inventorship network
characteristics of Canadian nanotechnology inventors on the quality of their inventions.
We investigate the impact of four types of variables on patent quality, using the number
of claims as a proxy for quality: (a) the presence of highly central inventors; (b) the
presence of star inventors; (c) repeated collaboration; (d) international collaboration. We
show that the presence of more central inventors and of stars in the research team has a
positive influence on patent quality, while repeated collaboration has a negative impact.
Patents owned by foreign organisations, controlling for whether assignees are firm, yields
patents of higher quality.
Keywords: innovation, collaboration, patent quality, knowledge networks, social
network analysis, nanotechnology, Canada
* Corresponding author: Department of mathematics and industrial engineering, Ecole Polytechnique of
Montréal, C.P. 6079, Down-town station, Montreal (Quebec) Canada, H3C 3A7, tel.: +1 514 340-4711 ext.
3357, fax: +1 514 340-4173, email: [email protected]
*Title Page (with author details)
Page 3
1 2 3 4 5 6 7 8 9 10 11 12 13 14 15 16 17 18 19 20 21 22 23 24 25 26 27 28 29 30 31 32 33 34 35 36 37 38 39 40 41 42 43 44 45 46 47 48 49 50 51 52 53 54 55 56 57 58 59 60 61 62 63 64 65
1
Impacts of collaboration and network indicators on patent quality: The case of Canadian Nanotechnology Innovation
Catherine Beaudryab* and Andrea Schiffauerovac aÉcole Polytechnique of Montréal
bCenter for Interuniversity Research on Science and Technology (CIRST) cConcordia University
Abstract
This article studies the impact of collaboration and co-inventorship network characteristics of
Canadian nanotechnology inventors on the quality of their inventions. We investigate the impact
of four types of variables on patent quality, using the number of claims as a proxy for quality: (a)
the presence of highly central inventors; (b) the presence of star inventors; (c) repeated
collaboration; (d) international collaboration. We show that the presence of more central
inventors and of stars in the research team has a positive influence on patent quality, while
repeated collaboration has a negative impact. Patents owned by foreign organisations, controlling
for whether assignees are firm, yields patents of higher quality.
Keywords: innovation, collaboration, patent quality, knowledge networks, social network
analysis, nanotechnology, Canada
* Corresponding author: Department of mathematics and industrial engineering, Ecole Polytechnique of Montréal,
C.P. 6079, Down-town station, Montreal (Quebec) Canada, H3C 3A7, tel.: +1 514 340-4711 ext. 3357, fax: +1 514
340-4173, email: [email protected]
*Blinded Manuscript (without author details)Click here to view linked References
Page 4
1 2 3 4 5 6 7 8 9 10 11 12 13 14 15 16 17 18 19 20 21 22 23 24 25 26 27 28 29 30 31 32 33 34 35 36 37 38 39 40 41 42 43 44 45 46 47 48 49 50 51 52 53 54 55 56 57 58 59 60 61 62 63 64 65
2
1. Introduction
As an alternative to the three classical locations where innovation takes place (which are
non-profit institutions, profit-seeking firms and the minds of individual inventors), Allen (1983)
introduced the concept of collective invention. The key to understanding a phenomenon of
collective invention is in the exchange and free circulation of knowledge and information within
groups of socially connected (but often competing) agents rather than in the inventive efforts of
particular firms or individuals. The open sharing of information thus results in a fast knowledge
accumulation, high invention rates and possibly higher value innovations. A large number of
historical examples are documented in the literature: for instance, the wide informal knowledge
trading between engineers in competing minimill firms in the US steel industry (von Hippel,
1987; Schrader, 1991), and the knowledge sharing in a cluster of wireless communication firms
in Denmark (Dahl and Pedersen, 2004), but the most commonly cited example is the open
knowledge sharing culture in Silicon Valley (Saxenian, 1994).
The concept of collective invention is convenient for describing the dynamics of knowledge
sharing through various innovation networks. The network of innovators is an interpersonal
network of individuals, who collaborate and exchange information to produce innovations and
scientific knowledge. These inventors and scientists work in universities, research centers or
industrial R&D departments. There is usually no formal agreement among the researchers;
however, they frequently take part in the development of a patent or the creation of a scientific
article. Social network analysis is increasingly used to analyze the way these innovators are
interconnected. Within the research community which investigates the innovation networks it is
widely presumed that two innovators, who have worked together on at least one patent or one
scientific article, will keep in touch afterwards in order to exchange information or to share some
knowledge assets (Agrawal et al., 2006). The patent documents and bibliometric data can thus be
exploited to map the complex web of social ties among innovators, to measure the extent of
collaboration behaviour and to construct representations of innovation networks.
This paper is a part of a project aimed at understanding the influence of collaboration and of
networks on innovation creation and on the quality of innovation in Canadian nanotechnology,
measured by patents. While networks are an important indicator of the „insertion of inventors into
Page 5
1 2 3 4 5 6 7 8 9 10 11 12 13 14 15 16 17 18 19 20 21 22 23 24 25 26 27 28 29 30 31 32 33 34 35 36 37 38 39 40 41 42 43 44 45 46 47 48 49 50 51 52 53 54 55 56 57 58 59 60 61 62 63 64 65
3
the broader social structure of relationships‟1, the importance, form and localisation of the
relationships are also relevant. This work investigates the impact of four types of variables on
patent quality: (a) network centrality of an inventor of the team in the Canadian co-inventorship
network; (b) the presence of star inventors within the patent team; (c) repeated collaboration
between team members; (d) international collaboration. Different network structures and
characteristics have different impacts on knowledge sharing between individuals and their
organisations, thereby greatly influencing innovation creation. The evolution of the network
structure and of the collaboration patterns of inventors has an impact on innovation quality. We
show that patents generated by inventors that are more widely connected and more central (and
hence potentially have access to a larger pool of knowledge) but have collaborated less
repeatedly in the past, produce inventions of greater quality. In addition, the presence of star
inventors in the research team has a positive influence on patent quality. We also suggest that
patents owned by foreign organisations, controlling for whether assignees are firms, yields
patents of higher quality.
The article is organised as follows. Section 2 describes the theoretical framework underlying
the study. Section 3 introduces the data and the methodology used in the analysis that follows.
Section 4 presents the evolution of the four indicators of collaborative patterns. Section 5
presents the statistical analysis aiming to identify the factors that explain patent quality. Finally,
section 6 concludes.
2. Theoretical framework
Sociologists have been using social network analysis to study the behaviour of individuals
for a great number of years (see for instance Granovetter, 1973; Burt, 1987, 1992). Following in
their footsteps, Breschi and Lissoni (2004 and 2005) and later Balconi et al. (2004) constructed
the network of collaborative relationships linking Italian inventors using data on patent co-
inventorship from the European Patent Office (EPO). The links between individuals have
however been modelled in the literature in a number of different ways. Cantner and Graf (2006)
proposed to build the networks of innovators based on technological overlap, which is a measure
1 We are grateful to the editors for this turn of phrase.
Page 6
1 2 3 4 5 6 7 8 9 10 11 12 13 14 15 16 17 18 19 20 21 22 23 24 25 26 27 28 29 30 31 32 33 34 35 36 37 38 39 40 41 42 43 44 45 46 47 48 49 50 51 52 53 54 55 56 57 58 59 60 61 62 63 64 65
4
of closeness of the technological field of two scientists. They also described the evolution of the
innovator network of the town of Jena in Germany using information on scientific mobility.
Singh (2005) inferred collaborative links among individuals using a social proximity graph,
which he also constructed from patent collaboration data. Other researchers, Fleming et al.
(2007) for instance, adopted the co-inventorship of patents as an appropriate device to derive
maps of social relationships between inventors and to build their networks. In this study, we
adopt the co-inventorship of patents as links between inventors to create the network of ties
between these individuals.
Nevertheless, there is a number of limitations regarding the use of patents. Based on
interviews with inventors, Fleming et al. (2007) warned that patent co-inventorship links differ
significantly in their strength and information transfer capacity. In addition, since their decay
rates vary greatly, a substantial number of old ties remain viable even if the relation does not
exist anymore. Moreover, measuring collaboration using solely patent co-inventorship links may
admittedly omit a number of relationships between inventors that chose to only patent a
proportion of their inventions (Sorenson et al., 2006) while protecting the remainder of their
intellectual property with other more appropriate means (Levin et al., 1987; Klevorick et al.,
1995). However, according to McNiven (2007), 88% of the intellectual property instruments used
by Canadian nanotechnology companies are reported to be patents or pending patents. An
important limitation of patent information is its inability to infer the interaction mechanisms and
processes between inventors or the quality of these interactions (Murray, 2002). Finally, another
shortcoming of the patent use for the study on innovation is the fact that inventor affiliation
information does not generally appear in patent documents and its identification thus requires a
second source of information.
While the majority of the inventors named on industrial patents are probably employees of
the assignee, there is an increasingly important phenomenon of academic patenting that should
not be neglected. In fact, the characteristics of the network structures differ depending on whether
they contain purely industrial or also academic researchers. A wide literature on the so-called
„academic‟ patents exists (see the survey of Foray and Lissoni, 2010 for instance). Balconi et al.
(2004) observe that academic inventors that enter the industrial research network are, on average,
more central than non-academic inventors - they exchange information with more people, across
Page 7
1 2 3 4 5 6 7 8 9 10 11 12 13 14 15 16 17 18 19 20 21 22 23 24 25 26 27 28 29 30 31 32 33 34 35 36 37 38 39 40 41 42 43 44 45 46 47 48 49 50 51 52 53 54 55 56 57 58 59 60 61 62 63 64 65
5
more organizations, and therefore play a key role in connecting individuals and network
components. Academics also have a tendency to work within larger teams and for a larger
number of applicants than non-academic inventors. Although we have not yet identified the
academic inventors in our database, we suspect that in a relatively new field such as
nanotechnology, the proximity to science (Meyer, 2000) implies that academics have a non
negligible contribution to patenting. The network structure should therefore resemble that of
Balconi et al. (2004).
Numerous authors have used patent „quality‟ measures as a proxy for patent „value‟ (whether
technological or economical) to study what influences the importance of a patent using a number
of indicators such as citations (Trajtenberg, 1990), patent family size (Lanjouw et al., 1998),
patent renewal decisions (Wang et al., 2010), the number of claims (Lanjouw and Schankerman,
2004) or complex combinations of the above (Bonaccorsi and Thoma, 2007). The findings from
the aforementioned research studies nevertheless reveal some interesting properties of the
innovation networks. Wang et al. (2010) for instance use a network of patent citations to show
that a high brokerage (intermediary position measured by betweenness centrality) has a negative
impact on the patent renewal decision in the early stage of a patent‟s life and a non significant
impact in the mature stage. When citations are used as a proxy for patent quality, the impact of
brokerage has a positive effect on patent quality. Different patent quality measures are thus
influenced differently by various indicators. Considering these impacts of centrality measures, we
hypothesise that a better network position of inventors has a positive impact on patent quality:
H1 An inventor in a more central position contributes to patents of a higher quality.
Cohen and Levinthal (1990) suggested that it may be necessary not only to invest in basic
research inside the firms, but also to hire the best possible research personnel, which they call
“star scientists”. Supporting this argument, Zucker et al. (1998b) show that rates of firm founding
and of new product introduction are related to the connections of the companies to “star”
university scientists. Zucker et al. (1998a) also confirm that the number of products in
development and on the market are positively influenced by collaborative research (evidenced by
coauthored publications) with star scientists. The authors further show that 50% of stars affiliated
with firms have patented discoveries versus only 15.6% of the non affiliated university stars. The
Page 8
1 2 3 4 5 6 7 8 9 10 11 12 13 14 15 16 17 18 19 20 21 22 23 24 25 26 27 28 29 30 31 32 33 34 35 36 37 38 39 40 41 42 43 44 45 46 47 48 49 50 51 52 53 54 55 56 57 58 59 60 61 62 63 64 65
6
patenting of discoveries by stars is an indication of expected commercial value of their
discoveries. Extending the concept of star scientist to star inventor, we hypothesise that:
H2 The presence of a star inventor and a larger number of star inventors in the patent team
enhances patent quality.
Newman (2001) showed that the probability of a pair of scientists collaborating increases
with the number of other collaborators they have in common, and that the probability of a
particular scientist acquiring new collaborators increases with the number of his or her past
collaborators. Former collaborations are also found to be determinant of the future success.
Repeated collaborations with the same partner foster mutual trust and confidence. A higher
frequency of collaboration between two inventors hence leads to a more profound research
relationship, which may involve an exchange of information of higher quality and a transmission
of a greater amount of valuable scientific knowledge, which should result in greater
innovativeness. Cowan et al. (2005) claimed that previous collaborations increase the probability
of a successful collaboration and Fleming et al. (2007) argued that an inventor‟s past
collaboration network will strongly influence subsequent productivity. Not only should repetitive
collaborations have a positive impact on the company‟s innovative production, it should also
have an impact on the scope of patents. With repetitive collaboration, however, interactions
between individuals may become more of a routine, rendering stepping off the beaten track more
difficult as time goes by (Cattani and Ferriani, 2008), forcing a certain cognitive alignment
(Baum and Ingram, 2002). While there is a wide literature on repeated collaboration and trust-
building (see for instance Gulati, 1995; Kogut, 1989), very few authors address the impact of
repeated collaboration on patent quality or patent value. Because of the routinisation of
collaboration that it implies, we thus hypothesise that repeated collaboration has a negative
impact on patent quality and that it overcomes the potential benefits from acquiring new
collaborators (and hence to potentially have access to new knowledge).
H3 The presence pairs of inventors that have repeatedly worked together in the patent team
decreases patent quality.
Other researchers who adopted the network approach have also included geographical
aspects into their models. Gittelman (2007) argued that the geography of the research
Page 9
1 2 3 4 5 6 7 8 9 10 11 12 13 14 15 16 17 18 19 20 21 22 23 24 25 26 27 28 29 30 31 32 33 34 35 36 37 38 39 40 41 42 43 44 45 46 47 48 49 50 51 52 53 54 55 56 57 58 59 60 61 62 63 64 65
7
collaborations has distinct impacts on the firms‟ scientific contribution and their inventive
productivity. The work of the collocated research teams results in scientifically more valuable
knowledge, whereas the more dispersed research groups are more likely to produce commercially
valuable technologies. While it is not the scope of the paper to tackle the interaction between
geographical proximity and social proximity, Gittelman‟s argument suggests that foreign owned
patents, which imply a more dispersed research team, would tend to generate more commercially
valuable technologies emanating from patents with possibly a greater number of claims. We
therefore propose the following hypothesis:
H4 Foreign ownership of a patent increases patent quality.
3. Data and methodology
3.1 Data
In order to build the network of Canadian nanotechnology inventors we used the patent co-
inventorship data contained in the Nanobank database. Nanobank is a public digital library
comprising data on nanotechnology articles, patents and federal grants, as well as firms engaged
in using nanotechnology commercially. As such, it is a very unique and comprehensive dataset.
The Nanobank patent database is based on data extracted from the United States Patents and
Trademarks Office (USPTO) database. This is the only patent database which provides the
geographical location of the address of each inventor (unlike the Canadian Intellectual Property
Office database (CIPO) or the European Patent Office (EPO)). The use of the USPTO database
instead of the CIPO for the analysis of the Canadian nanotechnology may have caused a certain
bias in the data, but we consider it minimal, since Canadian inventors usually patent both in
Canada and in the US. The much larger and easily accessible nanotechnology American market
offers them a greater potential than the nanotechnology market in Canada.
From the Nanobank database we have selected the patents in which at least one inventor
resides in Canada (5067 patents), which we define as Canadian nanotechnology patents,
regardless of the assignee‟s location. We have employed additional filters2 using the keyword
2 The resulting nanotechnology patent database therefore includes the patents that have both been identified in Nanobank and by using the keywords used by Porter et al. (2008).
Page 10
1 2 3 4 5 6 7 8 9 10 11 12 13 14 15 16 17 18 19 20 21 22 23 24 25 26 27 28 29 30 31 32 33 34 35 36 37 38 39 40 41 42 43 44 45 46 47 48 49 50 51 52 53 54 55 56 57 58 59 60 61 62 63 64 65
8
search strategy of Porter et al. (2008), which enabled us to select only the patents which are
strictly related to nanotechnology and created a Canadian nanotechnology patent database which
comprises 1443 patents from 1979 to 2005. Because we use the intersection of two datasets that
were built using two different methodologies and keyword strategies, we are confident that we
truly measure nanotechnology patents in Canada. The concept of social network analysis defined
above was used to identify the connections between all the nanotechnology inventors of these
patents and to construct representations of the networks. The use of the social network analysis
program PAJEK was instrumental in building these representations of innovation networks and in
analyzing their architectures. The analysis of these collaborative networks enables us to
understand the co-inventorship characteristics of the inventors in Canadian nanotechnology
clusters.
We have created 11 subnetworks corresponding to five-year moving windows starting from
1989 and finishing in 2004 (as shown in Figure 1) in order to track the evolution of the
collaboration and network properties over time. Constructing the network for each year
separately would alter the connectivity of the networks. Using only the patents granted in a given
year would not capture the relationships created before and maintained through this particular
year. We chose to work with the subnetworks created during an interval of five years as we
assume that relationships between any co-inventors who appeared together on one USPTO patent
lasts 5 years on average during which information and scientific knowledge can be actively
exchanged. Five-year moving windows thus more accurately reflect the evolutionary structure of
a collaboration network. As Canadian nanotechnology patenting in the period prior to 1989 is
rather sporadic, our sample starts with the first year where at least 20 Canadian nanotechnology
patents were issued. In addition, we did not include the year 2005 as it is only partially covered
by Nanobank. Furthermore, we also removed from the sample the patents which do not have an
assignee yet. As a consequence, our sample consists of 1218 patents, to which 1794 inventors
have contributed.
We analyze the cooperation relationships existing in each of these five-year intervals. Figure
1 shows the size of each of the eleven subnetworks corresponding to the five-year intervals. The
size is determined by the number of inventors (vertices) which are present in the subnetwork.
Some of the inventors are included in all of the subnetworks (if they worked on several patents
Page 11
1 2 3 4 5 6 7 8 9 10 11 12 13 14 15 16 17 18 19 20 21 22 23 24 25 26 27 28 29 30 31 32 33 34 35 36 37 38 39 40 41 42 43 44 45 46 47 48 49 50 51 52 53 54 55 56 57 58 59 60 61 62 63 64 65
9
spread throughout the years), some of them just in the few initial ones after which their
nanotechnology scientific interest faded away, and some have started contributing to
nanotechnology research only recently. The figure also includes the number of patents which
were used for building the particular subnetwork of each time interval. The number of patents has
increased faster (15.62% per year) than the number of inventors (15.29% per year) hence
suggesting that the sector benefits from a critical mass of inventive individuals.
Figure 1: Number of inventors and patents used in each subnetwork
3.2 Model
In this article we use the number of claims as an indicator of a patent quality. Patent claims
are a series of numbered expressions describing the invention in technical terms and defining the
extent of the protection conferred by a patent (the legal scope of the patent). A high number of
patent claims is an indication that an innovation is broader and has a greater potential
profitability. It has been frequently suggested and empirically demonstrated (see for example
Tong and Frame, 1994) that the number of claims is significantly and consistently indicative of
higher value patents. The conclusions of most of the papers on patent value reviewed by van
Zeebroeck and van Pottelsberghe de la Potterie (2011, in press) are supportive of the positive
association of the number of claims with patent value. Lanjouw and Schankerman (2004) have
suggested that specifically in the biotechnology field, the number of claims is the most important
indicator of patent quality. However, there are some shortcomings related to the use of claims as
0
200
400
600
800
1000
1200
1400
89-93 90-94 91-95 92-96 93-97 94-98 95-99 96-00 97-01 98-02 99-03 00-04
number of inventors in the interval number of patents in the interval
Page 12
1 2 3 4 5 6 7 8 9 10 11 12 13 14 15 16 17 18 19 20 21 22 23 24 25 26 27 28 29 30 31 32 33 34 35 36 37 38 39 40 41 42 43 44 45 46 47 48 49 50 51 52 53 54 55 56 57 58 59 60 61 62 63 64 65
10
a patent quality indicator as well. According to Lanjouw and Schankerman (2001), the number of
claims also depends on the technology field (drugs and health, chemical, and electronic
inventions have more claims per patent, while patents protecting mechanical and other types of
inventions have fewer claims), the ownership types (in each field the US-owned patents have on
average a higher number of claims than foreign-owned ones, while Japanese-owned patents have
on average the lowest number of claims) and on the time (the mean number of claims per patent
has increased over time).
In our analysis, the number of claims is used as a proxy for the patent quality, and hence as a
measure of the success of the innovation process. Because the dependent variable is a count
measure, we use the pooled cross-section3 data to estimate the number of claims of each patent. A
Poisson regression is generally appropriate for this purpose (Hausman et al., 1984):
Pr Y y exp x x y!
The particularity of this model resides in the fact that both the probability of a given number
of events, Pr(Y = y), and the variance of the number of events is equal to the (x). The Poisson
process therefore makes a strong assumption that the variance is equal to the mean, which implies
that there is no overdispersion (when the variance exceeds the mean) in the sample. In general,
the negative binomial is generally employed to correct for this overdispersion which causes for
the standard errors to be underestimated, and hence for significance of the coefficients to be
overestimated. The negative binomial formulation usually takes the form:
exp x
where , the error term follows a Gamma distribution. The specification of the
overdispersion is therefore:
Var Y E Y 1E Y 3 We have omitted the subscript t from the equations because only 328 organisations have more than one patent. We are thus analysing the data as a cross-section rather than as a panel, but accounting for possible time effects with year dummy variables.
Page 13
1 2 3 4 5 6 7 8 9 10 11 12 13 14 15 16 17 18 19 20 21 22 23 24 25 26 27 28 29 30 31 32 33 34 35 36 37 38 39 40 41 42 43 44 45 46 47 48 49 50 51 52 53 54 55 56 57 58 59 60 61 62 63 64 65
11
Because the claims of each individual patent are considered in this analysis, a firm that has
been granted a patent will appear more than once in the database. To account for the non
independence of the observations generated by this formulation, our model allows for intragroup
correlation, each corresponding to an individual firm. Using the cluster option of the nbreg
procedure of Stata 10 allows the observations to be independent between groups, but not
necessarily within groups. We are aware that a number of inventors may have worked for various
organisations, which would hence compromise our assumption of independence across groups.
This phenomenon is however relatively infrequent throughout the database.
In contrast to the stable augmentation observed for the number of inventors and the number
of patents, Figure 2 shows that the average number of claims has declined during the first half of
the sample and steadily increased in the second half of the sample.
Figure 2: Average number of claims per patent in each subnetwork
3.3 Explanatory variables
The independent variables used in the negative binomial regressions to explain the number of
claims of a patent are described below. A number of variables are used to test each hypothesis.
The variables are presented in the order of the hypotheses that they contribute to validating.
The first hypothesis takes into consideration the collaborator‟s collaborators, their
collaborators, and so on. Here we first adopt a network approach in which a structure of the entire
20
21
22
23
24
25
26
27
28
89-93 90-94 91-95 92-96 93-97 94-98 95-99 96-00 97-01 98-02 99-03 00-04
Page 14
1 2 3 4 5 6 7 8 9 10 11 12 13 14 15 16 17 18 19 20 21 22 23 24 25 26 27 28 29 30 31 32 33 34 35 36 37 38 39 40 41 42 43 44 45 46 47 48 49 50 51 52 53 54 55 56 57 58 59 60 61 62 63 64 65
12
net of complex relationships is analyzed and characterized. There are two main indicators of
centrality which can be measured in disconnected networks: degree centrality and betweenness
centrality. Degree centrality of an inventor in a co-patenting network is based on the number of
co-inventors with whom this inventor has collaborated. Inventors with higher values of degree
centrality are found in more central positions in the subnetwork. They are directly connected to
more inventors and thus have more potential sources of scientific knowledge at their disposal and
better opportunities to spread information further. This makes them important for the
transmission of information through the network. These inventors are highly important for a firm
because of their numerous direct connections and thus their ability to potentially shape the
company‟s economic outcome. We thus expect this variable to have a positive effect on patent
quality (H1). Degree centrality however does not always correlate with the power and influence
an inventor might have over the network. This is better measured by betweenness centrality.
Betweenness centrality of a vertex is defined as the proportion of all shortest distances
between pairs of other vertices in the network that include this vertex (de Nooy et al., 2004). An
inventor is more central if a large proportion of the shortest paths between pairs of other
inventors in the subnetwork have to „go through him‟. In other words, if one person at one end of
the network wanted to „send‟ a message to another person in another part of the network, the
shortest path would be the one which involves the smallest number of intermediaries to „transmit‟
the message. The individuals often found on these shortest paths have higher values of
betweenness centrality. Betweenness centrality is therefore based on the inventor‟s importance to
other inventors as an intermediary and it measures his „control‟ over the interactions between
other inventors and thus over the flow of knowledge in the subnetwork. As such, an important
intermediary should have a positive influence on patent quality (H1). An inventor with many
direct connections (high degree centrality) might not be very powerful as an intermediary (not
very high betweenness centrality) and in terms of access to information he might be in fact
dependent on others.
For the first two measures of individual centrality within the network, we calculate the
average value over the team contributing to each patent, as well as the maximum value
corresponding to the individual that is the most central. The first indicator measures the degree
centrality of an inventor (AveDegcent and MaxDegcent), i.e. the number of direct connections of
Page 15
1 2 3 4 5 6 7 8 9 10 11 12 13 14 15 16 17 18 19 20 21 22 23 24 25 26 27 28 29 30 31 32 33 34 35 36 37 38 39 40 41 42 43 44 45 46 47 48 49 50 51 52 53 54 55 56 57 58 59 60 61 62 63 64 65
13
that inventor, while the second measure characterises the degree to which an inventor acts as an
intermediary for the network (AveBtwcent and MaxBtwcent). Four different indicators will
therefore contribute to the testing of the first hypothesis (H1).
The most central inventors are not necessarily the most prolific inventors. Most inventive
output in nanotechnology is produced by a small proportion of the most prolific inventors. These
highly productive scientists are generally called “star scientists” and their important role has been
much discussed in the literature. In this paper, we define these prominent researchers in our
dataset based on patent quantity only. We thus extend the concept of star scientist to star
inventor. To test the second hypothesis (H2), we use two types of indicators corresponding to
four variables. The first counts the number of patents per inventor and takes the average over the
patent team (AvePatperinv) and the maximum value among these inventors (MaxPatperinv). This
simple indicator allows the identification of star inventors, those individuals that have contributed
to 20 or more patents. Having identified the stars, we measure the number of star inventors
(NbStar) involved in the patent production and include a dummy variable to identify whether the
patent team involves at least one star inventor (dStar). In order not to exacerbate the bias
attributed to the fact that in the beginning of the sample, inventors may already be star inventors,
we sum the patents of each inventor since 1979, and not 1989. Otherwise, experienced inventors
who retired in the early 1980s would not appear as star inventors. That said, there are two ways to
consider the „quality‟ of inventors. The first consists in counting the number of patents to which
each inventor has contributed up to the year of the patent examined („experience measure‟). The
road to stardom hence becomes gradual for these career-prolific inventors. The second focuses on
the intrinsic potential capacity of the inventor and considers that if an inventor eventually
becomes a star it is because he or she is an extraordinary individual to start with. We therefore
count the total number of patents of this individual, regardless of the patent granting date, to
identify the stars („career measure‟). Unfortunately, as we cannot foresee the future, inventors
who started their career towards the end of the sample will never qualify for stardom in this case.
While for the former, experience would be the key ingredient to increasing patent quality, for the
latter, innovation potential is the most important aspect. Having run the regressions with both
types of quality measures, we found that despite its flaws, the latter measure has the most
influence on the number of claims of a patent. These are the results presented in this paper.
Page 16
1 2 3 4 5 6 7 8 9 10 11 12 13 14 15 16 17 18 19 20 21 22 23 24 25 26 27 28 29 30 31 32 33 34 35 36 37 38 39 40 41 42 43 44 45 46 47 48 49 50 51 52 53 54 55 56 57 58 59 60 61 62 63 64 65
14
An important aspect of the research aims to identify whether repeated collaboration (H3)
contributes to increasing the quality of patents. We construct a variable that counts the number of
prior co-invention occurrences between any two inventors (PriorColl). We then calculate the
maximum number of these occurrences associated with each inventor of each patent team
(MaxPriorColl) as well as the average across the research team (AvePriorColl). Two indicators
are thus used to validate the third hypothesis (H3). Our first analysis showed a negative impact of
more frequently repeated collaboration. A further investigation revealed that there was a wide
gap between patents owned by firms and patents owned by other institutions. To take these
differences into account, we introduce an interactive dummy variable, dFirm, to modulate the
number of prior collaborations between any two inventors of the team. This dummy variable
takes the value 1 if the patent assignee is a firm and 0 otherwise.
Finally, to account for the foreign ownership of patents (H4), we include a dummy variable
that takes the value 1 if the patent assignee is foreign and the value 0 otherwise (Canadian),
dForeign. Because a number of foreign assignees are firms, the dummy variable described in the
previous paragraph also plays the role of a control variable to that effect. We have investigated
whether the patent team involved foreign inventors as well as the proportion of these foreign
inventors in the team, but none of these measures were significant in the regressions.
The descriptive statistics of these variables are presented in appendix. Because these
variables vary considerably during the 15 years of our sample, the next section present the
evolution of the main indicators that will be used in the regressions. As a consequence, year
dummy variables are also added to the regression to take into consideration all other aspects of
the indicators‟ evolution that are not explained by the other independent variables.
4. Descriptive statistics on the evolution of collaborative patterns
Although our data does not permit the use of standard panel data analyses, which would take
into consideration the evolution of the characteristics, time is nevertheless important in the
regression analysis that follows. As such, simple descriptive statistics (Table 2) are not explicit
enough to get a feel of the data. In this section we thus present the four sets of indicators which
characterize the nanotechnology collaborative relationships corresponding to each of the four
hypotheses presented above. While the first hypothesis relates to the position of an individual in
Page 17
1 2 3 4 5 6 7 8 9 10 11 12 13 14 15 16 17 18 19 20 21 22 23 24 25 26 27 28 29 30 31 32 33 34 35 36 37 38 39 40 41 42 43 44 45 46 47 48 49 50 51 52 53 54 55 56 57 58 59 60 61 62 63 64 65
15
the network, the last three hypotheses require the disassembling of the entire network into
collaborating pairs to describe the nature and frequency of collaborative activities between these
innovating couples. Let us consider each family of variables in turn.
4.1 Inventor centrality position (H1)
Before turning to the centrality measures, let us examine collaboration in general. The
average size of collaboration teams, as represented here by the average number of co-inventors in
one patent, has gradually increased from less than 2.8 to well over 3.4 co-inventors per patent
(Figure 3). For the entire period examined, there is on average 3.34 inventors per patent. This
implies that Canadian inventors have increased their tendency to collaborate more intensively and
to share information with a greater number of researchers than in the past. This may also
represent the increasingly complex nature of nanotechnology projects requiring larger teams.
Figure 3: Average number of co-inventors in a patent per five-year period
An important advantage of the network approach consists in the fact that indicators derived
from it take into consideration all the network relationships and not only the immediate
collaborators or collaborations. The yearly average measure of betweenness centrality presented
in the graph below (Figure 4) is normalised, while the yearly average measure of degree
centrality is not. In the regressions, we will use the normalised values for both indicators. A non
2.5
2.6
2.7
2.8
2.9
3
3.1
3.2
3.3
3.4
3.5
89-93 90-94 91-95 92-96 93-97 94-98 95-99 96-00 97-01 98-02 99-03 00-04
Page 18
1 2 3 4 5 6 7 8 9 10 11 12 13 14 15 16 17 18 19 20 21 22 23 24 25 26 27 28 29 30 31 32 33 34 35 36 37 38 39 40 41 42 43 44 45 46 47 48 49 50 51 52 53 54 55 56 57 58 59 60 61 62 63 64 65
16
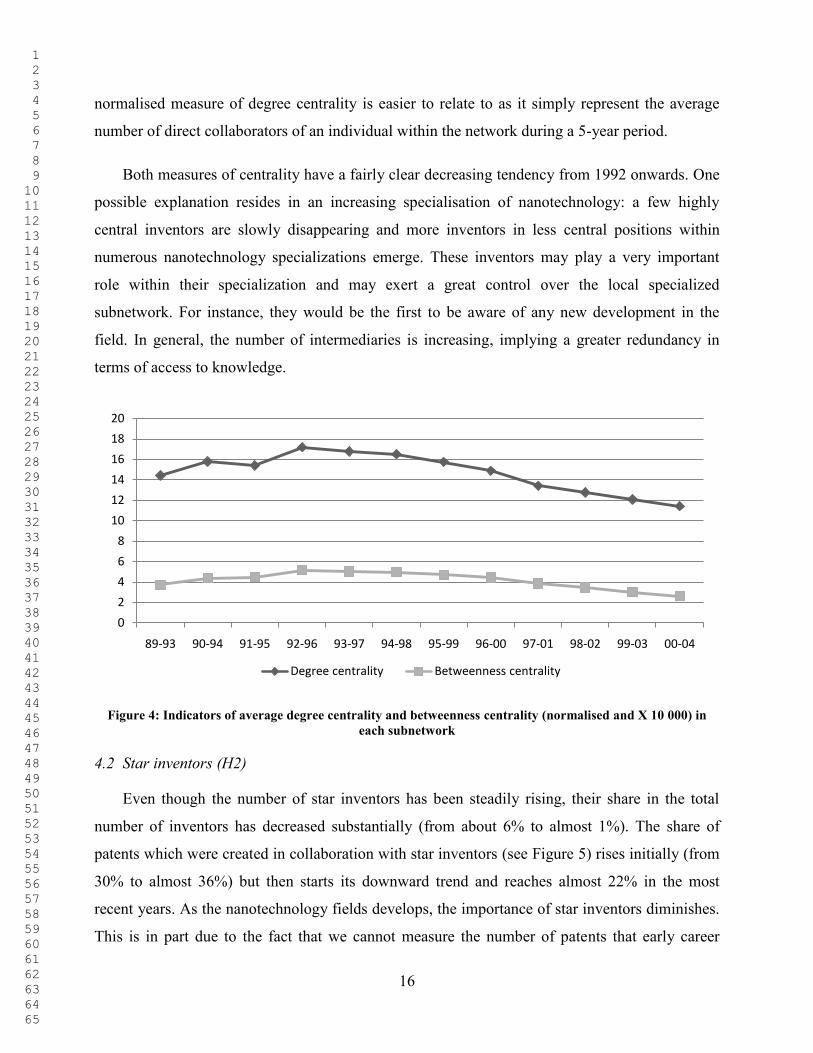
normalised measure of degree centrality is easier to relate to as it simply represent the average
number of direct collaborators of an individual within the network during a 5-year period.
Both measures of centrality have a fairly clear decreasing tendency from 1992 onwards. One
possible explanation resides in an increasing specialisation of nanotechnology: a few highly
central inventors are slowly disappearing and more inventors in less central positions within
numerous nanotechnology specializations emerge. These inventors may play a very important
role within their specialization and may exert a great control over the local specialized
subnetwork. For instance, they would be the first to be aware of any new development in the
field. In general, the number of intermediaries is increasing, implying a greater redundancy in
terms of access to knowledge.
Figure 4: Indicators of average degree centrality and betweenness centrality (normalised and X 10 000) in each subnetwork
4.2 Star inventors (H2)
Even though the number of star inventors has been steadily rising, their share in the total
number of inventors has decreased substantially (from about 6% to almost 1%). The share of
patents which were created in collaboration with star inventors (see Figure 5) rises initially (from
30% to almost 36%) but then starts its downward trend and reaches almost 22% in the most
recent years. As the nanotechnology fields develops, the importance of star inventors diminishes.
This is in part due to the fact that we cannot measure the number of patents that early career
0
2
4
6
8
10
12
14
16
18
20
89-93 90-94 91-95 92-96 93-97 94-98 95-99 96-00 97-01 98-02 99-03 00-04
Degree centrality Betweenness centrality
Page 19
1 2 3 4 5 6 7 8 9 10 11 12 13 14 15 16 17 18 19 20 21 22 23 24 25 26 27 28 29 30 31 32 33 34 35 36 37 38 39 40 41 42 43 44 45 46 47 48 49 50 51 52 53 54 55 56 57 58 59 60 61 62 63 64 65
17
inventors of the latter part of the sample will produce in the future. This is a limitation of our
study. We have no means of identifying these potential future star-inventors.
Figure 5: Share of patents created in collaboration with at least one star inventor
4.3 Repeated collaboration (H3)
Figure 6 shows both the number of collaborative links (pairs) existing in each interval as well
as the total number of all collaborations which took place between all of these pairs. The fact that
the number of the collaborations increases faster than the number of collaborating pairs is
indicative of an increased intensity of cooperation activity throughout the years. In other words,
repeated collaboration is becoming more frequent in Canadian nanotechnology.
Around 34% of all the collaborative relations between pairs of inventors in period examined
involve repetitive collaborations. In some cases the collaborative relationships proved to be very
fruitful, as the most frequent collaboration between a pair of inventors was repeated 50 times
(i.e., the collaborating pair are named inventors on 50 patents together). The highest number of
patents filed together by the same inventors during any five-year period is 35. Most of the
relationships between a pair of inventors are, however, one time collaborations (resulting in only
1 patent). Figure 7 shows the share of the repetitive collaborations out of the total number of
collaborations starting at around 15%, then steadily increasing in time and reaching 35% of all
collaborations in recent years.
20%
22%
24%
26%
28%
30%
32%
34%
36%
38%
89-93 90-94 91-95 92-96 93-97 94-98 95-99 96-00 97-01 98-02 99-03 00-04
Page 20
1 2 3 4 5 6 7 8 9 10 11 12 13 14 15 16 17 18 19 20 21 22 23 24 25 26 27 28 29 30 31 32 33 34 35 36 37 38 39 40 41 42 43 44 45 46 47 48 49 50 51 52 53 54 55 56 57 58 59 60 61 62 63 64 65
18
Figure 6: Number of collaborating pairs and collaborations per five-year period
Figure 7: Proportion of repeated collaborations with the same partners per five-year period
4.4 International collaboration (H4)
Finally, we have located the addresses of all inventors in the database to identify the
proportion of this collaboration that occurs across frontiers. International research relationships
represent relatively high shares of collaborative activities (20%-30%). The overall collaboration
pattern has changed slightly over time, the two most important developments being the gradual
0
1000
2000
3000
4000
5000
6000
89-93 90-94 91-95 92-96 93-97 94-98 95-99 96-00 97-01 98-02 99-03 00-04
Number of collaborating pairs Number of collaborations
0%
5%
10%
15%
20%
25%
30%
35%
40%
89-93 90-94 91-95 92-96 93-97 94-98 95-99 96-00 97-01 98-02 99-03 00-04
Page 21
1 2 3 4 5 6 7 8 9 10 11 12 13 14 15 16 17 18 19 20 21 22 23 24 25 26 27 28 29 30 31 32 33 34 35 36 37 38 39 40 41 42 43 44 45 46 47 48 49 50 51 52 53 54 55 56 57 58 59 60 61 62 63 64 65
19
decrease in the frequency of the international joint research partnerships in the first half of the
sample followed by an increasing internationalization in the latest years (see Figure 8). The
evolution of the proportion of foreign collaboration is surprisingly similar to that of the number
of claims per patent presented above in Figure 2. This strong similitude, on average would tend to
support Gittleman‟s (2006) argument according to which dispersed research groups produce more
commercially valuable technologies, potentially with a greater number of claims. Unfortunately,
this relation never materialised in the regressions4.
Figure 8: Proportion of the collaborations that involve foreign inventors
Not only do Canadian inventors collaborate with foreign inventors, but also a large
proportion of the patents are owned by foreign entities, although the trend is decreasing and a
larger proportion of the intellectual property remains in Canada (see Figure 9). The V-shaped
curve of international collaboration is thus not observed in terms of foreign ownership of patents.
4 In our regression analyses, we have tested both whether patent teams were composed of Canadian and foreign inventors and whether assignees were foreign to measure the importance of international collaboration on patent quality. Although the former is more representative of the geographical spread of teams, the variable was never significant in the regressions, while the latter was significant. As a consequence, only the results with the significant foreign ownership dummy variable will be presented.
15%
20%
25%
30%
35%
89-93 90-94 91-95 92-96 93-97 94-98 95-99 96-00 97-01 98-02 99-03 00-04
Page 22
1 2 3 4 5 6 7 8 9 10 11 12 13 14 15 16 17 18 19 20 21 22 23 24 25 26 27 28 29 30 31 32 33 34 35 36 37 38 39 40 41 42 43 44 45 46 47 48 49 50 51 52 53 54 55 56 57 58 59 60 61 62 63 64 65
20
Figure 9: Proportion of patents owned by firms, foreign organisations and foreign firms
5. Results
In general, the regression results (see Table 1) confirm most of our hypotheses with a few
notable exceptions. Whether we consider the average degree centrality of inventors of the patent
team, or the degree centrality of the most central inventor of the team, both measures have a
positive influence on the number of claims of the patent to which they have contributed. The first
hypothesis (H1) is thus validated. The same cannot be said for the intermediary position
(betweenness centrality) of individual inventors. While the average measure is not significant, the
maximum value is positive and significant. It would thus appear that what influences most the
value of a patent is to have at least one good „intermediary‟, whose betweenness centrality is
high. Because the average value is not significant, we suggest that too much redundancy, caused
by a large number of „intermediaries‟ in the team „through which‟ knowledge potentially flows,
does not influence patent value.
To follow on the measure of inventor quality, we find that the fact that a team has
contributed to more patents (AvePatperinv) on average does not influence patent value. Using the
maximum number of patents per inventor only yields a weakly significant positive impact. In
contrast, the fact that within the team there is at least one star inventor and the more stars there
are both have a positive influence on the number of claims associated with a patent, hence
validate the second hypothesis (H2). It is not so much the number of patents that counts but the
40%
45%
50%
55%
60%
65%
70%
75%
80%
85%
89-93 90-94 91-95 92-96 93-97 94-98 95-99 96-00 97-01 98-02 99-03 00-04
Prop Firms Prop Foreign Prop Foreign Firm
Page 23
1 2 3 4 5 6 7 8 9 10 11 12 13 14 15 16 17 18 19 20 21 22 23 24 25 26 27 28 29 30 31 32 33 34 35 36 37 38 39 40 41 42 43 44 45 46 47 48 49 50 51 52 53 54 55 56 57 58 59 60 61 62 63 64 65
21
potential for a large contribution to patenting that influences patent value. Star inventors thus
have an impact.
Turning now to repeated collaborations, we find that in general, the more any two inventors
have collaborated in the past (whether the maximum or the average value is used), the less the
patent to which they have also contributed is likely to present more claims, i.e. the coefficient of
MaxPriorColl is negative5. Our third hypothesis (H3) is thus validated. To test whether this is
true for patents owned by firms, we include an interactive dummy variable (MaxPriorColl x
dFirm) in the regression to account for prior collaboration only when assignee organisations are
firms. Including such an interactive term in the regression implies that the resulting coefficient of
the variable relating to prior collaboration for the firms is the sum of the coefficients of
MaxPriorColl and of MaxPriorColl x dFirm. Because the sum of the coefficients remain
negative, we can say that controlling for the type of assignee, prior co-invention has a lesser
negative effect for firms. One of the most plausible explanations for this result is that repeated co-
invention limits the opportunities of a team to tap into new knowledge, hence reducing the
potential value of the resulting innovation, hence supporting the intuition of Cattani and Ferriani
(2008) on the co-participation in movie production. New knowledge is accessible from inventors
to which the team members are connected (measured by the centrality indicators) and by new
team members. Although the sum of the coefficients of AvePriorColl and of AvePriorColl x
dFirm (the results of which are presented in the appendix) yields a slightly larger negative value
than that of MaxPriorColl and of MaxPriorColl x dFirm, because the mean AvePriorColl is 55%
of the mean value of MaxPriorColl, the overall contribution (the mean value multiplied by the
sum of the coefficients) to patent quality is less negative. This suggests that new team members
to the firm (who contribute to reducing the overall mean of the variable) probably bring fresh
knowledge to the team, but not enough to change the overall sign of the joint coefficient.
5 The results with the mean number of prior collaborations (AvePriorColl) across the research team are presented in appendix.
Page 24
1 2 3 4 5 6 7 8 9 10 11 12 13 14 15 16 17 18 19 20 21 22 23 24 25 26 27 28 29 30 31 32 33 34 35 36 37 38 39 40 41 42 43 44 45 46 47 48 49
22
Table 1: Regression results
(1) (2) (3) (4) (5) (6) (7) (8)
H1
AveDegcent 0.0101 *** (0.0032) MaxDegcent 0.0074 *** (0.0014) AveBtwcent 0.0082 (0.0063) MaxBtwcent 0.0077 *** (0.0026)
H2
AvePatperinv 0.0022 (0.0022) MaxPatperinv 0.0031 * (0.0016) NbStar 0.0969 *** (0.0290) dStar 0.2196 *** (0.0638)
H3
MaxPriorColl -0.0358 *** -0.0362 *** -0.0313 *** -0.0323 *** -0.0335 *** -0.0368 *** -0.0424 *** -0.0434 *** (0.0112) (0.0112) (0.0110) (0.0112) (0.0113) (0.0112) (0.0110) (0.0111) MaxPriorColl x dFirm 0.0279 ** 0.0293 ** 0.0275 ** 0.0259 ** 0.0296 *** 0.0297 *** 0.0346 *** 0.0369 *** (0.0121) (0.0121) (0.0118) (0.0120) (0.0115) (0.0116) (0.0113) (0.0118)
H4 dForeign 0.1302 ** 0.1053 * 0.2183 *** 0.1797 *** 0.2280 *** 0.1946 *** 0.1864 *** 0.1713 ** (0.0617) (0.0587) (0.0694) (0.0594) (0.0750) (0.0713) (0.0681) (0.0712)
dFirm 0.1454 ** 0.1345 ** 0.1732 *** 0.1689 *** 0.1687 *** 0.1576 ** 0.1534 ** 0.1442 ** (0.0624) (0.0630) (0.0621) (0.0612) (0.0644) (0.0637) (0.0624) (0.0629) Constant 2.6950 *** 2.7096 *** 2.7144 *** 2.7212 *** 2.7156 *** 2.7174 *** 2.7508 *** 2.7580 *** (0.1614) (0.1644) (0.1563) (0.1567) (0.1582) (0.1583) (0.1641) (0.1713) Year dummies yes yes yes yes yes yes yes yes ln(alpha) -1.1862 *** -1.1950 *** -1.1706 *** -1.1814 *** -1.1681 *** -1.1738 *** -1.1844 *** -1.1843 *** (0.1681) (0.1755) (0.1660) (0.1701) (0.1677) (0.1669) (0.1729) (0.1746) Clusters 328 328 328 328 328 328 328 328 N 1218 1218 1218 1218 1218 1218 1218 1218 Mean Wald chi2(20) 258.32 294.22 173.18 206.16 183.26 219.60 204.69 199.46 Log pseudolikelihood -4803.41 *** -4798.75 *** -4811.92 *** -4806.00 *** -4813.40 *** -4810.21 *** -4804.41 *** -4804.53 *** Note: ***, **, * represent significance at the 1%, 5% and 10% levels respectively.
Page 25
1 2 3 4 5 6 7 8 9 10 11 12 13 14 15 16 17 18 19 20 21 22 23 24 25 26 27 28 29 30 31 32 33 34 35 36 37 38 39 40 41 42 43 44 45 46 47 48 49 50 51 52 53 54 55 56 57 58 59 60 61 62 63 64 65
23
Finally, our results also support Gittelman‟s (2007) assertion that foreign collaboration
fosters more commercially valuable innovation. Our fourth hypothesis (H4) is thus also validated.
Year dummy variables were included in all the regressions but are mostly non significant with
the exception of the four most recent years where they have a positive and significant effect.
6. Conclusions
The purpose of this work was to study the influence of various collaboration indicators
between inventors on the quality of the invention output. Four sets of indicators were introduced
to track the changes of the Canadian nanotechnology collaboration patterns during the period of
1989-2004 using five-year moving-average windows: inventor centrality within the collaboration
network, star-inventorship, repeatedness of collaboration, and international collaboration. These
indicators reveal important evolutionary changes of the collaborative environment in Canadian
nanotechnology.
We study two properties of the position of inventors within the nanotechnology collaboration
network: degree and betweenness centrality. As time progresses, we observe that on average,
individuals occupy less central positions (average degree centrality and betweenness centrality
are both decreasing). This is probably a consequence of the increasing nanotechnology
specialization as the field develops and more applications in a wide range of domains are found.
Although this reflects our impression from consulting nanotechnology scientists, this remains a
speculation and our current research consists in identifying the various niches of expertise, both
academic and industrial, in Canada. Inventors in highly centralized networks make use of a clear
network centre which enables knowledge to spread easier. The observed decreasing average
centrality could thus contribute to slowing down knowledge transmission through the network.
When we examine the impact of both centrality measures on patent quality, we however find that,
more central inventors contribute to increasing patent quality (H1). From a management point of
view, however, our results suggest that inventors should be encouraged to develop more
relationships with important knowledge sources, i.e. highly connected individuals.
We observe that Canadian nanotechnology inventors have an increasing tendency to build
collaborative ties with a higher number of partners and to collaborate on nanotechnology projects
more intensively than they have done in the past. The presence of star-inventors on a patent team
Page 26
1 2 3 4 5 6 7 8 9 10 11 12 13 14 15 16 17 18 19 20 21 22 23 24 25 26 27 28 29 30 31 32 33 34 35 36 37 38 39 40 41 42 43 44 45 46 47 48 49 50 51 52 53 54 55 56 57 58 59 60 61 62 63 64 65
24
has a positive influence on the quality of the resulting invention (H2). Although we are not able
to properly measure whether an individual has the making of a star-inventor (recent inventors
have not registered enough patents), we suspect that the impact would be even stronger if we
could measure their future production. Applications of nanotechnology are becoming more
complex requiring larger collaborative teams. These collaboration indicators possibly imply that
Canadian nanotechnology inventors have been increasingly able to diffuse greater amounts of
valuable scientific knowledge among a higher number of other inventors and therefore both to
emit and to absorb more knowledge spillovers. Nurturing collaboration teams with fresh
knowledge from distinct research environments leads to an increased opportunity for innovative
recombination of that knowledge and thus enhances inventors‟ future creativity. If the fresh
knowledge is provided by a team composed of a greater number of star-inventors, patent quality
is also enhanced.
Nanotechnology inventors also tend to return for subsequent collaborations to the same
partners with whom they have already collaborated within the past five years. Repeated
collaborations with the same partner lead to a more profound research relationship, which may
involve an exchange of information of higher quality (e.g., a rare or undisclosed knowledge), but
unfortunately tends to limit access to novel knowledge, if these inventors are not also well
connected to a number of other inventors (in a more central position in the network). Our results
show a negative effect of repeated co-inventorship on the patent quality (H3). Firms would thus
benefit from building more diverse teams of inventors that have not collaborated in the past. For
instance, involving two star-inventors that have worked on a number of projects together would
not have the same benefit as involving two unrelated star-inventors. If the average proportion of
repeated collaboration continues to rise (as shown by Figure 7), this tendency should worry firms
concentrating in nanotechnology development activities.
Another aspect of team diversity stems from international collaboration. Although we could
not show that teams composed of foreign inventors had a positive influence on patent quality as
the strong similarity between Figure 2 and Figure 8 would have us believe, we nevertheless show
that patents of foreign assignees are of a higher quality (H4), the delocalisation of invention
teams being implied by foreign ownership. As the Canadian expertise continues to develop, and
Page 27
1 2 3 4 5 6 7 8 9 10 11 12 13 14 15 16 17 18 19 20 21 22 23 24 25 26 27 28 29 30 31 32 33 34 35 36 37 38 39 40 41 42 43 44 45 46 47 48 49 50 51 52 53 54 55 56 57 58 59 60 61 62 63 64 65
25
the proportion of foreign ownership continues to diminish (as shown in Figure 9), we recommend
that international collaboration remains a non negligible part of the way inventors work.
An important limitation of this work resides in the lack of information about the inventors
themselves. A large literature has studied academic patenting and found scientists-inventors to be
more central and to play an important role in knowledge diffusion through the network. We are
currently in the process of merging our patent data with scientific article data that contains the
affiliation of all authors in order to distinguish the inventors that are academics from those that
are not. Distinguishing between the academic stars and the industrial stars may shed some light
on who are the real star inventors and how they become stars. The second limitation of this study
lies in the patent quality proxy used for patent value. Although a number of scholars use the
number of patent claims as a proxy, increasingly, hybrid measures that combine numerous
indicators are preferred to infer patent quality. We are therefore in the process of gathering patent
citations as well as patent renewal information to verify the robustness of our results. Another
line of future research is concerned with the contribution of each type of inventor to the value of
future patents. For instance, is there a difference between the effect of repeated collaborations
between academic inventors, who generally have access to a larger scientific network, and that of
industrial inventors?
Acknowledgements Beaudry acknowledges financial support of the Social Science and Humanities Research
Council of Canada (grant no. 820-2006-0064). We are indebted to the careful editing of the
editors of this special issue. We acknowledge helpful comments from two anonymous referees as
well as from the editors of this special issue. We are grateful for the help on databases provided
by Martin Trépanier. Ahmad Barirani provided research assistance. None of these, however, are
responsible for any remaining errors.
References Allen, R.C. (1983) Collective invention. Journal of Economic Behaviour and Organization 4, 1-
24.
Agrawal, A., Cockburn, I. and McHale, J. (2006) Gone but not forgotten: Knowledge flows,
labour mobility and enduring social relationships. Journal of Economic Geography 6, 571-591.
Page 28
1 2 3 4 5 6 7 8 9 10 11 12 13 14 15 16 17 18 19 20 21 22 23 24 25 26 27 28 29 30 31 32 33 34 35 36 37 38 39 40 41 42 43 44 45 46 47 48 49 50 51 52 53 54 55 56 57 58 59 60 61 62 63 64 65
26
Balconi, M., Breschi, S. and Lissoni, F. (2004) Networks of inventors and the role of academia:
An exploration of Italian patent data. Research Policy 33, 127-145.
Baum, J.A.C. and Ingram, P. (2002) Interorganizational learning and network organizations:
Toward a behavioral theory of the 'interfirm‟, In: Augier, M. and March, J.G. (eds.), The
Economics of Choice, Change, and Organization. Essays in the Memory of Richard M. Cyert.
Edward Elgar, Cheltenham UK.
Breschi, S. and Lissoni, F. (2004) Knowledge networks from patent data: Methodological issues
and research targets. In Glänzel W., Moed H. and Schmoch U. (eds), Handbook of
Quantitative S&T Research, Kluwer Academic Publishers.
Breschi, S. and Lissoni, F. (2005) “Cross-firm” inventors and social networks: localised
knowl-edge spillovers revisited. Annales d‟Economie et de Statistique 79/80, 189-209.
Bonaccorsi, A. and Thoma, G. (2007) Institutional complementarity and inventive performance
in nano science and technology. Research Policy 36, 813-831.
Burt, R.S. (1987) Social contagion and innovation: Cohesion versus structural equivalence. The
American Journal of Sociology 92, 1287-1335.
Burt, R.S. (1992) Structural Holes: The Social Structure of Competition. Harvard University
Press, Cambridge, MA.
Cantner, U. and Graf, H. (2006) The network of innovators in Jena: An application of social
network analysis. Research Policy 35, 463-480.
Cattani, G. and Ferriani, S. (2008) A core/periphery perspective on individual creative
performance: Social networks and cinematic achievements in the Hollywood film industry.
Organization Science 19, 824-844.
Cowan, R., Jonard, N. and Zimmermann, J.-B. (2005) Bilateral collaboration and emergent
networks. SSRN Working Papers.
Dahl, M.S. and Pedersen, C.O.R. (2004) Knowledge flows through informal contacts in industrial
clusters: myth or reality? Research Policy 33, 1673-1686.
de Nooy, W., Mrvar, A. and Batagelj, A. (2005) Exploratory Social Network Analysis with
Pajek. Cambridge University Press, Cambridge.
Page 29
1 2 3 4 5 6 7 8 9 10 11 12 13 14 15 16 17 18 19 20 21 22 23 24 25 26 27 28 29 30 31 32 33 34 35 36 37 38 39 40 41 42 43 44 45 46 47 48 49 50 51 52 53 54 55 56 57 58 59 60 61 62 63 64 65
27
Fleming, L., C. King, III, and Juda, A. (2007) Small worlds and regional innovation.
Organization Science 18, 938-954.
Foray, D. and Lissoni, F. (2010) University research and public–private interaction. In:
Rosenberg, N., Hall, B. (Eds.), Handbook of Economics of Technical Change, North
Holland/Elsevier.
Gittelman, M. (2007) Does geography matter for science-based firms? Epistemic communities
and the geography of research and patenting in biotechnology. Organization Science 18, 724-
741.
Granovetter, M.S. (1973) The strength of weak ties. American Journal of Sociology 78, 1360-
1380.
Gulati, R. (1995) Social structure and alliance formation patterns: a longitudinal analysis.
Administrative Science Quarterly 40, 619-652.
Hausman, J., Hall, B.H. and Griliches, Z. (1984) Economic models for count data with an
application to the patents and R&D relationship. Econometrica 52, 909–938.
Klevorick, A. K., Levin, R., Nelson, R. and Winter, S. (1995) On the sources and significance of
interindustry differences in technological opportunities, Research Policy 24, 185–205.
Kogut, B. (1989) The stability of joint ventures: reciprocity and competitive rivalry. The Journal
of Industrial Economics 38, 183–198.
Lanjouw, J.O., Pakes, A. and Putnam, J. (1998) How to count patents and value intellectual
property. The uses of patent renewal and application data. Journal of Industrial Economics 46,
405–432.
Lanjouw, J.O. and Schankerman, M. (2001) Characteristics of patent litigation: a window on
competition. RAND Journal of Economics 32, 129-151.
Lanjouw, J.O. and Schankerman, M. (2004) Patent quality and research productivity: Measuring
innovation with multiple indicators. The Economic Journal 114, 441–465.
Levin, R.C., Klevorick, A.K., Nelson, R.R. and Winter, S.G. (1987) Appropriating the returns
from industrial research and development. Brookings Papers on Economic Activity 3, 783–
820.
Page 30
1 2 3 4 5 6 7 8 9 10 11 12 13 14 15 16 17 18 19 20 21 22 23 24 25 26 27 28 29 30 31 32 33 34 35 36 37 38 39 40 41 42 43 44 45 46 47 48 49 50 51 52 53 54 55 56 57 58 59 60 61 62 63 64 65
28
McNiven, C. (2007) Overview and discussion of the results of the pilot survey on
nanotechnology in Canada, Statistics Canada, Catalogue no. 88F0006XIE, no. 005.
Meyer, M. (2000) Patent citations in a novel field of technology - What can they tell about
interactions between emerging communities of science and technology? Scientometrics 48,
151-178.
Murray, F. (2002) Innovation as co-evolution of scientific and technological networks: exploring
tissue engineering. Research Policy 31, 1389-1403.
Newman, M. E. J. (2001) Clustering and preferential attachment in growing networks. Physical
Review 64, 025102.
Porter, A. L., Youtie, J., Shapira, P. and Schoeneck, D. J. (2008) Refining search terms for
nanotechnology. Journal of Nanoparticle Research 10, 715-728.
Saxenian, A. (1994) Regional Advantage: Culture and Competition in Silicon Valley and Route
128. Harvard University Press, Cambridge, MA.
Schrader, S. (1991) Informal technology transfer between firms: Cooperation through
information trading. Research Policy 20, 153-170.
Singh, J. (2005) Collaborative networks as determinants of knowledge diffusion. Management
Science 51, 756-770.
Sorenson, O., Rivkin, J.W. and Fleming, L. (2006) Complexity, networks and knowledge flows.
Research Policy 35, 994-1017.
Tong, X. and Frame, J.D. (1994) Measuring national technological performance with patent
claims data. Research Policy 23,133-141.
Trajtenberg, M. (1990) A penny for your quotes: patent citations and the value of innovations.
RAND Journal of Economics 21, 172–187.
van Zeebroeck, N. and van Pottelsberghe de la Potterie, B. (2011) Filing strategies and patent
value, Economics of Innovation and New Technology 20, in press.
von Hippel, E. (1987) Cooperation between rivals: Informal know-how trading. Research Policy
16, 291-302.
Page 31
1 2 3 4 5 6 7 8 9 10 11 12 13 14 15 16 17 18 19 20 21 22 23 24 25 26 27 28 29 30 31 32 33 34 35 36 37 38 39 40 41 42 43 44 45 46 47 48 49 50 51 52 53 54 55 56 57 58 59 60 61 62 63 64 65
29
Zucker, L.G., Darby, M.R. and Armstrong, J. (1998a) Geographically localized knowledge:
Spillovers or markets? Economic Inquiry 36, 65-86.
Zucker, L.G., Darby, M.R. and Brewer, M. (1998b) Intellectual human capital and the birth of
US biotechnology enterprises. American Economic Review 88, 290-306.
Wang, J-C., Chiang, C-H. and Lin, S-W. (2010) Network structure of innovation: can brokerage
or closure predict patent quality? Scientometrics 84, 735-748.
Page 32
1 2 3 4 5 6 7 8 9 10 11 12 13 14 15 16 17 18 19 20 21 22 23 24 25 26 27 28 29 30 31 32 33 34 35 36 37 38 39 40 41 42 43 44 45 46 47 48 49
30
7. Appendix
Table 2: Descriptive statistics (mean, standard deviation and correlations)
Variable Mean Std. Dev. 1 3 4 5 6 7 8 9 10 11 12 13 14 1 NbClaims 24.22 (16.70) 1.00 3 AvePatperinv 13.19 (17.37) 0.09 1.00 4 AveDegcent 12.14 (12.58) 0.19 0.83 1.00 5 NbStar 0.65 (1.09) 0.16 0.70 0.79 1.00 6 MaxPatperinv 21.47 (27.07) 0.13 0.90 0.87 0.83 1.00 7 MaxDegcent 18.27 (18.86) 0.22 0.69 0.94 0.76 0.83 1.00 8 AveBtwcent 3.61 (6.19) 0.10 0.75 0.76 0.58 0.76 0.67 1.00 9 MaxBtwcent 7.77 (12.60) 0.15 0.64 0.78 0.68 0.79 0.79 0.90 1.00
10 dFirm 0.80 (0.40) 0.16 0.27 0.34 0.25 0.31 0.35 0.20 0.22 1.00 11 dForeign 0.49 (0.50) 0.19 0.48 0.64 0.45 0.54 0.65 0.46 0.51 0.33 1.00 12 dStar 0.33 (0.47) 0.19 0.77 0.80 0.85 0.84 0.79 0.58 0.62 0.30 0.50 1.00 13 MaxPriorColl 4.06 (8.02) 0.07 0.69 0.56 0.64 0.69 0.49 0.50 0.53 0.19 0.29 0.58 1.00 14 AvePriorColl 2.22 (5.07) 0.03 0.72 0.45 0.38 0.53 0.31 0.45 0.31 0.15 0.21 0.46 0.79 1.00
Note: Average and Maximum degree centrality and betweenness centrality have been normalised (X 10 000)
Page 33
1 2 3 4 5 6 7 8 9 10 11 12 13 14 15 16 17 18 19 20 21 22 23 24 25 26 27 28 29 30 31 32 33 34 35 36 37 38 39 40 41 42 43 44 45 46 47 48 49
31
Table 3: Regression results with the mean number of prior collaboration
(1') (2') (3') (4') (5') (6') (7') (8')
H1
AveDegcent 0.0093 *** (0.0025) MaxDegcent 0.0065 *** (0.0012) AveBtwcent 90.4651 (56.0373) MaxBtwcent 63.3072 *** (19.5203)
H2
AvePatperinv 0.0041 * (0.0024) MaxPatperinv 0.0026 ** (0.0012) NbStar 0.0744 *** (0.0257) dStar 0.2066 *** (0.0657)
H3
AvePriorColl -0.0641 *** -0.0636 *** -0.0570 *** -0.0574 *** -0.0666 *** -0.0643 *** -0.0692 *** -0.0734 *** (0.0229) (0.0232) (0.0219) (0.0220) (0.0227) (0.0224) (0.0215) (0.0214) AvePriorColl x dFirm 0.0526 ** 0.0556 ** 0.0484 ** 0.0500 ** 0.0535 ** 0.0543 ** 0.0612 *** 0.0633 *** (0.0233) (0.0238) (0.0226) (0.0225) (0.0221) (0.0224) (0.0219) (0.0219)
H4 dForeign 0.1273 ** 0.1080 * 0.2142 *** 0.1802 *** 0.2099 *** 0.1935 *** 0.1854 *** 0.1673 ** (0.0618) (0.0593) (0.0681) (0.0605) (0.0746) (0.0717) (0.0690) (0.0700)
dFirm 0.1404 ** 0.1298 ** 0.1701 *** 0.1622 *** 0.1596 ** 0.1540 ** 0.1492 ** 0.1406 ** (0.0635) (0.0640) (0.0628) (0.0621) (0.0650) (0.0645) (0.0632) (0.0637) Constant 2.7136 *** 2.7317 *** 2.7177 *** 2.7383 *** 2.7166 *** 2.7318 *** 2.7652 *** 2.7681 *** (0.1561) (0.1619) (0.1505) (0.1555) (0.1523) (0.1532) (0.1632) (0.1689) Year dummies yes yes yes yes yes yes yes yes ln(alpha) -1.1884 *** -1.1943 *** -1.1740 *** -1.1811 *** -1.1738 *** -1.1758 *** -1.1828 *** -1.1865 *** (0.1698) (0.1761) (0.1666) (0.1705) (0.1675) (0.1685) (0.1735) (0.1758) Clusters 328 328 328 328 328 328 328 328 N 1218 1218 1218 1218 1218 1218 1218 1218 Mean Wald chi2(20) 257.44 293.25 172.94 205.91 197.23 229.02 211.71 210.23 Log pseudolikelihood -4802.27 *** -4799.20 *** -4810.02 *** -4806.18 *** -4810.20 *** -4809.10 *** -4805.33 *** -4803.33 *** Note: ***, **, * represent significance at the 1%, 5% and 10% levels respectively.