+ All Categories
Home > Technology > TMForum Network Asset Management Survey Report 2014

TMForum Network Asset Management Survey Report 2014

Date post: 31-Jul-2015
Category:
Upload: subex-limited
View: 28 times
Download: 2 times
Share this document with a friend
Popular Tags:
1
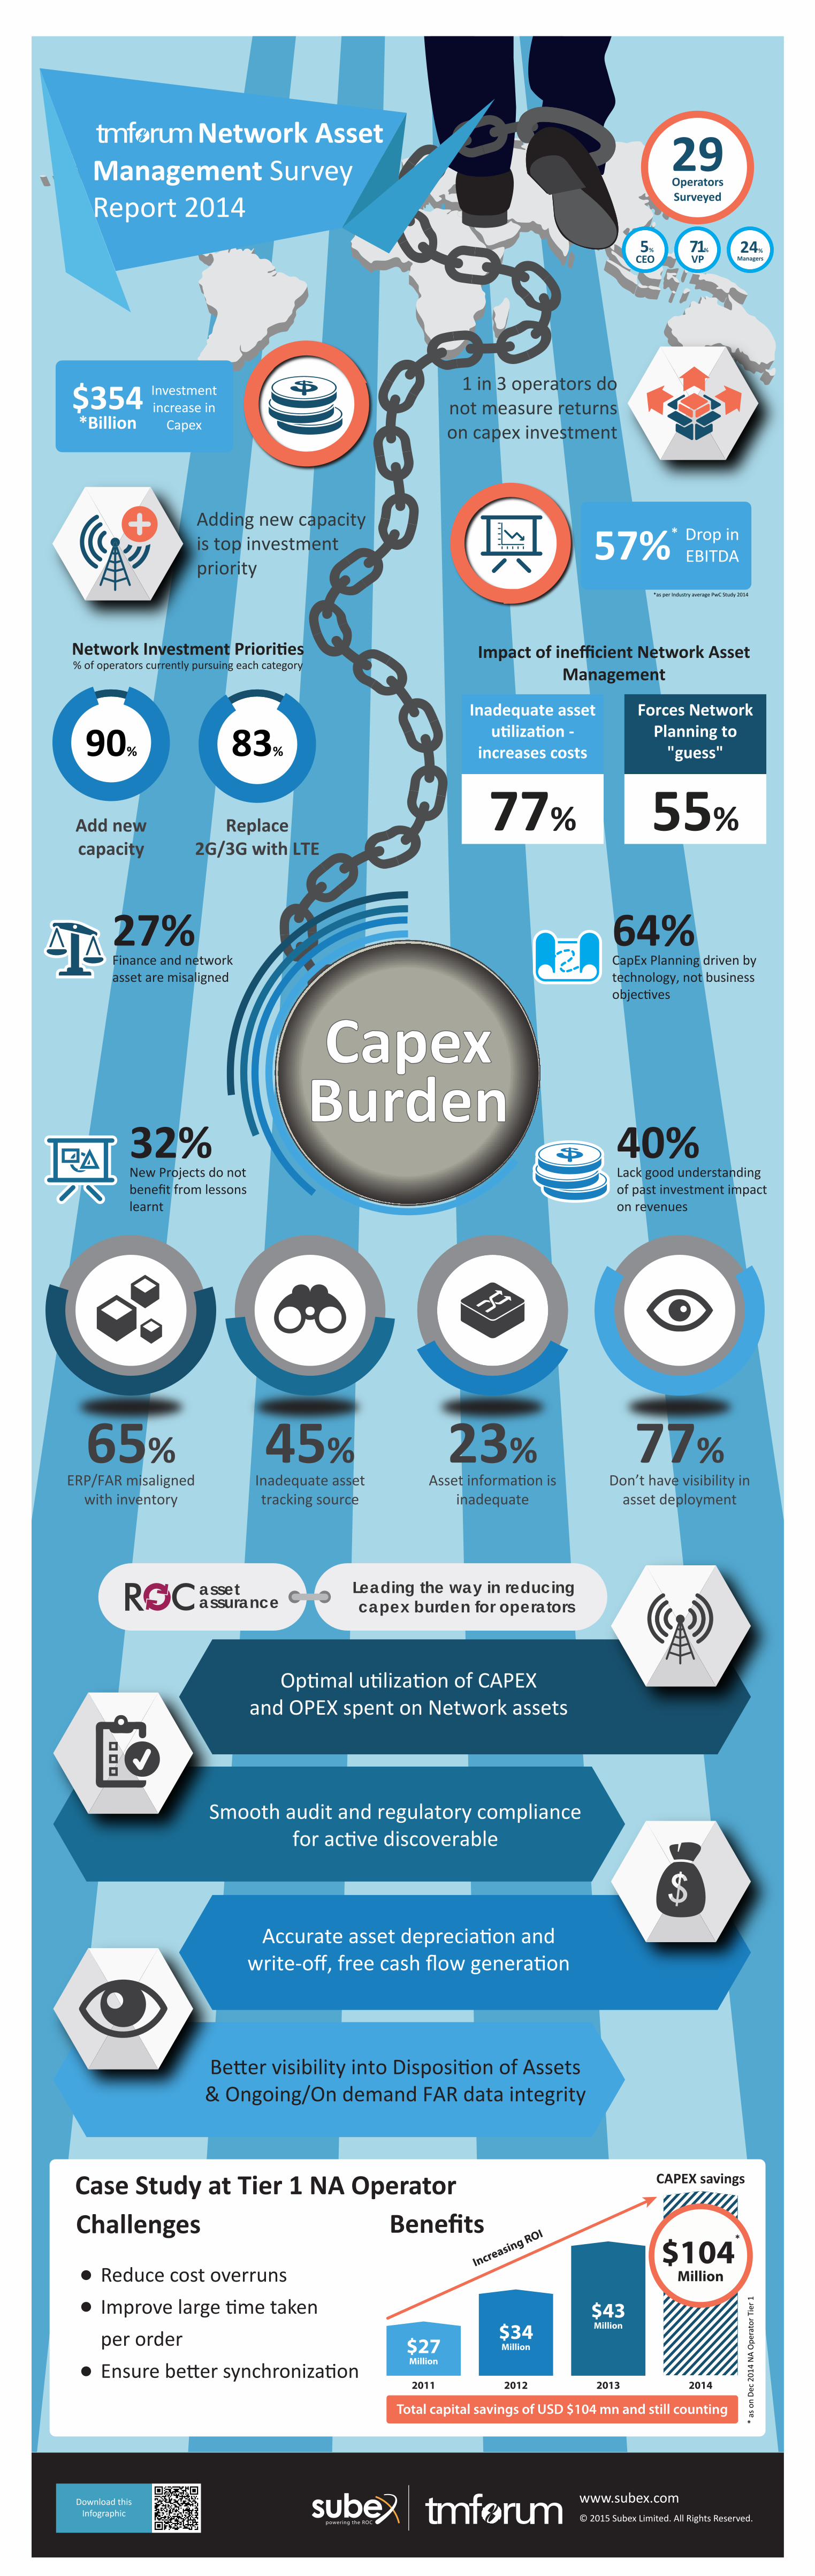
© 2015 Subex Limited. All Rights Reserved. www.subex.com Download this Infographic $354 Investment increase in Capex *Billion 1 in 3 operators do not measure returns on capex investment Adding new capacity is top investment priority ERP/FAR misaligned with inventory 65% Inadequate asset tracking source 45% Asset informaon is inadequate 23% Don’t have visibility in asset deployment 77% 57% * Drop in EBITDA *as per Industry average PwC Study 2014 New Projects do not benefit from lessons learnt 32% Lack good understanding of past investment impact on revenues 40% CapEx Planning driven by technology, not business objecves 64% Finance and network asset are misaligned 27% Management Survey Report 2014 Network Asset Operators Surveyed 29 90% Add new capacity 83% Replace 2G/3G with LTE Network Investment Priories % of operators currently pursuing each category Impact of inefficient Network Asset Management 77% Inadequate asset ulizaon - increases costs 55% Forces Network Planning to "guess" VP 71 % Managers 24% CEO 5% Capex Burden Benefits Challenges Reduce cost overruns Improve large me taken per order Ensure beer synchronizaon Case Study at Tier 1 NA Operator CAPEX savings * as on Dec 2014 NA Operator Tier 1 2011 $27 Million 2012 2014 $34 Million 2013 $43 Million $104 * Million Increasing ROI Total capital savings of USD $104 mn and still counting Beer visibility into Disposion of Assets & Ongoing/On demand FAR data integrity Accurate asset depreciaon and write-off, free cash flow generaon Smooth audit and regulatory compliance for acve discoverable Opmal ulizaon of CAPEX and OPEX spent on Network assets Leading the way in reducing capex burden for operators asset assurance
Transcript

© 2015 Subex Limited. All Rights Reserved.

www.subex.comDownload thisInfographic

$354 Investmentincrease in

Capex*Billion

1 in 3 operators do not measure returns on capex investment

Adding new capacity is top investment priority

ERP/FAR misaligned with inventory

65%Inadequate asset tracking source

45%Asset information is

inadequate

23%Don’t have visibility in

asset deployment

77%

57%* Drop inEBITDA

*as per Industry average PwC Study 2014

New Projects do not benefit from lessons learnt

32%Lack good understanding of past investment impact on revenues

40%

CapEx Planning driven by technology, not business objectives

64%Finance and network asset are misaligned

27%

Management SurveyReport 2014

Network AssetOperatorsSurveyed

29

90%

Add newcapacity

83%

Replace2G/3G with LTE

Network Investment Priorities% of operators currently pursuing each category

Impact of inefficient Network AssetManagement

77%

Inadequate asset utilization -

increases costs

55%

Forces Network Planning to

"guess"

VP71%

Managers24%

CEO5%

CapexBurden

BenefitsChallenges

Reduce cost overruns

Improve large time taken

per order

Ensure better synchronization

Case Study at Tier 1 NA Operator CAPEX savings

* as

on

Dec

201

4 N

A O

pera

tor

Tier

1

2011

$27Million

2012 2014

$34Million

2013

$43Million

$104*

MillionIncreasing ROI

Total capital savings of USD $104 mn and still counting

Better visibility into Disposition of Assets & Ongoing/On demand FAR data integrity

Accurate asset depreciation and write-off, free cash flow generation

Smooth audit and regulatory compliance for active discoverable

Optimal utilization of CAPEXand OPEX spent on Network assets

Leading the way in reducing capex burden for operators

assetassurance

Recommended