Table of Contents Index to Financial Statements UNITED STATES SECURITIES AND EXCHANGE COMMISSION Washington D.C. 20549 FORM 10-K ⌧ ANNUAL REPORT PURSUANT TO SECTION 13 OR 15(d) OF THE SECURITIES EXCHANGE ACT OF 1934 For the year ended May 31, 2006 OR TRANSITION REPORT PURSUANT TO SECTION 13 OR 15(d) OF THE SECURITIES EXCHANGE ACT OF 1934 For the transition period from to Commission File Number 0-9950 TEAM, INC. (Exact name of registrant as specified in its charter) TEXAS 74-1765729 (State of incorporation) (I.R.S. Employer Identification No.) 200 Hermann Drive Alvin, Texas 77511 (Address of principal executive offices) (Zip Code) Registrant’s telephone number, including area code: (281) 331-6154 Securities registered pursuant to Section 12(b) of the Act: Title of each Class Name of Each Exchange on which Registered Common Stock, $.30 par value American Stock Exchange, Inc Securities registered pursuant to Section 12(g) of the Act: None Indicate by check mark if the registrant is a well-known seasoned issuer, as defined in Rule 405 of the Securities Act. Yes No ⌧ Indicate by check mark if the registrant is not required to file reports pursuant to Section 13 or Section 15(d) of the Act. Yes No ⌧ Indicate by check mark whether the registrant (1) has filed all reports required to be filed by Section 13 or 15(d) of the Securities Exchange Act of 1934 during the preceding 12 months (or for such shorter period that the registrant was required to file such reports), and (2) has been subject to such filing requirements for the past 90 days. Yes ⌧ No Indicate by check mark if disclosure of delinquent filers pursuant to Item 405 of Regulation S-K is not contained herein, and will not be contained, to the best of registrant’s knowledge, in definitive proxy or information statements incorporated by reference in Part III of this Form 10-K or any amendment to this Form 10-K. ⌧ Indicate by check mark whether the registrant is a large accelerated filer, an accelerated filer, or a non-accelerated filer. See definition of “accelerated filer and large accelerated filer” in Rule 12b-2 of the Exchange Act. (Check one): Large accelerated filer Accelerated filer ⌧ Non-accelerated filer Indicate by check mark whether the registrant is a shell company. Yes No ⌧
Transcript
Table of Contents
Index to Financial Statements
UNITED STATES
SECURITIES AND EXCHANGE COMMISSION Washington D.C. 20549
FORM 10-K ⌧ ANNUAL REPORT PURSUANT TO SECTION 13 OR 15(d) OF THE SECURITIES EXCHANGE ACT
OF 1934 For the year ended May 31, 2006
OR
TRANSITION REPORT PURSUANT TO SECTION 13 OR 15(d) OF THE SECURITIES EXCHANGE ACT OF 1934
For the transition period from to Commission File Number 0-9950
TEAM, INC. (Exact name of registrant as specified in its charter)
TEXAS 74-1765729
(State of incorporation) (I.R.S. Employer Identification No.) 200 Hermann Drive Alvin, Texas 77511
(Address of principal executive offices) (Zip Code) Registrant’s telephone number, including area code: (281) 331-6154
Securities registered pursuant to Section 12(b) of the Act:
Title of each Class Name of Each Exchange on which Registered Common Stock, $.30 par value American Stock Exchange, Inc
Securities registered pursuant to Section 12(g) of the Act: None
Indicate by check mark if the registrant is a well-known seasoned issuer, as defined in Rule 405 of the Securities Act. Yes No
⌧ Indicate by check mark if the registrant is not required to file reports pursuant to Section 13 or Section 15(d) of the Act. Yes No
⌧ Indicate by check mark whether the registrant (1) has filed all reports required to be filed by Section 13 or 15(d) of the Securities
Exchange Act of 1934 during the preceding 12 months (or for such shorter period that the registrant was required to file such reports), and (2) has been subject to such filing requirements for the past 90 days. Yes ⌧ No
Indicate by check mark if disclosure of delinquent filers pursuant to Item 405 of Regulation S-K is not contained herein, and will not be contained, to the best of registrant’s knowledge, in definitive proxy or information statements incorporated by reference in Part III of this Form 10-K or any amendment to this Form 10-K. ⌧
Indicate by check mark whether the registrant is a large accelerated filer, an accelerated filer, or a non-accelerated filer. See definition of “accelerated filer and large accelerated filer” in Rule 12b-2 of the Exchange Act.
(Check one): Large accelerated filer Accelerated filer ⌧ Non-accelerated filer Indicate by check mark whether the registrant is a shell company. Yes No ⌧
As of August, 1, 2006, 8,646,968 shares of the registrant’s common stock were outstanding, of which 7,261,307 were held by non-affiliates. The aggregate market value of common stock held by non-affiliates of the registrant (based upon the closing sales price of $25.11 per share on the American Stock Exchange, Inc. on such date) was $182,331,419. For purposes of the foregoing calculation only, all directors, executive officers and known 5% beneficial owners have been deemed affiliates.
Table of Contents
Index to Financial Statements
FORM 10-K INDEX PART I 1
ITEM 1. BUSINESS 1 General Description of Business 1 Acquisitions and Dispositions 1 Description of Segments 2 Narrative Description of Business 2 Service Lines 4 Available Information 5
ITEM 1.A RISK FACTORS 6ITEM 1.B UNRESOLVED STAFF COMMENTS 9ITEM 2. PROPERTIES 9ITEM 3. LEGAL PROCEEDINGS 9ITEM 4. SUBMISSION OF MATTERS TO A VOTE OF SECURITY HOLDERS 9
PART II 10
ITEM 5.
MARKET FOR REGISTRANT'S COMMON EQUITY, RELATED STOCKHOLDER MATTERS AND ISSUER PURCHASES OF EQUITY SECURITIES 10
ITEM 6. SELECTED FINANCIAL DATA 11ITEM 7.
MANAGEMENT’S DISCUSSION AND ANALYSIS OF FINANCIAL CONDITION AND RESULTS OF
OPERATIONS 11ITEM 7A. QUANTITATIVE AND QUALITATIVE DISCLOSURES ABOUT MARKET RISK 19ITEM 8. CONSOLIDATED FINANCIAL STATEMENTS AND SUPPLEMENTARY DATA 19ITEM 9.
CHANGES IN AND DISAGREEMENTS WITH ACCOUNTANTS ON ACCOUNTING AND FINANCIAL
DISCLOSURE 19ITEM 9A. CONTROLS AND PROCEDURES 20ITEM 9B. OTHER EVENTS 20
PART III 22
ITEM 10. DIRECTORS AND EXECUTIVE OFFICERS OF THE REGISTRANT 22ITEM 11. EXECUTIVE COMPENSATION 22ITEM 12.
SECURITY OWNERSHIP OF CERTAIN BENEFICIAL OWNERS AND MANAGEMENT AND RELATED
STOCKHOLDER MATTERS 22ITEM 13. CERTAIN RELATIONSHIPS AND RELATED TRANSACTIONS 22ITEM 14. PRINCIPAL ACCOUNTING FEES AND SERVICES 22
Certain items required in Part III of this Form 10-K can be found in our 2006 Proxy Statement and are incorporated herein by reference. A copy of the 2006 Proxy Statement will be provided, without charge, to any person who receives a copy of this Form 10-K and submits a written request to Ted Owen, Senior Vice President and Chief Financial Officer, TEAM, Inc., 200 Hermann Drive, Alvin, Texas, 77511.
PART I
Unless otherwise indicated, the terms “Team, Inc.,” “Team,” “the Company,” “we,” “our” and “us” are used in this report to refer to Team, Inc., to one or more of our consolidated subsidiaries or to all of them taken as a whole. In this document, we make certain forward-looking statements, including statements regarding our plans, strategies, objectives, expectations, intentions and resources that are made pursuant to the safe harbor provisions of the Private Securities Litigation Reform Act of 1995. We do not undertake to update, revise or correct any of the forward-looking information. Our forward-looking statements should be read in conjunction with our disclosures beginning on page 12 of this report under the heading: “CAUTIONARY STATEMENT FOR THE PURPOSE OF SAFE HARBOR PROVISIONS OF THE PRIVATE SECURITIES LITIGATION REFORM ACT OF 1995.” The following discussion should also be read in conjunction with the audited consolidated financial statements and the notes thereto. ITEM 1. BUSINESS General Description of Business
Our corporate headquarters is at 200 Hermann Drive, Alvin, Texas, 77511 and our telephone number is (281) 331-6154. Our common stock trades on the American Stock Exchange (“AMEX”) under the symbol “TMI”. We were incorporated in Texas under the name Team, Inc. in 1973. Our fiscal year ends on May 31 of each calendar year.
We are a leading provider of specialty maintenance and construction services required in maintaining high temperature and high pressure piping systems and vessels that are utilized extensively in the refining, petrochemical, power, pipeline, and other heavy industries. Our inspection services also serve a broader customer base that includes the aerospace and automotive industries. We offer an array of complementary services including: • leak repair, • hot tapping, • fugitive emissions control, • field machining and technical bolting, • field valve repair, • non-destructive testing, and • field heat treating.
We offer these services in over 65 locations throughout the United States. We also serve the international market through our international subsidiaries and branches which include Aruba, Canada, Singapore, Trinidad and Venezuela. We also license our proprietary techniques and materials to various companies outside the United States and we receive royalties based upon revenues earned by our licensees.
Acquisitions and Dispositions In 2004, our industrial service offerings were significantly expanded through two acquisitions. In April 2004, we acquired Thermal
Solutions, Inc. (“TSI”) which was based in Denver, Colorado and was a field heat treating service company. In August 2004, we acquired the business assets of Cooperheat-MQS, Inc.,
1
Table of Contents
Index to Financial Statements
(“Cooperheat-MQS”) which was based in Houston, Texas and had two primary service offerings—field heat treating and non-destructive testing and inspection services. At the time of the acquisition, Cooperheat-MQS was operating under Chapter 11 of the U.S. Bankruptcy Code and was generally believed to have been ranked as the number one or number two leading service provider in each of its service lines. These two acquisitions have more than doubled our revenues (please see Note 2 of our audited consolidated financial statements).
On November 30, 2005, we sold all of the outstanding stock of our wholly-owned subsidiary, Climax Portable Machine Tools, Inc. (“Climax”) of Newberg, Oregon, for approximately $14.5 million in cash (please see Note 2 of our audited consolidated financial statements). Our consolidated balance sheets, consolidated statements of operations, and consolidated statements of cash flows have been recast to present the operating results of Climax as discontinued operations for all periods presented.
Description of Segments Prior to the sale of Climax on November 30, 2005, we operated as two business segments, industrial services and equipment sales and
rentals. As a result of the sale of Climax, we now operate in only one segment—industrial services.
For discussion purposes, the industrial services segment is often segregated between our two industrial services divisions. Our TMS division (previously referred to as the Team Mechanical Services division) provides services of leak repair, hot tapping, emissions control monitoring, on-site field machining, technical bolting, field valve repair and fugitive emissions monitoring. Our TCM division (previously referred to as the Team Cooperheat-MQS division) comprises our field heat treatment and non-destructive testing and inspection services. The industrial services segment is the aggregation of these two divisions because of their similar economic characteristics. Please see Note 13 of our audited consolidated financial statements for financial information regarding our business segment.
Narrative Description of Business Our industrial services are available 24 hours a day, 7 days a week, 365 days a year. We market our services to companies in a diverse
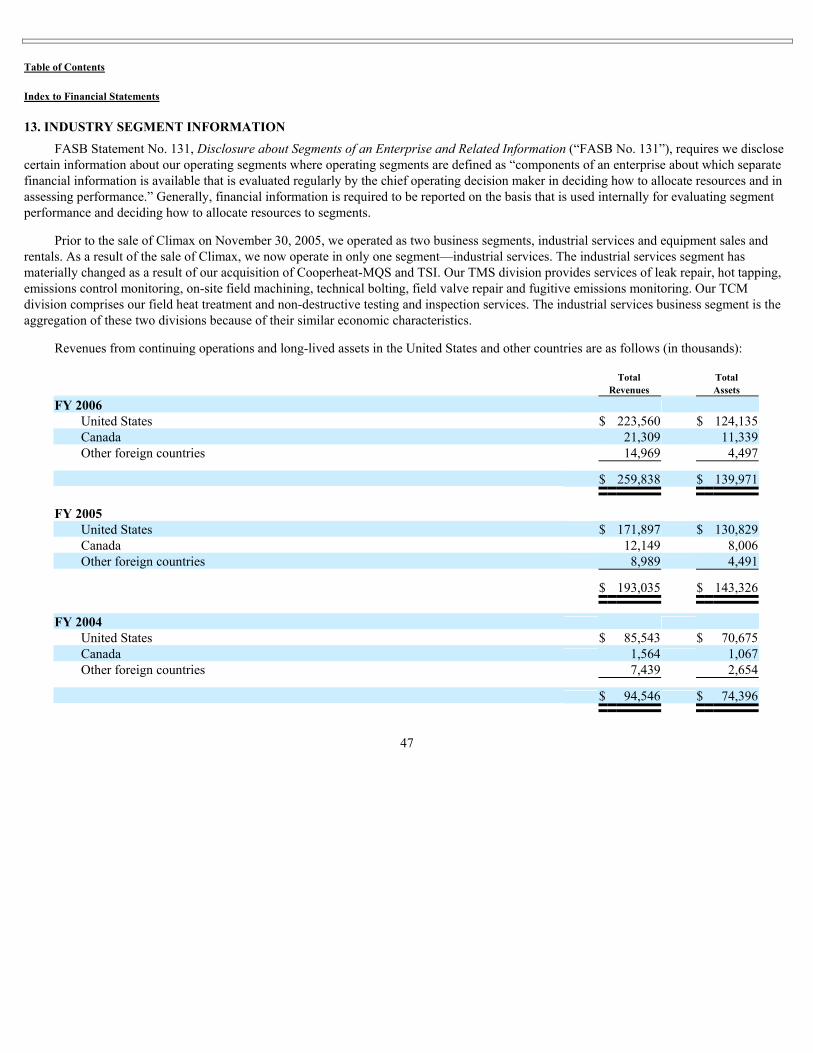
array of industries which include the petrochemical, refining, power, pipeline, pulp and paper, and steel industries as well as some of the world’s largest engineering and construction firms, original equipment manufacturers (“OEMs”) distributors and end users. Our products and services are used in several distinct industries across a broad geographic reach. In 2006, our revenues by geographic region originated in the United States (86%), Canada (8%) and other locations outside of North America (6%). For information on our revenues and assets by geographic areas please see Note 13 of our audited consolidated financial statements.
Employees. At May 31, 2006, we had approximately 2,700 employees and contractors in our worldwide operations. Our employees predominantly are not unionized and there have been no employee work stoppages to date. We believe our relations with our employees are good.
Casualty Insurance. We carry insurance that we believe to be appropriate for the businesses in which we are engaged. Under our insurance policies, we have per occurrence self-insured retention limits of $150,000 per individual claimant, determined on an annual basis, for medical liability and $250,000 per case for for automobile and workers’ compensation. We have obtained fully insured layers of coverage above such self-retention limits.
Regulation. A significant portion of our business activities are subject to federal, state and local laws and regulations. These regulations are administered by various federal, state and local health and safety and environmental agencies and authorities, including the Occupational Safety and Health Administration (“OSHA”) of the U.S. Department of Labor and the U.S. Environmental Protection Agency (“EPA”). From time to time, we are also subject to a wide range of reporting requirements, certifications and compliance as prescribed by various federal and state governmental agencies that include, but are not limited to, the Nuclear Regulatory Commission, Department of Transportation and Federal Aviation Administration. Expenditures relating to such regulations are made in the normal course of our business and are neither material nor place us at any competitive disadvantage. We do not currently expect to expend material amounts for compliance with such laws.
2
Table of Contents
Index to Financial Statements
From time-to-time, in the operation of our environmental consulting and engineering services, the assets of which were sold in 1996, we handled small quantities of certain hazardous wastes or other substances generated by our customers. Under the Comprehensive Environmental Response, Compensation and Liability Act of 1980 (“CERCLA” or the “Superfund Act”), the EPA is authorized to take administrative and judicial action to either cause parties who are responsible under the Superfund Act for cleaning up any unauthorized release of hazardous substances to do so, or to clean up such hazardous substances and to seek reimbursement of the costs thereof from the responsible parties, who are jointly and severally liable for such costs under the Superfund Act. The EPA may also bring suit for treble damages from responsible parties who unreasonably refuse to voluntarily participate in such a clean up or funding thereof. Responsible parties include anyone who owns or operates the facility where the release occurred (either currently and/or at the time such hazardous substances were disposed of), or who by contract arranges for disposal, treatment, or transportation for disposal or treatment of a hazardous substance, or who accepts hazardous substances for transport to disposal or treatment facilities selected by such person from which there is a release. We believe that our risk of liability is minimized since our handling consisted solely of maintaining and storing small samples of materials for laboratory analysis that are classified as hazardous. Due to its prohibitive costs, we accordingly do not currently carry insurance to cover liabilities which we may incur under the Superfund Act or similar environmental statutes.
Intellectual Property. While we are the holder of various patents, trademarks, trade secrets and licenses, we do not consider any single intellectual property to be material to our consolidated business operations.
Marketing and Customers. Our industrial services are marketed principally by personnel based at our locations. We believe that these operating and office locations are situated to facilitate timely response to customer needs, which is an important feature of selling and providing our services. We have developed a cross-marketing program to utilize our sales personnel in offering many of our services. No customer accounted for 10% or more of consolidated revenues during any of the last three years.
Generally, customers are billed on a time and materials basis although some work may be performed pursuant to a fixed-price bid. Emission control services may also be billed based on the number of components monitored. Services are usually performed pursuant to purchase orders issued under written customer agreements. While some purchase orders provide for the performance of a single job, others provide for services to be performed for a term of one year or less. In addition, we are a party to certain long-term contracts, which are enabling agreements only. Substantially all long-term agreements may be terminated by either party on short notice. The agreements generally specify the range of services to be performed and the hourly rates for labor. While contracts have traditionally covered specific plants or locations, we have recently entered into multiple-site regional or national contracts, which cover multiple plants or locations.
We frequently provide various limited warranties for certain of our repair services. To date, there have been no significant warranty claims filed against us.
S easonality. We experience some seasonal fluctuations. Historically, the refining industry has scheduled plant shutdowns (commonly referred to as “turnarounds”) for the fall and spring seasons. Turnaround activities in that sector can have a significant impact on our workload.
Competition. In general, competition stems from other outside service contractors and customers’ in-house maintenance departments. We believe we have a competitive advantage over most service contractors due to the quality, training and experience of our technicians, our nationwide service capability, and our broad range of services, as well as our technical support and manufacturing capabilities supporting the service network. However, there are other competitors that may offer a range of coverage or services and include, but are not limited to, Xanser Corporation, T.D. Williamson, Inc., Acuren Group, Inc. and JV Industrial Corporation.
3
Table of Contents
Index to Financial Statements
Service Lines We provide industrial services for our customers in the petrochemical, refining, power, pipeline, pulp and paper, steel and other
industries. We attribute our success to the quality and timely performance of the services by our skilled technicians, our proprietary techniques and materials and our ability to meet the demanding needs of our customers’ operations. We have continued to develop different types of services and products which complement our existing industrial service markets. Our rigorous in-house safety programs, technician training and quality control programs are all designed to ensure safety and compliance with customers’ requirements. A description of those services is as follows:
Leak Repair Services. Our leak repair services consist of on-stream repairs of leaks in pipes, valves, flanges and other parts of piping systems and related equipment. Our on-stream repairs include the marketing of both standard and custom-designed clamps and enclosures for plant systems and pipelines. We use specially developed techniques, sealants and equipment for repairs. Many of our repairs are furnished as interim measures which allow plant systems to continue operating until more permanent repairs can be made during turnarounds. Our leak repair services involve inspection of the leak by our field crew who record pertinent information about the faulty part of the system and transmit the information to our engineering department for determination of appropriate repair techniques. Repair materials such as clamps and enclosures are custom designed and manufactured at our ISO-9001 certified manufacturing center in Alvin, Texas and delivered to the job site. We maintain an inventory of raw materials and semi-finished clamps and enclosures to reduce the time required to manufacture the finished product. Installations of the clamps and enclosures for on-stream repair work are then performed by the field crew using, in large part, materials and sealants that are developed and produced at our manufacturing center.
Hot Tapping Services. Our hot tapping services consist of providing a full range of hot tapping, Line-stop ® and Freeze-stop ® services with capabilities up to 48” diameter pipelines. Hot tapping services involve utilizing special equipment to cut a hole in a pressurized pipeline so that a new branch pipe can be connected onto the existing pipeline without interrupting operations. Line-stop ® services permit the line to be depressurized downstream so that maintenance work can be performed on the piping system. We typically perform these services by mechanically cutting into the pipeline similar to a hot tap and installing a special plugging device to stop the process flow. The Hi-stop ® is a proprietary and patented procedure that allows stopping of the process flow in extreme pressures and temperatures. In some cases, we may use a line freezing procedure by injecting liquid nitrogen into installed special external chambers around the pipe to stop the process flow.
Emissions Control Services. We provide fugitive volatile organic chemical (“VOC”) emission leak detection services that include identification, monitoring, data management and reporting primarily for the chemical, refining and natural gas processing industries. These services are designed to monitor and record VOC emissions from specific process equipment and piping components as required by environmental regulations and customer requests, typically assisting the customer in enhancing an ongoing maintenance program and/or complying with present and/or future environmental regulations. We provide specialty trained technicians in the use of portable organic chemical analyzers and data loggers to measure potential leaks at designated plant components maintained in customer or our proprietary databases. The measured data is used to prepare standard reports in compliance with EPA and local regulatory requirements. We also provide enhanced custom-design reports to customer specifications.
Field Machining and Technical Bolting Services . This service involves the use of portable machining equipment to repair or modify machinery, equipment, vessels and piping systems not easily removed from a permanent location. As opposed to conventional machining processes where the work piece rotates and the cutting tool is fixed, in field machining, the work piece remains fixed in position and the cutting tool rotates. Other common descriptions for this service are on-site or in-place machining. Field machining services include flange facing, pipe cutting, line boring, journal turning, drilling, and milling. Technical bolting services are often provided to customers as a complimentary service to field machining during turnaround or maintenance activities. These services involve the use of hydraulic or pneumatic equipment with industry standard bolt
4
Table of Contents
Index to Financial Statements
tightening techniques to achieve reliable and leak-free connections during plant maintenance turnarounds and capital projects. Additional services include bolt disassembly using hot bolting which is a process to remove and replace a bolt as the process is operating.
Field Valve Repair Services . We perform on-site repairs to process manual and control valves, pressure and safety relief valves as well as specialty valve actuator diagnostics and repair. We are certified and authorized to perform testing and repairs to pressure and safety relief valves by The National Board of Boiler and Pressure Vessel Inspectors. This certification requires specific procedures, testing and documentation to maintain the safe operation of these essential plant valves. We provide special transportable trailers to the plant site which contain specialty machines to manufacture valve components without removing the valve from the piping system. In addition, we provide preventive maintenance programs for VOC specific valves and valve data management programs.
Non-destructive Testing and Inspection Services. Inspection services consist of the examination and evaluation of piping, piping components and equipment to determine the present condition and predict remaining operability. Our inspection services use all the common methods of non-destructive testing, including radiography, ultrasound, magnetic particle and dye penetrate, as well as, higher end robotic and newly developed advanced technology systems. Many of the visual inspection programs we provide require specialized training to industry and regulatory standards. We provide these services as part of planned construction, maintenance programs and on demand. We provide reports based on industry and national standards. Inspection services are marketed to the same industrial customer base as our other services as well as outside our traditional customer base such as the aerospace and automotive industries. The inspection services are the only services we provide which require industry recognized training and certification processes. We maintain training and certification programs which meet or exceed industry standards.
Field Heat Treating Services. Our field heat treating services include electric resistance and gas-fired combustion, primarily utilized by industrial users to enhance the metallurgical properties of their process piping and equipment. Electric resistance heating is the transfer of high energy power sources through attached heaters to the plant component to preheat weld joints to remove contaminates and moisture prior to welding and post-weld heat treatments to relieve metal thermal stresses induced by the welding process. Specialty heat treating processes are performed using gas fired combustion on large pressure vessels for stress relieving, to bake specialty paint coatings, and controlled drying of abrasion and temperature resistant refractories. Special high frequency heating commonly called induction heating is used to expand metal parts for assembly or disassembly, expansion of large bolting for industrial turbines and stress relieving projects which is cost prohibitive for electric resistance or gas-fired combustion. These services are provided at the customer site.
Available Information As a public company, we are required to file periodic reports with the Securities and Exchange Commission (“SEC”) within established
deadlines. Any document we file with the SEC may be viewed or copied at the SEC’s Public Reference Room at 100 F Street, N.E., Washington, D.C. 20549. Additional information regarding the Public Reference Room can be obtained by calling the SEC at (800) SEC-0330. Our SEC filings are also available to the public through the SEC’s website located at http://www.sec.gov .
Our internet website address is http://www.teamindustrialservices.com. Information contained on our website is not part of this report on Form 10-K. Our annual reports on Form 10-K, quarterly reports on Form 10-Q and current reports on Form 8-K filed with (or furnished to) the SEC are available on our website, free of charge, as soon as reasonably practicable after we file or furnish such material. We also post our code of business conduct and ethics and the charters of our board’s committees on our website. Our governance documents are available in print to any stockholder that makes a written request to Ted W. Owen, Senior Vice President and Chief Financial Officer, TEAM, Inc., 200 Hermann Drive, Alvin, Texas, 77511.
5
Table of Contents
Index to Financial Statements ITEM 1A. RISK FACTORS Safe Harbor for Forward-Looking Statements
We have made forward-looking statements in this annual report including in “Management’s Discussion and Analysis of Financial Condition and Results of Operations.” In addition, other written or oral statements that constitute forward-looking statements may be made by or on behalf of the Company. Although we have based these statements on the beliefs and assumptions of our management and on information currently available to them, they are subject to risks and uncertainties. We wish to ensure that such statements are accompanied by meaningful cautionary statements, so as to obtain the protections of the safe harbor established in the Private Securities Litigation Reform Act of 1995. Accordingly, such statements are qualified by reference to the discussion below of certain important factors that could cause actual results to differ materially from those projected in such forward-looking statements.
We caution the reader that our list of risk factors may not be exhaustive. We operate in a continually changing business environment, and new risk factors emerge from time to time. We cannot predict such risk factors, nor can we assess the impact, if any, of such risk factors on our business or the extent to which any factors may cause actual results to differ materially from those projected in any forward-looking statements. Accordingly, undue reliance should not be put on any forward-looking statements. We undertake no obligation to update publicly any forward-looking statements, whether as a result of new information, future events or otherwise. The following risks and uncertainties, among others, should be considered in evaluating our outlook of future Company performance.
We sell our services in highly competitive markets, which puts pressure on our profit margins and limits our ability to maintain or increase the market share of our services. The markets for our services can be fragmented and highly competitive. No assurances can be made that we will continue to maintain or increase our market share.
No assurances can be made that we will be successful in hiring or retaining members of a skilled technical workforce. The loss of the services of a number of these individuals or failure to attract new employees could adversely affect our ability to perform our obligations on our customers’ projects or maintenance and consequently could negatively impact the demand for our products and services and consequently our financial condition and operating results. We have a skilled technical workforce and an industry recognized technician training program for each of our service lines that prepares new employees as well as further trains our existing employees. The competition for these individuals is intense.
Our operations and properties are subject to extensive governmental regulation under environmental laws. These laws and regulations can impose substantial sanctions for violations or operational changes that may limit our services. We must conform our operations to applicable regulatory requirements and adapt to changes in such requirements in all locations in which we operate.
We may incur material costs as a result of general liability and warranty claims, which could adversely affect our financial condition, results of operations and cash flows. These claims may result from catastrophic events to which we may be at fault or have indemnified certain parties deemed to be at fault. While we maintain insurance coverage with respect to certain liability claims, we may not be able to obtain such insurance on acceptable terms in the future, if at all, and any such insurance may not provide adequate coverage against product liability claims. In addition, liability claims can be expensive to defend and can divert the attention of management and other personnel for significant periods of time, regardless of the ultimate outcome. An unsuccessful defense of a liability claim could have an adverse affect on our business, results of operations and financial condition and cash flows. Even if we are successful in defending against a claim relating to our services, claims of this nature could cause our customers to lose confidence in our services and our Company.
Economic, political and other risks associated with international operations could adversely affect our business. A portion of our operations are conducted and located outside the United States and, accordingly, our business is subject to risks associated with doing business internationally, including changes in foreign currency
6
Table of Contents
Index to Financial Statements
exchange rates, instability in political or economic conditions, differing employee relations, trade protection measures, and difficulty in administering and enforcing corporate policies which may be different than the normal business practices of local cultures.
Our business depends on the levels of capital investment and maintenance expenditures by our customers, which in turn are affected by the cyclical nature of their markets and their liquidity. The ability of our customers to finance capital investment and maintenance may be affected by factors independent of those conditions such as liquidity constraints or postponing projects until favorable financial capital markets are present.
We may not be able to continue to expand our market presence through attractive acquisitions, and any future acquisitions may present unforeseen integration difficulties or costs. Furthermore, no assurances can be made that we will realize the cost savings, synergies or revenue enhancements that we may anticipate from any acquisition, or that we will realize such benefits within the time frame that we expect. If we are not able to address the challenges associated with acquisitions and successfully integrate acquired businesses, or if our integrated product and service offerings fail to achieve market acceptance, our business could be adversely affected.
Our level of indebtedness could have important consequences to us. Our level of indebtedness may make it more difficult for us to satisfy our obligations with respect to our indebtedness, increase our vulnerability to general adverse economic, rising interest rates and industry conditions, limit our ability to take advantage of business opportunities as a result of various restrictive covenants in our debt agreements, place us at a competitive disadvantage compared to our competitors that have less debt or limit our ability to borrow money or sell stock to fund our working capital, capital expenditures, acquisitions or other corporate requirements.
The price of our outstanding securities may suffer if we cannot control fluctuations in our sales and operating results. Historically, our quarterly and annual sales and operating results have fluctuated. We expect fluctuations to continue in the future. In addition to general economic and political conditions, the following factors affect our sales: the timing of significant customer orders, changes in competitive pricing, wide variations in profitability by product line, variations in operating expenses, the timing of announcements or introductions of new products or services by us, our competitors or our respective customers, the acceptance of those services, our ability to adequately meet staffing requirements with qualified personnel, relative variations in manufacturing efficiencies and costs, and the relative strength or weakness of international markets. Since our quarterly and annual sales and operating results vary, we believe that period-to-period comparisons are not necessarily meaningful, and you should not rely on those comparisons as indicators of our future performance. Due to the foregoing factors, it is possible that in some future quarter or quarters our revenues or operating results will not meet the expectations of the public stock market analysts or investors, which could cause the price of our outstanding securities to decline or be volatile.
Our business may be adversely impacted by work stoppages, staffing shortages, and other labor matters. As of June 30, 2006, we had approximately 2,700 employees and contractors, approximately 2,400 of whom were located in the United States. Approximately 4% of our employees are represented by unions. Although we believe that our relations with our employees are good and we have not experienced any recent strikes or work stoppages, no assurances can be made that we will not in the future experience these and other types of conflicts with labor unions, works councils, other groups representing employees, or our employees generally, or that any future negotiations with our labor unions will not result in significant increases in the cost of labor.
Other risk factors include, but are not limited to: • the effects of extreme weather conditions such as hurricanes; • acts of terrorism aimed at either our facilities or our customer facilities that could impair our ability to conduct business;
7
Table of Contents
Index to Financial Statements • rulings, judgments or settlements in litigation or other legal or regulatory matters including unexpected environmental remediation
costs in excess of any reserves or insurance coverage; • legislation or regulatory action, including the introduction or enactment of federal, state or foreign legislation or rulemakings, which
may adversely affect our business or operations including changes in tax laws in the United States or in foreign countries; and • overall economic conditions.
Any one of these factors, or a combination of these factors, could materially affect our future results of operations and whether any forward-looking statements ultimately prove to be accurate. Our forward-looking statements are not guarantees of future performance, and actual results and future performance may differ materially from those suggested in any forward-looking statements. We do not intend to update these statements unless we are required by the securities laws to do so.
All subsequent written and oral forward-looking statements attributable to us or persons acting on our behalf are expressly qualified in their entirety by the foregoing. We undertake no obligation to publicly release the results of any revisions to any such forward-looking statements that may be made to reflect events or circumstances after the date of this report or to reflect the occurrence of unanticipated events.
8
Table of Contents
Index to Financial Statements ITEM 1B. UNRESOLVED STAFF COMMENTS
None. ITEM 2. PROPERTIES
We own real estate and office facilities in the Alvin, Texas area totaling approximately 88,000 square feet. These facilities are comprised of a corporate office and training building and a manufacturing facility for clamps, enclosures and sealants. Additionally, we own facilities in, or near, Houston, Texas, Milwaukee, Wisconsin, and Edmonton, Alberta, which are utilized in the industrial services operations. All of those facilities are pledged as security for our credit facility (please see Note 8 of our audited consolidated financial statements). We also lease approximately 76 office and/or plant and shop facilities at separate locations in twenty-nine states, Puerto Rico and in Aruba, Canada, Singapore, Trinidad and Venezuela.
We believe that our property and equipment are adequate for our current needs, although additional investments are expected to be made in property and equipment for expansion, replacement of assets at the end of their useful lives and in connection with corporate development activities. ITEM 3. LEGAL PROCEEDINGS
In August 2005, we were served in a lawsuit styled Paulette Barker, as named Executor for the Estate of Robert Barker, et. al. v. Emmett J. Lescroart, Michael Urban, Team, Inc. et. al., Case Number 355868-402 in the Probate Court #1, Harris County, Texas. The dispute arises out of the sale by Mr. Barker to Mr. Lescroart of stock in TSI. Subsequently, we acquired all of the outstanding stock of TSI in April 2004, allegedly for a much higher price than Mr. Lescroart paid Mr. Barker in July 2003. The plaintiff claims damages in excess of $1,000,000. We intend to vigorously defend this action and do not believe that we have any legal liability under the suit and, further, believe we are entitled to be indemnified from any loss we may incur under the terms of the Stock Purchase Agreement related to the TSI acquisition. Mr. Lescroart is a member of the Board of Directors of the Company and was dismissed from the lawsuit for lack of personal jurisdiction in December 2005.
We are involved in various other lawsuits and are subject to various claims and proceedings encountered in the normal conduct of business. In the opinion of our management, any losses that might arise from these lawsuits and proceedings will not have a materially adverse effect on our consolidated financial statements effect on our consolidated financial statements. ITEM 4. SUBMISSION OF MATTERS TO A VOTE OF SECURITY HOLDERS
None
9
Table of Contents
Index to Financial Statements
PART II ITEM 5. MARKET FOR REGISTRANT’S COMMON EQUITY, RELATED STOCKHOLDER MATTERS AND ISSUER
PURCHASES OF EQUITY SECURITIES Market Information
Our common stock is traded on the AMEX under the symbol “TMI”. The table below reflects the high and low sales prices of our common stock on the AMEX by quarter for the fiscal years ended May 31, 2006 and 2005, respectively.
Holders There were 250 holders of record of our common stock as of August 1, 2006, excluding beneficial owners of stock held in street name.
Although exact information is unavailable, we estimate there are approximately 2,800 additional beneficial owners.
Dividends No dividends were declared or paid in 2006, 2005 or 2004. Pursuant to our Credit Facility, we are not permitted to pay dividends without
the consent of our primary lender. Accordingly, we have no present intention to pay cash dividends in the foreseeable future. Additionally, any future dividend payments will continue to depend on our financial condition, market conditions and other matters deemed relevant by the Board of Directors.
Stock Repurchase Plan During fiscal year 2004, we repurchased 50,000 shares of our outstanding common stock on the open market at a weighted average price
of $7.89 per share. During fiscal years 2005 and 2006, no repurchases of our shares of outstanding common stock occurred and we currently have no plans to repurchase any additional shares.
Equity Compensation Plans This information has been omitted from this report on Form 10-K since we will file, no later than 120 days following the close of our
fiscal year ended May 31, 2006, our definitive proxy statement. The information required regarding equity compensation plans is hereby incorporated by reference.
10
Table of Contents
Index to Financial Statements ITEM 6. SELECTED FINANCIAL DATA
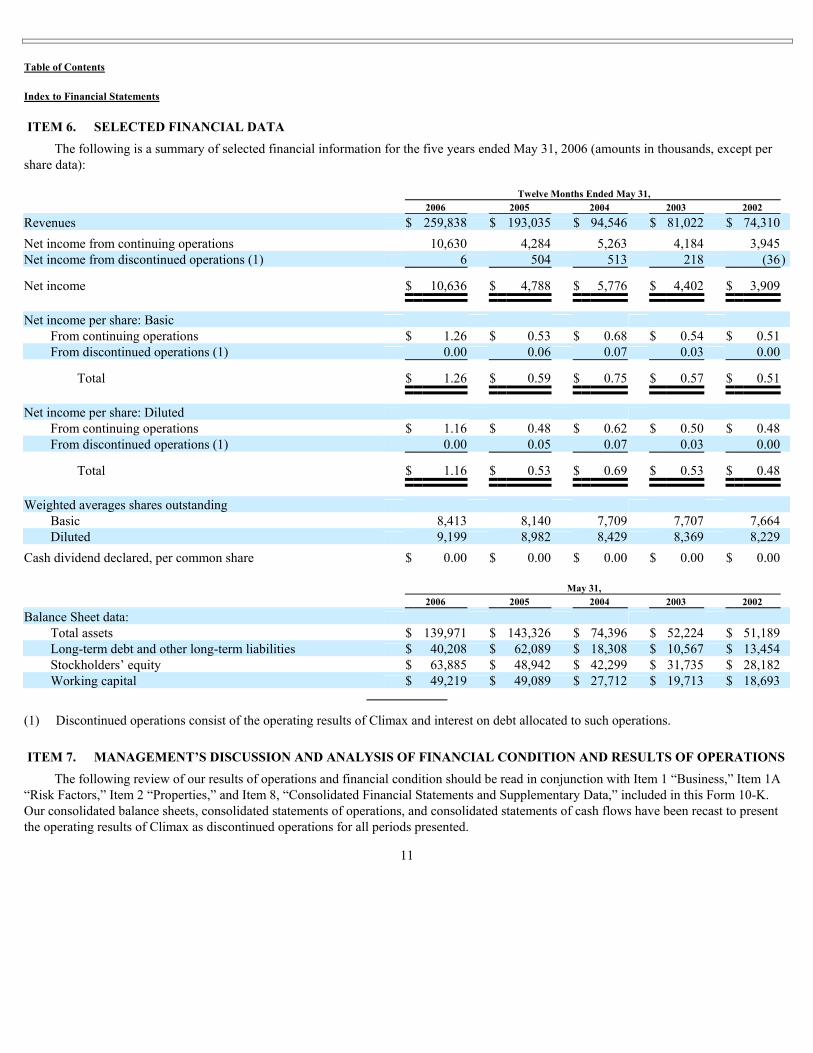
The following is a summary of selected financial information for the five years ended May 31, 2006 (amounts in thousands, except per share data): Twelve Months Ended May 31, 2006 2005 2004 2003 2002 Revenues $ 259,838 $ 193,035 $ 94,546 $ 81,022 $ 74,310 Net income from continuing operations 10,630 4,284 5,263 4,184 3,945 Net income from discontinued operations (1) 6 504 513 218 (36)
Net income $ 10,636 $ 4,788 $ 5,776 $ 4,402 $ 3,909
Net income per share: Basic From continuing operations $ 1.26 $ 0.53 $ 0.68 $ 0.54 $ 0.51 From discontinued operations (1) 0.00 0.06 0.07 0.03 0.00
Total $ 1.26 $ 0.59 $ 0.75 $ 0.57 $ 0.51
Net income per share: Diluted From continuing operations $ 1.16 $ 0.48 $ 0.62 $ 0.50 $ 0.48 From discontinued operations (1) 0.00 0.05 0.07 0.03 0.00
(1) Discontinued operations consist of the operating results of Climax and interest on debt allocated to such operations. ITEM 7. MANAGEMENT’S DISCUSSION AND ANALYSIS OF FINANCIAL CONDITION AND RESULTS OF OPERATIONS
The following review of our results of operations and financial condition should be read in conjunction with Item 1 “Business,” Item 1A “Risk Factors,” Item 2 “Properties,” and Item 8, “Consolidated Financial Statements and Supplementary Data,” included in this Form 10-K. Our consolidated balance sheets, consolidated statements of operations, and consolidated statements of cash flows have been recast to present the operating results of Climax as discontinued operations for all periods presented.
11
Table of Contents
Index to Financial Statements
CAUTIONARY STATEMENT FOR THE PURPOSE OF SAFE HARBOR PROVISIONS OF THE
PRIVATE SECURITIES LITIGATION REFORM ACT OF 1995
This report includes forward-looking statements within the meaning of Section 27A of the Securities Act of 1933 and Section 21E of the Securities Exchange Act of 1934. You can identify our forward-looking statements by the words “anticipate,” “believe,” “expect,” “plan,” “intend,” “estimate,” “project,” “projection,” “predict,” “budget,” “forecast,” “goal,” “guidance,” “target,” “will,” “could,” “should,” “may” and similar expressions.
We based our forward-looking statements on our current expectations, estimates and projections about ourselves and our industry. We caution that these statements are not guarantees of future performance and involve risks, uncertainties and assumptions that we cannot predict. In addition, we based many of these forward-looking statements on assumptions about future events that may prove to be inaccurate. Accordingly, our actual results may differ materially from the future performance that we have expressed or forecast in the forward-looking statements. Differences between actual results and any future performance suggested in these forward-looking statements could result from a variety of factors, including the following.
Overview We are a leading provider of specialty maintenance and construction services required in maintaining high temperature and high pressure
piping systems and vessels that are utilized extensively in the refining, petrochemical, power, pipeline, and other heavy industries. Our inspection services also serve a broader customer base that includes the aerospace and automotive industries. We offer an array of complimentary services including: • leak repair, • hot tapping, • fugitive emissions control, • field machining and technical bolting, • field valve repair, • non-destructive testing, and • field heat treating.
We offer these services in over 65 locations throughout the United States. We also serve the international market through our own international subsidiaries and branches which include Singapore, Aruba, Canada, Venezuela, and Trinidad. We also license our proprietary techniques and materials to various companies outside the United States and we receive royalties based upon revenues earned by our licensees.
In 2004, our industrial service offerings were significantly expanded through two acquisitions. In April 2004, we acquired TSI which was based in Denver, Colorado and was a field heat treating service company. In August 2004, we acquired the business assets of Cooperheat-MQS which was based in Houston, Texas and had two primary service offerings—field heat treating and non-destructive testing and inspection services. At the time of the acquisition, Cooperheat-MQS was operating under Chapter 11 of the U.S. Bankruptcy Code and was generally believed to have been ranked as the number one or number two leading service provider in each of its service lines. These two acquisitions have more than doubled our revenues (please see Note 2 of our audited consolidated financial statements).
On November 30, 2005, we sold all of the outstanding stock of our wholly-owned subsidiary, Climax of Newberg, Oregon, for approximately $14.5 million in cash (please see Note 2 of our audited consolidated financial statements). Our consolidated balance sheets, consolidated statements of operations, and consolidated statements of cash flows have been recast to present the operating results of Climax as discontinued operations for all periods presented.
12
Table of Contents
Index to Financial Statements
Fiscal 2006 Compared to Fiscal 2005 As a context for the discussion below, the results of our operations and financial condition were significantly and materially impacted by
acquisitions in recent fiscal years. Together, these acquisitions more than doubled the size of our industrial services segment. We organized the operations of the industrial services segment into the TMS and TCM divisions. TMS comprises our previously existing mechanical services offerings (leak repair, hot tapping, field machining and technical bolting, field valve repair and fugitive emissions control). TCM comprises our field heat treatment and non-destructive testing services. The following table sets forth the components of revenue and operating income from continuing operations for fiscal 2006 and 2005 (in thousands): Increase 2006 2005 $ % Revenues:
Total S,G&A 67,752 55,250 $ 12,502 23% Operating income $ 21,377 $ 9,548 $ 11,829 124%
Revenues. Our revenues from continuing operations in 2006 were $259.8 million compared to $193.0 million in 2005, an increase of $66.8 million or 35%. The increase was partially due to broad based growth across virtually all regions and service lines and due to our Cooperheat-MQS acquisition in August 2004. Cooperheat-MQS comprises the majority of the TCM division. The increase was also broad based with approximately $9 million of the increase coming from Canada. Revenues for our TCM division in 2006 were $143.2 million compared to $99.3 million in 2005, an increase of $44.0 million or 44%. Fiscal year 2006 included a full year of Cooperheat-MQS operations while fiscal year 2005 included 9 1 / 2 months of Cooperheat-MQS operations. Revenues for our TMS division in 2006 were $116.6 million compared to $93.8 million in 2005, an increase of $22.8 million, or 24%. For both divisions, the current fiscal year was characterized by increased capital and maintenance budgets for many of our customers, penetration of our services into new industries and increases in turnaround work as customers realize the current trends contributing to their increased margins are likely to remain for the foreseeable future.
Gross Margin. Our gross margin from continuing operations in 2006 was $89.1 million compared to $64.8 million in 2005, an increase of $24.3 million or 38%. Gross margin as a percentage of sales improved by approximately one percentage point. Gross margin for our TCM division in 2006 was $42.9 million compared to $30.2 million in 2005, an increase of $12.7 million or 42%. The improvement in TCM gross margins is due to increased revenues described above. TCM gross margins as a percentage of revenue remained unchanged at 30%. Gross margin for our TMS division was $46.2 million in 2006 compared to $34.6 million in 2005, an increase of $11.6 million or 34%. The improvement in TMS gross margins is due to increased revenues described above and improved gross margin as a percentage of those revenues. TMS gross margin as a percentage of revenue increased to 40% in 2006 from 37% in 2005. The increase in gross margin as a percentage of sales was due to broad based efficiencies and operating leverage from increased revenues as well as the completion of several low margin jobs in the prior year.
13
Table of Contents
Index to Financial Statements
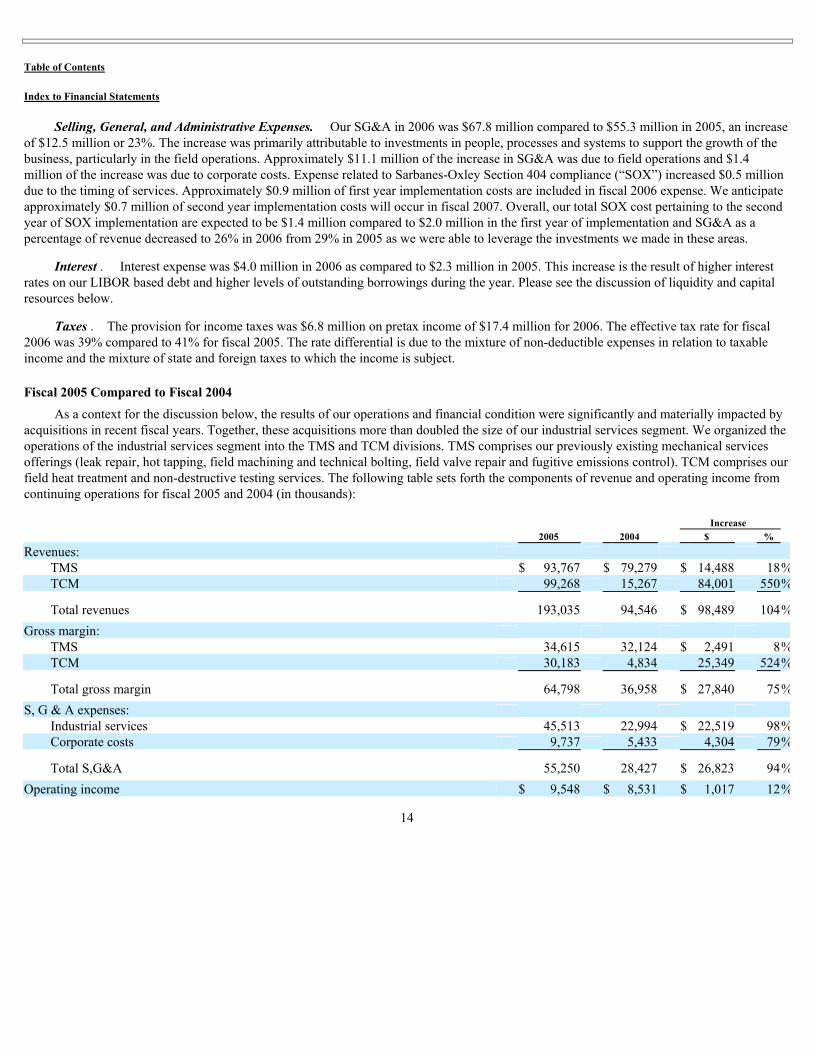
Selling, General, and Administrative Expenses. Our SG&A in 2006 was $67.8 million compared to $55.3 million in 2005, an increase of $12.5 million or 23%. The increase was primarily attributable to investments in people, processes and systems to support the growth of the business, particularly in the field operations. Approximately $11.1 million of the increase in SG&A was due to field operations and $1.4 million of the increase was due to corporate costs. Expense related to Sarbanes-Oxley Section 404 compliance (“SOX”) increased $0.5 million due to the timing of services. Approximately $0.9 million of first year implementation costs are included in fiscal 2006 expense. We anticipate approximately $0.7 million of second year implementation costs will occur in fiscal 2007. Overall, our total SOX cost pertaining to the second year of SOX implementation are expected to be $1.4 million compared to $2.0 million in the first year of implementation and SG&A as a percentage of revenue decreased to 26% in 2006 from 29% in 2005 as we were able to leverage the investments we made in these areas.
Interest . Interest expense was $4.0 million in 2006 as compared to $2.3 million in 2005. This increase is the result of higher interest rates on our LIBOR based debt and higher levels of outstanding borrowings during the year. Please see the discussion of liquidity and capital resources below.
Taxes . The provision for income taxes was $6.8 million on pretax income of $17.4 million for 2006. The effective tax rate for fiscal 2006 was 39% compared to 41% for fiscal 2005. The rate differential is due to the mixture of non-deductible expenses in relation to taxable income and the mixture of state and foreign taxes to which the income is subject.
Fiscal 2005 Compared to Fiscal 2004 As a context for the discussion below, the results of our operations and financial condition were significantly and materially impacted by
acquisitions in recent fiscal years. Together, these acquisitions more than doubled the size of our industrial services segment. We organized the operations of the industrial services segment into the TMS and TCM divisions. TMS comprises our previously existing mechanical services offerings (leak repair, hot tapping, field machining and technical bolting, field valve repair and fugitive emissions control). TCM comprises our field heat treatment and non-destructive testing services. The following table sets forth the components of revenue and operating income from continuing operations for fiscal 2005 and 2004 (in thousands): Increase 2005 2004 $ % Revenues:
Total S,G&A 55,250 28,427 $ 26,823 94% Operating income $ 9,548 $ 8,531 $ 1,017 12%
14
Table of Contents
Index to Financial Statements
Revenues. Our revenues from continuing operations in 2005 were $193.0 million compared to $94.5 million in 2004, an increase of $98.5 million or 104%. The increase was primarily due to our acquisitions of TSI and Cooperheat-MQS which comprise the majority of our TCM division. The increase was also broad based with approximately $11 million of the increase coming from Canada. Revenues for our TCM division in 2005 were $99.3 million compared to $15.3 million in 2004, an increase of $84.0 million or 550%. The increase is due to the addition of Cooperheat-MQS during fiscal year 2005, as well as a full year of TSI operations in fiscal year 2005 compared to two months of TSI operations in fiscal year 2004. Revenues for our TMS division in 2005 were $93.8 million compared to $79.3 million in 2004, an increase of $14.5 million, or 18%. The first half of the current fiscal year was characterized by a very depressed market for turnaround services as very high profit margins earned by refiners caused them to push out turnaround work into later quarters. Although refiners continue to achieve high profit margins, we began to see an increase in turnaround activity in the second quarter, which continued throughout the last half of fiscal 2005.
Gross Margin. Our gross margin from continuing operations in 2005 was $64.8 million compared to $37.0 million in 2004, an increase of $27.8 million or 75%. The increase was primarily due to the increase in revenues that was the result of our acquisitions of TSI and Cooperheat-MQS, which comprise the majority of our TCM division. Gross margin for our TCM division in 2005 was $30.2 million compared to $4.8 million in 2004, an increase of $25.4 million or 524%. While TCM gross margins contributed to the overall performance of 2005, as a percentage of revenues TCM margins are generally lower than those achieved by the TMS services. Part of this difference is due to the fact that TCM projects are generally more labor intensive than TMS service lines. Gross margin for our TMS division was $34.6 million compared to $32.1 million in 2004, an increase of $2.5 million or 8%. While the increase in TMS gross margins was due to increased revenues, gross margins as a percentage of revenues declined. TMS gross margins as a percentage of revenue were approximately four percentage points lower in 2005 than 2004. The decrease in TMS gross profit percentage relates to several low margin jobs undertaken in 2005 and not expected to extend into future periods.
Selling, General, and Administrative Expenses. Our SG&A in 2005 was $55.3 million compared to $28.4 million in 2004, an increase of $26.8 million or 94%. Approximately $22.5 million of the increase was due to field operations, of which $18.2 million is associated with the recently acquired field operations of the TCM acquired businesses and the remainder reflects increases in field personnel to support organic growth. $4.3 million of the increase was due to corporate costs which include the addition of accounting, human resources and information technology personnel and systems, acquisition integration costs and costs related to SOX.
Interest . Interest expense was $2.3 million in 2005 as compared to $0.1 million in 2004. This increase is directly associated with the additional borrowings to fund the acquisition of TSI (April 2004) and Cooperheat-MQS (August 2004), as well as the growth in working capital. Please see the discussion of liquidity and capital resources below.
Taxes. The provision for income taxes was $3.0 million on pretax income of $7.2 million for 2005. The effective tax rate for fiscal 2005 was 41% compared to 37% for fiscal 2004. The rate differential is due to three factors: 1) higher non-deductible expenses in relation to taxable income, 2) higher effective state income tax rates than fiscal 2004, and 3) a significant increase in foreign earnings taxed at rates higher than the U.S. Federal income tax rate as a result, primarily, of our growth in Canada.
Liquidity and Capital Resources Financing for our operations, consists primarily of vendor financing and leasing arrangements, a bank facility and cash flows attributable
to our operations. We believe that the liquidity we derive from our vendor financing and leasing arrangements, bank facility and cash flows attributable to our operations is more than sufficient to fund our capital expenditures, debt maturities and other business needs.
15
Table of Contents
Index to Financial Statements
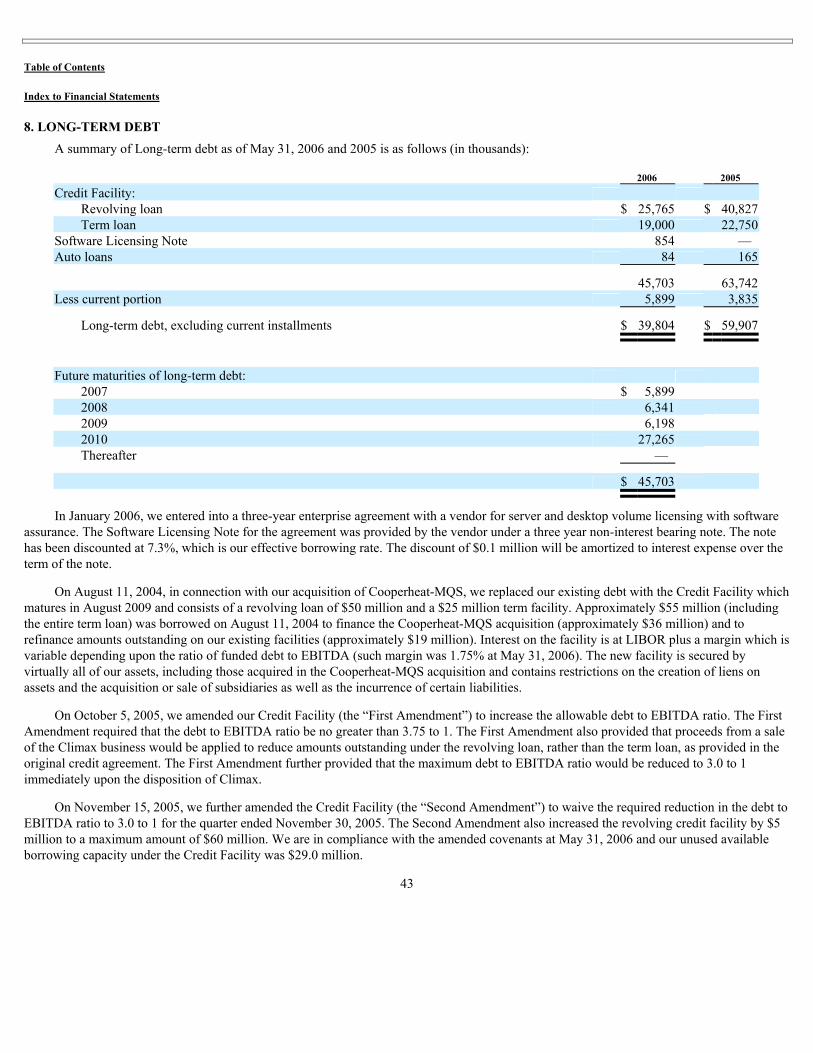
Vendor Financing and Leasing Arrangements. In January 2006, we entered into a three year enterprise agreement with Microsoft for server and desktop volume licensing with software assurance. Financing for the agreement was provided under a three year non-interest bearing note (the “Software Licensing Note”) with monthly payments of $28,998. The Software Licensing Note has been discounted at 7.3%, which approximates our effective borrowing rate. At May 31, 2006, the outstanding principal balance of the Software Licensing Note was $0.9 million.
We also enter into operating leases to obtain equipment for our field operations and administrative functions. Our obligations under non-cancellable operating leases, primarily consisting of auto leases, were approximately $13.4 million at May 31, 2006 and are as follows (in thousands):
Bank Facility. We have a bank facility that consists of a term loan and revolving credit facility (collectively the “Credit Facility”) which matures in August 2009. The term loan balance was $19.0 million and $22.7 million at May 31, 2006 and 2005, respectively. Borrowings under the revolving credit facility were $25.7 million and $40.8 million at May 31, 2006 and 2005, respectively. The term loan requires mandatory principal reductions of $3 million in 2005, $4 million in 2006 and $6 million in each of years 2007 through 2009. Borrowings under the Credit Facility are subject to interest rates which are based on LIBOR plus a margin which is variable depending upon the ratio of funded debt to earnings before interest, taxes, depreciation and amortization (“EBITDA”). The outstanding balance of the Software Licensing Note, as well as any outstanding stand-by letters of credit, apply towards funded debt under the covenant restrictions and available borrowing capacity of the Credit Facility. At May 31, 2006, our unused available borrowing capacity under the Credit Facility was $29.0 million. Please see Note 8 to our audited consolidated financial statements for further information.
We are occasionally required to post letters of credit generally issued by a bank as collateral under certain agreements. A letter of credit commits the issuer to remit specified amounts to the holder, if the holder demonstrates that we had failed to meet our obligations under the letter of credit. If this were to occur, we would be obligated to reimburse the issuer for any payments the issuer was required to remit to the holder of the letter of credit. To date, we have not had any claims made against a letter of credit that resulted in a payment made by the issuer or by us to the holder. We believe that it is unlikely that we will have to fund claims made under letters of credit in the foreseeable future. At May 31, 2006 and 2005, we were also contingently liable for outstanding stand-by letters of credit totaling $5.2 million and $5.1 million, respectively.
Cashflows Attributable to Our Continuing Operations. For fiscal year 2006, cash provided by operating activities was $9.3 million. Net income from continuing operations of $10.6 million, when adjusted for non-cash items such as depreciation and amortization, deferred financing costs, allowance for doubtful accounts and deferred tax charges was $18.2 million, of which, $8.9 million was used to fund our working capital requirements.
Cashflows Attributable to Our Continuing Financing Activities. For fiscal year 2006, cash used for financing activities was $16.8 million. $18.9 million of cash was used in the payment of debt, primarily our Credit Facility, and to a lesser extent, the Software Licensing Note. The cash used for debt payment was reduced by the issuance of $2.3 million in shares of our common stock in connection with our stock option compensation plans (please see Note 9 of our audited consolidated financial statements).
16
Table of Contents
Index to Financial Statements
Cashflows Attributable to Our Continuing Investing Activities. For fiscal year 2006, cash provided by investing activities was $7.9 million, consisting primarily of $14.7 million of proceeds from the sale of Climax reduced by $7.1 million of capital expenditures. We incurred approximately $7.1 million, $4.2 million and $2.9 million for capital expenditures during fiscal year 2006, 2005 and 2004, respectively. Capital expenditures can vary depending upon specific customer needs that may arise unexpectedly. We anticipate capital expenditures for the next twelve months to increase, as a result of increased business activity, to be in a range of approximately $12 million to $18 million.
Cashflows Attributable to Our Discontinued Operations. For fiscal year 2006, cash used by discontinued operations was $1.9 million. As there is no significant continuing involvement with Climax, this amount is not expected to reoccur in future periods.
Critical Accounting Policies The process of preparing financial statements in accordance with Generally Accepted Accounting Principles (“GAAP”) requires our
management to make estimates and judgments. It is possible that materially different amounts could be recorded if these estimates and judgments change or if actual results differ from these estimates and judgments. We have identified the following six critical accounting policies that require a significant amount of estimation and judgment and are considered to be important to the portrayal of our financial position and results of operations: • Revenue Recognition • Valuation of Intangible Assets • Income Taxes • Workers Compensation, Auto, Medical and General Liability Accruals • Allowance for Doubtful Accounts Receivable • Estimated Useful Lives
Revenue Recognition . We derive our revenues by providing a variety of industrial services. Generally, customers are billed on a time and materials basis although some work may be performed pursuant to a fixed-price bid. Emission control services may also be billed based on the number of components monitored. Services are usually performed pursuant to purchase orders issued under written customer agreements. While some purchase orders provide for the performance of a single job, others provide for services to be performed for a term of one year or less. In addition, we are a party to certain long-term contracts, which are enabling agreements only. Substantially all long-term agreements may be terminated by either party on short notice. The agreements generally specify the range of services to be performed and the hourly rates for labor. While contracts have traditionally covered specific plants or locations, we have recently entered into multiple regional or national contracts, which cover multiple plants or locations.
We determine our revenue recognition guidelines for our operations based on guidance provided in applicable accounting standards and positions adopted by the Federal Accounting Standards Board (“FASB”) or the SEC. Most of our projects are short-term in nature and we predominantly derive revenues by providing a variety of industrial services. For all of these services our revenues are recognized when services are rendered or when product is shipped and risk of ownership passes to the customer. However, due to various contractual terms with our customers, at the end of any reporting period there may be earned but unbilled revenue that is accrued to properly match revenues with related costs. At May 31, 2006 and 2005 the amount of earned but unbilled revenue was $3.8 million and $3.0 million, respectively.
Valuation of Intangible Assets . Intangible assets primarily consists of goodwill. Goodwill represents the excess of costs over fair value of assets of businesses acquired. Goodwill and intangible assets acquired in a
17
Table of Contents
Index to Financial Statements
purchase business combination and determined to have an indefinite useful life are not amortized, but are instead tested for impairment at least annually in accordance with the provisions of FASB Statement No. 142, Goodwill and Other Intangible Assets (“FASB No. 142”). Intangible assets with estimated useful lives are amortized over their respective estimated useful lives to their estimated residual values and reviewed for impairment in accordance with FASB Statement No. 144, Accounting for Impairment or Disposal of Long-Lived Assets (“FASB No. 144”).
The annual impairment test is conducted by first comparing the estimated fair value of the reporting unit to which the intangible asset is attributable and then comparing the ‘implied fair value’ of goodwill with its carrying amount. The estimated fair value of the reporting unit is determined by using discounted future cash flow estimates. The reporting units used for purposes of computing the annual impairment test of goodwill, pursuant to FASB No. 142, are the TCM and TMS divisions, both of which comprise our industrial services segment. All goodwill assigned to those reporting units is attributable to business acquisitions that are part of those units. Primarily as a result of our purchase of the assets of Cooperheat-MQS and TSI, there was $26.5 million of goodwill at May 31, 2006 and 2005, all of which is attributable to the TCM division. Based upon results of the annual impairment testing, last conducted as of May 31, 2006, there have been no impairments of goodwill.
Income Taxes. We follow the guidance in FASB No. 109, Accounting for Income Taxes (“FASB No. 109”) which requires that we use the asset and liability method of accounting for deferred income taxes and provide deferred income taxes for all significant temporary differences. As part of the process of preparing our consolidated financial statements, we are required to estimate our income taxes in each of the jurisdictions in which we operate. This process involves estimating our actual current tax payable and related tax expense together with assessing temporary differences resulting from differing treatment of certain items, such as depreciation, for tax and accounting purposes. These differences can result in deferred tax assets and liabilities, which are included within our consolidated balance sheets. We must then assess the likelihood that our deferred tax assets will be recovered from future taxable income and, to the extent we believe that it is more likely than not (a likelihood of more than 50%) that some portion or all of the deferred tax assets will not be realized, we must establish a valuation allowance. We consider all available evidence, both positive and negative, to determine whether, based on the weight of the evidence, a valuation allowance is needed. Evidence used includes information about our current financial position and our results of operations for the current and preceding years, as well as all currently available information about future years, including our anticipated future performance, the reversal of deferred tax liabilities and tax planning strategies.
Management believes future sources of taxable income, reversing temporary differences and other tax planning strategies will be sufficient to realize assets for which no reserve has been established. While we have considered these factors in assessing the need for a valuation allowance, there is no assurance that a valuation allowance would not need to be established in the future if information about future years change. Any change in the valuation allowance would impact our income tax provision and net income in the period in which such a determination is made. As of May 31, 2006 we believe that it is more likely than not that we will have sufficient future taxable income to allow us to realize the benefits of the net deferred tax assets. Our belief is based upon our track record of consistent earnings growth over the past five years and projections of future taxable income over the periods in which the deferred tax assets are deductible. Accordingly, no valuation allowance has been recorded.
Workers Compensation, Auto, Medical and General Liability Accruals. In accordance with SFAS No. 5, “ Accounting for Contingencies ,” we record a loss contingency when it is probable that a liability has been incurred and the amount of the loss can be reasonably estimated. We review our loss contingencies on an ongoing basis to ensure that we have appropriate reserves recorded on our balance sheet. These reserves are based on historical experience with claims incurred but not received, estimates and judgments made by management, applicable insurance coverage for litigation matters, and are adjusted as circumstances warrant. For workers’ compensation and automobile liability claims, our self-insured retention is $250,000 per case. For medical claims, our self-insured retention is $150,000 per individual claimant determined on an annual basis. We
18
Table of Contents
Index to Financial Statements
have obtained fully insured layers of coverage above such self-retention limits. Our estimates and judgment could change based on new information, changes in laws or regulations, changes in management’s plans or intentions, or the outcome of legal proceedings, settlements or other factors. If different estimates and judgments were applied with respect to these matters, it is likely that reserves would be recorded for different amounts.
Allowance for Doubtful Accounts. In the ordinary course of business, a percentage of our accounts receivable are not collected due to billing disputes, customer bankruptcies, dissatisfaction with the services we performed and other various reasons. To account for those accounts that will eventually be deemed uncollectible we establish an allowance. The allowance for doubtful accounts is based on a combination of our historical experience and management’s review of long outstanding accounts receivable. The allowance for doubtful accounts was $1.2 million at May 31, 2006 and 2005.
Estimated Useful Lives. The estimated useful lives of our long-lived assets are used to compute depreciation expense, future asset retirement obligations and are also used in impairment testing. Estimated useful lives are based, among other things, on the assumption that we provide an appropriate level of capital expenditures while the assets are still in operation. Without these continued capital expenditures, the useful lives of these assets could decrease significantly. Estimated lives could be impacted by such factors as future energy prices, environmental regulations, various legal factors and competition. If the useful lives of these assets were found to be shorter than originally estimated, depreciation expense may increase, liabilities for future asset retirement obligations may be insufficient and impairments in carrying values of tangible and intangible assets may result.
New Accounting Standards Beginning in the first quarter of fiscal year 2007, we will begin to recognize expense associated with certain stock-based compensation,
pursuant to FASB No. 123 (Revised), Shares Based Compensation (“FASB No. 123(R)”). We expect to recognize between $1.5 million and $2.0 million of expense in fiscal year 2007 in connection with the application of FASB No. 123(R). Please see Note 1 to our audited consolidated financial statements for a discussion of recently issued accounting pronouncements affecting us. ITEM 7A. QUANTITATIVE AND QUALITATIVE DISCLOSURES ABOUT MARKET RISK
We hold certain floating-rate obligations. We are exposed to market risk, primarily related to potential increases in interest rates related to our debt.
We have operations in foreign countries with a functional currency that is not the United States Dollar. We are exposed to market risk, primarily related to foreign currency fluctuations related to these operations. ITEM 8. CONSOLIDATED FINANCIAL STATEMENTS AND SUPPLEMENTARY DATA
Our financial statements and financial statement schedules, found at the end of this annual report, and are incorporated herein by reference. ITEM 9. CHANGES IN AND DISAGREEMENTS WITH ACCOUNTANTS ON ACCOUNTING AND FINANCIAL
DISCLOSURE There have been no disagreements concerning accounting and financial disclosures with our independent accountants during any of the
periods presented.
19
Table of Contents
Index to Financial Statements ITEM 9A. CONTROLS AND PROCEDURES
Limitations on Effectiveness of Control. Our management, including the principal executive and financial officers, does not expect that our disclosure controls and procedures or our internal control over financial reporting will prevent or detect all errors and all fraud. A control system, no matter how well designed or operated, can provide only reasonable, not absolute, assurance that the objectives of the control system are met. The design of our control system reflects the fact that there are resource constraints and the benefits of such controls must be considered relative to their costs. Further, because of the inherent limitations in all control systems, no evaluation of controls can provide absolute assurance that all control failures and instances of fraud, if any, have been detected. These inherent limitations include the realities that judgments in decision-making can be faulty and that breakdowns can occur because of simple error or mistake. Additionally, controls can be circumvented by the individual acts of some persons, by collusion of two or more people, or by management override of the controls. The design of any system of controls is also based in part on certain assumptions about the likelihood of future events and there can be no assurance that any design will succeed in achieving its stated goals under all potential future conditions. Projections of management’s assessments of the current effectiveness of our disclosure controls and procedures and its internal control over financial reporting are subject to risks. However, our disclosure controls and procedures are designed to provide reasonable assurance that the objectives of our control system are met.
Evaluation of Disclosure Controls and Procedures . As of the end of the period covered by this report, an evaluation was carried out under the supervision and with the participation of our management, including our Chief Executive Officer and our Chief Financial Officer, of the effectiveness of the design and operation of our disclosure controls and procedures (as defined in Rules 13a-15(e) and 15d-15(e) under the Exchange Act). This evaluation included consideration of the various processes carried out under the direction of our disclosure committee in an effort to ensure that information required to be disclosed in our SEC reports is recorded, processed, summarized and reported within the time periods specified by the SEC. This evaluation also considered the work completed relating to our compliance with Section 404 of the Sarbanes-Oxley Act of 2002, which is further described below.
Based on this evaluation, our CEO and CFO concluded that, as of May 31, 2006, our disclosure controls and procedures were operating effectively to ensure that the information required to be disclosed in our SEC reports is recorded, processed, summarized and reported within the requisite time periods and that such information is accumulated and communicated to management, including our CEO and CFO, as appropriate, to allow timely decisions regarding required disclosure.
Changes in Internal Control Over Financial Reporting . There were no changes in our internal control over financial reporting (as defined in Rules 13a-13(f) and 15d-15(f) of the Exchange Act) that have materially affected or are reasonably likely to materially affect our internal control over financial reporting during the fourth quarter of fiscal 2006.
ITEM 9B. OTHER EVENTS None
20
Table of Contents
Index to Financial Statements
Management’s Report on Internal Control Over Financial Reporting
Our management is responsible for establishing and maintaining adequate internal control over financial reporting as defined in Exchange Act Rule 13a-15(f). Our internal control over financial reporting is a process designed to provide reasonable assurance regarding the reliability of financial reporting and the preparation of our consolidated financial statements for external purposes in accordance with U.S. generally accepted accounting principles.
Internal control over financial reporting cannot provide absolute assurance of achieving financial objectives because of its inherent limitations. Internal control over financial reporting is a process that involves human diligence and compliance and is subject to lapses in judgment and breakdowns resulting from human failures. Internal control over financial reporting can also be circumvented by collusion or improper management override. Because of such limitations, there is a risk that material misstatements may not be prevented or detected on a timely basis by internal control over financial reporting. However, these inherent limitations are known features of the financial reporting process. Therefore, it is possible to design into the process safeguards to reduce, though not eliminate, this risk.
We have used the framework set forth in the report entitled Internal Control—Integrated Framework issued by the Committee of Sponsoring Organizations of the Treadway Commission to evaluate the effectiveness of our internal control over financial reporting. We have concluded that our internal control over financial reporting was effective as of May 31, 2006. KPMG LLP, an independent registered public accounting firm, has issued an attestation report on our assessment of our internal control over financial reporting.
/s/ P HILIP J. H AWK
/s/ T ED W. O WEN Philip J. Hawk
Chairman and Chief Executive Officer
Ted W. Owen Senior Vice President and Chief Financial Officer
21
Table of Contents
Index to Financial Statements
PART III
The information for the following items of Part III has been omitted from this Report on Form 10-K since we will file, not later than 120 days following the close of our fiscal year ended May 31, 2006, our definitive proxy statement. The information required by Part III will be included in that proxy statement and such information is hereby incorporated by reference, with the exception of the information under the headings “Compensation Committee Report” and “Comparison of Total Shareholders’ Return.” Item 10. Directors and Executive Officers of the Registrant Item 11. Executive Compensation Item 12. Security Ownership of Certain Beneficial Owners and Management and Related Stockholder Matters Item 13. Certain Relationships and Related Transactions Item 14. Principal Accountant Fees and Services
22
Table of Contents
Index to Financial Statements
PART IV ITEM 15. EXHIBITS, FINANCIAL STATEMENT SCHEDULES (a) 1. Financial Statements
The financial statements and notes thereto can be found on the following pages: Reports of Independent Registered Public Accounting Firm 24Consolidated Balance Sheets as of May 31, 2006 and 2005 26Consolidated Statements of Operations for the Years Ended May 31, 2006, 2005 and 2004 27Consolidated Statements of Comprehensive Income for the Years Ended May 31, 2006, 2005 and 2004 28Consolidated Statements of Stockholders’ Equity for the Years Ended May 31, 2006, 2005 and 2004 29Consolidated Statements of Cash Flows for the Years Ended May 31, 2006, 2005 and 2004 30Notes to Consolidated Financial Statements 31
23
Table of Contents
Index to Financial Statements
Report of Independent Registered Public Accounting Firm
The Board of Directors and Stockholders Team, Inc. and Subsidiaries:
We have audited management’s assessment, included in the accompanying Management’s Report on Internal Control Over Financial Reporting , that Team, Inc. and subsidiaries maintained effective internal control over financial reporting as of May 31, 2006, based on criteria established in Internal Control—Integrated Framework issued by the Committee of Sponsoring Organizations of the Treadway Commission (COSO) . Team, Inc.’s management is responsible for maintaining effective internal control over financial reporting and for its assessment of the effectiveness of internal control over financial reporting. Our responsibility is to express an opinion on management’s assessment and an opinion on the effectiveness of the Company’s internal control over financial reporting based on our audit.
We conducted our audit in accordance with the standards of the Public Company Accounting Oversight Board (United States). Those standards require that we plan and perform the audit to obtain reasonable assurance about whether effective internal control over financial reporting was maintained in all material respects. Our audit included obtaining an understanding of internal control over financial reporting, evaluating management’s assessment, testing and evaluating the design and operating effectiveness of internal control, and performing such other procedures as we considered necessary in the circumstances. We believe that our audit provides a reasonable basis for our opinion.
A company’s internal control over financial reporting is a process designed to provide reasonable assurance regarding the reliability of financial reporting and the preparation of financial statements for external purposes in accordance with generally accepted accounting principles. A company’s internal control over financial reporting includes those policies and procedures that (1) pertain to the maintenance of records that, in reasonable detail, accurately and fairly reflect the transactions and dispositions of the assets of the company; (2) provide reasonable assurance that transactions are recorded as necessary to permit preparation of financial statements in accordance with generally accepted accounting principles, and that receipts and expenditures of the company are being made only in accordance with authorizations of management and directors of the company; and (3) provide reasonable assurance regarding prevention or timely detection of unauthorized acquisition, use, or disposition of the company’s assets that could have a material effect on the financial statements.
Because of its inherent limitations, internal control over financial reporting may not prevent or detect misstatements. Also, projections of any evaluation of effectiveness to future periods are subject to the risk that controls may become inadequate because of changes in conditions, or that the degree of compliance with the policies or procedures may deteriorate.
In our opinion, management’s assessment that Team, Inc. and subsidiaries maintained effective internal control over financial reporting as of May 31, 2006, is fairly stated, in all material respects, based on criteria established in Internal Control—Integrated Framework issued by the Committee of Sponsoring Organizations of the Treadway Commission (COSO) . Also, in our opinion, Team, Inc. and subsidiaries maintained, in all material respects, effective internal control over financial reporting as of May 31, 2006, based on criteria established in Internal Control—Integrated Framework issued by the Committee of Sponsoring Organizations of the Treadway Commission (COSO) .
We also have audited, in accordance with the standards of the Public Company Accounting Oversight Board (United States), the consolidated balance sheets of Team, Inc. and subsidiaries as of May 31, 2006 and 2005, and the related consolidated statements of operations, comprehensive income, stockholders’ equity, and cash flows for each of the years in the three-year period ended May 31, 2006, and our report dated August 14, 2006 expressed an unqualified opinion on those consolidated financial statements.
Houston, Texas August 14, 2006
24
Table of Contents
Index to Financial Statements
Report of Independent Registered Public Accounting Firm
The Board of Directors and Stockholders Team, Inc. and Subsidiaries:
We have audited the accompanying consolidated balance sheets of Team, Inc. and subsidiaries as of May 31, 2006 and 2005, and the related consolidated statements of operations, comprehensive income, stockholders’ equity, and cash flows for each of the years in the three-year period ended May 31, 2006. These consolidated financial statements are the responsibility of the Company’s management. Our responsibility is to express an opinion on these consolidated financial statements based on our audits.
We conducted our audits in accordance with the standards of the Public Company Accounting Oversight Board (United States). Those standards require that we plan and perform the audit to obtain reasonable assurance about whether the financial statements are free of material misstatement. An audit includes examining, on a test basis, evidence supporting the amounts and disclosures in the financial statements. An audit also includes assessing the accounting principles used and significant estimates made by management, as well as evaluating the overall financial statement presentation. We believe that our audits provide a reasonable basis for our opinion.
In our opinion, the consolidated financial statements referred to above present fairly, in all material respects, the financial position of Team, Inc. and subsidiaries as of May 31, 2006 and 2005, and the results of their operations and their cash flows for each of the years in the three-year period ended May 31, 2006, in conformity with U.S. generally accepted accounting principles.
We also have audited, in accordance with the standards of the Public Company Accounting Oversight Board (United States), the effectiveness of Team, Inc.’s internal control over financial reporting as of May 31, 2006, based on criteria established in Internal Control—Integrated Framework issued by the Committee of Sponsoring Organizations of the Treadway Commission (COSO) , and our report dated August 14, 2006 expressed an unqualified opinion on management’s assessment of, and the effective operation of, internal control over financial reporting. Houston, Texas August 14, 2006
25
Table of Contents
Index to Financial Statements
TEAM, INC. AND SUBSIDIARIES CONSOLIDATED BALANCE SHEETS
(in thousands, except share and per share data) May 31, 2006 2005
ASSETS
Current Assets: Cash and cash equivalents $ 2,578 $ 3,993 Receivables, net of allowance of $1,255 and $1,233 68,487 58,923 Inventories 10,525 9,858 Deferred income taxes 781 1,114 Prepaid expenses and other current assets 2,460 1,637 Current assets of discontinued operations — 5,486
Total Current Assets 84,831 81,011 Property, plant and equipment, net 26,448 24,378 Intangible assets, net of accumulated amortization of $542 and $292 708 958 Goodwill 26,452 26,452 Other assets, net 1,532 2,644 Non-current assets of discontinued operations — 7,883
Total Assets $ 139,971 $ 143,326
LIABILITIES AND STOCKHOLDERS’ EQUITY
Current Liabilities: Current portion of long-term debt $ 5,899 $ 3,835 Accounts payable 7,978 10,467 Other accrued liabilities 16,898 13,959 Current income taxes payable 4,837 2,380 Current liabilities of discontinued operations — 1,281
Total Current Liabilities 35,612 31,922 Deferred income taxes 404 1,219 Long-term debt 39,804 59,907 Other long-term liabilities — 144 Liabilities of discontinued operations — 819
Total Liabilities 75,820 94,011
Minority interest 266 373 Commitments and contingencies Stockholders’ Equity:
Preferred stock, 500,000 shares authorized, none issued — — Common stock, par value $.30 per share, 30,000,000 shares authorized; 9,658,957 and 9,259,742
shares issued 2,898 2,778 Additional paid-in capital 44,723 40,724 Retained earnings 20,932 10,296 Accumulated other comprehensive loss 364 176 Treasury stock at cost, 1,018,308 shares (5,032) (5,032)
Total Stockholders’ Equity 63,885 48,942
Total Liabilities and Stockholders’ Equity $ 139,971 $ 143,326
See notes to consolidated financial statements.
26
Table of Contents
Index to Financial Statements
TEAM, INC. AND SUBSIDIARIES CONSOLIDATED STATEMENTS OF OPERATIONS
(in thousands, except per share data) Twelve Months Ended May 31, 2006 2005 2004 Revenues $ 259,838 $ 193,035 $ 94,546Operating expenses 170,709 128,237 57,588
Gross margin 89,129 64,798 36,958Selling, general and administrative expenses:
Operating income 21,377 9,548 8,531Interest expense, net 3,992 2,306 128 Earnings before income taxes 17,385 7,242 8,403Provision for income taxes 6,755 2,958 3,140 Income from continuing operations 10,630 4,284 5,263 Discontinued operations: Income from discontinued operations, net of tax 6 504 513 Net income $ 10,636 $ 4,788 $ 5,776 Net income per share: Basic
TEAM, INC. AND SUBSIDIARIES CONSOLIDATED STATEMENTS OF COMPREHENSIVE INCOME
(in thousands) Twelve Months Ended May 31, 2006 2005 2004 Net income $ 10,636 $ 4,788 $ 5,776 Net income on interest rate swaps — — 43 Foreign currency translation adjustment 302 246 22 Tax provision (114 ) (118) (16)
Comprehensive income $ 10,824 $ 4,916 $ 5,825
See notes to consolidated financial statements.
28
Table of Contents
Index to Financial Statements
TEAM, INC. AND SUBSIDIARIES CONSOLIDATED STATEMENTS OF STOCKHOLDERS’ EQUITY
(in thousands)
Common
Stock Treasury
Stock Additional
Paid in Capital
RetainedEarnings
Accumulated Other
ComprehensiveGain (Loss)
Total Stockholders’
Equity
Balance at June 1, 2003 $ 2,576 $ (4,637) $ 34,065 $ (268) $ (1) $ 31,735 Net income — — — 5,776 — 5,776 Unrealized gain on derivative instrument — — — — 27 27 Foreign currency translation adjustment — — — — 22 22 Repurchase of common stock — (395) — — — (395)Shares issued 89 — 4,091 — — 4,180 Non-cash compensation — — 344 — — 344 Exercise of stock options 50 — 327 — — 377 Tax benefit from exercise of stock options — — 233 — — 233
Balance at May 31, 2004 2,715 (5,032) 39,060 5,508 48 42,299 Net income — — — 4,788 — 4,788 Foreign currency translation adjustment — — — — 128 128 Shares issued 1 — 59 — — 60 Non-cash compensation — — 237 — — 237 Exercise of stock options 62 — 830 — — 892 Tax benefit from exercise of stock options — — 538 — — 538
Balance at May 31, 2005 2,778 (5,032) 40,724 10,296 176 48,942 Net income — — — 10,636 — 10,636 Foreign currency translation adjustment — — — — 188 188 Shares issued 5 — 118 — — 123 Non-cash compensation — — 385 — — 385 Exercise of stock options 115 — 2,034 — — 2,149 Tax benefit from exercise of stock options — — 1,462 — — 1,462
Balance at May 31, 2006 $ 2,898 $ (5,032) $ 44,723 $ 20,932 $ 364 $ 63,885
See notes to consolidated financial statements.
29
Table of Contents
Index to Financial Statements
TEAM, INC. AND SUBSIDIARIES CONSOLIDATED STATEMENTS OF CASH FLOWS
(in thousands) Twelve Months Ended May 31, 2006 2005 2004 Cash Flows From Operating Activities:
Net income $ 10,636 $ 4,788 $ 5,776 Less income attributable to discontinued operations (6 ) (504) (513)
Income attributable to continuing operations 10,630 4,284 5,263 Adjustments to reconcile net income to net cash provided by operating activities: Depreciation and amortization of intangible assets 6,345 5,135 1,855 Amortization of deferred loan costs 415 460 414 Allowance for doubtful accounts 1,183 943 184 Minority interest in earnings and other (107 ) 22 (1)Deferred income taxes (482 ) 655 311 Non-cash compensation cost 235 287 344 Changes in assets and liabilities, net of effects from business acquisitions: (Increase) decrease:
Accounts receivable (10,747 ) (24,813) (8,690)Inventories (667 ) (613) (414)Prepaid expenses and other current assets (452 ) 823 26
Increase (decrease): Accounts payable (3,536 ) 5,100 1,306 Other accrued liabilities 3,986 2,146 1,032 Income taxes payable 2,509 1,471 496
Net cash provided by (used in) operating activities $ 9,312 $ (4,100) $ 2,126
Cash Flows From Investing Activities: Capital expenditures (7,081 ) (4,231) (2,922)Proceeds from sale of Equipment Rental Segment 14,689 — — Proceeds from sale of assets 196 15 47 (Increase) decrease in other assets, net 133 (529) (30)Business acquisitions, net of cash acquired — (33,940) (5,401)
Net cash provided by (used in) investing activities $ 7,937 $ (38,685) $ (8,306)
Cash Flows From Financing Activities: Borrowings (payments) under revolving credit agreement (15,062 ) 22,408 8,752 Borrowings related to term loans and financing arrangements — 25,000 — Payments related to term loans and financing arrangements (3,831 ) (2,250) (1,482)Loan financing fees (189 ) (1,773) — Issuance of common stock 2,272 892 377 Repurchase of common stock — — (395)
Net cash provided by (used in) financing activities (16,810 ) 44,277 7,252
1. SUMMARY OF SIGNIFICANT ACCOUNTING POLICIES AND PRACTICES Introduction. Our corporate headquarters is located at 200 Hermann Drive, Alvin, Texas, 77511 and our telephone number is
(281) 331-6154. Our common stock trades on the American Stock Exchange (“AMEX”) under the symbol “TMI”. We were incorporated in Texas under the name Team, Inc. in 1973. Our fiscal year ends on May 31 of the same calendar year.
We are a leading provider of specialty maintenance and construction services required in maintaining high temperature and high pressure piping systems and vessels that are utilized extensively in the refining, petrochemical, power, pipeline, and other heavy industries. Our inspection services also serve a broader customer base that includes the aerospace and automotive industries. We offer an array of complimentary services including: • leak repair, • hot tapping, • fugitive emissions control, • field machining and technical bolting, • field valve repair, • non-destructive testing, and • field heat treating.
We offer these services in over 65 locations throughout the United States. We also serve the international market through our international subsidiaries and branches which include Aruba, Canada, Singapore, Trinidad and Venezuela. We also license our proprietary techniques and materials to various companies outside the United States and we receive royalties based upon revenues earned by our licensees.
Consolidation . Our consolidated financial statements include the financial statements of Team, Inc. and our majority owned subsidiaries. All significant intercompany balances and transactions have been eliminated in consolidation. Minority interest is recognized for the portion not owned by us. Certain amounts in prior years have been reclassified to conform to the current year presentation (please see Footnote 2 for a discussion of discontinued operations).
Use of Estimates. Our accounting policies conform to GAAP. Our most significant accounting policies are described below. The preparation of consolidated financial statements in conformity with GAAP requires management to make estimates and judgments that affect our reported financial position and results of operations. We review significant estimates and judgments affecting our consolidated financial statements on a recurring basis and record the effect of any necessary adjustments prior to their publication. Estimates and judgments are based on information available at the time such estimates and judgments are made. Adjustments made with respect to the use of these estimates and judgments often relate to information not previously available. Uncertainties with respect to such estimates and judgments are inherent in the preparation of financial statements. Estimates and judgments are used in, among other things, (1) aspects of revenue recognition, (2) analyzing tangible and intangible assets for possible impairment, (3) assessing future tax exposure and the realization of tax assets, (4) estimating various factors used to accrue liabilities for workers compensation, auto, medical and general liability (5) establishing an allowance for uncollectible accounts receivable, and (6) estimating the useful lives of our assets.
Fair Value of Financial Instruments The Company’s financial instruments consist primarily of cash, cash equivalents, accounts receivable, accounts payable and debt
obligations. The carrying amount of cash, cash equivalents, trade accounts receivable
31
Table of Contents
Index to Financial Statements
and trade accounts payable are representative of their respective fair values due to the short-term maturity of these instruments. The fair values of the Company’s credit facility are representative of their carrying values based upon the variable rate terms and management’s opinion that the current rates offered to the Company with the same maturity and security structure are equivalent to that of the credit facility.
Cash and Cash Equivalents . Cash and cash equivalents consist of all demand deposits and funds invested in highly liquid short-term investments with original maturities of three months or less.
Inventories. Inventories are stated at the lower of cost (first-in, first-out method) or market. Inventories include material, labor, and certain fixed overhead costs.
Property, Plant and Equipment. Property, plant and equipment are stated at cost less accumulated depreciation and amortization. Depreciation and amortization of assets are computed by the straight-line method over the following estimated useful lives of the assets:
Classification Life Buildings 20-40 years Leasehold improvements 2-10 years Machinery and equipment 2-10 years Furniture and fixtures 2-10 years Computers and computer software 2-5 years Automobiles 2-5 years
Goodwill and Other Intangible Assets. Goodwill represents the excess of costs over fair value of assets of businesses acquired. Goodwill and intangible assets acquired in a purchase business combination and determined to have an indefinite useful life are not amortized, but are instead tested for impairment at least annually in accordance with the provisions of FASB No. 142, Goodwill and Other Intangible Assets (“FASB No. 142”). Intangible assets with estimated useful lives are amortized over their respective estimated useful lives to their estimated residual values and reviewed for impairment in accordance with FASB No. 144, Accounting for Impairment or Disposal of Long-Lived Assets (“FASB No. 144”).
The annual impairment test is conducted by first comparing the estimated fair value of the reporting unit to which the intangible asset is attributable and then comparing the ‘implied fair value’ of goodwill with its carrying amount. The estimated fair value of the reporting unit is determined by using discounted future cash flow estimates. The reporting units used for purposes of computing the annual impairment test of goodwill, pursuant to FASB No. 142, are the TCM and TMS divisions, both of which comprise our industrial services segment. All goodwill assigned to those reporting units is attributable to business acquisitions that are part of those units. There was $26.5 million of goodwill at May 31, 2006 and 2005, all of which is attributable to the TCM division. Based upon results of the annual impairment testing, last conducted in May 2006, there has been no impairments of goodwill. A summary of goodwill as of May 31, 2006 and 2005 is as follows (in thousands):
Twelve Months Ended
May 31, 2006 2005 Balance at beginning of year $ 26,452 $ 12,111Acquisitions and Purchase Price Adjustments — 14,341Impairments — — Balance at end of year $ 26,452 $ 26,452
Income Taxes. We follow the guidance in FASB No. 109, Accounting for Income Taxes (“FASB No. 109”) which requires that we use the asset and liability method of accounting for deferred income taxes and
32
Table of Contents
Index to Financial Statements
provide deferred income taxes for all significant temporary differences. As part of the process of preparing our consolidated financial statements, we are required to estimate our income taxes in each of the jurisdictions in which we operate. This process involves estimating our actual current tax payable and related tax expense together with assessing temporary differences resulting from differing treatment of certain items, such as depreciation, for tax and accounting purposes. These differences can result in deferred tax assets and liabilities, which are included within our consolidated balance sheets. We must then assess the likelihood that our deferred tax assets will be recovered from future taxable income and, to the extent we believe that it is more likely than not (a likelihood of more than 50%) that some portion or all of the deferred tax assets will not be realized, we must establish a valuation allowance. We consider all available evidence, both positive and negative, to determine whether, based on the weight of the evidence, a valuation allowance is needed. Evidence used includes information about our current financial position and our results of operations for the current and preceding years, as well as all currently available information about future years, including our anticipated future performance, the reversal of deferred tax liabilities and tax planning strategies.
Allowance for Doubtful Accounts. In the ordinary course of business, a percentage of our accounts receivable are not collected due to billing disputes, customer bankruptcies, dissatisfaction with the services we performed and other various reasons. To account for those accounts that will eventually be deemed uncollectible we establish an allowance. The allowance for doubtful accounts is based on a combination of our historical experience and management’s review of long outstanding accounts receivable.
Workers Compensation, Auto, Medical and General Liability Accruals. In accordance with FASB No. 5, “ Accounting for Contingencies ,” we record a loss contingency when it is probable that a liability has been incurred and the amount of the loss can be reasonably estimated. We review our loss contingencies on an ongoing basis to ensure that we have appropriate reserves recorded on our balance sheet. These reserves are based on historical experience with claims incurred but not received, estimates and judgments made by management, applicable insurance coverage for litigation matters, and are adjusted as circumstances warrant. For workers’ compensation and automobile liability claims, our self-insured retention is $250,000 per case. For medical claims, our self-insured retention is $150,000 per individual claimant determined on an annual basis. Our estimates and judgment could change based on new information, changes in laws or regulations, changes in management’s plans or intentions, or the outcome of legal proceedings, settlements or other factors.
Revenue Recognition. We derive our revenues by providing a variety of industrial services. Generally, customers are billed on a time and materials basis although some work may be performed pursuant to a fixed-price bid. Emission control services may also be billed based on the number of components monitored. The agreements generally specify the range of services to be performed and the hourly rates for labor. While contracts have traditionally covered specific plants or locations, we have recently entered into multiple regional or national contracts, which cover multiple plants or locations.
We determine our revenue recognition guidelines for our operations based on guidance provided in applicable accounting standards and positions adopted by the FASB or the SEC. Most of our projects are short-term in nature and we predominantly derive revenues by providing a variety of industrial services. For all of these services our revenues are recognized when services are rendered or when product is shipped and risk of ownership passes to the customer. However, due to various contractual terms with our customers, at the end of any reporting period there may be earned but unbilled revenue that is accrued to properly match revenues with related costs. At May 31, 2006 and 2005, the amount of earned but unbilled revenue included in accounts receivable was $3.8 million and $3.0 million, respectively.
Concentration of Credit Risk. No single customer accounts for more than 10% of consolidated revenues.
Earnings Per Share. Basic earnings per share are computed by dividing net income by the weighted average number of common stock outstanding during the year. Diluted earnings per share are computed by dividing net income by the sum of (1) the weighted-average number of common stock outstanding during the
33
Table of Contents
Index to Financial Statements
period and (2) the dilutive effect of the assumed exercise of stock options using the treasury stock method. There is no difference, for any of the years presented, in the amount of net income (numerator) used in the computation of basic and diluted earnings per share. With respect to the number of weighted average shares outstanding (denominator), diluted shares reflects only the pro forma exercise of options to acquire common stock to the extent that the options’ exercise prices are less than the average market price of common shares during the period.
Options to purchase 107,000, 84,500, and 70,500 shares of common stock were outstanding during the years ended May 31, 2006, 2005 and 2004, respectively, but were not included in the computation of diluted earnings per share because the options’ exercise prices were greater than the average market price of common shares during the period.
Foreign Currency . For subsidiaries whose functional currency is not the United States dollar, assets and liabilities are translated at year-end rates of exchange and revenues and expenses are translated at average exchange rates. Translation adjustments for the asset and liability accounts are included as a separate component of accumulated other comprehensive loss in stockholders’ equity. Currency transaction gains and losses are recorded in other income and expense, net on the consolidated statements of operations.
Stock-Based Compensation. We apply the intrinsic-value method of accounting prescribed by Accounting Principles Board (“APB”) Opinion No. 25, Accounting for Stock Issued to Employees (“APB No. 25”), and related interpretations including FASB No. 44, Accounting for Certain Transactions involving Stock Compensation, an interpretation of APB Opinion No. 25 (“FASB No. 44”), to account for our fixed-plan stock options. Under this method, compensation expense is recorded on the date of grant only if the current market price of the underlying stock exceeded the exercise price. FASB Statement No. 123, Accounting for Stock-Based Compensation (“FASB No. 123”) and FASB No. 148, Accounting for Stock-Based Compensation—Transitions and Disclosure, an amendment of FASB Statement No. 123 (“FASB No. 148”), established accounting and disclosure requirements using a fair-value-based method of accounting for stock-based employee compensation plans. As permitted by existing standards, we have elected to continue to apply the intrinsic-value-based method of accounting described above, and have adopted only the disclosure requirements of FASB No. 123, as amended. Pro forma information regarding net income and earnings per share is required by FASB No. 123 and 148, which also requires that the information be determined as we have accounted for our employee stock options granted subsequent to December 31, 1994 under the fair value method of that Statement. The fair value for the options granted after this date was estimated at the date of grant using a Black-Scholes option pricing model with the following weighted-average assumptions for 2006, 2005, and 2004, respectively: 2006 2005 2004 Risk free interest rate 4.3% 3.1% 2.3%Volatility factor of the expected market price of the Company’s common stock 31.2% 23.6% 28.0%Expected dividend yield percentage 0.0% 0.0% 0.0%Weighted average expected life 4 yrs. 3 yrs. 3 yrs.
34
Table of Contents
Index to Financial Statements
The following table illustrates the effect on net income attributable to continuing operations if the fair-value-based method had been applied to all outstanding and unvested awards in each period (in thousands, except per share data): Fiscal Years Ended May 31, 2006 2005 2004 Net income attributable to continuing operations $ 10,630 $ 4,284 $ 5,263 Add stock based compensation expense included in reported net income, net of tax 143 189 227 Deduct stock-based compensation expense determined under fair value based method for all
awards, net of tax (542 ) (558) (267)
Pro forma net income attributable to continuing operations $ 10,231 $ 3,915 $ 5,223
Earnings per share attributable to continuing operations—Basic $ 1.26 $ 0.53 $ 0.68
Pro forma earnings per share attributable to continuing operations—Basic $ 1.22 $ 0.48 $ 0.68
Earnings per share attributable to continuing operations—Diluted $ 1.16 $ 0.48 $ 0.62
Pro forma earnings per share attributable to continuing operations—Diluted $ 1.11 $ 0.44 $ 0.62
Recently Issued Accounting Standards Not Yet Adopted FASB No. 123(R). In December 2004, the FASB issued “FASB 123(R)”, which revises FASB No. 123. FASB No. 123(R) is effective
for us beginning June 1, 2006 and requires us to expense the fair value of employee stock options and other forms of stock-based compensation. This expense will be recognized over the period during which an employee is required to provide services in exchange for the award. When we adopt FASB No. 123(R) effective June 1, 2006, we intend to use the modified prospective transition method permitted under this pronouncement. We have estimated our cumulative effect of implementing this standard, which consists entirely of a forfeiture adjustment, to be a benefit of less than $0.2 million after tax.
FASB No. 154. In May 2005, the FASB issued FASB No. 154, Accounting Changes and Error Corrections—A Replacement of APB Opinion No. 20 and SFAS No. 3 (“FASB No. 154”). FASB No. 154 changes the requirements for the accounting for and reporting of a change in accounting principle and applies to all voluntary changes in accounting principles. It also applies to changes required by an accounting pronouncement in the unusual instance that the pronouncement does not include specific transition provisions. FASB No. 154 requires retrospective application to prior periods’ financial statements of changes in accounting principle, unless it is impracticable to determine either the period-specific effects or the cumulative effect of the change. The provisions of FASB No. 154 are effective for accounting changes and correction of errors made in years beginning after December 15, 2005. The adoption of this standard is not expected to have a material effect on our results of operations, financial position or cash flows.
EITF Issue 05-6. In June 2005, the FASB’s Emerging Issues Task Force (“EITF”) reached consensus on Issue No. 05-6, Determining the Amortization Period for Leasehold Improvements (“EITF Issue 05-6”). EITF Issue 05-6 provides guidance on determining the amortization period for leasehold improvements acquired in a business combination or acquired subsequent to lease inception. The guidance in EITF Issue 05-6 will be applied prospectively and is effective for periods beginning after June 29, 2005. The adoption of this standard is not expected to have a material effect on our results of operations, financial position or cash flows.
35
Table of Contents
Index to Financial Statements
2. DISPOSITIONS AND ACQUISITIONS Dispositions. On November 30, 2005, we sold all of the outstanding stock of our wholly-owned subsidiary, Climax, for approximately
$14.5 million and recognized subsequent purchase price adjustments of approximately $0.2 million. Climax was engaged in equipment sales and rental and was a designer and manufacturer of portable metal cutting machinery used for industrial maintenance at customer locations. We recognized a pre-tax gain on the sale of Climax of $1.5 million, net of costs and expenses associated with the transaction of approximately $0.9 million, including approximately $250,000 of cash bonuses paid to certain Climax personnel and $150,000 of non-cash compensation (a cumulative gain, net of tax, of $0.1 million). Non-cash compensation expense is a result of our accelerating the vesting of stock options held by the management team of Climax covering 37,000 shares of our common stock.
For Federal income tax purposes, the stock sale provided the purchaser with a step-up in basis of the underlying assets of Climax under Section 338 (h)(10) of the Internal Revenue Code. This treatment results in a significantly higher taxable gain to us than is reflected in the financial statements since our tax basis calculation is limited to the amount of the historic tax basis of Climax in its underlying assets. The total differential between book and tax gain is approximately $4.9 million resulting in approximately $1.7 million of current income tax. Deferred income taxes of approximately $0.8 million were provided for the tax effect of the differential at the time of our purchase of Climax in 1998. An additional $0.9 million of income tax expense was provided in the second quarter in the discontinued operations section of the income statement to reflect the additional tax obligation resulting from the Section 338 (h)(10) election.
The assets and liabilities of Climax at the time of sale are as follows (in thousands):
Climax Receivables $ 2,618Inventories 2,785Prepaid expenses and other current 97
Total Current Assets 5,500Property, plant and equipment 4,498Goodwill 2,953Other assets 662
Total Assets 13,613Accounts Payable 675Other accrued liabilities 802
Total Current Liabilities 1,477Noncurrent deferred income taxes —
Net book value $ 12,136
The results of operations for Climax, presented as discontinued operations, include interest on our debt that is required to be repaid with proceeds from the sale of Climax. The revenues, operating income, interest expense allocation and earnings before income tax, presented in discontinued operations for the fiscal years ended 2006, 2005 and 2004 are as follows (in thousands): 2006 2005 2004 Revenues $ 7,462 $ 16,010 $ 13,123Operating income 394 1,469 1,210Interest expense allocation 472 651 391
Earnings (loss) before income taxes $ (78 ) $ 818 $ 819
36
Table of Contents
Index to Financial Statements
Acquisitions. On August 11, 2004, we completed the acquisition of substantially all of the assets Cooperheat. Cooperheat was operating as debtor-in-possession in a Chapter 11 case pending in the United States Bankruptcy Court for the Southern District of Texas, Houston, Texas (the “Bankruptcy Court”) (Case Nos. 03-48272-H2-11 and 03-48273-H2-11). On August 6, 2004, the Bankruptcy Court entered an order approving the sale of the assets by Cooperheat-MQS to us (pursuant to an “Asset Purchase Agreement”). The transaction involved cash consideration of $34.8 million, subject to a working capital adjustment, the assumption of certain liabilities including the assumption of $1.7 million in letters of credit and the issuance of warrants to purchase 100,000 shares of the our common stock with $.30 par value per share. The warrants are exercisable at $65 cash per share and expire on August 11, 2007, unless sooner exercised. The assets purchased from Cooperheat-MQS are associated with a non-destructive testing and inspection and field heat treating services business.
The transactions contemplated by the Asset Purchase Agreement, were financed with funds provided under our Credit Facility (please see Note 8). The acquisition was accounted for using the purchase method of accounting and, accordingly, the consolidated financial statements subsequent to the effective dates of the acquisition reflect the purchase price, including transaction costs effective August 11, 2004. Our consolidated results of operations for the year ended May 31, 2006 and 2005 include the results for Cooperheat-MQS for the period August 11, 2004 through May 31, 2006. The purchase price of Cooperheat-MQS was allocated to the assets and liabilities of Cooperheat-MQS based on its estimated fair value. Information regarding the allocation of the purchase price is set forth below (in thousands):
Cash and borrowings $ 34,078Purchase price adjustments 267Transaction costs 700
35,045Fair value of net assets acquired 20,704 Excess purchase price to be allocated to Goodwill $ 14,341
The following table summarizes the estimated fair values of the assets acquired and liabilities assumed at the date of acquisition (in thousands):
Cooperheat-MQS Net Assets of Acquisition
Cash $ 1,105 Accounts receivable 10,493 Inventory 1,393 Other current assets 3,044 Property, plant and equipment 13,459 Goodwill 14,341
Total assets acquired 43,835
Accounts payable 1,657 Accrued liabilities and other 5,035 Income taxes payable 2,086 Long-term liabilities 12
Total liabilities assumed 8,790
Net assets acquired 35,045 Less: cash (1,105)
Acquisition, net of cash acquired $ 33,940
37
Table of Contents
Index to Financial Statements
Our unaudited pro forma consolidated results of operations are shown below as if the Cooperheat-MQS acquisition occurred at the beginning of the period indicated. These results are not necessarily indicative of the results which would actually have occurred if the purchase had taken place at the beginning of the period, nor are they necessarily indicative of future results (amounts shown are in thousands, except per share data).
Pro forma data (unaudited) Twelve months ended May 31, 2005 2004 Revenues $ 220,654 $ 197,803 Net income (loss) $ 971 $ (10,854)Earnings per share:
Basic $ 0.12 $ (1.41)Diluted $ 0.11 $ (1.29)
On April 15, 2004, we completed the acquisition of all of the outstanding capital stock of TSI. Pursuant to the terms of a purchase agreement (the “Stock Purchase Agreement”) dated and effective as of April 1, 2004, TSI became our wholly-owned subsidiary. We paid consideration of approximately $9 million in cash, which included $1.3 million for the repayment of TSI’s debt and a $1.7 million adjustment for working capital acquired in excess of the minimum amount specified in the Stock Purchase Agreement, and issued 288,413 shares of our common stock. Of such amounts, $500,000 in cash and 189,019 shares were deposited into an escrow fund (the “Escrow Fund”) that we may use to satisfy working capital and accounts receivable adjustments and our indemnification rights under the Stock Purchase Agreement. Amounts remaining in the Escrow Fund and not subject to pending claims are to be distributed to the former TSI shareholders over a three year period ending in April 2007. The acquisition was accounted for using the purchase method of accounting. Accordingly, the consolidated financial statements subsequent to the effective dates of the acquisitions reflect the purchase price, including transaction costs. As the acquisition of TSI was effective April 1, 2004, our consolidated results of operations for the year ended May 31, 2004, include the results for TSI for the period April 1, 2004 to May 31, 2004. The purchase price of TSI was allocated to the assets and liabilities of TSI based on its estimated fair value. Information regarding the allocation of the purchase price is set forth below (in thousands):
Cash and borrowings $ 7,529Common stock issued 4,120Transaction costs 702
12,351Fair value of net assets acquired 6,087 Excess purchase price to be allocated to:
Goodwill 5,014Covenant not to compete 1,250
Excess purchase price $ 6,264
The covenant not to compete is a general agreement made with the principals of TSI not to compete with us for a period of five years. The valuation of the covenant was determined by an independent third party. The covenant is being amortized on a straight line basis over the five year term of the agreement. The amount of accumulated amortization applied to the covenant was $0.5 million and $0.3 million as of May 31, 2006 and 2005, respectively.
38
Table of Contents
Index to Financial Statements
The following table summarizes the estimated fair values of the assets acquired and liabilities assumed at the date of acquisition (in thousands):
TSI
Net Assets of Acquisition Cash and cash equivalents $ 43 Accounts receivable 4,656 Inventories 238 Other current assets 168 Property, plant and equipment 3,179 Other assets 27 Goodwill 5,014 Covenant not to compete 1,250
Total assets acquired 14,575 Current portion of long-term debt 321 Accounts payable 809 Accrued liabilities 922 Long-term liabilities 172
Total liabilities assumed 2,224
Net assets acquired 12,351 Less: cash (43)
Acquisition, net of cash acquired $ 12,308
Our unaudited pro forma consolidated results of operations are shown below as if the TSI acquisition occurred at the beginning of the period indicated. These results are not necessarily indicative of the results which would actually have occurred if the purchase had taken place at the beginning of the period, nor are they necessarily indicative of future results (in thousands, except per share data).
Pro forma data (unaudited)
Twelve months ended May 31, 2004
Revenues $ 121,104Net income $ 5,997Earnings per share:
Basic $ 0.78Diluted $ 0.71
3. RECEIVABLES A summary of accounts receivables as of May 31, 2006 and 2005 is as follows (in thousands):
The allowance for doubtful accounts is our best estimate of the amount of probable credit losses in our existing accounts receivable. Account balances are charged off against the allowance after all means of collection have been exhausted and the potential for recovery is remote. The following summarizes the activity in the allowance for doubtful accounts at May 31, 2006 and 2005 (in thousands):
Fiscal Years Ended
May 31, 2006 2005 Balance at beginning of year $ 1,233 $ 506 Provision for doubtful accounts 1,183 943 Write off of bad debt (1,161) (216)
Balance at end of year $ 1,255 $ 1,233
4. INVENTORIES A summary of inventory as of May 31, 2006 and 2005 is as follows (in thousands):
May 31, 2006 2005 Raw materials $ 1,398 $ 1,328Work in progress 318 302Finished goods 8,809 8,228
Total $ 10,525 $ 9,858
5. PROPERTY, PLANT AND EQUIPMENT A summary of property, plant and equipment as of May 31, 2006 and 2005 is as follows (in thousands):
May 31, 2006 2005 Land $ 600 $ 349 Buildings and leasehold improvements 6,340 8,393 Machinery and equipment 39,987 29,660 Furniture and fixtures 1,225 3,996 Computers and computer software 3,221 1,623 Automobiles 1,800 1,612
53,173 45,633 Accumulated depreciation and amortization (26,725 ) (21,255)
Property, plant, and equipment, net $ 26,448 $ 24,378
6. OTHER ACCRUED LIABILITIES A summary of other accrued liabilities as of May 31, 2006 and 2005 is as follows (in thousands):
May 31, 2006 2005 Payroll and other compensation expenses $ 10,987 $ 8,820Insurance accruals 2,283 2,210Property, sales and other taxes 719 730Interest 397 776Auto lease rebate 1,127 342Other 1,385 1,081
Total $ 16,898 $ 13,959
40
Table of Contents
Index to Financial Statements
7. INCOME TAXES Income tax expense for the years ended May 31, 2006, 2005, and 2004 was as follows (in thousands):
Twelve Months Ended May 31, 2006 2005 2004 Income tax expense attributable to income from continuing operations $ 6,755 $ 2,958 $ 3,140 Income tax expense attributable to income from discontinued operations 1,410 314 306 Taxes allocated to stockholders’ equity, related to compensation expense recognized
for tax expense recognized for tax purposes in excess of purposes in excess of amounts recognized for financial reporting purposes. (1,462 ) (538) (233)
Taxes allocated to stockholders’ equity, related to foreign currency translation adjustments and interest rate swaps 114 118 16
Total $ 6,817 $ 2,852 $ 3,229
Income tax expense attributable to income from continuing operations for the years ended May 31, 2006, 2005 and 2004 was as follows (in thousands): Current Deferred Total Year ended May 31, 2006: U.S. federal $ 4,776 $ (284) $ 4,492State & local 584 (198) 386Foreign jurisdictions 1,877 — 1,877
$ 7,237 $ (482) $ 6,755 Year ended May 31, 2005: U.S. federal $ 1,217 $ 528 $ 1,745State & local 310 122 432Foreign jurisdictions 727 54 781
$ 2,254 $ 704 $ 2,958 Year ended May 31, 2004: U.S. federal $ 2,360 $ 278 $ 2,638State & local 285 32 317Foreign jurisdictions 185 — 185
$ 2,830 $ 310 $ 3,140
The components of pre-tax income for the years ended May 31, 2006, 2005 and 2004 were as follows (in thousands): 2006 2005 2004 Domestic 12,209 5,664 6,389Foreign 5,176 1,578 2,014
17,385 7,242 8,403
41
Table of Contents
Index to Financial Statements
Income tax expense attributable to income from continuing operations differed from the amounts computed by applying the U.S. Federal income tax rate of 35% (34% for years ended May 31, 2005 and 2004) to pretax income from continuing operations as a result of the following (in thousands): Twelve Months Ended May 31, 2006 2005 2004 Income from continuing operations $ 17,385 $ 7,242 $ 8,403
Computed income taxes at statutory rate $ 6,085 $ 2,462 $ 2,857 State income taxes, net of federal benefit 250 327 210 Foreign tax differential 98 123 (55)Other 322 46 128
Provision for income tax $ 6,755 $ 2,958 $ 3,140
The tax effects of temporary differences that give rise to significant portions of the deferred tax assets and deferred tax liabilities are presented below (in thousands):
Deferred tax liabilities: Property, plant and equipment (927 ) (903)Goodwill and intangible costs (716 ) (662)Cumulative foreign currency translation gain (232 ) (118)Unremitted earnings of foreign subsidiaries (160 ) (53)Other (16 ) (44)
Total gross deferred tax liabilities (2,051 ) (1,780)
Net deferred liability $ 377 $ (105)
In assessing the realizability of deferred tax assets, we consider whether it is more likely than not that some portion or all of the deferred tax assets will not be realized. The ultimate realization of deferred tax assets is dependent upon the generation of future taxable income during the periods in which those temporary differences become deductible. We consider the scheduled reversal of deferred tax liabilities, projected future taxable income, and tax planning strategies in making this assessment. Based upon the level of historical taxable income and projection for future taxable income over the periods in which the deferred tax assets are deductible, we believe it is more likely than not that we will realize the benefits of these deductible temporary differences and therefore a valuations allowance is not necessary at May 31, 2006.
At May 31, 2006, current income taxes payable includes acquired tax uncertainties of $2.2 million associated with Cooperheat-MQS’s foreign operations. To the extent the uncertainties are ultimately resolved favorably, the resultant reduction of recorded liabilities will be applied to reduce the balance of goodwill attributable to the Cooperheat-MQS acquisition.
42
Table of Contents
Index to Financial Statements
8. LONG-TERM DEBT A summary of Long-term debt as of May 31, 2006 and 2005 is as follows (in thousands):
$ 45,703 In January 2006, we entered into a three-year enterprise agreement with a vendor for server and desktop volume licensing with software
assurance. The Software Licensing Note for the agreement was provided by the vendor under a three year non-interest bearing note. The note has been discounted at 7.3%, which is our effective borrowing rate. The discount of $0.1 million will be amortized to interest expense over the term of the note.
On August 11, 2004, in connection with our acquisition of Cooperheat-MQS, we replaced our existing debt with the Credit Facility which matures in August 2009 and consists of a revolving loan of $50 million and a $25 million term facility. Approximately $55 million (including the entire term loan) was borrowed on August 11, 2004 to finance the Cooperheat-MQS acquisition (approximately $36 million) and to refinance amounts outstanding on our existing facilities (approximately $19 million). Interest on the facility is at LIBOR plus a margin which is variable depending upon the ratio of funded debt to EBITDA (such margin was 1.75% at May 31, 2006). The new facility is secured by virtually all of our assets, including those acquired in the Cooperheat-MQS acquisition and contains restrictions on the creation of liens on assets and the acquisition or sale of subsidiaries as well as the incurrence of certain liabilities.
On October 5, 2005, we amended our Credit Facility (the “First Amendment”) to increase the allowable debt to EBITDA ratio. The First Amendment required that the debt to EBITDA ratio be no greater than 3.75 to 1. The First Amendment also provided that proceeds from a sale of the Climax business would be applied to reduce amounts outstanding under the revolving loan, rather than the term loan, as provided in the original credit agreement. The First Amendment further provided that the maximum debt to EBITDA ratio would be reduced to 3.0 to 1 immediately upon the disposition of Climax.
On November 15, 2005, we further amended the Credit Facility (the “Second Amendment”) to waive the required reduction in the debt to EBITDA ratio to 3.0 to 1 for the quarter ended November 30, 2005. The Second Amendment also increased the revolving credit facility by $5 million to a maximum amount of $60 million. We are in compliance with the amended covenants at May 31, 2006 and our unused available borrowing capacity under the Credit Facility was $29.0 million.
43
Table of Contents
Index to Financial Statements
We are occasionally required to post letters of credit generally issued by a bank as collateral under certain agreements. A letter of credit commits the issuer to remit specified amounts to the holder, if the holder demonstrates that we failed to meet our obligations under the letter of credit. If this were to occur, we would be obligated to reimburse the issuer for any payments the issuer was required to remit to the holder of the letter of credit. To date, we have not had any claims made against a letter of credit that resulted in a payment made by the issuer or by us to the holder. We believe it is unlikely that we will have to fund claims made under letters of credit in the foreseeable future. At May 31, 2006 and 2005, we were also contingently liable for outstanding stand-by letters of credit totaling $5.2 million and $5.1 million, respectively.
In connection with obtaining the Credit Facility in fiscal 2005, we incurred $1.8 million of issuance costs. Debt issuance costs included in other assets are $1.3 million and $1.5 million, net of accumulated amortization, at May 31, 2006 and 2005, respectively.
9. SHARE BASED COMPENSATION Stock Options:
We have adopted various stock option plans pursuant to which the Board of Directors may grant stock options to officers and key employees. In aggregate, up to 2,371,000 shares of authorized but unissued common stock may be issued under the plans. At May 31, 2006, there were approximately 1,434,000 stock options under the plans outstanding to officers, directors and key employees at prices equal to or greater than the market value of the common stock on the date of grant. The exercise price, terms and other conditions applicable to each option granted under our plans are generally determined by the Compensation Committee of the Board of Directors at the time of grant of each option and may vary. The stock options generally have ten year terms and vest and become fully exercisable after a period ranging from three to four years from the date of grant.
Included in the option plans discussed above are 1998 grants to our Chief Executive Officer (“CEO”) to purchase 200,000 shares of common stock at a price of $3.625 per share that were subject to a vesting schedule based on Team stock price performance measures. All of the performance measures were achieved as of the end of the first quarter of fiscal 2005, resulting in non-cash compensation expense of $219,000 in 2005 and $344,000 in 2004.
Additionally, in connection with a new employment agreement with our CEO in January 2005, the CEO was given the right to be issued future options to acquire up to an additional 400,000 shares of our common stock. Such options will be issued no later than January 2008, subject to the provision that the CEO continues to be employed by us. The new options may be granted under existing stock option plans or any other future plan that may be adopted by us. To the extent that the CEO exercises any previously awarded options, the issuance of the new options will be accelerated, generally limited to 100,000 per year through the term of the CEO’s employment agreement, January 31, 2008. In fiscal 2006 and 2005, 93,000 and 12,000 new options, respectively, were issued in connection with this employment agreement. All grants of new options have an exercise price equal to the market value of our common stock on the date of the new grant and these options vest ratably over four years.
44
Table of Contents
Index to Financial Statements
Transactions under all plans are summarized below: Fiscal Years Ended May 31, 2006 2005 2004
No. of
Options WeightedAverage
Price No. of
Options Weighted Average
Price No. of
Options WeightedAverage
Price Shares under option, beginning of year 1,494,000 $ 8.23 1,286,000 $ 5.06 1,284,000 $ 4.04Changes during the year:
Shares under option, end of year 1,434,000 $ 12.65 1,494,000 $ 8.23 1,286,000 $ 5.06Exercisable at end of year 842,000 $ 6.87 992,000 $ 4.84 993,000 $ 4.20 Weighted average grant-date fair value
of options granted during year $ 7.59 $ 3.28 $ 2.14
For options outstanding at May 31, 2006, the range of exercise prices and remaining contractual lives are as follows:
Range of Prices No. of
Options WeightedAverage
Price
WeightedAverageLife (inyears)
$1.94 to $4.00 460,000 $ 3.47 2.8 $5.15 to $9.00 208,000 $ 7.13 6.2$10.80 to $16.86 390,000 $ 15.62 8.3$18.45 to $19.38 169,000 $ 18.61 9.2$21.50 to $31.94 207,000 $ 28.14 9.7
1,434,000 $ 12.65 6.5
Restricted Stock Plan: In September 2004, we executed a Restricted Stock Award Agreement with our President and Chief Operating Officer. The Agreement
awards up to 15,000 shares of restricted stock which may vest upon the achievement of specific financial targets related to earnings before interest and taxes for the fiscal years 2005, 2006 and 2007. As of May 31, 2006, 10,000 shares have vested, resulting in non-cash compensation expense of $226,000 in fiscal 2006 and $50,000 in fiscal 2005.
10. EMPLOYEE BENEFIT PLANS Under the Team, Inc. Salary Deferral Plan, contributions are made by qualified employees at their election and our matching
contributions are made at specified rates. Our contributions in fiscal years 2006, 2005 and 2004, were approximately $1.1 million, $0.7 million and $0.4 million, respectively and are included in selling, general, and administrative expenses.
11. COMMITMENTS AND CONTINGENCIES In August 2005, we were served in a lawsuit styled Paulette Barker, as named Executor for the Estate of Robert Barker, et. al. v. Emmett
J. Lescroart, Michael Urban, Team, Inc. et. al., Case Number 355868-402 in the
45
Table of Contents
Index to Financial Statements
Probate Court #1, Harris County, Texas. The dispute arises out of the sale by Mr. Barker to Mr. Lescroart of stock in TSI. Subsequently, all of the outstanding stock of TSI was acquired by us in April 2004 allegedly for a much higher price than Mr. Lescroart paid Mr. Barker in July 2003. The plaintiff claims damages in excess of $1,000,000. We intend to vigorously defend this action and do not believe that we have any legal liability under the suit and, further, believe we are entitled to be indemnified from any loss we may incur under the terms of the Stock Purchase Agreement related to the TSI acquisition. Mr. Lescroart is a member of our Board of Directors and was dismissed from the lawsuit for lack of personal jurisdiction in December 2005.
We are involved in various other lawsuits and are subject to various claims and proceedings encountered in the normal conduct of business. In the opinion of our management, any uninsured losses that might arise from these lawsuits and proceedings will not have a materially adverse effect on our consolidated financial statements.
We also enter into operating leases to obtain equipment for our field operations and administrative functions. Our obligations under non-cancellable operating leases, primarily consisting of auto leases, were approximately $13.4 million at May 31, 2006 and are as follows (in thousands):
Total rent expense under operating leases, including rental expense under short term leases, was approximately $10.8 million, $5.6 million, and $3.4 million in 2006, 2005 and 2004, respectively.
12. COMMON STOCK During fiscal year 2004, we reacquired 50,000 shares pursuant to an approved, open market repurchase plan at an average price of
$7.89 per share. No shares were reacquired during fiscal year 2005 or 2006. The shares acquired through open market purchases have not been formally retired and, accordingly, are carried as treasury stock.
The following summarizes the activity of common shares outstanding for the years ended May 31, 2006, 2005 and 2004:
Common
Stock Issued
Treasury Stock
Shares Outstanding
Number of shares, May 31, 2003 8,587,512 (968,308) 7,619,204 Shares issued for director fees 7,500 — 7,500 Shares issued for business acquisition 288,413 — 288,413 Exercise of stock options 186,825 — 186,825 Shares repurchased — (50,000) (50,000)
Number of shares, May 31, 2004 9,070,250 (1,018,308) 8,051,942 Shares issued for director fees 3,708 — 3,708 Exercise of stock options 185,784 — 185,784
Number of shares, May 31, 2005 9,259,742 (1,018,308) 8,241,434 Shares issued for director fees 3,255 — 3,255 Exercise of stock options 380,960 — 380,960 Restricted stock grant 15,000 — 15,000
Number of shares, May 31, 2006 9,658,957 (1,018,308) 8,640,649
46
Table of Contents
Index to Financial Statements
13. INDUSTRY SEGMENT INFORMATION FASB Statement No. 131, Disclosure about Segments of an Enterprise and Related Information (“FASB No. 131”), requires we disclose
certain information about our operating segments where operating segments are defined as “components of an enterprise about which separate financial information is available that is evaluated regularly by the chief operating decision maker in deciding how to allocate resources and in assessing performance.” Generally, financial information is required to be reported on the basis that is used internally for evaluating segment performance and deciding how to allocate resources to segments.
Prior to the sale of Climax on November 30, 2005, we operated as two business segments, industrial services and equipment sales and rentals. As a result of the sale of Climax, we now operate in only one segment—industrial services. The industrial services segment has materially changed as a result of our acquisition of Cooperheat-MQS and TSI. Our TMS division provides services of leak repair, hot tapping, emissions control monitoring, on-site field machining, technical bolting, field valve repair and fugitive emissions monitoring. Our TCM division comprises our field heat treatment and non-destructive testing and inspection services. The industrial services business segment is the aggregation of these two divisions because of their similar economic characteristics.
Revenues from continuing operations and long-lived assets in the United States and other countries are as follows (in thousands):
Total
Revenues Total Assets
FY 2006 United States $ 223,560 $ 124,135Canada 21,309 11,339Other foreign countries 14,969 4,497
$ 259,838 $ 139,971
FY 2005
United States $ 171,897 $ 130,829Canada 12,149 8,006Other foreign countries 8,989 4,491
$ 193,035 $ 143,326
FY 2004
United States $ 85,543 $ 70,675Canada 1,564 1,067Other foreign countries 7,439 2,654
$ 94,546 $ 74,396
47
Table of Contents
Index to Financial Statements
14. SELECTED QUARTERLY FINANCIAL DATA (Unaudited) The following is a summary of selected quarterly financial data for the years ended May 31, 2006, and 2005 (in thousands, except per
share data): Fiscal 2006
First Quarter
Second Quarter
Third Quarter
Fourth Quarter
Total Year
Revenues $ 54,152 $ 67,046 $ 62,630 $ 76,010 $ 259,838Operating income 1,685 7,087 4,830 7,775 21,377Income from continuing operations 517 3,831 2,279 4,003 10,630Income (loss) from discontinued operations 32 (26) — — 6 Net income $ 549 $ 3,805 $ 2,279 $ 4,003 $ 10,636 Net income per share: Basic
2. Financial Statement Schedules All other schedules are omitted because they are not applicable or because the required information is included in the Consolidated
Financial Statements or Notes thereto.
48
Table of Contents
Index to Financial Statements
3. Exhibits Exhibit Number
3.1
Second Restated Articles of Incorporation of the Company, as amended through August 31, 1999, (filed as Exhibit 3(a) to the Company’s Annual Report on Form 10-K for the year ended May 31, 1999
3.2 Bylaws of the Company (filed as Exhibit 4.2 to the Company’s Registration Statement on Form S-2, File No. 33-31663). 4.1
Certificate representing shares of common stock of Company (filed as Exhibit 4(1) to the Company’s Registration Statement on Form S-1, File No. 2-68928).
10.1
Team, Inc. Salary Deferral Plan (filed as Exhibit 99(a) to the Company’s Registration Statement on form S-8, File No. 333-74062).
10.2
Team, Inc. Restated Non-Employee Directors’ Stock Option Plan as amended through June 24, 2004 (filed as Exhibit 10.3 to the Company’s Annual Report on Form 10-K for the year ended May 31, 2004).
10.3
Standard Restricted Stock Option Award Agreement by and between Philip J. Hawk and Team, Inc. dated November 2, 1998 (filed as Exhibit 10.3 to the Company’s Quarterly Report on Form 10-Q for the quarter ended November 30, 1998).
10.4
First Amendment to Price Vested Restricted Stock Option Award Agreement by and between Philip J. Hawk and Team, Inc. dated October 1, 2001 (filed as Exhibit 10.2 to the Company’s Quarterly Report on Form 10-Q for the quarter ended February 28, 2002).
10.5
Second Amendment dated July 11, 2002 to Price Vested Restricted Stock Option Award Agreement by and between Philip J. Hawk and Team, Inc (filed as Exhibit 10.12 to the Company’s Annual Report on Form 10-K for the year ended May 31, 2002).
10.6
1998 Incentive Stock Option Plan dated January 29, 1998 as amended through June 24, 2004 (filed as Exhibit 10.13 to the Company’s Annual Report on Form 10-K for the year ended May 31, 2004).
10.7
Stock Purchase Agreement dated as of April 1, 2004, by and among Team, Inc., Team Industrial Services, Inc. (“Team Industrial”), Thermal Solutions, Inc. (“TSI”), the TSI shareholders named therein and Michael J. Urban as the shareholder representative (filed as Exhibit 2.1 to the Company’s Current Report on Form 8-K filed April 16, 2004).
10.8
Escrow Agreement dated April 15, 2004 by and among Team, Inc., Team Industrial, TSI, the TSI shareholders named therein, Michael J. Urban as the shareholder representative and Compass Bank (filed as Exhibit 10.1 to the Company’s Current Report on Form 8-K filed April 16, 2004).
10.9
Asset Purchase Agreement dated July 16, 2004 by and among International Industrial Services, Inc., Cooperheat-MQS, Inc., Team Acquisition Corp. and Team, Inc. (filed as Exhibit 99.1 to the Company’s Current Report on Form 8-K filed, dated July 16, 2004, filed July 20, 2004).
10.10
Credit Agreement dated August 11, 2004 among Team, Inc., each lender from time to time party thereto, and Bank of America, N.A., as Administrative Agent, Swing Line Lender and L/C Issuer. (filed as Exhibit 10.2 to the Company’s Current Report on Form 8-K filed August 12, 2004).
10.11
Team, Inc. 2004 Restricted Stock Option and Award Plan dated June 24, 2004 (filed as Exhibit 10.21 to the Company’s Annual Report on Form 10-K for the year ended May 31, 2004).
10.12
Consulting agreement between Team, Inc. and Emmett J. Lescroart dated July 30, 2004 (filed as Exhibit 10.22 to the Company’s Annual Report on Form 10-K for the year ended May 31, 2004).
49
Table of Contents
Index to Financial Statements Exhibit Number
10.13
Restricted Stock Award Agreement by and between Kenneth M. Tholan and Team, Inc. dated September 23, 2004. (filed as Exhibit 10.1 to the Company Quarterly Report on Form 10-Q for the quarter ended February 28, 2005).
10.14
Employment Agreement by and between Philip J. Hawk and Team, Inc. dated January 31, 2005. (filed as Exhibit 10.2 to the Company Quarterly Report on Form 10-Q for the quarter ended February 28, 2005).
10.15
Amendment to Credit Agreement dated April 12, 2005 among Team, Inc., Bank of America, N.A., as Administrative Agent, Swing Line Lender and L/C Issuer, and the Lenders party thereto. (filed as Exhibit 10.3 to the Company Quarterly Report on Form 10-Q for the quarter ended February 28, 2005).
10.16
Stock Purchase Agreement by and among Climax Technologies, Inc., Team Investment, Inc., Team, Inc. and Climax Portable Machine Tools, Inc. dated November 30, 2005 (filed as Exhibit 2.1 to the Company’s Current Report on Form 8-K filed December 6, 2005).
10.17
First Amendment to Credit Agreement dated October 5, 2005, among Team, Inc., Bank of America, N.A., as Administrative Agent, Swing Line Lender and L/C Issuer, and the Lenders party thereto (filed as Exhibit 10.1. to the Company’s Current Report on Form 8-K filed December 6, 2005).
10.18
Second Amendment to Credit Agreement dated November 15, 2005, among Team, Inc., Bank of America, N.A., as Administrative Agent, Swing Line Lender and L/C Issuer, and the Lenders party thereto (filed as Exhibit 10.2. to the Company’s Current Report on Form 8-K filed December 6, 2005).
14.1 Code of Ethics (filed as Exhibit 14.1 to the Company’s Annual Report on Form 10-K for the year ended May 31, 2003). 21 Subsidiaries of the Company.
23.1 Consent of Independent Registered Public Accounting Firm—KPMG LLP 31.1 Certifications pursuant to Section 302 of the Sarbanes-Oxley Act of 2002 31.2 Certifications pursuant to Section 302 of the Sarbanes-Oxley Act of 2002 32.1 Certifications pursuant to Section 906 of the Sarbanes-Oxley Act of 2002 32.2 Certifications pursuant to Section 906 of the Sarbanes-Oxley Act of 2002
50
Table of Contents
Index to Financial Statements
SIGNATURES
Pursuant to the requirements of Section 13 or 15(d) of the Securities Exchange Act of 1934, the Registrant has duly caused this report to be signed on its behalf by the undersigned, thereunto duly authorized [ date here].
T EAM , I NC . By: / S / P HILIP J. H AWK
Philip J. Hawk Chief Executive Officer (Principal Executive Officer)
Pursuant to the requirements of the Securities Exchange Act of 1934, this report has been signed below by the following persons on behalf of the Registrant and in the capacity and on the dates indicated.
/ S / P HILIP J. H AWK (Philip J. Hawk)
Chief Executive Officer and Director and Director
August 14, 2006
/ S / V INCENT D. F OSTER
(Vincent D. Foster) Director
August 14, 2006
/ S / J ACK M. J OHNSON , J R .
(Jack M. Johnson, Jr.) Director
August 14, 2006
/ S / E. T HEODORE L ABORDE
(E. Theodore Laborde) Director
August 14, 2006
/ S / E MMETT J. L ESCROART
(Emmett J. Lescroart) Director
August 14, 2006
/ S / L OUIS A. W ATERS
(Louis A. Waters) Director
August 14, 2006
/ S / S IDNEY B. W ILLIAMS
(Sidney B. Williams) Director
August 14, 2006
/ S / T ED W. O WEN
(Ted W. Owen)
Senior Vice President Chief Financial Officer (Principal Financial Officer and Principal Accounting Officer)
August 14, 2006
51
Exhibit 21
SUBSIDIARIES OF REGISTRANT COMPANY
JURISDICTION / STATE OF INCORPORATION
Team, Inc. Texas Team Investment, Inc. Delaware Team Facilities & Services, L.P. Texas
Team Industrial Services, Inc. Texas Team Industrial Services International, Inc. Delaware
Team Industrial Services of Canada, ULC Canada Team Cooperheat-MQS Canada, Inc. Canada Global Heat (1988), Inc. Canada Global Heat U.K. Ltd. United Kingdom Teaminc. Europe The Netherlands Team Industrial Services Asia (PTE) Ltd. Singapore Team Industrial Services Trinidad, Ltd. Trinidad, West Indies Team Cooperheat-MQS Trinidad, Ltd. Trinidad, West Indies Team Cooperheat-MQS de Venezuela, C.V. de S.A. Venezuela
Exhibit 23.1
Consent of Independent Registered Public Accounting Firm
The Board of Directors Team, Inc.:
We consent to the incorporation by reference in the registration statements (No. 33-74382, No. 33-88684, No. 333-119341, No. 333-119344, No. 333-119346, No. 333-30003, No. 333-72329, No. 333-74060, No. 333-72331, No. 333-74070, No. 333-74062, No. 333-29997 and No. 333-74068) on Form S-8 of Team, Inc. of our report dated August 14, 2006, with respect to the consolidated balance sheets of Team, Inc. and Subsidiaries as of May 31, 2006 and 2005, and the related consolidated statements of operations, comprehensive income, stockholders’ equity and cash flows for each of the years in the three-year period ended May 31, 2006, which report appears in the May 31, 2006 annual report on Form 10-K of Team, Inc.
/ S / KPMG LLP
Exhibit 31.1
I, Philip J. Hawk, certify that: 1. I have reviewed this annual report on Form 10-K of Team, Inc.; 2. Based on my knowledge, this annual report does not contain any untrue statement of a material fact or omit to state a material fact
necessary to make the statements made, in light of the circumstances under which such statements were made, not misleading with respect to the period covered by this annual report;
3. Based on my knowledge, the financial statements, and other financial information included in this annual report, fairly present in all
material respects the financial condition, results of operations and cash flows of the registrant as of, and for, the periods presented in this report;
4. The registrant’s other certifying officer and I are responsible for establishing and maintaining disclosure controls and procedures (as
defined in Exchange Act Rules 13a-15(e) and 15d-15(e)) and internal control over financial reporting (as defined in Exchange Act Rules 13a-15(f) and 15d-15(f)) for the registrant and have:
a) Designed such disclosure controls and procedures, or caused such disclosure controls and procedures to be designed under our
supervision, to ensure that material information relating to the registrant, including its consolidated subsidiaries, is made known to us by others within those entities, particularly during the period in which this report is being prepared;
b) Designed such internal control over financial reporting, or caused such internal control over financial reporting to be designed
under our supervision, to provide reasonable assurance regarding the reliability of financial reporting and the preparation of financial statements for external purposes in accordance with generally accepted accounting principles;
c) Evaluated the effectiveness of the registrant’s disclosure controls and procedures and presented in this report our conclusions about
the effectiveness of the disclosure controls and procedures, as of the end of the period covered by this report based on such evaluation; and
d) Disclosed in this report any change in the registrant’s internal control over financial reporting that occurred during the registrant’s
most recent quarter that has materially affected, or is reasonably likely to materially affect, the registrant’s internal control over financial reporting; and
5. The registrant’s other certifying officer and I have disclosed, based on our most recent evaluation of internal control over financial
reporting, to the registrant’s auditors and the audit committee of the registrant’s board of directors: a) All significant deficiencies and material weaknesses in the design or operation of internal control over financial reporting which are
reasonably likely to adversely affect the registrant’s ability to record, process, summarize and report financial information; and b) Any fraud, whether or not material, that involves management or other employees who have a significant role in the registrant’s
internal control over financial reporting.
Date: August 14, 2006
/ S / P HILIP J. H AWK Philip J. Hawk
Chairman and Chief Executive Officer
Exhibit 31.2
I, Ted W. Owen, certify that: 1. I have reviewed this annual report on Form 10-K of Team, Inc.; 2. Based on my knowledge, this annual report does not contain any untrue statement of a material fact or omit to state a material fact
necessary to make the statements made, in light of the circumstances under which such statements were made, not misleading with respect to the period covered by this annual report;
3. Based on my knowledge, the financial statements, and other financial information included in this annual report, fairly present in all
material respects the financial condition, results of operations and cash flows of the registrant as of, and for, the periods presented in this annual report;
4. The registrant’s other certifying officer and I are responsible for establishing and maintaining disclosure controls and procedures (as
defined in Exchange Act Rules 13a-15(e) and 15d-15(e)) and internal control over financial reporting (as defined in Exchange Act Rules 13a-15(f) and 15d-15(f)) for the registrant and have:
a) Designed such disclosure controls and procedures, or caused such disclosure controls and procedures to be designed under our
supervision, to ensure that material information relating to the registrant, including its consolidated subsidiaries, is made known to us by others within those entities, particularly during the period in which this report is being prepared;
b) Designed such internal control over financial reporting, or caused such internal control over financial reporting to be designed
under our supervision, to provide reasonable assurance regarding the reliability of financial reporting and the preparation of financial statements for external purposes in accordance with generally accepted accounting principles;
c) Evaluated the effectiveness of the registrant’s disclosure controls and procedures and presented in this report our conclusions about
the effectiveness of the disclosure controls and procedures, as of the end of the period covered by this report based on such evaluation; and
d) Disclosed in this report any change in the registrant’s internal control over financial reporting that occurred during the registrant’s
most recent quarter that has materially affected, or is reasonably likely to materially affect, the registrant’s internal control over financial reporting; and
5. The registrant’s other certifying officer and I have disclosed, based on our most recent evaluation of internal control over financial
reporting, to the registrant’s auditors and the audit committee of the registrant’s board of directors: a) All significant deficiencies and material weaknesses in the design or operation of internal control over financial reporting which are
reasonably likely to adversely affect the registrant’s ability to record, process, summarize and report financial information; and b) Any fraud, whether or not material, that involves management or other employees who have a significant role in the registrant’s
internal control over financial reporting.
Date: August 14, 2006
/ S / T ED W. O WEN
Ted W. Owen Senior Vice President—Finance and Administration
Exhibit 32.1
CERTIFICATION PURSUANT TO 18 U.S.C. SECTION 1350,
AS ADOPTED PURSUANT TO SECTION 906 OF THE SARBANES-OXLEY ACT OF 2002
In connection with the Annual Report of Team, Inc. (the Company) on Form 10-K for the period ended May 31, 2006 as filed with the Securities and Exchange Commission on the date hereof (the Report), I, Phillip J. Hawk, Chairman and Chief Executive Officer of the Company, certify, pursuant to 18 U.S.C. Section 1350, as adopted pursuant to Section 906 of the Sarbanes-Oxley Act of 2002, that: (1) The Report fully complies with the requirements of section 13(a) or 15(d) of the Securities Exchange Act of 1934 (15 U.S.C. 78m
or 78o(d)); and (2) The information contained in the Report fairly presents, in all material respects, the financial condition and results of operations of
the Company.
/ S / P HILIP J. H AWK Philip J. Hawk
Chairman and Chief Executive Officer August 14, 2006
Exhibit 32.2
CERTIFICATION PURSUANT TO 18 U.S.C. SECTION 1350,
AS ADOPTED PURSUANT TO SECTION 906 OF THE SARBANES-OXLEY ACT OF 2002
In connection with the Annual Report of Team, Inc. (the Company) on Form 10-K for the period ended May 31, 2006 as filed with the Securities and Exchange Commission on the date hereof (the Report), I, Ted W. Owen, Senior Vice President – Finance and Administration of the Company, certify, pursuant to 18 U.S.C. Section 1350, as adopted pursuant to Section 906 of the Sarbanes-Oxley Act of 2002, that: (1) The Report fully complies with the requirements of section 13(a) or 15(d) of the Securities Exchange Act of 1934 (15 U.S.C. 78m
or 78o(d)); and (2) The information contained in the Report fairly presents, in all material respects, the financial condition and results of operations of
the Company.
/ S / T ED W. O WEN Ted W. Owen
Senior Vice President—Finance and Administration August 14, 2006