TNP2K WORKING PAPER AVAILABILITY AND QUALITY OF PUBLIC HEALTH FACILITIES IN EASTERN INDONESIA: RESULTS FROM THE INDONESIA FAMILY LIFE SURVEY EAST 2012 JAN PRIEBE, FIONA HOWELL, AND MARIA CARMELA LO BUE TNP2K WORKING PAPER 11c - 2014 June 2014
Transcript
TNP2KWORKING PAPER
AVAILABILITY AND QUALITY OF PUBLIC HEALTH FACILITIES IN EASTERN INDONESIA:
RESULTS FROM THE INDONESIA FAMILY LIFE SURVEY EAST 2012
JAN PRIEBE, FIONA HOWELL, AND MARIA CARMELA LO BUE
TNP2K WORKING PAPER 11c - 2014June 2014
AVAILABILITY AND QUALITY OF PUBLIC HEALTH FACILITIES IN EASTERN INDONESIA:
RESULTS FROM THE INDONESIA FAMILY LIFE SURVEY EAST 2012
JAN PRIEBE, FIONA HOWELL, AND MARIA CARMELA LO BUE
TNP2K WORKING PAPER 11c - 2014June 2014
The TNP2K Working Paper Series disseminates the findings of work in progress to encourage discussion and exchange of ideas on poverty, social protection, and development issues. Support for this publication has been provided by the Australian Government through the Poverty Reduction Support Facility (PRSF).
The findings, interpretations, and conclusions herein are those of the author(s) and do not necessarily re-flect the views of the Government of Indonesia or the Government of Australia.
You are free to copy, distribute, and transmit this work for noncommercial purposes.
Attribution: Priebe, J., F. Howell, and M. Lo Bue. 2014. ‘Availability and Quality of Public Health Facilities in Eastern Indonesia: Results from the Indonesia Family Life Survey East 2012’, TNP2K Working Paper 11c-2014. Jakarta, Indonesia: Tim Nasional Percepatan Penanggulangan Kemiskinan (TNP2K).
To request copies of the report or for more information on the report, please contact the TNP2K Knowledge Management Unit ([email protected]). The paper is also available at the TNP2K website (www.tnp2k.go.id).
Availability and Quality of Public Health Facilities in Eastern Indonesia:Results from the Indonesia Family Life Survey East 2012
Jan Priebe, Fiona Howell, and Maria Carmela Lo Bue1
June 2014
ABSTRACT
Little is known about public health-care supply in Eastern Indonesia, a region that shows worse health outcomes than the rest of the country. Drawing on a new dataset (IFLS East 2012), this paper examines the availability and quality of public health-care facilities (puskesmas and posyandu) in Eastern Indo-nesia.
Our findings suggest that public health-care supply plays a larger and more important role in Eastern Indonesia compared with Western Indonesia. However, this stronger reliance and dependence on public health-care provision has not necessarily resulted in quality health-care supply. Although significant improvements have been achieved over time, we found that many puskesmas and posyandu could benefit from more and better-trained staff (education, training, availability, absenteeism) and better physical endowment (infrastructure, medical equipment, and medications). The results further suggest that remarkable differences in the provision of health care exist between urban and rural areas; urban areas have on average better-equipped puskesmas, whereas rural areas seem to have better-equipped posyandu. Furthermore, we found that direct funds from the central level (central government funds and Jamkesmas), despite the decentralization process, play a major role in financing the operations of public health facilities. In rural Eastern Indonesia, these central-level funds constitute about 80 percent of the total operational budget of a puskesmas.
1 Jan Priebe ([email protected] or [email protected]) is a senior economist at TNP2K’s Cluster 1 team. Fiona Howell is the social assistance policy advisor in TNP2K, Government of Indonesia. Maria Carmela Lo Bue is research associ-ate at the Development Economics Research Group at the University of Göttingen, Germany.The authors would like to thank Suahasil Nazara, Elan Satriawan, and Sudarno Sumarto for valuable input and comments. Special thanks go to SurveyMETER, in particular, to Bondan Sikoki, Ni Wayan Suriastini, and Firman Witoelar for providing clarifications on the IFLS East 2012 data. We also wish to gratefully acknowledge Maciej Czos and Pamela S. Cubberly for their editorial assistance. Any remaining errors are solely our responsibility.
vi
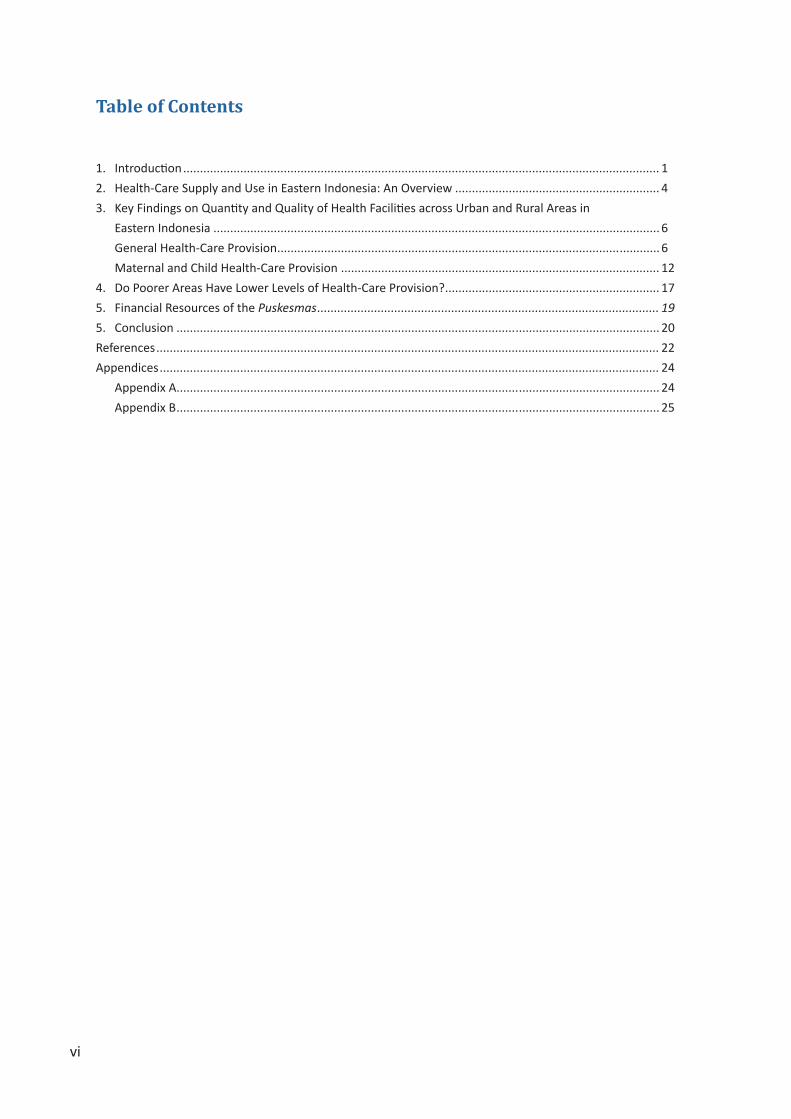
Table of Contents
1. Introduction .............................................................................................................................................. 12. Health-Care Supply and Use in Eastern Indonesia: An Overview ............................................................. 43. KeyFindingsonQuantityandQualityofHealthFacilitiesacrossUrbanandRuralAreasin
Eastern Indonesia ..................................................................................................................................... 6General Health-Care Provision .................................................................................................................. 6Maternal and Child Health-Care Provision ............................................................................................... 12
In the past several decades, Indonesia has achieved significant improvements in the delivery of health-care services. Starting in the mid-1970s, the country embarked on a massive expansion of basic health services and launched a large-scale health-care supply programme (Inpres), which rapidly led to an increase in the number of health centres and physicians. A further expansion in the supply of health practitioners occurred in 1992 when Indonesia embarked on the ambitious Bidan Di Desa programme, which trained 50,000 village midwives and posted them to rural villages throughout the country. With the start of the decentralization process in the late 1990s and early 2000s, a significant change in the financing and administration of health services occurred: a change towards more local accountability, devolution, and privatization. As a result, increasing the provision of health-care services became one of the key responsibilities of local governments (Kristiansen and Santoso 2006); funds were allocated for the construction of additional health centres (puskesmas) and for expansion of community access to services through auxiliary mobile health centres (pustu). However, the expansion in the supply of public health services in the past several decades shows striking disparities across and within provinces, between urban and rural areas, as well as between poor and rich communities.
Although the supply of health services in Indonesia has increased over time, the demand for them has also risen substantially. Several factors can be linked with the increases in health-care demand in the past several decades (higher economic growth rates, lower poverty rates, better infrastructure, higher life expectancy, and population growth). Although most of these factors led to a continuous rise in health-care demand, the introduction of free health insurance schemes for the poor initiated in the early 2000s (Pradhan et al. 2007; Sparrow et al. 2010) boosted the demand for health services.
Given the challenges mentioned above and despite many improvements, Indonesia still lacks the ade-quate provision of public health-care services, in particular in rural areas and in the eastern part of the archipelago. This undersupply is reflected in Indonesia’s mixed performance on health outcomes in the past several decades; although the country has achieved remarkable progress in reducing child mortality rates and increasing life expectancy, maternal mortality rates decreased only slightly, with child under-nutrition rates stagnating with progress often being confined to more developed areas and provinces (Yavuz and Rokx 2008; MoH 2014). Likewise, new challenges have emerged. Due to the changes in consumption patterns associated with the nutrition transition, an increasing number of people are be-coming overweight and obese (Roemling and Qaim 2012, 2013). Whereas one-third of children under five years of age are stunted, and more than 20 percent of Indonesian women are overweight (World Bank 2013). This double burden of malnutrition poses a significant risk to Indonesia’s development, as it strongly compromises the health of the current and future workforce and, by directly causing ad-ditional health costs and significant losses in productivity, undermines the growth trajectories and the poverty reduction perspectives of the country.
The undersupply of health services in Indonesia manifests itself, not only in the mixed performance of health outcomes in the past several decades, but also in the price of medical care. According to Kristian-sen and Santoso (2006), the privatization of health-care services in the early 2000s led to an increase in the real costs of medicines and professional therapy, causing poor families to return to traditional medicine and healers.
2
The undersupply of health services has been noted by the Government of Indonesia. The National Development Planning Agency (Badan Perencanaan Pembangunan Nasional or Bappenas) recognised that higher public expenditure in the health sector has so far not been sufficient to substantially improve the Indonesian health-care system nor to fully achieve the country’s commitment to the Millennium Development Goals (MDGs) in health1 (Bappenas 2009). Likewise, Yavuz and Rokx (2008) found that, although some improvements have been made in increasing the supply of health services, very little progress has been recorded in spending efficiency, quality of services, and ensuring universal coverage of the health system.
This paper focuses on the availability and quality of health-care supply by public providers in Eastern Indonesia. Eastern Indonesian provinces have often been ranked relatively low compared with other provinces in several health and non-health-related dimensions (Yavuz and Rokx 2008; Rokx et al. 2010). For example, infant and child mortality rates in provinces such as East and West Nusa Tenggara, Maluku, and North Maluku were almost 50 percent higher than in Bali or Java (BPS 2008); life expec-tancy in East Nusa Tenggara, North Maluku, and Papua lie well below the national average, and rates of access to clean water and sanitation in provinces such as Maluku and Papua are about 40–50 percent, whereas in many Western Indonesian provinces they are 50–60 percent (Yavuz and Rokx 2008). It is therefore of high importance and policy relevance to better understand the provision, problems, and constraints that health-care facilities in Eastern Indonesia face.
Information on health-care supply in Indonesia is still very scarce. Although many data sets allow for the analysis of nationwide health outcomes and health-care use behaviour (Susenas, Riskesdas, and Demographic and Health Survey data), only Village Potential Statistics (Potensi Desa or PODES) data provide a limited amount of information on the availability of health facilities. Using data from the first round of the Indonesian Family Life Survey for Eastern Indonesia (IFLS East 2012), we were able to provide a new look at and insights into provision and health-care use in Eastern Indonesia. Conducted by SurveyMETER on behalf of TNP2K in seven provinces of Eastern Indonesia (Kalimantan Timur, Maluku, Maluku Utara, Nusa Tenggara Timur, Papua, Papua Barat, and Sulawesi Tenggara), the IFLS East 2012 contains detailed data at the individual, household, and community levels. A total of 98 villages were surveyed (Satriawan et al. 2014; Priebe et al. 2014). In particular, the IFLS East 2012 provides information on several types of health institutions, such as government health centres (puskes-mas/pustu), traditional midwives, and child health posts (posyandu), all of which are examined in this working paper.
Our results suggest that significant scope exists for the improvement of public health-care facilities in Eastern Indonesia in terms of the availability and quality of medical staff as well as physical infra-structure and equipment. In particular, puskesmas in rural areas seem to operate under many constraints and limitations that are likely to restrict their ability to provide sufficient basic health services without considering quality. However, we did not find that public health services in general are delivered with lower quality in rural areas. At the posyandu level, we observed the opposite: rural posyandu were bet-ter endowed compared to urban posyandu. Data from the IFLS East 2012 further show that financial resources from the national level (national government funds and Jamkesmas) constitute the major
1 These health goals are to (a) eradicate hunger by reducing by half the proportion of malnourished people (MDG 1), (b) re-duce child mortality by reducing by two-thirds the mortality of children under five (MDG 4), and (c) improve maternal health by reducing maternal mortality by three-quarters and achieving universal access to reproductive health (MDG 5).
3
source of finance for puskesmas. About 40 percent of the general budget for urban—and 80 percent for rural—puskesmas can be attributed to such funds.
The remainder of this paper is organised as follows: Section II provides an overview of the demand and supply of health care in Eastern Indonesia compared with Western Indonesia. Section III illustrates several quantitative and qualitative indicators of different types of health institutions (puskesmas, po-syandu, and traditional midwives) in an urban-rural comparison. Section IV re-analyses section 3 from a wealth gradient perspective (poor areas versus rich areas), and section V discusses the financing struc-ture of the puskesmas. Section VI provides concluding remarks.
4
2. Health-Care Supply and Use in Eastern Indonesia: An Overview
In Indonesia, several levels of government (national, provincial, district, subdistrict, and village) are involved in the planning and supply of health facilities: the national level designs the overall framework of Indonesia’s health policy and is responsible for allocating financial resources (budget) to Indonesia’s health sector. The central government is also in charge of the national health insurance plans and setting the regulatory framework (identification of accreditation standards for health facilities and medical workers). However, most managerial and financial responsibilities and the actual provision of health care are decentralised to the provincial, district, subdistrict, and village levels.
At the district level, the Health Office (Dinas Kesehatan Kabupaten/Kota or Dinas Kesehatan for short), which is linked to the Ministry of Health, implements provincial guidelines and directly administers local public health programmes such as immunization and infectious disease control. At the subdistrict level, the community health centres (puskesmas) are tasked with directly administering medical care to patients. At the village level,2 provision of care includes small community health centres, pustu, mid-wife clinics, and child health posts (posyandu), as well as public hospitals.
The supply of health care in Indonesia is thus managed by several different types of health-care pro-viders. On the public side, in addition to public hospitals, there are public subdistrict-level communi-ty health centres (puskesmas), which offer general health-care services, and government-funded vil-lage-level health centres (such as posyandu), which arrange for midwives (bidan) and village midwives (bidan desa)3 services once a month per village. In addition, private health-care providers contribute to the overall provision of health services in the country. Private providers can be grouped into traditional providers (healers and midwives) and modern providers, such as private physicians and privately run clinics and hospitals.4
As shown in table 1, all over Indonesia, outpatient treatment is largely managed by polyclinics,5 pusk-esmas, and paramedics, whereas inpatient treatment is most commonly received at public hospitals, followed by private facilities.
In terms of differences between Western and Eastern Indonesia, one observes that patients in Eastern Indonesia in provinces such as Lombok, Maluku, Nusa Tenggara Barat, Nusa Tenggara Timur, and Pap-ua appear to rely much more on puskesmas for outpatient treatment. Likewise, they are relatively more likely to rely on public health facilities for inpatient treatment. We observed therefore that, in general, public health services play a much larger role in Eastern than in Western Indonesia.
To what extent the relatively lower use of private health-care providers is due to supply constraints (e.g., qualified private doctors are less available in Eastern Indonesia) or a lower demand for such services cannot be established with existing data.
2 The term village refers to both rural (desa) and urban (kelurahan) villages.3 The main difference between a midwife and a village midwife is that, in addition to the maternal and child health-care ser-vices typically provided by midwives, village midwives are supposed to work more closely with the community; they promote community participation in health and serve as a health resource by actively seeking out patients at their homes (MoH 1994).4 Many of the private physicians often accept various forms of health insurance, such as Jamkesda and Jamkesmas for the poor, Jamsostek for private employees, and Askes for government employees and civil servants.5 Polyclinics are set up and run by private providers and often employ only a general practitioner and a dentist.
5
Table 1: Inpatient and Outpatient Treatment in Indonesia
PANEL A: Outpatient Treatment Conditional on Being Sick and Seeking Treatment (percent)
Java and Bali
Kalimantan Maluku NTT, NTB*,
and Lombok
Papua Sulawesi Sumatra
State hospital 5 8 9 4 19 6 6
Private hospital 5 4 2 2 3 2 5
Doctor/polyclinic treatment
36 22 18 21 23 22 23
Health clinic (puskesmas/pustu)
28 40 55 56 60 50 29
Medical worker practice
33 31 17 19 4 23 41
Traditional treatment 3 2 2 2 1 2 3
Maternity healer 1 1 1 0 1 0 1
Other facilities and treatments
3 3 6 4 2 3 3
PANEL B: Inpatient Treatment Conditional on Being Sick and Seeking Treatment (percent)
IndicatorJava and
BaliKalimantan Maluku NTT,
NTB*, and
Lombok
Papua Sulawesi Sumatra
State hospital 40 58 64 40 77 63 46
Private hospital 39 29 13 14 14 17 35
Health clinic (puskesmas/pustu)
16 7 10 44 10 19 6
Medical worker practice
8 5 13 2 3 4 13
Traditional treatment 1 0 0 0 1 0 1
Other facilities and treatments
2 4 1 2 2 1 2
Source: Authors’ calculations based on Susenas March 2013. Individual weights applied.Note: NTT = Nusa Tenggara Timur; NTB = Nusa Tenggara Barat.
6
3. Key Findings on Quantity and Quality of Health Facilities across Urban and Rural Areas in Eastern Indonesia
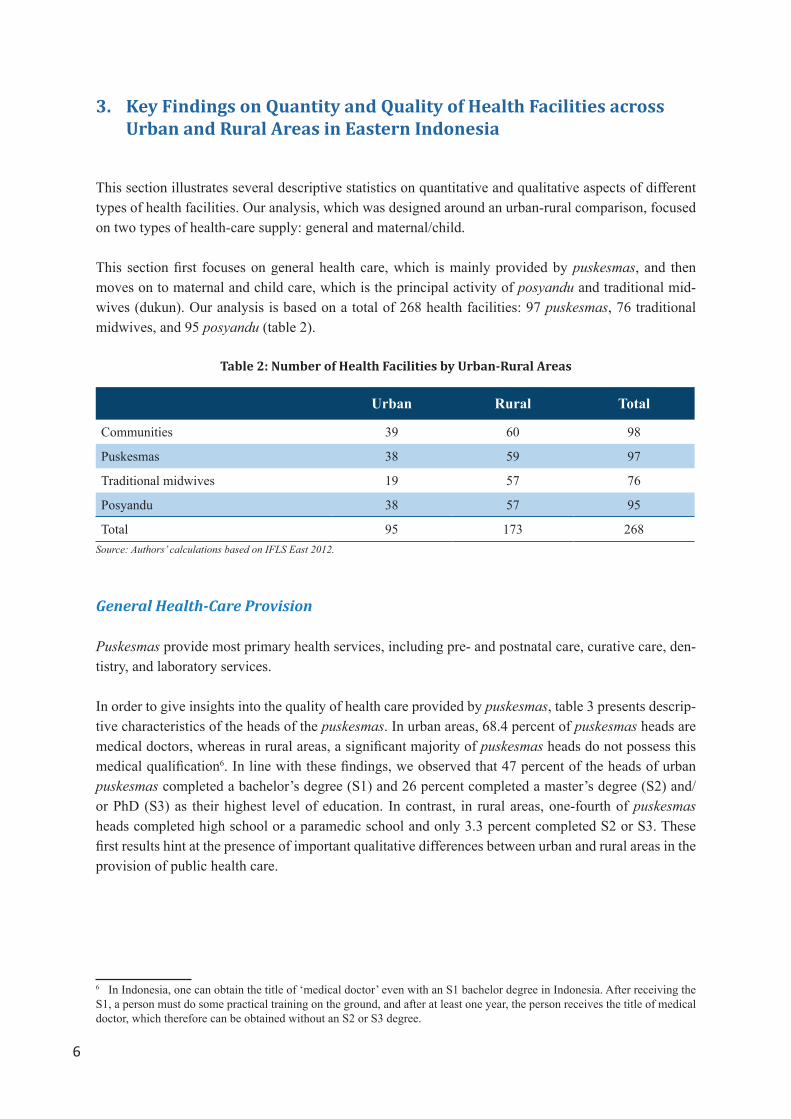
This section illustrates several descriptive statistics on quantitative and qualitative aspects of different types of health facilities. Our analysis, which was designed around an urban-rural comparison, focused on two types of health-care supply: general and maternal/child.
This section first focuses on general health care, which is mainly provided by puskesmas, and then moves on to maternal and child care, which is the principal activity of posyandu and traditional mid-wives (dukun). Our analysis is based on a total of 268 health facilities: 97 puskesmas, 76 traditional midwives, and 95 posyandu (table 2).
Table 2: Number of Health Facilities by Urban-Rural Areas
Urban Rural Total
Communities 39 60 98
Puskesmas 38 59 97
Traditional midwives 19 57 76
Posyandu 38 57 95
Total 95 173 268Source: Authors’ calculations based on IFLS East 2012.
General Health-Care Provision
Puskesmas provide most primary health services, including pre- and postnatal care, curative care, den-tistry, and laboratory services.
In order to give insights into the quality of health care provided by puskesmas, table 3 presents descrip-tive characteristics of the heads of the puskesmas. In urban areas, 68.4 percent of puskesmas heads are medical doctors, whereas in rural areas, a significant majority of puskesmas heads do not possess this medical qualification6. In line with these findings, we observed that 47 percent of the heads of urban puskesmas completed a bachelor’s degree (S1) and 26 percent completed a master’s degree (S2) and/or PhD (S3) as their highest level of education. In contrast, in rural areas, one-fourth of puskesmas heads completed high school or a paramedic school and only 3.3 percent completed S2 or S3. These first results hint at the presence of important qualitative differences between urban and rural areas in the provision of public health care.
6 In Indonesia, one can obtain the title of ‘medical doctor’ even with an S1 bachelor degree in Indonesia. After receiving the S1, a person must do some practical training on the ground, and after at least one year, the person receives the title of medical doctor, which therefore can be obtained without an S2 or S3 degree.
7
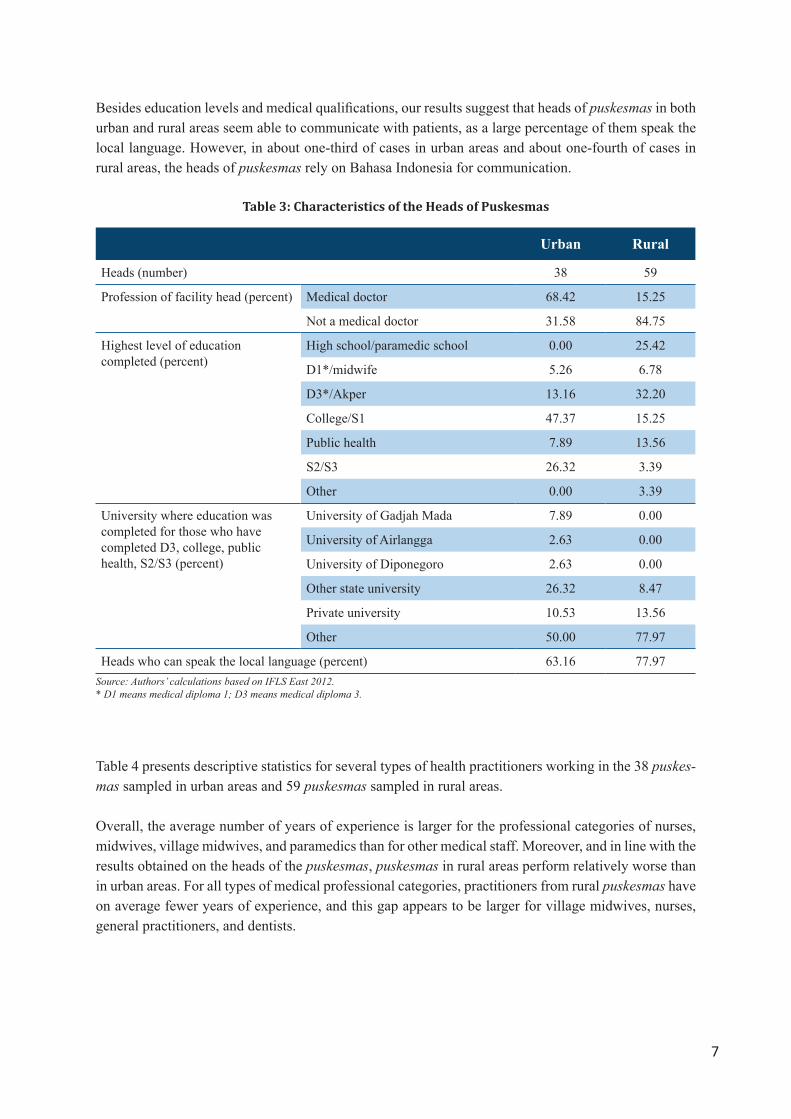
Besides education levels and medical qualifications, our results suggest that heads of puskesmas in both urban and rural areas seem able to communicate with patients, as a large percentage of them speak the local language. However, in about one-third of cases in urban areas and about one-fourth of cases in rural areas, the heads of puskesmas rely on Bahasa Indonesia for communication.
Table 3: Characteristics of the Heads of Puskesmas
Urban Rural
Heads (number) 38 59
Profession of facility head (percent) Medical doctor 68.42 15.25
Not a medical doctor 31.58 84.75
Highest level of education completed (percent)
High school/paramedic school 0.00 25.42
D1*/midwife 5.26 6.78
D3*/Akper 13.16 32.20
College/S1 47.37 15.25
Public health 7.89 13.56
S2/S3 26.32 3.39
Other 0.00 3.39
University where education was completed for those who have completed D3, college, public health, S2/S3 (percent)
University of Gadjah Mada 7.89 0.00
University of Airlangga 2.63 0.00
University of Diponegoro 2.63 0.00
Other state university 26.32 8.47
Private university 10.53 13.56
Other 50.00 77.97
Heads who can speak the local language (percent) 63.16 77.97Source: Authors’ calculations based on IFLS East 2012. * D1 means medical diploma 1; D3 means medical diploma 3.
Table 4 presents descriptive statistics for several types of health practitioners working in the 38 puskes-mas sampled in urban areas and 59 puskesmas sampled in rural areas.
Overall, the average number of years of experience is larger for the professional categories of nurses, midwives, village midwives, and paramedics than for other medical staff. Moreover, and in line with the results obtained on the heads of the puskesmas, puskesmas in rural areas perform relatively worse than in urban areas. For all types of medical professional categories, practitioners from rural puskesmas have on average fewer years of experience, and this gap appears to be larger for village midwives, nurses, general practitioners, and dentists.
8
Puskesmas in urban areas employ on average many more medical staff than puskesmas in rural areas, which is reflected in higher numbers of doctors, dentists, nurses, midwives, paramedics, and specialists, while puskesmas in rural areas seem to comprise a higher number of village midwives.7
Furthermore, table 4 depicts statistics on particular health services that each type of medical profession-al in a puskesmas performs. The data show that medical professionals in rural areas on average perform a wider range of different health services. For instance, a general practitioner in a rural area seems more likely to have worked on providing prenatal care and curative care for children, adults, and elderly compared to his/her urban counterpart. The interpretation of these findings is not straightforward. On the one hand, it is possible that rural puskesmas are relatively less available (low number of puskesmas per 1,000 people) or that they are simply understaffed (fewer medical professionals per 1,000 people) compared with urban puskesmas, and therefore need to deal with more patients. This might explain why medical staff in a rural puskesmas perform a larger variety of services. On the other hand, it may also imply that urban puskesmas have a larger pool of medical professionals and therefore allow their staff to specialise in certain services. In the latter case, the urban puskesmas do not necessarily deal with fewer patients per medical professional, but each medical professional is responsible for a narrower set of services.
Table 4: Care Provision in Puskesmas by Practitioner Type and Urban-Rural Areas
Source: Authors’ calculations based on IFLS East 2012.
7 This finding aligns with Rokx, Giles, Satriawan, Marzoeki, Harimurti, and Yavuz (2010), who used PODES data from 2006; this finding may find its rationale in the Bidan di Desa programme, which started in 1992 and was designed to place midwives in rural areas on a three-year contract, with the possibility of a three-year extension. The programme has contributed to the in-crease in the number of village midwives and delivered some positive maternal and child health outcomes in rural areas (Fran-kenberg and Thomas 2001). It has also improved the employment conditions of midwives, as it guaranteed several benefits to them: they were permitted to have a private practice, they received a considerable bonus if they worked in very remote areas, and after a three-to-six year contract, they could easily find career opportunities either in the private sector or in the district health offices under the so-called regional pegawai tidak tetap contracts. These contracts were issued by the Ministry of Health to hire recent medical school graduates as physicians for a three-year period. After this period, these practitioners were given the option to continue their studies, go into the private sector, or become civil servants.
9
Table 5 complements table 4 by looking at the average working hours of medical professionals at pusk-esmas. We observed that all categories of health practitioners tend to spend a similar number of hours working and providing services, however in rural areas, medical professionals work slightly longer hours than their urban counterparts.
Absenteeism rates are significantly higher in rural areas (25.99 percent) compared with urban areas (10.27 percent). This points to the conclusion that rural areas do not necessarily face a shortage of medical professionals, but simply that a much larger share of their medical staff is often absent from the puskesmas, which leads to a higher workload for the remaining staff. To some degree, the higher absen-teeism rate in rural areas is compensated for by the longer work hours of those medical professionals who are present in the puskesmas.8
Table 5: Practitioners’ Characteristics and Working Hours in Puskesmas by Urban-Rural Areas
Practitioners (number)
Hours Worked per Week (average number)
Hours Provide Services
per Week (average number)
Medical Staff Absent in Past
Week (percent)
Urban Rural Urban Rural Urban Rural Urban Rural
General practitioners 101 54 31.06 32.2 23.23 23.51 14.61 42.86
Specialists 2 0 36.00 24.00Source: Authors’ calculations based on IFLS East 2012.
Several other factors are likely contributors to higher absenteeism rates among the medical profession-als in rural puskesmas. As shown in table 6, medical professionals in urban puskesmas are more likely to be working under a government contract than on an honorarium basis. The share of medical profes-sionals that work on an honorarium basis in rural puskesmas is relatively high, which seems to suggest that the demand for health-care services is higher than what can be satisfied by the government-con-tracted medical professionals alone. This relatively high demand, compared with the limited supply of government-contracted medical professionals, might have given medical professionals working under
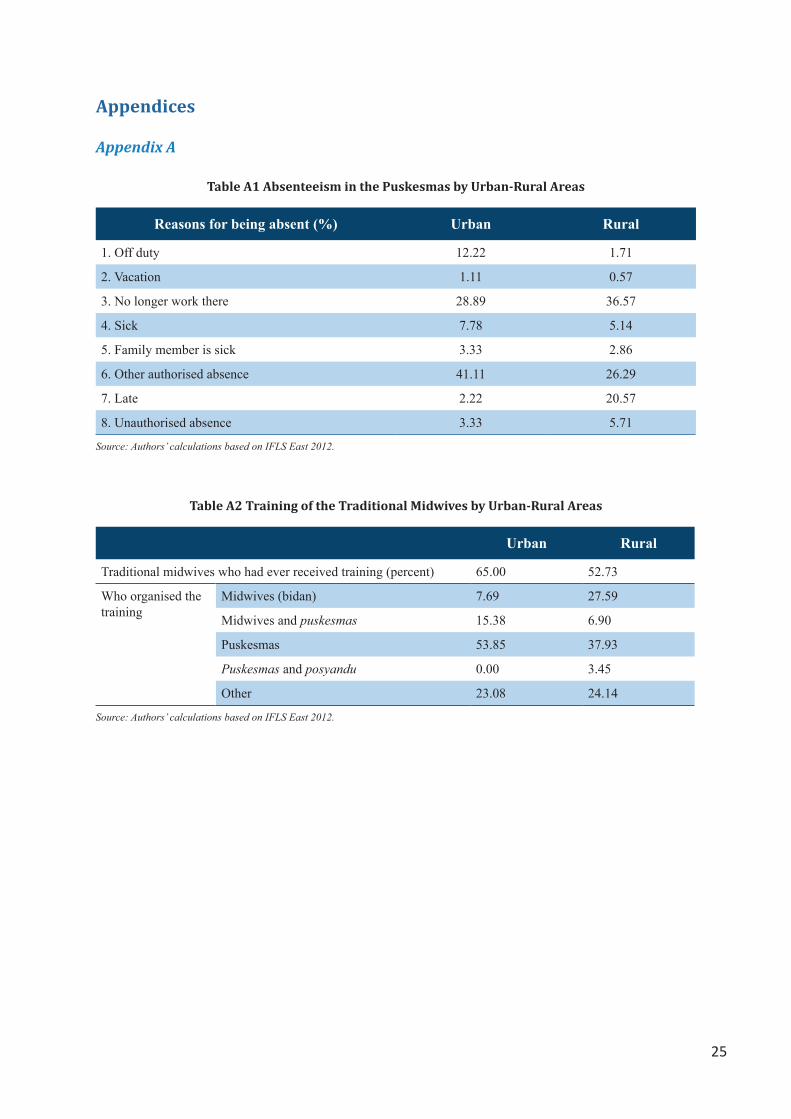
8 Table A1 in the appendix shows the major reasons for absenteeism of medical professionals from puskesmas. It seems that in many cases (one-third of all cases in rural areas), medical staff no longer work for the puskesmas although they are still formally registered as puskesmas staff.
10
government contracts an advantageous bargaining position, in that they can demand more freedom in working—in addition to their obligations for the puskesmas—as private health professionals or simply having more days off.9
The ratio of health professionals under government contracts to those working on an honorarium basis may also point to funding problems for rural puskesmas, which despite the existing demand for health-care services, might not be able to hire more health professionals under government contracts.
Table 6: Average Number of Government and Honoraria Employees per Puskesmas by Urban-Rural Location and by Working Time
Source: Authors’ calculations based on IFLS East 2012.
The quality of health-care provision by puskesmas in rural areas is not only diminished by the high absenteeism rates of its medical professionals but also by the quality of the physical equipment itself. As has been documented in several studies, the quality of public health facilities in Indonesia has often been under scrutiny for its relatively poor level compared with other countries in Southeast Asia such as Malaysia, Philippines, Thailand, and Vietnam (Rokx et al. 2010). Table 7 shows descriptive statistics of the infrastructural conditions in puskesmas. On average, rural puskesmas have fewer problems related
9 Public sector doctors, nurses and midwives in Indonesia can also practice in the private sector. The policy of allowing public employees to work as private providers was intended to create an incentive for physicians and midwives to stay longer in their duty posts. However, dual practice of public physicians reportedly impacts public sector access, efficiency, and overall health system and out-of-pocket costs (WHO, 2013).
11
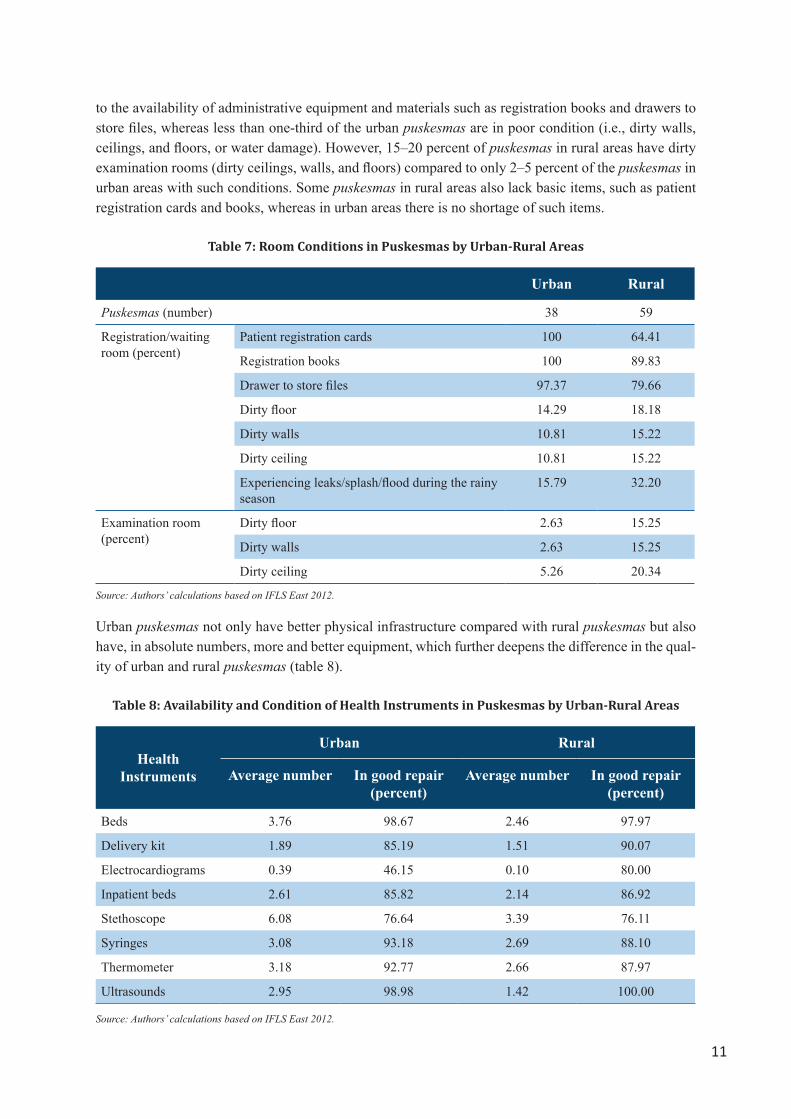
to the availability of administrative equipment and materials such as registration books and drawers to store files, whereas less than one-third of the urban puskesmas are in poor condition (i.e., dirty walls, ceilings, and floors, or water damage). However, 15–20 percent of puskesmas in rural areas have dirty examination rooms (dirty ceilings, walls, and floors) compared to only 2–5 percent of the puskesmas in urban areas with such conditions. Some puskesmas in rural areas also lack basic items, such as patient registration cards and books, whereas in urban areas there is no shortage of such items.
Table 7: Room Conditions in Puskesmas by Urban-Rural Areas
Urban Rural
Puskesmas (number) 38 59
Registration/waiting room (percent)
Patient registration cards 100 64.41
Registration books 100 89.83
Drawer to store files 97.37 79.66
Dirty floor 14.29 18.18
Dirty walls 10.81 15.22
Dirty ceiling 10.81 15.22
Experiencing leaks/splash/flood during the rainy season
15.79 32.20
Examination room (percent)
Dirty floor 2.63 15.25
Dirty walls 2.63 15.25
Dirty ceiling 5.26 20.34
Source: Authors’ calculations based on IFLS East 2012.
Urban puskesmas not only have better physical infrastructure compared with rural puskesmas but also have, in absolute numbers, more and better equipment, which further deepens the difference in the qual-ity of urban and rural puskesmas (table 8).
Table 8: Availability and Condition of Health Instruments in Puskesmas by Urban-Rural Areas
Health Instruments
Urban Rural
Average number In good repair (percent)
Average number In good repair (percent)
Beds 3.76 98.67 2.46 97.97
Delivery kit 1.89 85.19 1.51 90.07
Electrocardiograms 0.39 46.15 0.10 80.00
Inpatient beds 2.61 85.82 2.14 86.92
Stethoscope 6.08 76.64 3.39 76.11
Syringes 3.08 93.18 2.69 88.10
Thermometer 3.18 92.77 2.66 87.97
Ultrasounds 2.95 98.98 1.42 100.00
Source: Authors’ calculations based on IFLS East 2012.
12
Maternal and Child Health-Care Provision
Posyandu
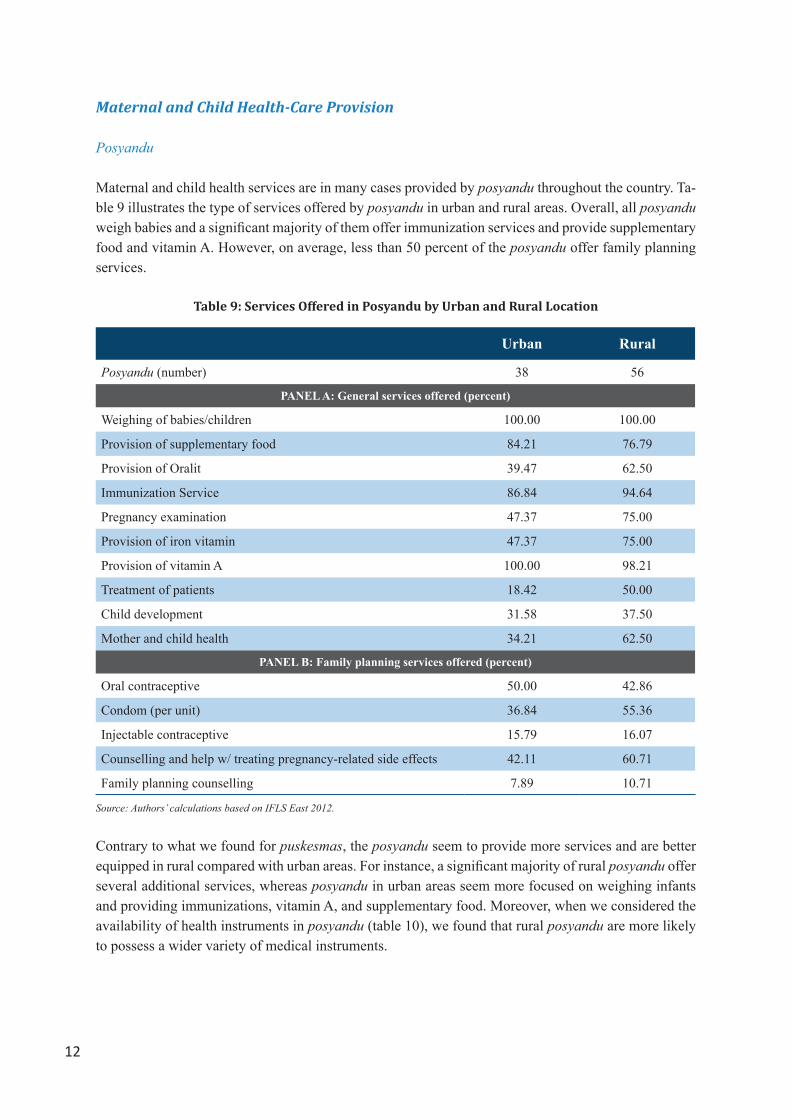
Maternal and child health services are in many cases provided by posyandu throughout the country. Ta-ble 9 illustrates the type of services offered by posyandu in urban and rural areas. Overall, all posyandu weigh babies and a significant majority of them offer immunization services and provide supplementary food and vitamin A. However, on average, less than 50 percent of the posyandu offer family planning services.
Table 9: Services Offered in Posyandu by Urban and Rural Location
Urban Rural
Posyandu (number) 38 56
PANEL A: General services offered (percent)
Weighing of babies/children 100.00 100.00
Provision of supplementary food 84.21 76.79
Provision of Oralit 39.47 62.50
Immunization Service 86.84 94.64
Pregnancy examination 47.37 75.00
Provision of iron vitamin 47.37 75.00
Provision of vitamin A 100.00 98.21
Treatment of patients 18.42 50.00
Child development 31.58 37.50
Mother and child health 34.21 62.50
PANEL B: Family planning services offered (percent)
Oral contraceptive 50.00 42.86
Condom (per unit) 36.84 55.36
Injectable contraceptive 15.79 16.07
Counselling and help w/ treating pregnancy-related side effects 42.11 60.71
Family planning counselling 7.89 10.71
Source: Authors’ calculations based on IFLS East 2012.
Contrary to what we found for puskesmas, the posyandu seem to provide more services and are better equipped in rural compared with urban areas. For instance, a significant majority of rural posyandu offer several additional services, whereas posyandu in urban areas seem more focused on weighing infants and providing immunizations, vitamin A, and supplementary food. Moreover, when we considered the availability of health instruments in posyandu (table 10), we found that rural posyandu are more likely to possess a wider variety of medical instruments.
13
Several reasons can be offered to explain these gaps between rural and urban posyandu: either demand for posyandu is much higher in rural than urban areas due to worse health conditions and higher birth rates, or it is purely a supply-side aspect, that is, national, district, and subdistrict health policy has strengthened urban puskesmas at the expense of urban posyandu.10
Table 10: Availability of Health Instruments at the Posyandu by Urban and Rural Areas
Urban Rural
Posyandu (number) 38 56
Health instruments (percent)
Baby scales 89.47 96.43
Height measuring devices 47.37 55.36
Oral contraceptive pills 10.53 19.64
Oralit 18.42 25.00
Iron tablets 5.26 19.64
Vitamin A 15.79 26.79
Paracetamol 5.26 21.43
Adult scale 63.16 60.71
Stethoscope 2.63 17.86
Thermometer 2.63 12.50
Source: Authors’ calculations based on IFLS East 2012.
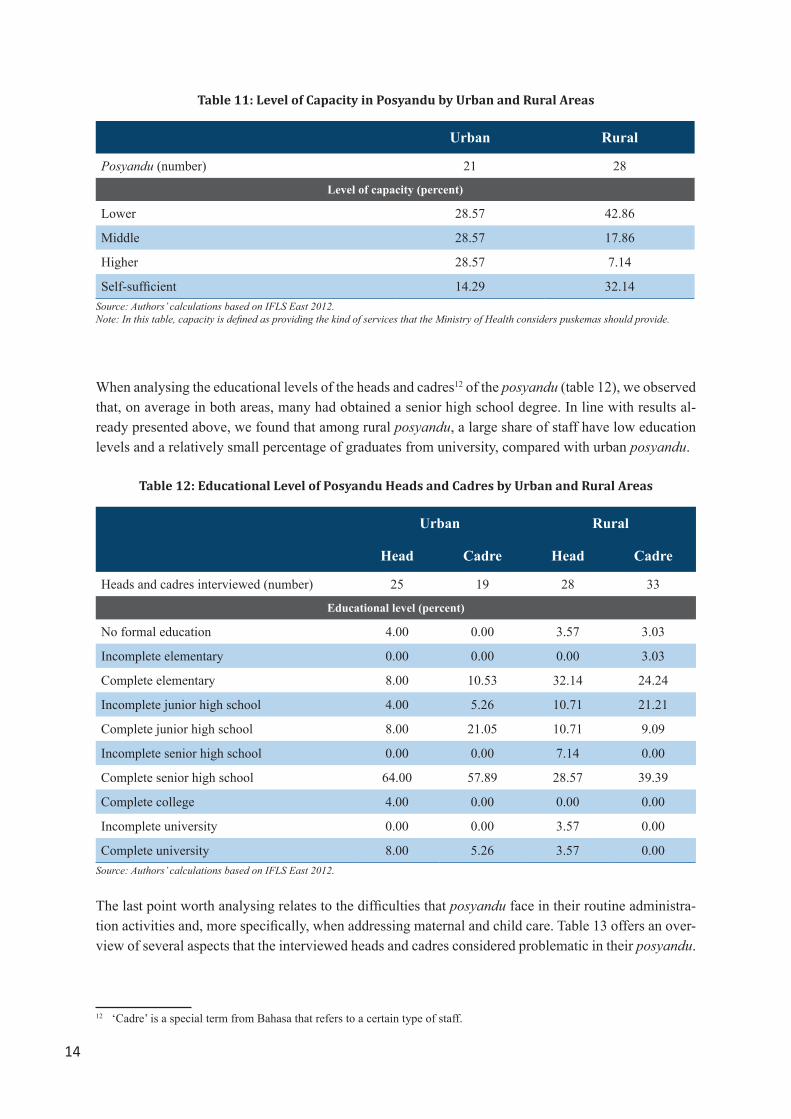
Although our main analysis rests on comparisons between rural and urban areas, it is important to highlight that a lot of variation in the availability and quality of posyandu exists within rural and urban areas (table 11). A large share of posyandu in rural areas ranked low in terms of their capacity11 (42.86 percent), while a relatively large share of posyandu ranked high (32.14 percent). Compared with urban areas, quality varies a great deal among rural posyandu.
10 The gap between urban and rural areas shrinks when considering several types of family planning services but it is worth noting in this case that, on average, less than half of the posyandu provide this type of service (table 9 Panel B). To what extent the provision of health services is driven by particular government programmes such as BOK or Jamkesmas is an important and interesting question. Unfortunately, the data doesn’t allow for such a more disaggregated analysis.11 For some areas, the MoH established only ‘lower-level capacity’ puskesmas, which means they will receive less funding, equipment, and staff for everything. However, they are also not expected to provide certain types of services.
14
Table 11: Level of Capacity in Posyandu by Urban and Rural Areas
Urban Rural
Posyandu (number) 21 28
Level of capacity (percent)
Lower 28.57 42.86
Middle 28.57 17.86
Higher 28.57 7.14
Self-sufficient 14.29 32.14Source: Authors’ calculations based on IFLS East 2012.Note: In this table, capacity is defined as providing the kind of services that the Ministry of Health considers puskemas should provide.
When analysing the educational levels of the heads and cadres12 of the posyandu (table 12), we observed that, on average in both areas, many had obtained a senior high school degree. In line with results al-ready presented above, we found that among rural posyandu, a large share of staff have low education levels and a relatively small percentage of graduates from university, compared with urban posyandu.
Table 12: Educational Level of Posyandu Heads and Cadres by Urban and Rural Areas
Urban Rural
Head Cadre Head Cadre
Heads and cadres interviewed (number) 25 19 28 33
Educational level (percent)
No formal education 4.00 0.00 3.57 3.03
Incomplete elementary 0.00 0.00 0.00 3.03
Complete elementary 8.00 10.53 32.14 24.24
Incomplete junior high school 4.00 5.26 10.71 21.21
Complete junior high school 8.00 21.05 10.71 9.09
Incomplete senior high school 0.00 0.00 7.14 0.00
Complete senior high school 64.00 57.89 28.57 39.39
Complete college 4.00 0.00 0.00 0.00
Incomplete university 0.00 0.00 3.57 0.00
Complete university 8.00 5.26 3.57 0.00Source: Authors’ calculations based on IFLS East 2012.
The last point worth analysing relates to the difficulties that posyandu face in their routine administra-tion activities and, more specifically, when addressing maternal and child care. Table 13 offers an over-view of several aspects that the interviewed heads and cadres considered problematic in their posyandu.
12 ‘Cadre’ is a special term from Bahasa that refers to a certain type of staff.
15
In general, posyandu located in rural areas face more problems than those in urban areas (table 13). The gap between the two areas seems large in relation to of lack of funds, medical supplies, and equipment, both in general terms (i.e., administration routines) and the supply of maternal and child care services. However, relatively fewer posyandu in rural compared with urban areas face a lack of interest/partici-pation by the community or are provided only a temporary (non-permanent) place. This finding, once again, may support the aforementioned argument of a possible larger demand for posyandu services in rural areas.
Table 13: Main Problems Faced by Posyandu
Urban Rural
Posyandu (number) 38 59
General problems (percent)
Lack of funds 44.74 59.32
Lack of medical supply 10.52 28.81
Lack of equipment 34.21 47.46
Lack of active cadres 18.42 18.64
Lack of support from puskesmas 7.89 8.47
Lack of support from village 2.63 11.86
No permanent place 18.42 16.95
Lack of interest/participation 26.32 11.86
No problem 21.05 6.78
Problems in maternal and child health
Lack of funds 18.42 40.68
Lack of medical supply 5.26 18.64
Lack of equipment 18.42 28.81
Lack of support from puskesmas 5.26 8.47
Lack of support from village 5.26 5.08
No permanent place 15.79 11.86
Lack of interest/participation 18.42 15.25
Lack of training for the cadres 5.26 28.81
No problem 36.84 20.34Source: Authors’ calculations based on IFLS East 2012.
16
Traditional Midwives
Another provider of maternal and child health-care services are traditional midwives (dukun). Table 14 shows that a significant majority of dukun in both urban and rural areas provide postnatal care for mothers and children in addition to delivery services. Only minor differences exist between urban and rural areas for most of the data in table 14, except for the level of fees, which is remarkably higher in urban areas.
Although traditional midwives might be more expensive in urban compared with rural areas, they also seem to provide somewhat better services in urban areas (on average, spending slightly more time with mothers and children) and possess better qualifications (measured in terms of the training which they receive).13
Table 14: Traditional Midwives: Services Offered by Urban-Rural Areas
Urban Rural
Traditional midwives (number) 20 55
Services offered
Delivery Charge for delivery (percent) 30 20
Fee for delivery (rupiahs) 206,250 118,333.3
Postnatal care for mothers
Provide postnatal care for mothers (percent) 90 87.27
Charge for mother care after delivery (percent) 16.67 6.25
Fee for mother care after delivery (rupiahs) 121,426.6 7,894.737
Days providing mother care (average number) 14.17 12.17
Postnatal care for babies
Provide postnatal care for babies (percent) 90 85.45
Charge for services (percent) 5.56 4.26
Fee for baby care after delivery (rupiahs) 121,428.6 7,894.737
Days providing baby care (average number) 16.11 12.96
Source: Authors’ calculations based on IFLS East 2012.
13 As suggested by the figures reported in table A2 in the appendix, employees in puskesmas in urban areas are more likely to engage in medical training, whereas in rural areas, almost one-third of traditional midwives receive training only from formally trained midwives.
17
4. Do Poorer Areas Have Lower Levels of Health-Care Provision?
Areas with a relatively large number of poor persons are less likely to obtain quality health-care ser-vices. As rural areas are on average poorer than urban areas, our analyses above have already provided evidence for this statement.
To further verify this conclusion, we re-analysed all tables by classifying all communities covered in the IFLS East 2012 into three distinct wealth categories based on average real per-capita expenditures of each community.
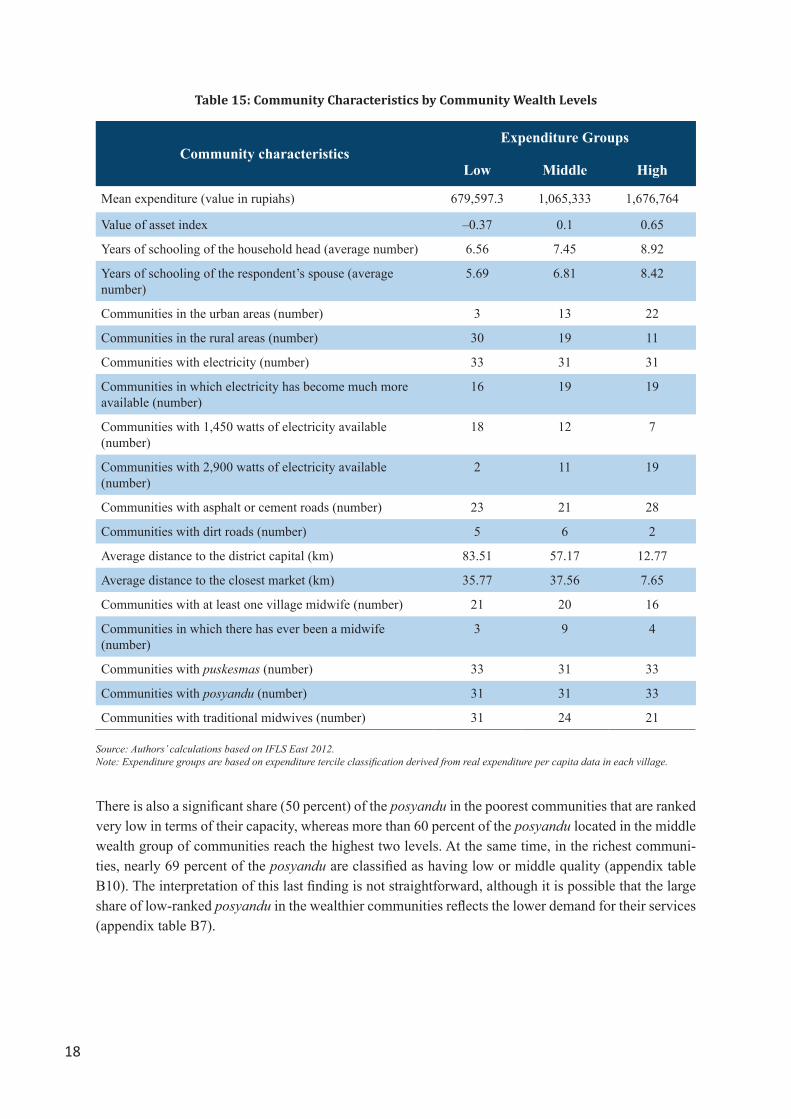
Table 15 shows the respective descriptive statistics. In line with our expectations, among the poorest communities (designated as a ‘low’ expenditure group in the table), the average education level is rel-atively low. Although little difference exists in terms of availability of electricity, richer communities have greater amounts of electrical power (in watts) than poorer communities. Furthermore, poorer com-munities tend to face more infrastructure problems; the quality of their roads is not good, and they are more distant from the district capital and the closest market.
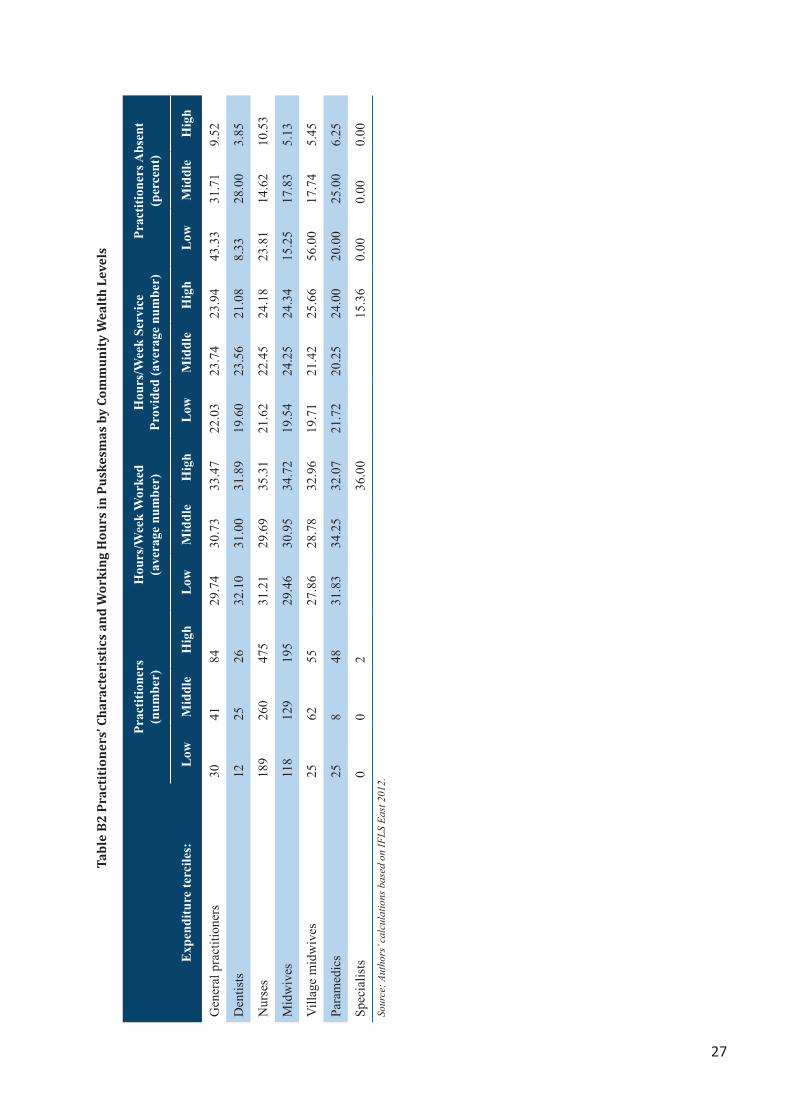
When one looks at the provision of health care given in puskesmas (appendix table B1), the pattern across the three wealth categories is analogous to the one that emerged in the urban-rural comparison in section III above: poorer communities tend to have fewer practitioners than richer communities, but their medical professionals on average perform a larger set of different health services.
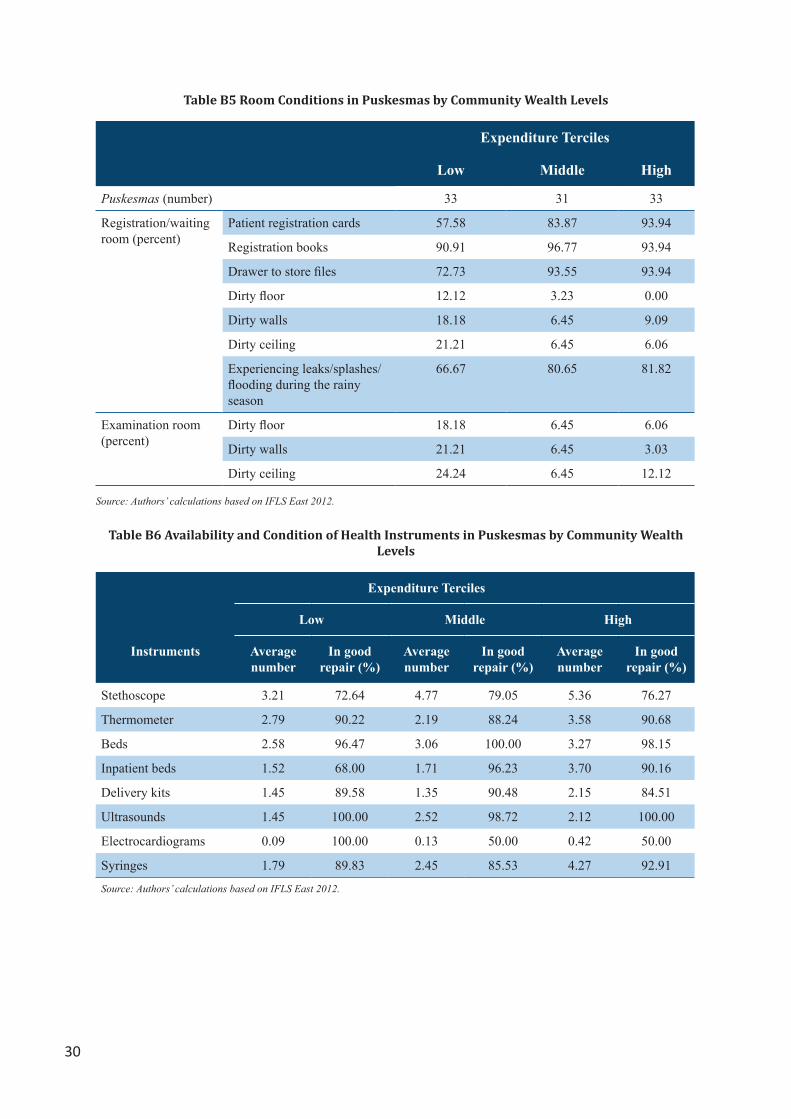
Poor communities also lag behind in the qualitative indicators of health facilities, as on average, the practitioners who are employed there tend to have fewer years of experience (appendix table B2), the facilities themselves function under a worse physical infrastructure (appendix table B5), and have less equipment available (appendix table B6). Furthermore, absenteeism appears to be significantly higher among the poorest communities (appendix table B3), whereas in the richest communities, the absen-teeism rate is just above 9 percent; this rate rises to 27 percent for puskesmas employees in the poorest communities.
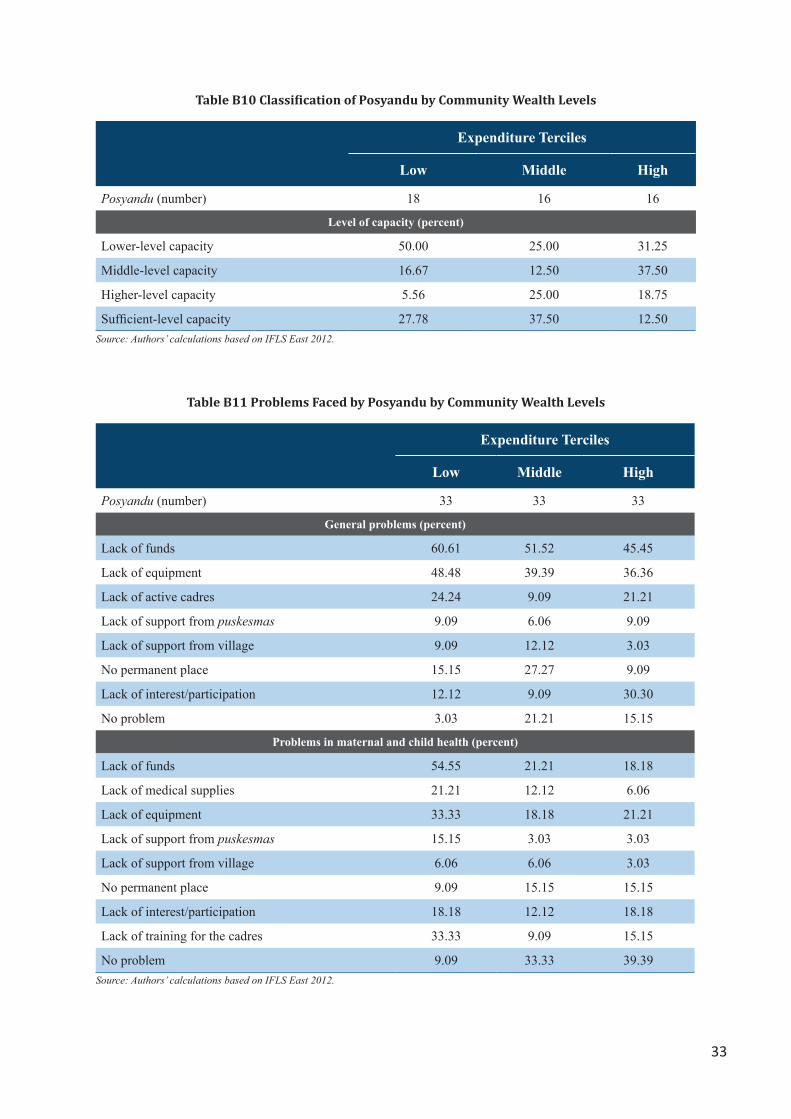
The posyandu supply of maternal and child health-care services appears in many aspects to be relatively larger among poorer communities, especially in terms of immunization services, pregnancy examina-tion, provision of iron tablets, treatment of patients, and condom delivery (appendix table B7). How-ever, posyandu located in the poorer communities tend to face relatively more problems with funds, medical supplies, and equipment, the latter of which in most cases appears to be insufficient for their daily needs (appendix table B11).
18
Table 15: Community Characteristics by Community Wealth Levels
Community characteristicsExpenditure Groups
Low Middle High
Mean expenditure (value in rupiahs) 679,597.3 1,065,333 1,676,764
Value of asset index –0.37 0.1 0.65
Years of schooling of the household head (average number) 6.56 7.45 8.92
Years of schooling of the respondent’s spouse (average number)
5.69 6.81 8.42
Communities in the urban areas (number) 3 13 22
Communities in the rural areas (number) 30 19 11
Communities with electricity (number) 33 31 31
Communities in which electricity has become much more available (number)
16 19 19
Communities with 1,450 watts of electricity available (number)
18 12 7
Communities with 2,900 watts of electricity available (number)
2 11 19
Communities with asphalt or cement roads (number) 23 21 28
Communities with dirt roads (number) 5 6 2
Average distance to the district capital (km) 83.51 57.17 12.77
Average distance to the closest market (km) 35.77 37.56 7.65
Communities with at least one village midwife (number) 21 20 16
Communities in which there has ever been a midwife (number)
3 9 4
Communities with puskesmas (number) 33 31 33
Communities with posyandu (number) 31 31 33
Communities with traditional midwives (number) 31 24 21
Source: Authors’ calculations based on IFLS East 2012.Note: Expenditure groups are based on expenditure tercile classification derived from real expenditure per capita data in each village.
There is also a significant share (50 percent) of the posyandu in the poorest communities that are ranked very low in terms of their capacity, whereas more than 60 percent of the posyandu located in the middle wealth group of communities reach the highest two levels. At the same time, in the richest communi-ties, nearly 69 percent of the posyandu are classified as having low or middle quality (appendix table B10). The interpretation of this last finding is not straightforward, although it is possible that the large share of low-ranked posyandu in the wealthier communities reflects the lower demand for their services (appendix table B7).
19
5. Financial Resources of the Puskesmas
The IFLS East 2012 collected information on the funding sources for each of the sampled puskesmas. As shown in table 16, both urban and rural puskesmas rely to a large extent on funds from the Health Operational Assistance (Bantuan Operasional Kesehatan or BOK) programme; a somewhat larger share of urban puskesmas receive BOK, usually of higher value (in rupiahs) than rural puskesmas. In gen-eral, urban puskesmas receive more funds than rural puskesmas approved by the Dinas Kesehatan. In addition to receiving district funds, national funds play a major role in financing puskesmas activities. Assistance from the central government and payments received from Jamkesmas account for about 40 percent of the budget of urban puskesmas and nearly 80 percent of the budget of rural puskesmas.
Table 16: Financial Resources of Puskesmas by Urban-Rural Areas
Urban Rural
Puskesmas/pustu that have received BOK funds (percent) 97.37 81.35
Budget derived from BOK for the past year’s budget (rupiahs) 180,000,000 112,000,000
Budget derived from BOK for the current year’s budget (rupiahs) 183,000,000 132,000,000
Puskesmas/pustu that recently finished budget year 2011 (percent) 97.37 89.83
Puskesmas/pustu that recently finished budget year 2011–12 (percent) 2.63 10.17
Puskesmas that did not send budget proposal to local government (Dinas Kesehatan) for the past budget year (percent)
68.42 67.80
Puskesmas that sent specific budget proposal to local government (Dinas Kesehatan) for the past budget year (percent)
31.58 32.20
Budget proposed by puskesmas to local government (Dinas Kesehatan) for the past budget year (rupiahs)
445,000,000 206,000,000
Budget of the puskesmas for the last budget year (rupiahs) 410,000,000 232,000,000
Percentage of the budget comprising:
Assistance from regional government 44.39 22.28
Assistance from central government 21.05 43.97
Claim from Jamkesmas/Jamkesda 19.68 35.47
Patients 4.85 1.89
Askes 7.32 3.05
Other assistance 0.31 0.17
Puskesmas that did not receive any revenue/patient target from Dinas Kesehatan for past budget year (percent)
80.56 71.79
Puskesmas that received both a revenue and a patient target from Dinas Kesehatan for past budget year (percent)
19.44 28.21
Target of revenue from patients set by local government (Dinas Kesehatan) (rupiahs)
23,100,000 15,100,000
Source: Authors’ calculations based on IFLS East 2012.Note: Information was provided by head of the puskesmas.
20
5. Conclusion
Despite improvements in the supply of health care in Indonesia in the past several decades, the demand for quality health care has not yet been sufficiently met. Furthermore, the supply of health care has not occurred at the same speed across the country; health-care access for the poor and for people residing in rural areas is substantially lower compared with richer and urban areas. The undersupply of health-care services has contributed to Indonesia’s mixed performance on a variety of health outcomes, while the cost of health care in Indonesia is rather high compared with other Asian countries.
This paper examines the availability and quality of public health facilities in Eastern Indonesia, a region that is well known to lag behind the rest of Indonesia in terms of high poverty rates, low levels of infra-structure, and often worse health outcomes. Despite health provision being highly important to Eastern Indonesia, little is known and documented about it in this region. Drawing on a new data set—the IFLS East 2012—this paper contributes to and generates knowledge about the public health-care system in Eastern Indonesia.
Our findings suggest that public health-care provision plays a much larger role in Eastern Indonesia than in other parts of the country. However, despite its crucial role in Eastern Indonesia, public health-care provision suffers from a variety of shortcomings. Focusing on puskesmas and posyandu, our analysis reveals that many health facilities face significant constraints in terms of the availability (understaffing and absenteeism) and quality (education degrees and medical training) of medical doctors and medical staff. The results suggest that many public health facilities work under poor physical infrastructure and a limited supply of medical equipment and medication.
Furthermore, our findings reveal strong differences between urban and rural public health-care pro-vision. Regarding puskesmas, we found that rural puskesmas are more likely to operate with a small number of medical staff, show higher absenteeism rates, and face more limitations in terms of infra-structure, medical equipment, and medication. With rural puskesmas on average receiving significantly less funding than urban puskesmas, the results can be partly attributed to the financial allocation for rural puskesmas. Rural puskesmas, in addition, seem to employ a comparatively larger share of medical staff that works on an honorarium basis, a fact that points to further differences between rural and urban puskesmas. Although urban puskesmas seem better endowed than rural puskesmas, we did not find that the same results hold for the posyandu. On the contrary, we observed that rural posyandu are better sup-plied with medical equipment and medications than urban posyandu, which might imply that national and district health policies are setting very different priorities on which type of public health facility and which health services should be provided to urban and rural populations. In line with the urban-rural comparison, we observed similar differences among village wealth levels; poor villages show relatively worse health service provision in puskesmas and relatively better service provision in posyandu.
As a last step, we analysed funding for puskesmas. The data show that both urban and rural puskesmas rely heavily on BOK programme, district, and provincial government funds. Likewise, a substantial amount of Puskesmas financing is received from Jamkesmas. Although public funds received from the national government play a dominant role, they are particularly important for the functioning of rural puskesmas, which receive about 80 percent of their finances from national allocations (including Jam-kesmas).
21
Overall, the results suggest significant scope for further improving public health-care services in East-ern Indonesia. Given the strong reliance of people in Eastern Indonesia on access to public health-care facilities (in contrast to Western Indonesia, where people rely relatively more on health services of private providers), it seems necessary for the Government of Indonesia to pay particular attention to the problems of public health-care provision in Eastern Indonesia.
22
References
Bappenas. 2009. Pembangunan Kesehatan dan Gizi di Indonesia: Overview dan Arah ke Depan: Back-ground Study RPJMN 2010–2014 (Health and Nutritional Development in Indonesia: An Overview and Future Directions: Background Study RPJMN 2010–2014). Jakarta, Indonesia.
Barber, S. L., P. J. Gertler, and P. Harimurti. 2007. ‘Differences in Access to High-Quality Outpatient Care in Indonesia.’ Health Affairs 26 (3): 352–66.
Barrera, A. 1990. ‘The Role of Maternal Schooling and Its Interaction with Public Health Programs in Child Health Production Function.’ Journal of Development Economics 32(1): 69–91.
BPS (Statistics Indonesia). 2008. Indonesia Demographic and Health Survey 2007: Preliminary Re-port. Jakarta, Indonesia: Statistics Indonesia, National Population and Family Planning Board, Ministry of Health, and Macro International.
Frankenberg, E., and D. Thomas. 2001. ‘Women’s Health and Pregnancy Outcomes: Do Services Make a Difference?’ Demography 38(2): 253–65.
Glewwe, P. 1999. ‘Why Does Mother’s Schooling Raise Child Health in Developing Countries? Evi-dence from Morocco.’ Journal of Human Resources 34(1): 124–59.
Kristiansen, S., and P. Santoso. 2006. ‘Surviving Decentralization? Impacts of Regional Autonomy on Health Service Provision in Indonesia’. Health Policy 77(3): 247–59.
MoH (Ministry of Health). 1994. Pedoman Pembinaan Teknis Bidan Di Desa. Directorate General of Community Health. Jakarta, Indonesia.
MoH (Ministry of Health). 2014. Riset Kesehatan Dasar: Riskesdas 2013. Jakarta, Indonesia.
Mosley, W. H., and L. Chen. 1984. ‘An Analytical Framework for the Study of Child Survival in De-veloping Countries. Child Survival: Strategies for Research.’ Population and Development Review 10 (Supplement): 25–48.
Pradhan, M., F. Saadah, and R. Sparrow. 2007. ‘Did the Health Card Programme Ensure Access to Medical Care for the Poor during Indonesia’s Economic Crisis?’ World Bank Economic Review 21(1): 125–50.
Priebe, J., F. Howell, and P. Pankowska. 2014. ‘Determinants of Access to Social Assistance Pro-grammes in Eastern Indonesia: Empirical Evidence from the IFLS East 2012’. TNP2K Working Paper 11b-2014. Jakarta, Indonesia: Tim Nasional Percepatan Penanggulangan Kemiskinan (TNP2K).
Roemling, C., and M. Qaim. 2012. ‘Obesity Trends and Determinants in Indonesia.’ Appetite 58(3): 1005–13.
23
Roemling, C., and M. Qaim. 2013. ‘Dual Burden Households and Intra-Household Nutritional Inequal-ity in Indonesia.’ Economics and Human Biology 11(4): 563–73.
Rokx, C., J. Giles, E. Satriawan, P. Marzoeki, P. Harimurti, and E. Yavuz. 2010. New Insights into the Provision of Health Services in Indonesia: A Health Workforce Study. Directions in Development: Hu-man Development, number 53883. Washington, DC: World Bank.
Satriawan, E., J. Priebe, R. A. Prima, and F. Howell. 2014. ‘An Introduction to the Indonesia Family Life Survey (IFLS) East 2012: Sampling, Questionnaires, Maps, and Socioeconomic Background’. TNP2K Working Paper 11a-2014. Jakarta, Indonesia: Tim Nasional Percepatan Penanggulangan Ke- miskinan (TNP2K).
Sparrow, R., A. Suryahadi, and W. Widyanti. 2010. ‘Social Health Insurance for the Poor: Targeting and Impact of Indonesia’s Askeskin Program.’ Working Paper (May). Jakarta, Indonesia: SMERU Research Institute.
Strauss, J. 1990. ‘Households, Communities, and Preschool Children’s Nutrition Outcomes: Evidence from Rural Cote d’Ivoire.’ Economic Development and Cultural Change 38(2): 231–61.
WHO (World Health Organization). 2013. ‘Appendix 10 - Indonesia case study.’ In: Mid-level health workers for delivery of essential health services: a global systematic review and country experiences. Geneva: World Health Organization.
World Bank. 2013. ‘Adjusting to Pressures’. Indonesia Economic Quarterly (July). Jakarta, Indonesia.
Yavuz, E., and C. Rokx. 2008. Investing in Indonesia’s Health: Challenges and Opportunities for Fu-ture Public Spending. Health Public Expenditure Review 2008. Washington, DC: World Bank.
25
Appendices
Appendix A
Table A1 Absenteeism in the Puskesmas by Urban-Rural Areas
Reasons for being absent (%) Urban Rural
1. Off duty 12.22 1.71
2. Vacation 1.11 0.57
3. No longer work there 28.89 36.57
4. Sick 7.78 5.14
5. Family member is sick 3.33 2.86
6. Other authorised absence 41.11 26.29
7. Late 2.22 20.57
8. Unauthorised absence 3.33 5.71
Source: Authors’ calculations based on IFLS East 2012.
Table A2 Training of the Traditional Midwives by Urban-Rural Areas
Urban Rural
Traditional midwives who had ever received training (percent) 65.00 52.73
Who organised the training
Midwives (bidan) 7.69 27.59
Midwives and puskesmas 15.38 6.90
Puskesmas 53.85 37.93
Puskesmas and posyandu 0.00 3.45
Other 23.08 24.14
Source: Authors’ calculations based on IFLS East 2012.
26
Appe
ndix
B
Tabl
e B1
Car
e Pr
ovis
ion
in P
uske
smas
by
Type
of P
ract
itio
ner
and
by C
omm
unit
y W
ealt
h Le
vels
Prac
titio
ners
(n
umbe
r)E
xper
ienc
e (a
vera
ge n
umbe
r of
ye
ars)
Prov
idin
g Pr
e-N
atal
C
are
(per
cent
)Pr
ovid
e C
urat
ive
Car
e fo
r C
hild
ren
(per
cent
)Pr
ovid
e C
urat
ive
Car
e fo
r Adu
lts (p
erce
nt)
Prov
ide
Car
e fo
r E
lder
ly (p
erce
nt)
Exp
endi
ture
te
rcile
s:L
owM
idH
igh
Low
Mid
Hig
hL
owM
idH
igh
Low
Mid
Hig
hL
owM
idH
igh
Low
Mid
Hig
h
Gen
eral
pr
actit
ione
rs30
4184
1.41
2.43
4.43
60.0
026
.83
48.8
110
0.00
95.1
285
.71
100.
0095
.12
94.0
596
.67
92.6
785
.71
Den
tists
1225
261.
153.
316.
260.
000.
000.
0075
.00
92.0
084
.62
75.0
092
.00
88.4
675
.00
92.0
076
.92
Nur
ses
189
260
475
6.00
6.22
7.44
20.1
116
.54
12.8
496
.83
86.1
574
.32
96.8
389
.23
91.3
791
.53
73.8
580
.42
Mid
wiv
es11
812
919
55.
905.
557.
6994
.92
96.1
290
.26
55.0
863
.57
79.4
970
.34
55.8
152
.31
72.0
338
.76
37.4
4
Vill
age
mid
wiv
es25
6255
3.25
4.13
8.56
100.
0010
0.00
100.
0084
.00
93.5
590
.91
84.0
091
.94
49.0
984
.00
64.5
234
.55
Para
med
ics
258
488.
653.
837.
5940
.00
12.5
06.
2568
.00
62.5
062
.50
56.0
075
.00
43.7
560
.00
62.5
035
.42
Spec
ialis
ts0
02
2.00
0.00
0.00
50.0
00.
000.
0050
.00
0.00
0.00
100.
000.
000.
0010
0.00
Sour
ce: A
utho
rs’ c
alcu
latio
ns b
ased
on
IFLS
Eas
t 201
2.N
ote:
Num
bers
may
not
add
up
due
to ro
undi
ng e
rror
s.
27
Tabl
e B2
Pra
ctit
ione
rs’ C
hara
cter
isti
cs a
nd W
orki
ng H
ours
in P
uske
smas
by
Com
mun
ity
Wea
lth
Leve
ls
Prac
titio
ners
(n
umbe
r)H
ours
/Wee
k W
orke
d (a
vera
ge n
umbe
r)H
ours
/Wee
k Se
rvic
e Pr
ovid
ed (a
vera
ge n
umbe
r)Pr
actit
ione
rs A
bsen
t (p
erce
nt)
Exp
endi
ture
terc
iles:
Low
Mid
dle
Hig
hL
owM
iddl
eH
igh
Low
Mid
dle
Hig
hL
owM
iddl
eH
igh
Gen
eral
pra
ctiti
oner
s30
4184
29.7
430
.73
33.4
722
.03
23.7
423
.94
43.3
331
.71
9.52
Den
tists
1225
2632
.10
31.0
031
.89
19.6
023
.56
21.0
88.
3328
.00
3.85
Nur
ses
189
260
475
31.2
129
.69
35.3
121
.62
22.4
524
.18
23.8
114
.62
10.5
3
Mid
wiv
es11
812
919
529
.46
30.9
534
.72
19.5
424
.25
24.3
415
.25
17.8
35.
13
Vill
age
mid
wiv
es25
6255
27.8
628
.78
32.9
619
.71
21.4
225
.66
56.0
017
.74
5.45
Para
med
ics
258
4831
.83
34.2
532
.07
21.7
220
.25
24.0
020
.00
25.0
06.
25
Spec
ialis
ts0
02
36.0
015
.36
0.00
0.00
0.00
Sour
ce: A
utho
rs’ c
alcu
latio
ns b
ased
on
IFLS
Eas
t 201
2.
28
Table B3 Absenteeism in Puskesmas by Community Wealth Levels
Expenditure Terciles
Low Middle High
Absent (percent) 26.97 19.11 9.32
Absent (number) 96 94 75
Total employees (number) 356 492 805
Reasons for being absent (percent)
1. Off duty 1.04 0.00 17.33
2. Vacation 1.04 1.06 0.00
3. No longer work there 19.79 56.38 24.00
4. Sick 5.21 4.26 9.33
5. Family member is sick 3.13 4.26 1.33
6. Other authorised absence 30.21 24.47 41.33
7. Late 33.33 3.19 4.00
8. Unauthorised absence 5.21 6.38 2.67 Source: Authors’ calculations based on IFLS East 2012.
29
Tabl
e B4
Ave
rage
Num
bers
of G
over
nmen
t and
Hon
orar
ia E
mpl
oyee
s in
Pus
kesm
as b
y W
orki
ng T
ime
and
by C
omm
unit
y W
ealt
h Le
vels
Prac
titio
ners
Exp
endi
ture
Ter
cile
s
Low
Mid
dle
Hig
h
Gov
ernm
ent
Em
ploy
ees
Hon
orar
ia
Em
ploy
ees
Gov
ernm
ent
Em
ploy
ees
Hon
orar
ia
Em
ploy
ees
Gov
ernm
ent
Em
ploy
ees
Hon
orar
ia
Em
ploy
ees
Full
Tim
ePa
rt
Tim
eFu
ll Ti
me
Part
Ti
me
Full
Tim
ePa
rt
Tim
eFu
ll Ti
me
Part
Ti
me
Full
Tim
ePa
rt
Tim
eFu
ll Ti
me
Part
Ti
me
Gen
eral
pra
ctiti
oner
s0.
520.
030.
970.
004.
640.
03
Den
tists
0.21
0.00
0.55
0.10
0.76
0.03
Nur
ses
5.03
0.00
1.50
0.00
6.58
0.19
2.04
0.04
12.6
70.
002.
350.
00
Mid
wiv
es2.
360.
031.
200.
003.
480.
030.
690.
005.
150.
001.
100.
00
Vill
age
mid
wiv
es (
bida
n de
sa)
0.94
0.00
0.90
0.00
0.65
0.19
2.42
0.00
1.33
0.00
0.48
0.00
Para
med
ics
2.12
0.00
1.50
0.00
1.77
0.00
0.69
0.00
4.36
0.00
0.61
0.00
Obs
tetri
cian
s/gy
naec
olog
ist
0.00
0.00
0.00
0.00
0.00
0.00
Spec
ialis
ts o
n el
derly
0.00
0.00
0.00
0.00
0.00
0.00
Publ
ic h
ealth
wor
kers
0.52
0.00
0.87
0.00
2.30
0.00
Paed
iatri
cian
s0.
000.
000.
000.
000.
000.
00
Ass
ista
nt n
utrit
ion
expe
rts0.
360.
000.
290.
000.
910.
00
Hea
lth w
orke
rs0.
360.
000.
520.
031.
520.
00
Adm
inis
trativ
e em
ploy
ees
0.55
0.00
1.20
0.00
1.29
0.03
1.00
0.04
2.18
0.00
0.90
0.00
Oth
er st
aff
0.18
0.00
0.10
0.00
0.61
0.00
0.12
0.00
1.09
1.21
0.13
0.00
Sour
ce: A
utho
rs’ c
alcu
latio
ns b
ased
on
IFLS
Eas
t 201
2.
30
Table B5 Room Conditions in Puskesmas by Community Wealth Levels
Expenditure Terciles
Low Middle High
Puskesmas (number) 33 31 33
Registration/waiting room (percent)
Patient registration cards 57.58 83.87 93.94
Registration books 90.91 96.77 93.94
Drawer to store files 72.73 93.55 93.94
Dirty floor 12.12 3.23 0.00
Dirty walls 18.18 6.45 9.09
Dirty ceiling 21.21 6.45 6.06
Experiencing leaks/splashes/flooding during the rainy season
66.67 80.65 81.82
Examination room (percent)
Dirty floor 18.18 6.45 6.06
Dirty walls 21.21 6.45 3.03
Dirty ceiling 24.24 6.45 12.12
Source: Authors’ calculations based on IFLS East 2012.
Table B6 Availability and Condition of Health Instruments in Puskesmas by Community Wealth Levels
Incomplete junior high school 12.50 15.79 10.00 8.33 0.00 19.05
Complete junior high school 6.25 10.53 15.00 25.00 5.56 9.52
Incomplete senior high school 12.50 0.00 0.00 0.00 0.00 0.00
Complete senior high school 31.25 47.37 30.00 41.67 72.22 47.62
Complete college 0.00 0.00 0.00 0.00 5.56 0.00
Incomplete university 0.00 0.00 0.00 0.00 5.56 0.00
Complete university 6.25 0.00 10.00 0.00 0.00 4.76Source: Authors’ calculations based on IFLS East 2012.
33
Table B10 Classification of Posyandu by Community Wealth Levels
Expenditure Terciles
Low Middle High
Posyandu (number) 18 16 16
Level of capacity (percent)
Lower-level capacity 50.00 25.00 31.25
Middle-level capacity 16.67 12.50 37.50
Higher-level capacity 5.56 25.00 18.75
Sufficient-level capacity 27.78 37.50 12.50Source: Authors’ calculations based on IFLS East 2012.
Table B11 Problems Faced by Posyandu by Community Wealth Levels
Expenditure Terciles
Low Middle High
Posyandu (number) 33 33 33
General problems (percent)
Lack of funds 60.61 51.52 45.45
Lack of equipment 48.48 39.39 36.36
Lack of active cadres 24.24 9.09 21.21
Lack of support from puskesmas 9.09 6.06 9.09
Lack of support from village 9.09 12.12 3.03
No permanent place 15.15 27.27 9.09
Lack of interest/participation 12.12 9.09 30.30
No problem 3.03 21.21 15.15
Problems in maternal and child health (percent)
Lack of funds 54.55 21.21 18.18
Lack of medical supplies 21.21 12.12 6.06
Lack of equipment 33.33 18.18 21.21
Lack of support from puskesmas 15.15 3.03 3.03
Lack of support from village 6.06 6.06 3.03
No permanent place 9.09 15.15 15.15
Lack of interest/participation 18.18 12.12 18.18
Lack of training for the cadres 33.33 9.09 15.15
No problem 9.09 33.33 39.39Source: Authors’ calculations based on IFLS East 2012.
34
Table B12 Traditional Midwives: Service Offered and Training Received by Community Wealth Levels
Expenditure Terciles
Low Middle High
Traditional midwives (number) 31 24 21
Services offered
Delivery Charge for delivery (percent) 25.81 16.67 23.81
Fee for delivery (rupiahs) 90,769.2 175,000.0 221,428.6
Postnatal care for mothers
Provide postnatal care for mothers (percent)
83.87 91.67 90.48
Charge for mother care after delivery (percent)
7.69 4.55 15.79
Fee for mother care after delivery (rupiahs)
11,538.5 22,222.2 130,000.0
Days providing mother care (average number)
14.8 9.0 14
Postnatal care for babies
Provide postnatal care for babies (percent)
80.65 87.50 95.24
Charge for postnatal care for babies (percent)
4 0 10
Fee for babies care after delivery (rupiahs)
0 0 6,250
Days providing baby care (average number)
16.8 7.8 16.4
Training of midwives
Midwives who ever received training (percent) 41.94 66.67 61.90
Who organised the training
Midwives (bidan) 30.77 25.00 7.69
Midwives and puskesmas 0.00 12.50 15.38
Puskesmas 38.46 43.75 46.15
Puskesmas and posyandu 0.00 6.25 0.00
Other 30.77 12.50 30.77
Source: Authors’ calculations based on IFLS East 2012.
SEKRETARIATTIM NASIONAL PERCEPATAN PENANGGULANGAN KEMISKINAN
Grand Kebon Sirih Lt. 4Jl. Kebon Sirih Raya No. 35 Jakarta Pusat 10110, IndonesiaTelp : 021 - 3912 812Faks : 021 - 3912 511Website : www.tnp2k.go.id
Little is known about public health-care supply in Eastern Indonesia, a region that shows worse health outcomes than the rest of the country. Drawing on a new dataset (IFLS East 2012), this paper examines the availability and quality of public health-care facilities (puskesmas and posyandu) in Eastern Indonesia.
Our findings suggest that public health-care supply plays a larger and more important role in Eastern Indonesia compared with Western Indonesia. However, this stronger reliance and dependence on public health-care provision has not necessarily resulted in quality health-care supply. Although sig-nificant improvements have been achieved over time, we found that many puskesmas and posyan-du could benefit from more and better-trained staff (education, training, availability, absenteeism) and better physical endowment (infrastructure, medical equipment, and medications). The results further suggest that remarkable differences in the provision of health care exist between urban and rural areas; urban areas have on average better-equipped puskesmas, whereas rural areas seem to have better-equipped posyandu. Furthermore, we found that direct funds from the central level (central government funds and Jamkesmas), despite the decentralization process, play a major role in financing the operations of public health facilities. In rural Eastern Indonesia, these central-level funds constitute about 80 percent of the total operational budget of a puskesmas.
TIM NASIONAL PERCEPATAN PENANGGULANGAN KEMISKINAN(TNP2K)