This article appeared in a journal published by Elsevier. The attached copy is furnished to the author for internal non-commercial research and education use, including for instruction at the authors institution and sharing with colleagues. Other uses, including reproduction and distribution, or selling or licensing copies, or posting to personal, institutional or third party websites are prohibited. In most cases authors are permitted to post their version of the article (e.g. in Word or Tex form) to their personal website or institutional repository. Authors requiring further information regarding Elsevier’s archiving and manuscript policies are encouraged to visit: http://www.elsevier.com/copyright
Transcript
This article appeared in a journal published by Elsevier. The attachedcopy is furnished to the author for internal non-commercial researchand education use, including for instruction at the authors institution
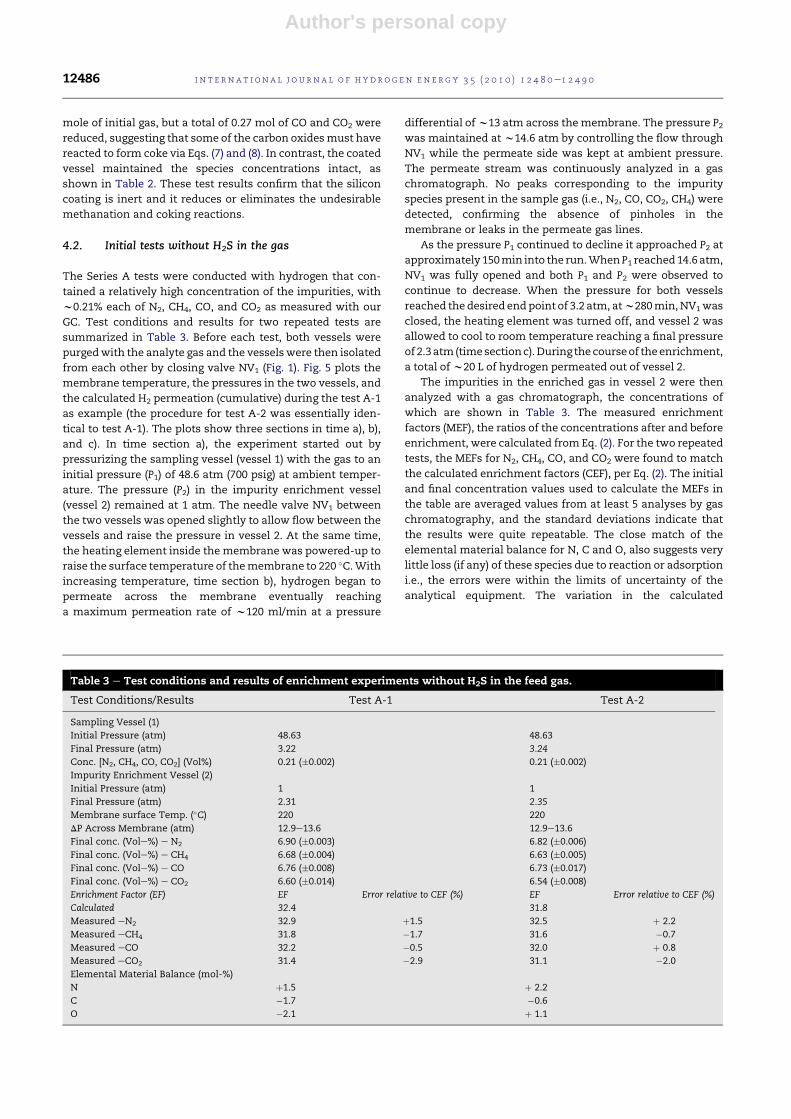
and sharing with colleagues.
Other uses, including reproduction and distribution, or selling orlicensing copies, or posting to personal, institutional or third party
websites are prohibited.
In most cases authors are permitted to post their version of thearticle (e.g. in Word or Tex form) to their personal website orinstitutional repository. Authors requiring further information
regarding Elsevier’s archiving and manuscript policies areencouraged to visit:
Analysis of trace impurities in hydrogen: Enrichmentof impurities using a H2 selective permeation membrane5
Shabbir Ahmed, Sheldon H.D. Lee, Dionissios D. Papadias*
Argonne National Laboratory, Chemical Sciences and Engineering Division, 9700 S. Cass Avenue, Lemont, IL 60439, USA
a r t i c l e i n f o
Article history:
Received 28 June 2010
Received in revised form
11 August 2010
Accepted 11 August 2010
Available online 15 September 2010
Keywords:
Hydrogen quality
Trace contaminants
Analytical methods
Impurity enrichment
Dense metal membrane
a b s t r a c t
A laboratory-scale gas sampling and impurity enrichment device (GSIED) using a Pd/Cu-
coated PdeAg alloy hydrogen selective permeation membrane has been designed, fabri-
cated, and tested to show that such a device provides an effective method to enrich trace
impurity species in hydrogen by factors of 10e100 or greater. The enrichment process will
allow analysis of these impurities in hydrogen using simpler and less expensive analytical
instruments that can be deployed in the fields. A series of experiments was conducted with
the device using a hydrogen analyte gas containing N2, CH4, and CO2 at w0.1% each, CO at
w100 ppm, and H2S at w2 ppm. Chemical analyses of the impurity-enriched sample
showed that for the non-sulfur species, the measured enrichment factors were 14.5e14.9,
which closely matched the calculated enrichment factors of 14.8e14.9. The elemental
material balances indicated a good accounting of the non-sulfur impurity species. For the
sulfur species, some initial sulfur loss was observed, presumably due to interaction with
the surfaces and/or analytical deficiencies. The impurity enrichment factors for such
sampling devices are functions of the sampler size, and the sample vessel pressures before
and after enrichment. Depending on the volume of the enriched sample needed for
analysis, the device can be designed to enrich the impurities in hydrogen by more than
a factor of two orders of magnitude for practical and economical field applications.
ª 2010 Professor T. Nejat Veziroglu. Published by Elsevier Ltd. All rights reserved.
1. Introduction
Fuel cell and other hydrogen fueled vehicles are slated for
commercial deployment in the US and around the world in the
near future. A number of demonstration hydrogen refueling
centershavebeen setuparound theUS. Several teamsof vehicle
manufacturers and fuel suppliers have worked with state and
federal governments and other organizations to demonstrate
hydrogen refueling centers [1e3], where the hydrogen is
dispensed into thevehicle’stanksatuptow680atm(10,000psig).
Since fuel cells are very sensitive to certain impurities, such as
carbon monoxide, hydrogen sulfide, and ammonia, the fuel
supplier must ensure that the concentrations of such species in
the dispensed hydrogen are within acceptable limits.
Several organizations, such as ISO and SAE International,
are working to establish allowable impurity levels in fuel H2
Abbreviations and acronyms: ASTM, American Society for Testing and Materials; CEF, calculated enrichment factor; EF, enrichmentfactor; ISO, International Organization for Standardization; MEF, measured enrichment factor; SAE, Society of Automotive Engineers;GSIED, gas sampling and impurity enrichment device.5 The U.S. Government retains for itself, and others acting on its behalf, a paid-up, nonexclusive, irrevocable worldwide license in saidarticle to reproduce, prepare derivative works, distribute copies to the public and perform publicly and display publicly, by or on behalfof the Government.* Corresponding author. Tel.: þ1 630 252 3206.E-mail address: [email protected] (D.D. Papadias).
Avai lab le at www.sc iencedi rect .com
journa l homepage : www.e lsev ie r . com/ loca te /he
i n t e rn a t i o n a l j o u r n a l o f h y d r o g e n en e r g y 3 5 ( 2 0 1 0 ) 1 2 4 8 0e1 2 4 9 0
0360-3199/$ e see front matter ª 2010 Professor T. Nejat Veziroglu. Published by Elsevier Ltd. All rights reserved.doi:10.1016/j.ijhydene.2010.08.042
Author's personal copy
for fuel cell powered vehicles. The guideline values for some
of the key impurities proposed in the SAE International’s
Surface Vehicle Information Report are shown in Table 1 [4].
The table shows that the limits on CO, NH3 and sulfur are
extremely low and are at or even below the detection limits of
standardized analytical methods. Organizations such as the
ASTM1 are developing new standardized methods for the
analysis of impurities in hydrogen for fuel cells.
The current practice at demonstration hydrogen refueling
stations is to take grab samples periodically and send the
samples to specialty laboratories for analysis using state-of-
the-art instruments, such as, for example, a gas chromato-
graph fitted with a pulse discharged helium ionization
detector (GC/PDHID) to analyze for carbon monoxide at
concentrations of 0.2 parts per million or lower, or a gas
chromatograph fitted with a sulfur chemiluminescence
detector (GC/SCD) to analyze for total sulfur species. These
sensitive instruments are expensive, and they require
considerable laboratory time of skilled analytical chemists to
operate and maintain them.
With the larger deployment of fuel cell vehicles and the
anticipated growth in the refueling infrastructure in the years
ahead, the refueling stationsmay be required to conductmore
frequent and rapid analysis and/or monitoring of the key
impurity species, using simpler and inexpensive technologies.
The device described here uses a novel impurity enrichment
technique to allow the sample to be analyzed with simpler
and less expensive analytical instruments. This paper
describes this developmental device and presents test results
demonstrating the feasibility of this concept.
2. Theoretical
2.1. The concept
A hydrogen selective metal membrane is at the core of this
impurity enrichment method. Membranes made of metal-
alloys, being extremely permeable to hydrogen but essentially
impermeable to other gases, have been extensively studied
and used for hydrogen purification [5e10]. The central func-
tion of hydrogen selective membranes is the presence of
a metal surface that dissociates and reassociates hydrogen
molecules and transports atomic hydrogen through the bulk
of the metal through a pressure gradient [6,7,10]. Hydrogen,
being extremely soluble in metals such as Pd, is separated
with high selectivity since the dense metal lattice prohibits
the passage of other species (i.e. CO, CO2, N2).
The impurity enrichment is achieved by removing the
hydrogen from the gas sample through a hydrogen selective
membrane leaving the concentrated impurities in the
enrichment vessel. Fig. 1 shows a schematic of the gas
sampling and impurity enrichment device (GSIED). The device
consists of two separately connected vesselse a high pressure
rated sampling vessel and a lower pressure rated impurity
enrichment vessel housing the hydrogen membrane. The
GSIED will be connected to the nozzle of the dispensing
stations, and after the requisite purging, collect the gas in the
high pressure sampling vessel (vessel 1). The device will then
be disconnected from the nozzle and taken to the laboratory
for the “enrichment process”. This process, which is described
in more detail in the next section, will consist of allowing
the gas from the high pressure vessel to slowly flow into
a lower pressure vessel housing the H2-transport membrane
(vessel 2). With hydrogen permeation, the pressure in the
sampling vessel will decrease and when it reaches a low
enough pressure, the flow between the two chambers will be
stopped and the membrane will be cooled to stop the
hydrogen permeation. Knowing the volumes (V1, V2) and the
initial and final pressures of the respective vessels, it is
possible to calculate the factor by which the concentration of
the non-hydrogen species has been enriched.
Table 1 e SAE suggested guideline values for someimpurities in hydrogen for fuel cell vehicles.
Impuritya Concentration (ppmv)
Helium 300
Nitrogen (N2) þ Argon (Ar) 100
Total Hydrocarbons e C1 Basis (HC) 2
Carbon Dioxide (CO2) 2
Carbon Monoxide (CO) 0.2
Ammonia (NH3) 0.1
Sulfur (S as H2S, COS, etc) 0.004
a Hydrogen, minimum purity ¼ 99.97%. Impurities excluding
helium, must be <100 ppmv.
Notation
C concentration, mol/m3
K membrane permeability constant, mol/s, Pa0.5
_n molar flow-rate, mol/s
n molar mass, mol
P pressure, Pa
R specific gas constant, J/(mol K)
T temperature, K
V volume, m3
y molar fraction, e
Z compressibility factor, e
Sub- and superscripts
0 inlet properties, analyte gas
1 sampling vessel
2 impurity enrichment vessel
i impurity species
I total amount of impurity species
T total amount of gas
amb ambient
hi high
lo low
1 For example, ASTM’s D03 Work Item Nos. 4548, 6527, 8150,6624, and 9211 are investigating the analysis of non-hydrogenconstituents in hydrogen.
i n t e r n a t i o n a l j o u r n a l o f h y d r o g e n en e r g y 3 5 ( 2 0 1 0 ) 1 2 4 8 0e1 2 4 9 0 12481
Author's personal copy
2.2. Enrichment process and calculated enrichmentfactor (CEF)
Let us consider the enrichment process inmore detail with the
aid of Fig. 2, showing theGSIEDduring the enrichmentprocess.
Initially, step 0), the sampling vessel (vessel 1) and the impurity
enrichment vessel (vessel 2) are purged at ambient conditions
with the analyte gas containing hydrogen and trace amount of
impurity species (i). The two vessels are isolated, and analyte
gas is sampled at high pressure in the sampling vessel. Step a)
defines the initial state of the gas mixture in the vessels after
sampling. The total gas sample (nT) is contained in the
sampling vessel at ahighpressure (Phi, i.e. 6000psig,w410atm)
and at ambient pressure (Pamb) in the impurity enrichment
vessel e analyte gas that remained after the initial purge.
Instepb) theenrichmentof the trace impurities inhydrogen
begins. The gas is allowed to slowly flow from the sampling
vessel to the impurity enrichment vessel. As the temperature
of the membrane (T2) and pressure (P2) in the enrichment
vessel increases, hydrogen starts to permeate out through the
membrane (at ambient pressure) enriching the concentration
of the impurities in that vessel. The hydrogen permeation rate
is a function of temperature and hydrogen pressure difference
across the membrane. In most cases, at temperatures above
200 �C and for relatively thick membranes (>w5 mm), the
hydrogen flux is limited by the diffusion of hydrogen atoms
through the metal membrane [6e8,10]. The hydrogen flux in
such instances isdescribedbySievert’s law,and isproportional
to the difference between the square roots of the hydrogen
pressures on the two sides of the membrane [6]. Although
a higher pressure differential will increase the hydrogen flux
across the membrane and shorten the enrichment time, the
allowable pressure in the impurity enrichment vessel (P2) will
be limited by the thickness and structural integrity of the
membrane. As long as the pressure in the sampling vessel (P1)
Fig. 1 e Schematic of the gas sampling and impurity enrichment device (GSIED).
Fig. 2 e Steps of the sampling vessel (vessel 1) and impurity enrichment vessel (vessel 2) of the GSIED during the enrichment
process. 0) Purge of the GSIED with analyte gas at ambient conditions, a) sample loading at high pressure (Phi) and ambient
temperature, b) H2 permeation at elevated temperature in vessel 2, c) Cooling to ambient temperature and gas analysis at
low pressure (Plo).
i n t e rn a t i o n a l j o u r n a l o f h y d r o g e n en e r g y 3 5 ( 2 0 1 0 ) 1 2 4 8 0e1 2 4 9 012482
Author's personal copy
is higher than the pressure in the impurity enrichment vessel
(P2), the flow of gas from the sampling vessel needs to be
adjusted to match the hydrogen permeation rate. Alterna-
tively, the impurity enrichment vessel canbeperiodically filled
with gas to P2 by opening and closing a valve connecting the
two vessels. With time, as hydrogen leaves the system, the
pressure in both vessels will be equal and approach ambient
pressure. At low enough pressures, the flow between the two
vessels is stopped and the membrane is cooled to ambient
temperature, step c). At that point, the pressure in the enrich-
ment vessel (Plo) will be somewhat lower than the pressure in
the sampling vessel (P1) due to the cooling process.
With hydrogen being the only species that permeates
across the membrane, the total amount of impurities in the
vessels during the initial sampling step (a) and final step (c)
remain the same,
yð0ÞI � nðaÞ
T ¼ yðcÞ2;I � nðcÞ
2 þ yð0ÞI � nðcÞ
1 (1)
and the enrichment factor, the molar fraction ratio of the
enriched impurities to the impurities in the original gas,
follows from Eq. (1),
CEF ¼ yðcÞ2;I
yð0ÞI
¼�nðaÞT � nðcÞ
1
�nðcÞ2
¼
Phi � V1
ZðaÞ1 � R� Tamb
þ Pamb � V2
R� Tamb
!� PðcÞ
1 � V1
ZðcÞ1 � R� Tamb
Plo � V2
ZðcÞ2 � R� Tamb
(2)
The enrichment factor, which is illustrated in Fig. 3, is
a function of the sample pressure, final pressure and the
volume of the respective vessels. It shows that if the sample
gas is collected at a dispensing pressure of the refueling
station of 410 atm (w6000 psig), then a calculated enrichment
factor as high as two orders of magnitude is easily achievable
when the final pressure (Plo) is reduced to 3 atm. It is notable
that a reduction of the final pressure by half or doubling the
vessel volume ratio leads to a near doubling of the enrichment
factor. The calculated results2 shown in Fig. 3 are based on the
PengeRobinson equation of state [11], however, assuming
ideal gas behavior and extending PðcÞ1 , this relationship is
understood and can be appreciated by simplifying Eq. (2) as,
CEFz
�Phi
Plo� V1
V2
�þ�Pamb
Plo
���
T2
Tamb� V1
V2
�(3)
Recognizingthat thefirst terminEq. (3) is theratioof themolar
mass in the sampling vessel at initial high sample loading
pressure to themolarmass in the impurity enrichment vessel at
a lowerpressure, this termisat least an orderofmagnitudegreater
than 1, while the second and third terms are either slightly less
than, or of the order of 1, respectively. Consequently, the
enrichment factor is approximated to the ratio of the initial
moles of gas in vessel 1 to the final moles of gas in vessel 2.
Further, for identical vessel volumes (V1 ¼ V2), the enrichment
ratio reduces to the initial (high) to final (low) pressure ratio.
2.3. Concept challenges
To complete the enrichment within a reasonable time, it is
necessary to raise the temperature of the membrane to ach-
ieve fast permeation. Elevated temperatures, however, raise
the prospect of chemical reactions between the various
species, such as methanation (CO þ 3H2 4 CH4 þ H2O), water
gas shift reaction (CO þ H2O 4 CO2 þ H2) and Boudouard
reaction (2CO 4 CO2 þ C), etc. Metal surfaces are known to
catalyze many of these and other reactions. Considering that
the impurity concentrations in the analyte gas are at trace
levels, any reaction will lead to errors or variations between
the calculated and measured enrichment factors. Similarly,
the adsorption of species (e.g., sulfur species) on the interior
walls of the hardware can also lead to variations between the
measured and calculated enrichment factors.
The strategy for effective and predictable enrichment will
depend on the ability to reduce these effects. This is achiev-
able through a combination of (a) ensuring all wetted surfaces
are inert or resistant to the adsorption of species such as
sulfur, carbon monoxide, etc., (b) reducing the kinetics of the
undesired reactions by lowering the temperature or the
pressure of the enrichment chamber. Since lower tempera-
ture and/or pressure will reduce the hydrogen flux, this may
require increasing the surface area of the membrane or
allowing more time for the hydrogen permeation.
3. Experimental
3.1. Gas sampling and impurity enrichment device(GSIED)
Fig. 1 shows the schematic of the gas sampling device that was
tested to demonstrate the concept and Fig. 4 shows a photo-
graph of the hardware apparatus. The membrane sampling
Fig. 3 e Calculated enrichment factor as function of the
sampling and the impurity enrichment vessel pressures.
Equation of state: PengeRobinson [11].
2 For a high pressure process like this, the gas compressibility(Z) deviates from the ideal gas law and needs to be factored in tocalculate the actual moles of gas being processed. Since theconcentration of non-hydrogen species is very low, thecompressibility of the gas can be approximated as for purehydrogen.
i n t e r n a t i o n a l j o u r n a l o f h y d r o g e n en e r g y 3 5 ( 2 0 1 0 ) 1 2 4 8 0e1 2 4 9 0 12483
Author's personal copy
device consists of a 500 cm3 sampling vessel (vessel 1) that is
Final conc. (Vole%) e N2 6.90 (�0.003) 6.82 (�0.006)
Final conc. (Vole%) e CH4 6.68 (�0.004) 6.63 (�0.005)
Final conc. (Vole%) e CO 6.76 (�0.008) 6.73 (�0.017)
Final conc. (Vole%) e CO2 6.60 (�0.014) 6.54 (�0.008)
Enrichment Factor (EF) EF Error relative to CEF (%) EF Error relative to CEF (%)
Calculated 32.4 31.8
Measured eN2 32.9 þ1.5 32.5 þ 2.2
Measured eCH4 31.8 �1.7 31.6 �0.7
Measured eCO 32.2 �0.5 32.0 þ 0.8
Measured eCO2 31.4 �2.9 31.1 �2.0
Elemental Material Balance (mol-%)
N þ1.5 þ 2.2
C �1.7 �0.6
O �2.1 þ 1.1
i n t e rn a t i o n a l j o u r n a l o f h y d r o g e n en e r g y 3 5 ( 2 0 1 0 ) 1 2 4 8 0e1 2 4 9 012486
Author's personal copy
enrichment factors (32.4 and 31.8) between the two tests is
due to the variability in the final pressures of the vessels.
Controlling the process manually required considerable
care to ensure the same set-points as it affects the tempera-
ture and pressure history. The manual process involved
adjusting a variac to maintain the membrane temperature,
and NV1 to maintain P2 at w14.6 atm.
4.3. Tests with hydrogen containing H2S
One of the key impurities of concern in hydrogen for fuel cell
vehicles is sulfur. The SAE guideline value (Table 1) for sulfur
is 4 parts per billion (ppb). Such low concentrations being the
driver for the development of this enrichment device, the next
set of tests were conducted with hydrogen containing sulfur.
The trace species in this gas included CO2, CH4, and N2 at
w1000 ppm each, CO at w100 ppm, and H2S at w2.2 ppm (see
Section 3.3). These valueswere selected to be low enough to be
considered “trace” yet high enough to be clearly quantifiable
with our existing gas chromatograph and the lead-acetate
detector.
Tests with the sulfur-containing gas (series B) started with
an initial sampling vessel pressure (P1) of 55.4 atm (800 psig)
and the same test conditions as those described in the
previous section (membrane tube temperature of 220 �C and
differential pressure of w13 atm across the membrane). The
presence of sulfur reduced the membrane’s permeation rate
quite sharply to w13 ml/min, as compared to w120 ml/min
observed in the tests without sulfur. This decrease in the
hydrogen permeation rate indicates deactivation of the Pd/
Cu-coated PdeAg alloy membrane by sulfur, possibly due to
co-adsorbed H2S and/or the formation of Pd and Cu sulfides,
which would significantly reduce the hydrogen flux of the
membrane [15].
By raising the membrane temperature, it was possible to
partially recover the hydrogen flux. This effect of membrane
temperature is shown in Fig. 6, where the cumulative
permeation of hydrogen is compared at different tempera-
tures. During the initial test (B-1) the membrane surface
temperature was raised from 220 �C to 250 �C after 4 h into the
run. The change in temperature affected the slope of the
cumulative hydrogen permeation as the permeation rate
increased from w13 ml/min to w40 ml/min. A second exper-
iment (B-2) was conductedwith the sulfur-containing gaswith
the membrane at 270 �C. The higher temperature accelerated
the permeation still further, tow65e70ml/min. Evenwith this
much higher membrane temperature, however, the presence
of sulfur in the hydrogen extended the experiment time to
nearly 6 h.
Table 4 summarizes the test conditions and analytical
results for the tests with H2S in the feed gas (B-1 and B-2). The
calculated enrichment factor of 14.9e15.0 was lower than the
w32 in the previous tests without sulfur because we stopped
this series of tests at a much higher final pressure than the
previous tests (Table 3) so that more enriched gas sample
would be available for sulfur analysis. Our analytical
Fig. 5 e Plots of membrane temperature, pressure in both vessels and calculated rate (cumulative) of hydrogen permeation
during the course of experiment A-1.
i n t e r n a t i o n a l j o u r n a l o f h y d r o g e n en e r g y 3 5 ( 2 0 1 0 ) 1 2 4 8 0e1 2 4 9 0 12487
Author's personal copy
instrument to measure sulfur (lead-acetate tape method)
required approximately 1e2 L of gas per analysis as opposed
to a fewmL of gas for GC-analysis. As in the previous tests, the
measured enrichment factors (MEFs) for all non-sulfur species
(N2, CH4, CO, and CO2) matched well with the calculated
enrichment factor (CEF). Again, the close match of the
elemental material balance for the non-sulfur species also
suggests very little loss of these species due to reaction or
adsorption, even at the membrane temperature of 270 �C.However, the measured enrichment factor for H2S in the first
test (B-1) was only 6.8, which was 55% lower than the calcu-
lated enrichment factor. After the second test, the enrichment
factor for H2S improved relative to the calculated enrichment
factor, but therewas still a 17% loss of the sulfur species. Since
all the vessels, valves, and connecting tubes in the sampling
device have been passivated with silicon coating, it is
reasonable to believe that the observed loss of sulfur was due
to the interaction of sulfur with the membrane tube.
If the chemical interactions between sulfur and the
membrane tube are, indeed, the reason for the observed loss
of sulfur, it is also reasonable to expect that the membrane
tube will be gradually saturated by sulfur as more tests are
conducted, and the loss of sulfur should gradually decrease
and, eventually, stop. To investigate this hypothesis, a few
more tests (B-3, 4, 5) were conducted under the same oper-
ating conditions as test B-2 (see Table 4). Fig. 7 summarizes the
enrichment factors for all consecutive tests with H2S in the
feed gas (series B, 1e5). For the sulfur species, Fig. 7 shows that
the MEFs increased with each successive test, reaching w14
and leveling off after the third test (B-3). TheMEFs for the non-
sulfur species are again observed to match reasonably well
with the CEF of 14.9e15.Within the limits of experimental and
analytical errors, the analyses were quite repeatable for the
non-sulfur species.
It should be noted that the certified sulfur content in the
hydrogen gas is 2.17 ppm, but our H2S analyzer (based on
Fig. 6 e Effect of sulfur and membrane temperature on the
permeation of hydrogen.
Table 4 e Test conditions and results of enrichment experiments with H2S in the feed gas.
Test Conditions/Results Test B-1 Test B-2
Sampling Vessel (1)
Initial Pressure (atm) 55.4 55.4
Final Pressure (atm) 7.22 7.72
Conc. (ppm) e N2 1010 (�45) 1010 (�45)
Conc. (ppm) e CH4 1060 (�13) 1060 (�13)
Conc. (ppm) e CO 98 (�0.1) 98 (�0.1)
Conc. (ppm) e CO2 1037 (�1) 1037 (�1)
Conc. (ppm) e H2S 2.27 (�0.1) 2.27 (�0.1)
Impurity Enrichment Vessel (2)
Initial Pressure (atm) 1 1
Final Pressure (atm) 5.26 5.23
Membrane surface Temp. (�C) 220e250 270
DP Across Membrane (atm) 12.9e13.6 12.9e13.6
Final conc. (ppm) e N2 15920 (�80) 15560 (�30)
Final conc. (ppm) e CH4 15350 (�20) 15100 (�10)
Final conc. (ppm) e CO 1420 (�40) 1410 (�30)
Final conc. (ppm) e CO2 15300 (�40) 15020 (�20)
Final conc. (ppm) e H2S 15.38 28.22
Enrichment Factor (EF) EF Error relative to CEF (%) EF Error relative to CEF (%)
Calculated 15.0 14.9
Measured e N2 15.8 þ5.2 15.4 þ3.3
Measured e CH4 14.5 �3.4 14.2 �4.4
Measured e CO 14.5 �3.3 14.4 e 3.5
Measured e CO2 14.8 �1.5 14.5 �2.8
Measured e H2S 6.8 �54.8 12.4 �16.6
Elemental Material Balance (mol-%)
N þ5.2 þ3.3
C �2.5 �3.7
O �1.6 �2.9
S �54.8 �16.6
i n t e rn a t i o n a l j o u r n a l o f h y d r o g e n en e r g y 3 5 ( 2 0 1 0 ) 1 2 4 8 0e1 2 4 9 012488
Author's personal copy
lead-acetate sulfur sensing tapemethod) measured the H2S in
the feed gas to 2.27 ppm with a 5% margin of error. This
analytical error may explain some of the observed sulfur loss
in these tests. However, effects of themembrane temperature
and the level of sulfur concentration on the extent of the
sulfur uptake by the membrane tube and the possible reverse
release of sulfur from the membrane tube are still not known,
and more studies are needed to obtain a better understanding
about these sulfur issues. The understanding of the sulfur loss
mechanism, whether reacted or adsorbed on the membrane
or any other surface is critical in order to develop appropriate
solutions and test protocols.
4.4. Potential for field applications
The laboratory-scale sampling device reported in this paper
can be further customized by appropriately packaging the
vessels, piping, and the components to reduce the overall
physical size of the device, and by maximizing the impurity
enrichment factor through proper sizing of the two vessels.
Theoretically speaking the enrichment process depends
only on the starting and end-points (pressure, temperature).
In practice, controlling the temperature by adjusting a knob is
difficult to reproduce at every experiment. Changes in the
temperature/pressure history can change the extent of the
side reactions, even if they are relatively small. Similarly,
controlling the pressures to within 1 psig with a back-pressure
regulator was found to be quite difficult in the laboratory, and
thus automation should help repeat the starting and end-
points better than can be achieved by human interface. A
computer-driven automation of all control procedure steps to
optimize its operation is desirable since it will achieve more
repeatable control of the operational procedures, improve the
analytical repeatability and reduce the total operation time.
Through well designed customization and automation, this
sampling device can effectively generate impurity-enriched
samples that can be analyzed by simpler and less expensive
analytical techniques and equipments. Since the enrichment
of this sampling device is a function of the sampler size and
pressures in the chambers before and after enrichment, it can
be easily tailored to achieve greater than two orders of
magnitude for practical and economical field applications.
Such a device can be deployed in the hydrogen production
plants and fuel-cell vehicle refueling stations for the analysis
and/or monitoring of key impurity species in hydrogen for
quality assurance and control purposes.
5. Conclusions
A novel technique has been developed in this work to achieve
a quantitative enrichment of trace impurities in hydrogen for
allowing the enriched impurities in the sample to be
analyzed with simple, low-cost analytical instruments in the
field. A laboratory-scale sampling device using a Pd-alloy
membrane has been designed, fabricated, and tested. In tests
without sulfur impurities, the hydrogen analyte containing
w0.21% each of N2, CH4, CO, and CO2 impurity species was
sampled at 48.6 atm (700 psig) pressure and then processed in
the device. The measured enrichment factors (MEFs) were
found to match the calculated enrichment factors (CEFs) of
w32. The close correspondence between the MEFs and CEFs
validates the concept of this sampling technique. The
internal silicon coating of the wall surfaces of the sampling
device has been shown to be effective in eliminating unde-
sirable methanation and coking reactions, that otherwise
may occur due to catalyzed reactions with the metal wall
surfaces of vessel. Tests of the sampling device with
hydrogen analyte containing w2 ppm H2S showed a reduc-
tion of hydrogen permeation rate as well as an initial sulfur
loss. Test data showed the sulfur losses were reduced after
a few consecutive tests, however, more studies are needed to
address themechanism of eventual sulfur loss and the initial
sulfur accounting issues.
Fig. 7 e Enrichment factors for the consecutive tests B-1 to B-5.
i n t e r n a t i o n a l j o u r n a l o f h y d r o g e n en e r g y 3 5 ( 2 0 1 0 ) 1 2 4 8 0e1 2 4 9 0 12489
Author's personal copy
Acknowledgements
This work was supported by the U.S. Department of Energy’s
Vehicle Technologies and Fuel Cell Technologies Program
Offices. Argonne National Laboratory is managed for the U.S.
Department of Energy by UChicago Argonne, LLC, under
contract DE-AC-02-06CH11357.
r e f e r e n c e s
[1] Casey D, Verma P. Controlled hydrogen fleet andinfrastructure demonstration and validation project, DOEhydrogen program review. Arlington, VA; June 2008.
[2] Frenette G. Hydrogen fuel cell vehicle & infrastructuredemonstration program review DOE hydrogen programreview. Arlington, VA; June 2008.
[3] Wipke K, Sprik S, Kurtz J, Thomas H, Garbak J. FCV learningdemonstration: project midpoint status and first-generationvehicle results. WEV J 2008;2:4e17.
[4] Information report on the development of a hydrogenquality guideline for fuel cells, SAE surface vehicleinformation report e J2719; Apr 2008. 1e14.
[5] Basile A, Gallucci F, Paturzo L. A dense Pd/Ag membranereactor for methanol steam reforming: experimental study.Catal Today 2005;104:244e50.
[6] Baker RW. Membrane technology and applications. WestSussex: John Wiley & Sons; 2004. pp. 309e12.
[7] Paglieri SN, Way JD. Innovations in palladium membraneresearch. Sep Purif Methods 2002;31:1e169.
[8] Shu J, Grandjean BPA, Vanneste A, Kaliaguine S. Catalyticpalladium-based membrane reactors e a review. Can J ChemEng 1991;69:1036e60.
[9] Knapton AG. Palladium alloys for hydrogen diffusionmembranes. Platinum Met Rev 1977;21:44e50.
[10] Phair JW, Donelson R. Developments and design of novel(non-palladium-based) metal membranes for hydrogenseparation. Ind Eng Chem Res 2006;45:5657e74.
[11] Poling BE, Prausnitz JM, O’Connell JP. The properties of gasesand liquids. 5th ed. New York: McGraw-Hill; 2001. pp. 4.17e4.21.
[12] Kajiwara M, Uemiya S, Kojima T. Stability and hydrogenpermeation behavior of supported platinum membranes inpresence of hydrogen sulfide. Int J Hydrogen Energy 1999;24:839e44.
[13] Iyoha O, Enick R, Killmeyer R, Morreale B. The influence ofhydrogen sulfide-to-hydrogen partial pressure ratio on thesulfidization of Pd and 70 mol% PdeCu membranes,. J MembSci 2007;305:77e92.
[14] Pomerantz N, Ma YH. Effect of H2S on the performance andlong-term stability of Pd/Cu membranes. Ind Eng Chem Res2009;48:4030e9.
[15] B.D. Morreale, The influence of H2S on palladiumecopperalloy membranes, Ph.D. thesis: University of Pittsburgh,School of Engineering, 2006. p. 156.
[16] Morreale BD, Ciocco MV, Howard BH, Killmeyer RP, Cugini A,Enick RM. Effect of hydrogen-sulfide on the hydrogenpermeance of palladiumecopper alloys at elevatedtemperatures. J Membr Sci 2004;241:219e24.
[17] Kamakoti P, Morreale BD, Ciocco MV, Howard BH,Killmeyer RP, Cugini AV, et al. Prediction of hydrogen fluxthrough sulfur-tolerant binary alloy membranes. Science2005;307:569e73.
[18] Roa F, Thoen PM, Gade SK, Way JD, DeVoss S, Alptekin G.Palladium-copper and palladium-gold alloy compositemembranes for hydrogen separations. In: Bose AC, editor.Inorganic membranes for energy and environmentalapplications. New York: Springer; 2009. p. 221e39.
[19] Bustamante F, Enick RM, Killmeyer RP, Howard BH,Rothenberger KS, Cugini AV, et al. Uncatalyzed and wall-catalyzed forward wateregas shift reaction kinetics. AIChE J2005;51:1440e54.
[20] Kustov AL, Frey AM, Larsen KE, Johannessen T, Norskov JK,Christensen CH. CO methanation over supported bimetallicNieFe catalysts: from computational studies towardscatalyst optimization. Appl Catal A 2007;320:98e104.
[21] Inui T, Funabiki M, Takegami Y. Simultaneous methanationof CO and CO2 on supported Ni-based composite catalysts.Ind Eng Chem Prod Res Dev 1980;19:385e8.
i n t e rn a t i o n a l j o u r n a l o f h y d r o g e n en e r g y 3 5 ( 2 0 1 0 ) 1 2 4 8 0e1 2 4 9 012490


![MOF-5 impurities FINAL · MOF-5 remains an attractive hydrogen storage material due to its balanced gravimetric and volumetric hydrogen uptake [30]. As a zinc-based MOF with a carboxylate](https://static.documents.pub/doc/80x56/604c16ef32bbfa546e0cae36/mof-5-impurities-final-mof-5-remains-an-attractive-hydrogen-storage-material-due.jpg)


