To measure the pulse rate and blood pressure of people before and after the use of treadmill and observe the change based on age group and amount of exercise they take. Done by: Rutvi Nandani Pooja Jasani
Transcript
To measure the pulse rate and blood pressure of people before and after the use of treadmill and observe the change based on age group and amount of exercise they take.
Done by:Rutvi NandaniPooja Jasani
HYPOTHESISAccording to the information we found out after
research in the internet and consulting a few doctors we found out that,
Athletes will have low blood pressure and low pulse rate and non athletes will have high blood pressure and high pulse rate.
As the age increases, blood pressure and pulse rate increases. Hence, people falling under age of 10-15 years, will have least blood pressure compared to other groups and blood pressure will slowly increase and will be highest in people falling under age group of 25-30 years and they will have more pulse rate when compared to other age groups!
MATERIALS REQUIREDTreadmillTowel WaterSphygmomanometer-uncertainty of the
instrument we used for the project is +/-1 ( least count of the instrument).
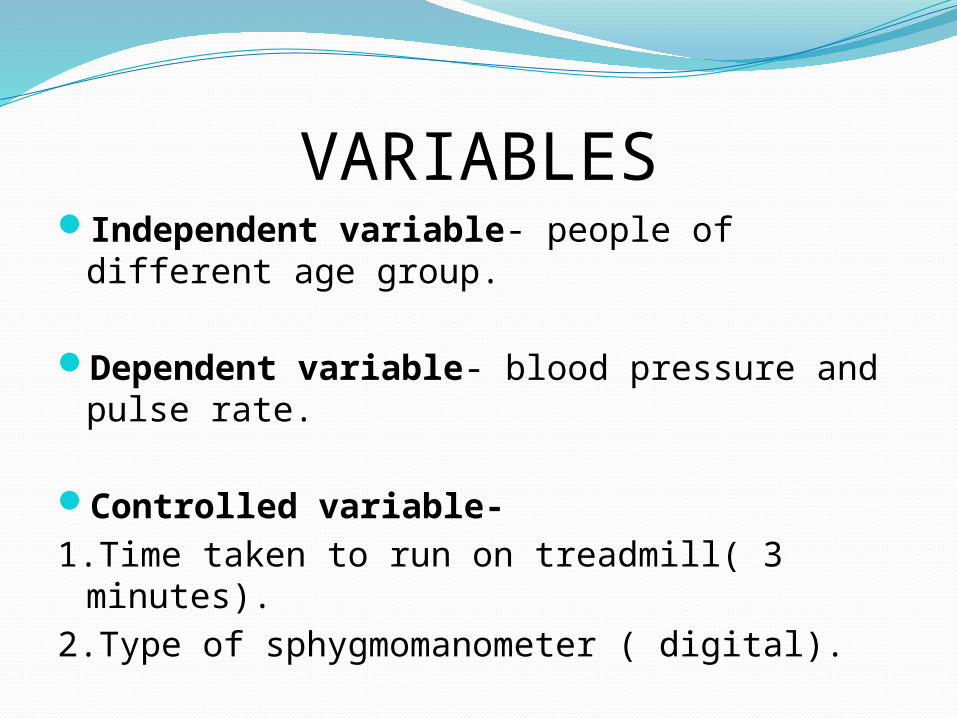
VARIABLESIndependent variable- people of different
age group.
Dependent variable- blood pressure and pulse rate.
Controlled variable-1.Time taken to run on treadmill( 3 minutes).2.Type of sphygmomanometer ( digital).
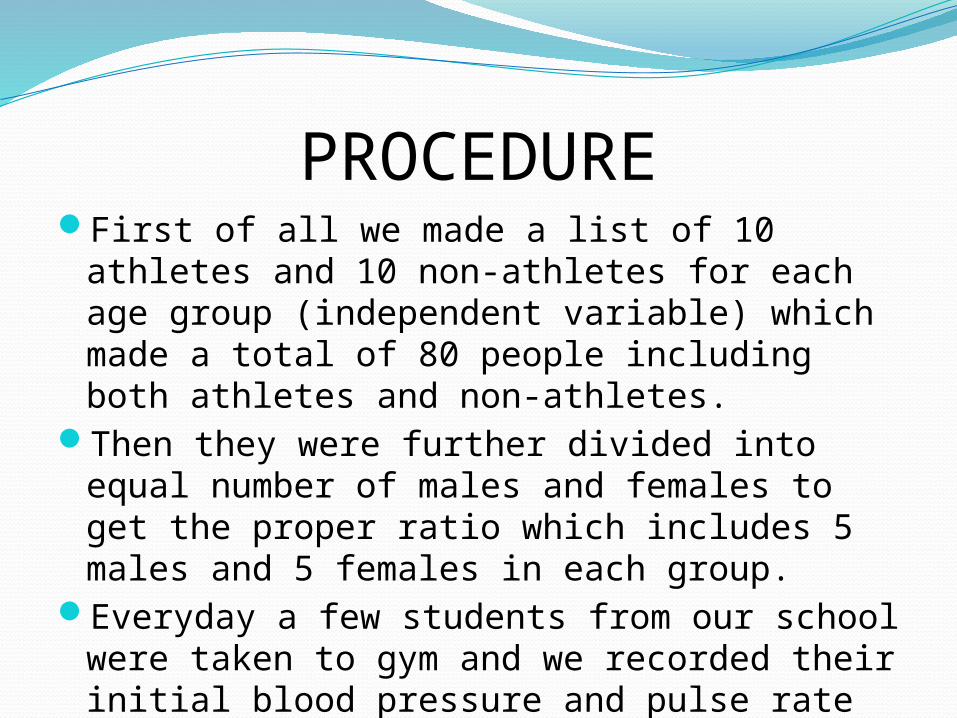
PROCEDUREFirst of all we made a list of 10 athletes and
10 non-athletes for each age group (independent variable) which made a total of 80 people including both athletes and non-athletes.
Then they were further divided into equal number of males and females to get the proper ratio which includes 5 males and 5 females in each group.
Everyday a few students from our school were taken to gym and we recorded their initial blood pressure and pulse rate (dependent variable) at rest.
While recording the blood pressure and pulse there are many precautions which must not be overlooked. They are:
● the instrument must be kept at the heart level.
●the person should be at rest for some time and they must not move or talk during the process of measuring the data.
●second hand should be used to give support to the other hand where the instrument is fit.
Then they were asked to run on treadmill for three minutes (controlled variable) and again their blood pressure and pulse were measured.
We followed the same procedure for all age groups and then compared the data with the hypothesis.
Then we created the graphs to know the difference in dependent variable before and after exercise and also to know whose blood pressure and pulse is more than the other.
GRAPHS WITH INTERPRETATION
syst
olic
dia
stolic
puls
e
syst
olic
dia
stolic
puls
e
before exercise after exercise
0
2
4
6
8
10
12
mean average
mean average
Graph showing mean average and error bars of athletes 10-15 years.
systolic diastolic pulse systolic diastolic pulsebefore exercise after exercise
0
20
40
60
80
100
120
140
mean average
mean average
Graph showing standard deviation of athletes 10-15 years.
SYSTOLIC
DIASTOLIC
PULSE
T TEST 2.06106E-07
0.529916865 3.89342E-09
syst
olic
dia
stolic
puls
e
syst
olic
dia
stolic
puls
ebefore exercise after exercise
0
2
4
6
8
10
12
mean average
mean average
Graph showing mean average and error bars of non athletes 10-15 years
systolic diastolic pulse systolic diastolic pulsebefore exercise after exercise
0
20
40
60
80
100
120
140
mean average
mean average
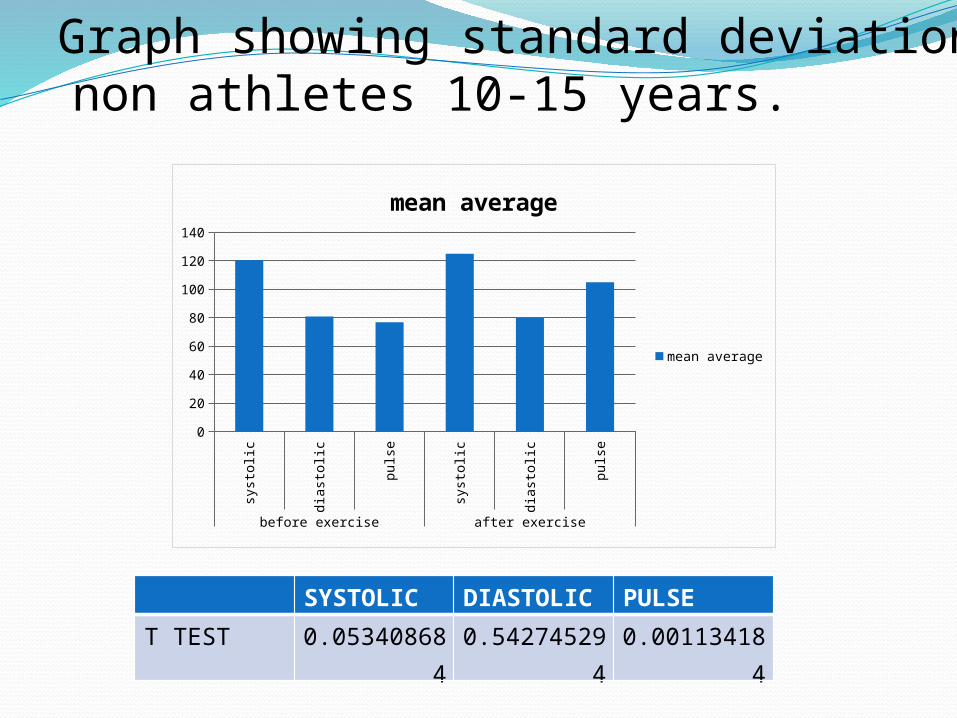
Graph showing standard deviation of non athletes 10-15 years.
SYSTOLIC DIASTOLIC
PULSE
T TEST 0.053408684 0.542745294 0.001134184
systolic diastolic pulse systolic diastolic pulsebefore exercise after exercise
0
2
4
6
8
10
12
mean average
mean average
Graph showing mean average and error bars of athletes 15-20 years.
systolic diastolic pulse systolic diastolic pulsebefore exercise after exercise
0
20
40
60
80
100
120
mean average
mean average
Graph showing standard deviation of athletes 15-20 years.
Systolic Diastolic pulse
T Test 0.098307579 0.538415215 2.43517E-09
systolic diastolic pulse systolic diastolic pulsebefore exercise after exercise
0
2
4
6
8
10
12
mean average
mean average
Graph showing mean average and error bars of non athletes 15-20.
systolic diastolic pulse systolic diastolic pulsebefore exercise after exercise
0
20
40
60
80
100
120
140
160
mean average
mean average
Graph showing standard deviation of non athletes 15-20 years.
SYSTOLIC DAISTOLIC
PULSE
T Test 0.381623425 0.693101934 0.000161084
systolic diastolic pulse systolic diastolic pulsebefore exercise after exercise
0
2
4
6
8
10
12
mean average
mean average
Graph showing mean average and error bars of athletes 20-25.
systolic diastolic pulse systolic diastolic pulsebefore exercise after exercise
0
20
40
60
80
100
120
140
mean average
mean average
Graph showing standard deviation of athletes 20-25.
SYSTOLIC DIASTOLIC
PULSE
T Test 0.002860124 0.907321585 3.40289E-05
systolic diastolic pulse systolic diastolic pulsebefore exrecise after exercise
0
2
4
6
8
10
12
mean average
mean average
Graph showing mean average and error bars of non athletes 20-25 years.
systolic diastolic pulse systolic diastolic pulsebefore exrecise after exercise
0
20
40
60
80
100
120
140
mean average
mean average
Graph showing standard deviation of non athletes 20-25 years.
SYSTOLIC DIASTOLIC
PULSE
T Test 0.027393515 0.600779818 0.001402869
systolic diastolic pulse systolic diastolic pulsebefore exercise after exercise
0
2
4
6
8
10
12
mean average
mean average
Graph showing mean average and error bars of athletes 25-30 years.
systolic diastolic pulse systolic diastolic pulsebefore exercise after exercise
0
20
40
60
80
100
120
140
mean average
mean average
Graph showing standard deviation of athletes 25-30 years.
SYSTOLIC DIASTOLIC
PULSE
T Test 0.10075945 0.741820554 1.26506E-07
systolic diastolic pulse systolic diastolic pulsebefore exercise after exercise
0
2
4
6
8
10
12
mean average
mean average
Graph showing mean average and error bars of non athletes 25-30 years.
systolic diastolic pulse systolic diastolic pulsebefore exercise after exercise
0
20
40
60
80
100
120
140
160
mean average
mean average
Graph showing standard deviation of non athletes 25-30 years.
SYSTOLIC DIASTOLIC
PULSE
T Test 0.001165643 0.193416827 1.32928E-09
CONCLUSIONMy data clearly supports the hypothesis. My
data shows that the athletes have low blood pressure and low pulse rate compared to the non athletes of same age group which is clearly seen from the graphs.
When the data is compared between two different age groups, it is clearly seen that as the age increases, the blood pressure increases.
I saw a specific trend in the change in blood pressure and pulse rate before and after exercise.
The systolic value increases by a 1-5 mm of mercury and diastolic decreases by 1-2 mm of mercury or remains the same. The pulse rate shows a tremendous increase of around 20-30 units (beats per minute). This change is same for all groups.
●Another thing I observed is that the athletes have a low pulse rate and after exercise their pulse rate comes back to normal in a very small amount of time where as non athletes take time to get their pulse back to the normal.
A support to this is given by the T-Test which shows that diastolic value is not significantly different and pulse is significantly different in all the graphs. Systolic value is significantly different in few graphs and not significantly different in few.
LIMITATIONSThe digital instrument which we used had
errors so sometimes the readings came wrong. Manual sphygmomanometers are more accurate than the digital ones.
As the age increases, pulse rate should increase but in some cases we got a low pulse rate due to errors in instrument or human errors.