174


TO
My Sweet Daughters
Minal Fatima,ManhaFatima,Hareem Fatima & dearest son
Muhammad AhsanMehtab
DECLARATION
The work reported in this thesis was carried out by me under the supervision of Prof. Dr.
Muhammad Zuber, Chairman Department of Applied Chemistry, GC University, Faisalabad,
Pakistan.
I hereby declare that the title of thesis “Synthesis and Characterization of
Polyurethane Acrylate Copolymers and their Composites and the contents of thesis are the
product of my own research and no part has been copied from any published source (except the
reference, standard mathematical or genetic models / equations / formulas / protocols etc). I
further declare that this work has not been submitted for the award of any degree/ diploma. The
university may take action if the information provided is found inaccurate at any stage
Shazia Tabasum
2006-GCUF-1-115


i
ACKNOWLEDGEMENTS
I express my humble gratitude to Almighty Allah, the most merciful and beneficent, who guides
us in difficult and congeal circumstances, who endowed me with the will to work on this
research project. Great respect for our Holy Prophet Hazrat Muhammad (Peace be upon him)
who emphasizes us to learn from the cradle to the grave.
I would like to express my deep gratitude to Prof. Dr. Iftikhar Hussain Bukhari, Chairman,
Department of Chemistry, regarding helpful discussions and technical support on certain aspects
of this research.
I would like to extend my warmest appreciation to my supervisor Prof. Dr. Muhammad
Zuber, for his encouragement and guidance during the research and writing up of this
dissertation. He also provided a great deal of help in my professional development.
I would also like to express my deep gratitude to Dr. Khalid Mahmood Zia, whose valuable
advices, guidance and encouragement enabled me to complete my work successfully.
I also appreciate my other committee member Dr. Abdul Jabbar regarding helpful discussions
and technical support on certain aspects of this research.
Financial support by Higher Education Commission is gratefully acknowledged.
ShaziaTabasum

ii
ABSTRACT
Polyurethanes (PU) are present in many aspects of modern life. They represent a class of
polymers that have found extensive use in the medical, automotive and industrial fields. They
can be found in products such as furniture, coatings, adhesives, paddings, paints, elastomers and
synthetic skins. The properties of polyurethane can be modified by amalgamation of functional
groups. Acrylic emulsions and polyurethane aqueous dispersions have been used extensively in
coating applications and both systems have some disadvantages. To improve the properties of an
individual polymer system it is common to blend them with other polymers. A part of PU
contribute the better mechanical stability, solvent and chemical resistance, and toughness.
Whereas outdoor resistance, pigmentability, and lower cost are due to the acrylic component.
The current project is divided into two parts. In the first part polyurethane acrylate copolymers
(PAC) were prepared by emulsion copolymerizatiion varying the diisocyanates structure,
molecular weight of PCL and mole ratio of polyurethane/acrylate. Structural and
physiochemical characterization of the prepared PAC was evaluated and discussed. Regarding
textile applications,the pilling, colorfastness to rubbing and antimicrobial activities of the plain
weave poly-cotton fabric after application of PAC onto the fabric were evaluated. The results
revealed that by increasing the molecular weight of PCL in the synthesized PAC samples, the
emulsion stability, antimicrobial activities and pilling ratings of treated samples increased and
this behavior was interpreted in term of increasing hydrophilic character. Colorfastness to
rubbing (dry and wet) of dyed, printed and white improved by decreasing the amount of butyl
acrylate (BuA) and/or by increasing the percentage of vinyl terminated PU prepolymer and vice
versa. In the second part polyurethane/polymethyl methacrylate titanium dioxide based
composites were prepared. Incorporation of the TiO2was confirmed through scanning electron
microscope (SEM) analysis. Differential scanning calorimetry analysis, compression testing,
hardness and biocompatibility evaluation was carried out and discussed. The results regarding
biocompatibility revealed that samples having 80% polyurethane (PU), 20% polymethyl
methacrylates (PMMA) with 2.5g titanium dioxide in 100 g mixture of PU and PMMA is much
suitable for biomedical applications.

1
CONTENTS
Acknowledgements i
Abstract ii
CHAPTER 1 Introduction 1-13
1.1. General structure of polyurethanes 2
1.1.1. Diisocyanates 3
1.1.2. Polyols 6
1.1.3. Chain Extenders (CE) 6
1.2. Properties of polyurethanes 9
1.3. Classification of polyurethanes 10
1.3.1. Polyurethane Foam 10
1.3.2. Polyurethane coatings, adhesives, sealants & elastomers
(CASE)
10
1.3.3. Shape memory polyurethanes 11
1.3.4. Polyurethane biomaterials 11
1.4. Modification of properties of polyurethane 12
1.5. Polyurethane acrylate copolymers 12
CHAPTER 2 Review of Literature 14-32
2.1. Thermo-Mechanical Properties of polyurethanes 14
2.2. Surface characteristics of PU 16
2.3. Degradation of polyurethanes 17
2.4. Uses of polyurethanes 17
2.5. Biocompatable behavior and biomedical uses of
polyurethanes
19
2.6. Properties of acrylates 20
2.7. Polyurethane in combination with acrylate 21
2.8. Polyurethane acrylic dispersions 22
2.9. Polyurethane in blend with other polymers 24
2.10. Composites of polyurethanes 25
2.11. Restorative dental materials used 26
2.12. Additives incorporated in polyurethanes used in
dental material
27
2.13. Titanium as an additive in polyurethane biomaterials 29
2.14. Finishes in textile industry 30
CHAPTER 3 Materials and Methods 33-50
3.1. Chemicals / Instruments 33
3.1.1. Chemicals 33
3.1.2 Instrument / Techniques used in whole study 34
3.2. Synthesis of Polyurethane 34
3.2.1. Analysis of Reactants 34
3.2.2. Synthesis 34
3.3. Characterization 40
3.3.1. Techniques 40
3.3.1.I. Fourier Transform Infrared Spectroscopy 40
3.3.1.II. SEM analysis 40
3.3.1.III. Differential scanning calorimetry 40

2
3.3.1.IV. Compression Test 40
3.3.1.V. Contact angle measurement 41
3.3.1.VI. μ Quant 41
3.3.1.VII. Solid contents 41
3.3.1.VIII. Physical characterization and colorfastness
properties
42
3.3.1.IX. Pretreatment of fabric substrate having 50/50,
45/56 cotton/polyester blend ratio
42
3.3.1.X. Fabrics treatment with PAC copolymers emulsion: 42
3.3.1.XI. Pilling characterization 43
3.3.1.XII. Antimicrobial evaluation 43
3.4. Chemicals 44
3.5. Synthesis of Polyurethane / Polymethyl
methacrylate/TiO2 based composites
44
3.5.1. Synthesis of polyurethane 44
3.5.2. Preparation of blends of polyurethane-poly methyl
methacrylate (PMMA) and TiO2
46
3.5.3. Preparation of pellets from blends 47
3.6. Characterization 49
3.6.1. Evaluation of Biocompatability 49
3.6.1.I. Hemolytic activity 49
3.6.1.II. Mutagenic study by Ames bacterial reverse-mutation
test (fluctuation test)
49
CHAPTER 4 Results and Discussion 51-109
4.1. Molecular characterization of PUA copolymer emulsion
based on TDI
51
4.2. Physical characterization 56
4.3. Colorfastness properties 59
4.4. Pilling characterization 62
4.5. Antimicrobial activity 65
4.6. Surface morphological studies 70
4.7. Molecular characterization of PUA copolymer emulsion
based on H12MDI
71
4.8. Molecular characterization of PUA copolymer emulsion
based on IPDI
76
4.9. Colorfastness and pilling characteristics of fabric after
application of IPDI based PAC copolymer samples
80
4.9.1. Colorfastness properties of printed fabric 80
4.9.2. Colorfastness properties of dyed fabric 82
4.9.3. Pilling characterization 84
4.10. Colorfastness and pilling characteristics of fabric after
application of H12MDI based PAC emulsion
86
4.10.1. Colorfastness properties of dyed and printed fabric 86
4.10.2. Pilling characterization 88
4.11. Molecular characterization of PU 90
4.12. Scanning electron microscopy (SEM) analysis 95
4.13. Mechanical properties of the blended samples 98

3
4.14. Biocompatibility evaluation 103
4.14.1. Evaluation of cytotoxicity 103
4.14.5. Mutagenic activity 105
4.15. Thermal analysis 107
CHAPTER 5 Summary 110-111
References 112-127
List of publications from thesis 128

LIST OF TABLES
Table
No.
Title Page
No.
1.1 Chemical structures of different diisocyanates. 4
1.2 Chemical structure of some polyols used for the synthesis of
polyurethane.
6
1.3 Chain extenders utilized in synthesizing polyurethane. 7
3.1 Formulation for preparing PAC emulsions. 37
3.2 Sample code designation and different formulations of
polyurethane copolymers varying molecular weight of
polycapralactonediols.
38
3.3 Sample code designation and different formulation of
polyurethane copolymers using isophorone diisocyanate
39
3.4 Sample code designation and different formulation of
polyurethane copolymers using 4,4-’dicyclohexyl methane
(H12MDI)
39
3.5 Fabric specification with quality and processed applications. 43
3.6 Sample code designation and different formulation of
polyurethane and PU/PMMA/TiO2 blends.
47
3.7 Set-up of the mutagenic study by Ames bacterial reverse-mutation
test (fluctuation assay)
50
4.1 Physical characteristics of polyurethane acrylate copolymers
(PACs) based coatings varying molecular weight of
polycaprolactonediols
57
4.2 Pilling evaluation rating of white, grey, dyed and printed fabrics
after application of of series PAC samples in different dilutions
64
4.3 Antibacterial activity of printed and dyed poly-cotton fabrics using
polyurethane acrylate (50g/L) copolymer emulsions against a
panel of bacterial species assayed by disc diffusion method
67
4.4 Contact angle measurement of dyed samples using water as polar
liquid and varying molecular weight of PCL
69
4.5 Pilling evaluation rating of white, dyed and printed fabrics treated
with IPDI based PAC copolymer
85
4.6 Colorfastness to rubbing data of the printed and dyed fabrics
samples treated with synthesized H12MDI based polyurethane
acrylates
87
4.7 Pilling evaluation rating of white, dyed and printed fabrics treated
with H12MDI based PAC copolymer
89
4.8 Compression results of the prepared PU/PMMA/TiO2 blends
samples
100
4.9 Toxicity level of the samples of PU/PMMA/TiO2 blends 104
4.10 Mutagenic activity of compounds in the Ames fluctuation test
using TA 98 and TA 100 using different standard mutagens
106

LIST OF FIGURES
Figure
No.
Title Page No.
3.1 Self designed tool for preparing pellets (a) cylinder; (b & c) bolts;
(d ) cylindrical volume.
48
4.1 FT-IR spectra of monomers and final PU acrylate copolymers: (a)
toluene-2,4-diisocyanate (TDI); (b) Polycaprolactone diol(CAPA); (c)
NCO terminated polyurethane prepolymer; (d) 2-hydroxyethylacrylate
(HEA); (e) vinyl terminated polyurethane prepolymer; (f)butyl acrylate
(BuA); (g) final polyurethane acrylate copolymers
55
4.2 Colorfastness to rubbing data of treated and untreated printed poly-cotton
fabrics samples used for testing
61
4.3 Photograph presenting the antimicrobial evaluation of treated fabrics
using diffusion assay
66
4.4 a) FT-IR spectrum of H12MDI
b) FTIR spectrum of NCO terminated polyurethane prepolymer prepared
by reacting H12MDI and CAPA 2000
c) FTIR spectrum of vinyl terminated PU prepolymer prepared by
reacting H12MDI based NCO terminated PU prepolymer and HEA
d) FTIR spectrum of proposed polyurethane PU acrylate copolymer
synthesized by the emulsion copolymerization of H12MDI based vinyl
terminated PU and BuA
74
74
75
75
4.5 a) FT-IR spectrum of IPDI
b) FTIR spectrum of NCO terminated polyurethane prepolymer prepared
by reacting IPDI and CAPA 2000
c) FTIR spectrum of vinyl terminated PU prepolymer prepared by
reacting IPDI based NCO terminated PU prepolymer and HEA
d) FTIR spectrum of proposed polyurethane PU acrylate copolymer
synthesized by the emulsion copolymerization of IPDI based vinyl
terminated PU and BuA
78
78
79
79
4.6 Colorfastness to rubbing data of the printed fabrics treated with
synthesized IPDI based PU acrylates in different dilutions
81
4.7 Colorfastness to rubbing data of the dyed fabrics treated with synthesized
IPDI based PU acrylates in different dilutions
83
4.8 FT-IR spectra: (a) TDI; (b) Poly (ε-caprolactone)diol (molecular weight
4000) (CAPA); (c) PU prepolymer; (d) BDO; (e) Final polyurethane
92
4.9 FT-IR spectra: (a) PUACT 1 (100% PMMA/0% PU); (b) PUACT 2 (90%
PMMA/10% PU); (c) PUACT 3 (80% PMMA/20% PU); (d) PUACT 4
(60% PMMA/40% PU); (e) PUACT 5 (40% PMMA/60% PU); (f)
PUACT 6 (20% PMMA/80% PU); (g) PUACT 7 (0% PMMA/100%PU)
94
4.10 Scanning electron microscope (SEM) images of PU-PMMA/TiO2 blends
a)X 500 & b) X1000 magnifications
96

4.11 Scanning electron microscope (SEM) images of PU-PMMA/TiO2 blends:
(a) PUACT 1, (b) PUACT 2, (c) PUACT 3, (d) PUACT 4, (e) PUACT 5,
(e) PUACT 6, (e) PUACT 7
97
4.12 a)Compression results of the prepared PU/PMMA/TiO2 blends samples
PUACT 1 to PUACT 4
b)Compression results of the prepared PU/PMMA/TiO2 blend
sample; PUACT 5
101
102
4.13 DSC scan of PU/PMMA /TiO2 composites 109

LIST OF SCHEMES
Scheme
No.
Title Page No.
1.1 General reaction for the synthesis of polyurethane samples 2
3.1 Synthesis of isocyanate terminated prepolymer 35
3.2 Synthesis of vinyl terminated PU prepolymer having
unsaturation at its ends
36
3.3 Formation of proposed PU Acrylate Copolymer 37
3.4 Synthesis of PU 46

LIST OF ABBREVIATIONS
1,4-BD 1,4-butane diol
AC Acrylic
ACE Acrylate-based copolymer emulsion
BuA Butyl acrylate
CA Contact angles
CMC Carboxyl methyl cellulose
DMF Dimethyl form amide
DSC Differential scanning calorimetry
DTS Diametral tensile strength
FA Perfluoroalkylacrylate
FTIR Fourier transform infra red spectroscopy
H12MDI Dicyclohexylmethane -4,4´-Diisocyanate
HDI HexamethyleneDiisocyanate
HEA Hydroxy ethyl acrylate
HPUA Hyper branched polyurethane acrylate
HTPB Hydroxy-terminated polybutadiene
IPDI Isophorone Diisocyanate
IPN Interpenetrating polymer network
MDI Diphenylmethane Diisocyanate
MMT Montmorillonite
PAC Polyurethane acrylate copolymer
PCL Polycaprolactone diol
PMMA Poly methyl meth acrylate
PPDI P-Phenylene Diisocyanate
PU Polyurethane
PUFA Polyurethane-fluorinated acrylic hybrid
PVA Polyvinyl alcohol
PVDF Poly(vinylidene fluoride)
RRP Rigid Rod Polymer
SEM Scanning electron microscopy
SiE Silicone micro emulsion
SMPs Shape memory polymers
SPU Segmented polyurethane
TDI Toluene Diisocyanate
Tg Gass transition temperature
Th Thermal transition
TiO2 Titanium dioxide
TPU Thermoplastic Polyurethane
WPU Waterborne polyurethane
WPU Water borne polyurethane
WPUA Waterborne polyurethane acrylate
XRD X-ray diffraction

1
Chapter 1
INTRODUCTION
Polyurethanes (PUs) were first synthesized and studied by Otto Bayer in 1937. The PUs are
exceptional polymers suitable for the manufacturing of foams, elastomers, adhesives,
coatings and rubbers both rigid and flexible rubbers (Levchik and Weil, 2004). Polyurethanes
are extensively used in medical field and automotive manufacturing. They are found in goods
such as paddings, coatings, adhesives, elastomers, paints, synthetic skins and furniture. There
are several reasons due to which polyurethanes are taking place of previously used polymers.
In United States, the government is eliminating the use of chlorinated rubber in coatings,
aircraft and marine as they enclose environmentally menacing volatile organic compounds.
(Hegedus et al., 1989; Reisch, 1990). Automobile companies are switching from latex rubber
in interior padding and seats of cars with polyurethane foam due to lesser density and better
retention of elastic properties for longer times (Ulrich, 1983). PU has also other benefits such
as high melting points and increased tensile strength which enhance service life. (Bayer,
1947). The ability of polyurethanes to resist deterioration by solvents, water and oil make
them exceptional for replacing the plastics (Saunders and Frisch, 1964). PU coatings display
outstanding adhesive properties, electrical properties, weather resistance and wear resistance
for industrial uses (Saunders and Frisch, 1964; Fried, 1995; Urbanski et al., 1977). PUs also
exhibit resistance to macromolecular oxidation, breakdown in the presence of water &
calcification in biomedical applications (Marchant, 1992). Boretos and Pierce first proposed
polyurethanes for use as biomaterials in 1967. Polyurethanes have extensive use in medical
field because of having good mechanical and physical properties and biocompatibility. They
are used in making intra-aortic balloons, heart valves, dialysis membranes, aortic grafts,
mammary implants and indwelling catheters. The biodegradable PUs are likely to be utilized
in soft tissue engineering products in which considerable elasticity is required (Jiang et al.,
2007).
2
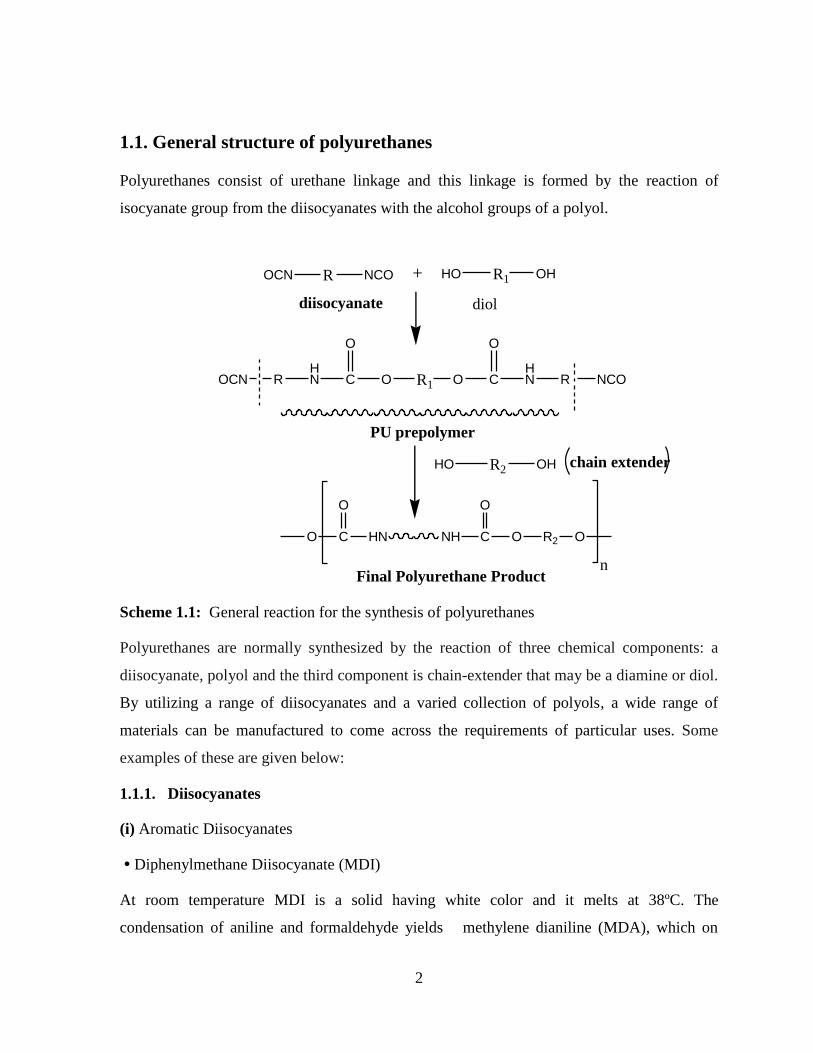
1.1. General structure of polyurethanes
Polyurethanes consist of urethane linkage and this linkage is formed by the reaction of
isocyanate group from the diisocyanates with the alcohol groups of a polyol.
R NCOOCN + R1 OHHO
R1O O CC
O O
HN
HN RR NCOOCN
R2 OHHO
HN NH CC
OO
OO R2 O
Final Polyurethane Product
diisocyanate diol
chain extender
PU prepolymer
n
Scheme 1.1: General reaction for the synthesis of polyurethanes
Polyurethanes are normally synthesized by the reaction of three chemical components: a
diisocyanate, polyol and the third component is chain-extender that may be a diamine or diol.
By utilizing a range of diisocyanates and a varied collection of polyols, a wide range of
materials can be manufactured to come across the requirements of particular uses. Some
examples of these are given below:
1.1.1. Diisocyanates
(i) Aromatic Diisocyanates
• Diphenylmethane Diisocyanate (MDI)
At room temperature MDI is a solid having white color and it melts at 38ºC. The
condensation of aniline and formaldehyde yields methylene dianiline (MDA), which on

3
reaction with phosgene forms MDI. MDI exist in two isomeric forms 2,4´-MDI and 4,4´-
MDI and the MDI available in the market contains mixture of these isomers in ratio of 98 :
2.
• Toluene Diisocyanate (TDI)
The commercial production of TDI started before the second world war. It is a colorless
liquid and is a mixture of the 2,4- and 2,6-isomers. It is available in different ratio of these
two isomers i.e., 80:20 and 65:35, 95:5 and pure 2,4-isomer is also available in the market.
Dinitro toluene obtained by nitration of toluene, gives diamino toluene on reduction with
metal / HCl (Clemmensen reduction) which on reaction with phosgene forms TDI. The
freezing point of the commercial product (80:20 isomer mixture) is 14º C.
• Naphthalene Diisocyanate (NDI) and p-Phenylene Diisocyanate (pPDI)
These diisocyanates are less common but are also used for the synthesis of PUs.
(ii) Aliphatic Diisocyanates
• Hexamethylene Diisocyanate (HDI)
It is a liquid that freezes at −55ºC. Hexamethylene diamine on reaction with phosgene
produce HDI.
• Isophorone Diisocyanate (IPDI)
Reaction of isophorone with HCN forms cyanoketone which on reduction gives isophorone
diamine (IPDA). Subsequently on reaction with phosgene it generates IPDI. At room
temperature IPDI is a liquid. Commercially available IPDI is a mixture of cis and trans
isomers having their ratio 75:25.
• Dicyclohexylmethane -4,4´-Diisocyanate (H12MDI)
4,4’-methylene di aniline on hydrogenation give 4,4’- dicyclo hexyl amine (H12MDA). It is
reacted with phosgene forming H12MDI. It is a liquid at prevailing temperature with a
melting range, 19-23º C. In commercial H12MDI various isomers (cis- cis, trans, trans and
cis,trans ) exist in combination of 20:50:30, respectively. Some of the commonly used
diisocyanate are listed in Table 1.1

4
Table 1.1: Chemical structures of different diisocyanates
Diisocyanates (names) Structures
CH2 NCOOCN4,4'-methylenediphenyl diisocyanate (MDI)
CH3
NCO
NCO
CH3
NCOOCN2,4-, 2,6-toluene diisocyanate (TDI)
1,6-hexamethylene diisocyanate (HDI) OCN CH2 NCO
6
CH2 NCOOCN4,4'-dicyclohexylmethane diisocyanate (H12MDI)
NCO
CH3
H3C
H3C3-isocyanatomethyl-3,5,5-trimethylcyclohexyl isocyanate (isophorone diisocyanate IPDI)
OCN
NCO
OCN
Cyclohexyl diisocyanate
CH3
NCOOCN
H3C
3,3'-tolidene-4,4'-diisocyanate
CH2
CH3
NCOOCN
H3C
3,3'-dimethyl-diphenylmethane- 4,4'-diisocyanate

5
1.1.2. Polyols
The polyols required for soft segment are hydroxyl terminated polyether or polyesters. Base-
catalyzed addition of propylene oxide (PO), ethylene oxide (EO) onto a hydroxyl or amine
comprising initiator, forms polyol. Polyesterification of a di-acid, for example adipic acid,
using glycols, for instance dipropylene glycol, ethylene glycol or ring opening
polymerization of different lactones generate polyols. Polyols formed by polyesterification
are polyester polyols. The elastomeric properties and physical state of PU are greatly affected
by the molecular weight of the polyol and selection of extender. Viscosity, proportion of
primary hydroxyl groups, functionality and molecular weight are important features of
polyol. Polyester based PU has greater strength because in polyester polyols the polar
carbonyl part of ester linkage exhibit interchain interactions that contributes considerably for
increasing the material strength. The chemical structures of some of polyols are presented in
Table 1.2.
1.1.3. Chain Extenders (CE)
There are two categories of PUs chain extenders, i.e. aromatic diamines and diols and the
corresponding aliphatic diamines and diols (Frisch and Dieter, 1975). Diamine CEs are
considerably more reactive as compared to diol CEs. The polymers made using diamine as
CE have superior properties as compared to those synthesized with equivalent diol CE. It is
attributable to urea linkage while diol bridged CE give urethane linkage. The relative higher
density of hydrogen bonding results in a greater Tg and greater thermal stability.
Familiar chain extenders used in synthesis of polyurethane are given in Table 1.3.

6
Table 1.2: Chemical structure of some polyols used for the synthesis of polyurethane
Polyols Chemical Structure
HO CH2 C O
O
CH2 O C
O
CH2 OHPolycaprolactone (PCL) diol
5 6 5nn
OH CH2 CH
CH CH2 O H
n
Hydroxy-terminated polybutadiene (HTPB)
HO CH2 CH2 CH2 CH2 O HPolytetramethylene oxide (PTMO) diol
HO CH2 O C
O
CH2 C
O
O CH2 OHPolyethylene adipate (PEA) diol
22
2
HO CH2
HC O H
CH3 n
Polypropylene oxide (PPO) diol
HO CH2 CH2 O Hn
Polyethylene oxide (PEO) diol
Si
CH3
CH3
O O HH
n
Polydimethylsiloxane (PDMS)

7
Table 1.3: Chain extenders utilized in synthesizing Polyurethane
The PU block in general consists of different phases, i.e., it has hard regions having high
glass transition temperature (Tg) and also high melting temperature (Tm) separated from the
low (Tg) soft domains obtained` from polyol components (Barikani et al., 2008; Zia et al.,
2008; Barikani and Hepburn, 1987; Aneja et al., 2003). Due to thermodynamic
incompatibility among the hard and soft regions, phase segregation occurs in TPUs. These
block polymers are called as segmented PUs (Young and Lovell, 1994). Glassy crystalline
regions constitute hard segments, amorphous regions constitute randomly arranged motion of
soft segments and impart elastomeric characteristics ( Keskin and Usnmaz, 2010; Ortel et
al.,1993; Reuda-Larraz et al., 2009; Fried, 1995). For the elastomeric soft segment matrix,
the hard segment acts as a physically cross-linking sites which reinforce the PU material
enhancing dimensional stability (Lan et al., 1996).
H2
C OHHOH2
C OHHO
H2
C OHHO
H2
C OHHO
H2
C OHHO
H2
C OHHO
H2
C OHHO
2 3 4
5 6 7
H2
C OHHO
H2
C OHHO8 9 10
1,3-Propane diol 1,4-Butane diol
1,5-Pentane diol 1,6 Hexane diol 1,7 Heptane diol
1,8-Octane diol 1,9-Nonane diol 1,10-Decane diol
CH2 NH2H2N
4,4'-Methylene bis (2-chloroaniline)
1,2-Ethane diol
Cl Cl

8
1.2. Properties of polyurethanes
The properties of polyurethane depend on the composition of polyol, chemical nature of
chain extender and diisocyanate and on the preceding microphase structures. This is the
reason that polyurethanes are extensively used in many fields by tailoring molecular
structures (Liu et al., 2011; Pukanxzky et al., 2008; Sultan et al., 2012; Keskin and Usnmaz,
2010; Garret et al., 2001; Ibarboure et al., 2009). As the microphase segregation among the
soft & hard regions is increased, enhanced thermo mechanical properties in the resulting PU
are accomplished. The presence of the phase separation produced by the bunching of hard
and soft regions in discrete dominions is a topic of continual research attention. Effective
packing in hard regions is due to the acquiescence to strong hydrogen bonding amongst the
hard segments of adjacent chains. The properties and morphology of polyurethanes are
significantly effected by the structure of chain extender. It is well understood in literature
that, functionality, molecular volume & chain length effects hard segment packing and
crystallinity in the hard regions (Petrovic et al., 1998). In earlier research on chain extenders,
it has been found that the properties of elastomers are influenced by precised combination of
diisocyanate and low molecular weight diol. When the number of methylene carbons in diol
having less molecular weight were plotted against the mechanical properties of the
elastomers the typical zigzag patterns were attained. These patterns depend on the ability for
intermolecular hydrogen bonding, whether the number of the methylene carbons was odd or
even and difference in the packing which was further confirmed by X-ray diffraction
(Minoura et al., 1978). Xiao et al., (1995) made a comparison among three CEs having
varying chain length and established that chain extenders having long length exhibited better
mechanical properties in the resulting polyurethane products as compared to the small one
Rogulska et al., (2007) investigated the influence of aliphatic-aromatic α, ω- diols as chain
extender on polyurethane characteristics & reported that mechanical properties also improved
with the increase in chain length of diol. There is profound effect of chain extender on the
physical properties of PU formed by its aggregating function affirmed among PU molecules.
Ramesh et al. (1991) made a comparison among the mechanical properties of various
polyurethanes synthesized by using various diamines or diols as chain extenders &
concluded that polyurethane samples extended with diamines had better properties as
compared to ones extended using diols. It was because the aggregating strength improved as

9
intermolecular hydrogen bonding increased. Poly(ether urethanes) possess hydrolytic
stability more as compared to poly(ester urethanes), and are used as medical scaffolds
(Christenson, 2004; da Silva, 2010). Generally, monomers or co-monomers of Tg values
lower than 0°C produce soft films (Saha et al., 1994). A brief description of the classe of PU
is as under.
1.3. Classification of polyurethanes
Polyurethanes play a key role in our daily lives. They can be classified as PU foams, PU
coatings, PU adhesives, PU sealants, PU elastomers, PU biomaterials, etc. A brief description
of these is as under:
1.3.1. Polyurethane Foam
Both flexible or rigid PU foams are available in market. Flexible polyurethane foam is used
as cushioning for a variety of commercial and consumer products, automotive interiors,
bedding, furniture, packaging and carpet underlay. Rigid polyurethane foam is effective
insulation material that can be used in wall and roof insulation, insulated air barrier sealants,
doors and windows.
1.3.2. Polyurethane coatings, adhesives, sealants & elastomers (PU- CASE)
Polyurethane coatings increase the life span of a product and show aesthetic improvement of
its appearance. Polyurethane sealants provide tighter seals while polyurethane adhesives
make strong and durable bonds. Polyurethane elastomers have extensive applications,
principally in the field of engineering, where properties of chemical and oil resistance and
abrasion resistance are required. These uses include conveyor belts for carrying minerals in
extracting operations, rollers for printing processes and hoses, wheels for roller and hospital
trolleys, and automotive applications including different parts of dash board area and under-
the-bonnet. For luxury, style, and permanence polyurethane products also comprise, tennis
grips and watch band wrapping. Solid nonflatable tyres are also made from polyurethane.
Industrial applications include grocery cart, rollercoaster wheels and loader wheels. The tyres
of small equipments used in the lawn and garden as wheelbarrows, lawn mowers, carts, hand
trucks, etc. are also made from polyurethane (MacGregor and Parker, 1983).

10
1.3.3. Shape memory polyurethanes
Shape memory polymers (SMPs) are a category of smart polymeric materials having the
capability of retaining a temporary shape and return to its permanent shape on external
stimulus for example; light, heat and electromagnetic induction. At higher temperatures (Th)
than the transition temperature (Ttr) the shape memory polyurethanes (SMPUs) can be
deformed readily into a temporary shape and this temporary shape can be fixed by lowering
the temperature below the transition temperature, followed by releasing the stress. The
polymer molecules in SMPUs cannot return to their original configuration due to the
increased rigidity of the soft segment, which fixes the temporary shape. Upon heating, the
polymer molecules, particularly the soft segment begin to move to the original configuration
by releasing all the deformation imposed during the shape fixation process, thereby recalling
the original configuration. The shape memory behavior of SMPUs can be described as being
similar to that of a hyper-elastic rubber at temperatures > transition temperature, but similar
to that of a viscoelastic polymer at temperatures < transition temperature. These two distinct
types of behavior are caused by micro-segregated phases, i.e., thermodynamically
incompatible hard and soft segments. The hard segments bind themselves through chemical
or physical cross-linking with each other, which are responsible for the permanent and
memorized shape. In contrast, the soft segments serve as a shape memory switch, which fixes
the temporary shape and restores the permanent shape through a reversible phase
transformation. This mechanism enables the tailoring of SMPUs to various shape memory
effects by controlling the molecular weight and the mole ratio of soft and hard segments, and
polymerization process, etc. (Mondal and Hu, 2007).
1.3.4. Polyurethane biomaterials
Polyurethanes are extensively used as biomaterials. Their uses comprise catheters, dental
materials, vascular prostheses, heart valves etc. Urethane acrylates are explored as
biomaterials convenient in thermally sensitive materials, contact lenses, and dental materials.
In restorative dentistry the matrix phases of dental composites, are commonly
di(meth)acrylate monomers. Urethane di(meth)acrylates are also commercialized for dental
applications (Keskin and Usnmaz, 2010).

11
1.4. Modification of properties of polyurethane
The properties of polyurethanes can be modified by amalgamation of constitutional moieties
having different functional groups. So the polyurethane is copolymerized with different
polymers such as epoxy, phenolics and acrylates. The common methods of polymer–polymer
adhesion are mechanical interlocking , interpenetrating polymer network (IPN) formation,
chemical bonding, interaction of Van der Waals or similar dispersion forces. Bonding of
filler particles with the polymer matrix is necessary in reinforced composites for transferring
stress from weak matrix to added long-lasting fillers. If fillers are prepared of polymers, IPN
offers such improved bonding (Vuorinen et al., 2008).
1.5. Polyurethane acrylate copolymers
Physical blending of polyurethane and polyacrylate polymers can be carried out to
incorporate their individual advantages. If PU is blended with natural polymers new
materials with improved properties and kept biodegradability are obtained.There is good
miscibility between PU and natural polymers in their blends because of good hydrogen
bonding interaction between urethane groups and hydroxyl groups (Wang, 2009).
Sometimes when the two polymers are incompatible, the resulting blend displays poor
performance. This is for the reason that phase separation during blending makes difficult the
achievement of the ideal composite polymers. Specific interactions can be introduced to
increase compatibility among the polymers being blended. At present, chemical modification
by introducing chemical bonding is used for accomplishing the wanted compatibility among
polymers belonging to separate classes. The process includes chemical grafting, chemical
copolymerization and seeded emulsion polymerization (Guo, et al., 2012).
The interest in waterborne polyurethane (WPU) are developing mostly because of their
exceptional fire resistance, low toxicity, environment friendly applications and improved
mechanical properties. Nevertheless presence of hydrophilic group e.g : carboxyl group in
their molecular chain makes them poor water and alkali resistant (Lee et al., 2006; Lee et al.,
1996; Rahman et al., 2008). However, WPU have certain disadvantages e.g. low adhesion in
moist atmosphere, poor water resistance & low heat resistance. Such shortcomings bound
their uses in the arena of coatings and adhesives (Liu et al., 2011; Coutinho et al., 2003;
Rahman et al., 2008; Deng et al., 2007). Therefore, to overwhelm these downsides, it

12
becomes indispensible to amend WPUs with other materials by cross-linking, hybridization
or physical blending (Wang, 2005; Zhang, 2008;; Deng, 2007). Amongst the numerous
polymers utilized for WPU amendments, polyacrylate (PA) is mostly used because of having
outstanding properties including weather ability, high gloss, better resistance to water &
solvent. The incorporation of acrylate in WPUA changes the structure of chain and
crosslinking density to a great extent. The molecular weight of crosslinked polymer is high
and its mechanical properties are improved (Zhang et al, 2010).
Resulting from its specific segmented structure and amendment using acrylate WPUA
attains numerous properties and superior performance. WPUA are useful in coatings for
wood, printing inks, electronics, textiles, leather and automobiles (Zhang et al., 2010).
Polyurethane (PU) dispersions and acrylic (AC) emulsions are used widely in coating
applications. There are some shortcomings in both systems such as lower chemical
resistance, reduced film formation & rough mechanical properties of acrylic, low pH
stability, greater cost & limited outdoor stability of polyurethanes. Mixing can be done for
improving the properties of individual polymer system. Good outdoor resistance, lower cost
and pigment ability are mainly contributed by acrylic (AC) portion while the better
mechanical stability, chemical resistance, solvent resistance and toughness are because of
PU component (Mequanint et al., 2002).
In UV curable formulations urethane acrylates are amongst the major resins utilized. Class of
isocyanate, molecular weight and nature of polyol and functionality effects the properties of
PU. Better reactivity, firmer cured films, improved chemical & scratch resistance are
achieved with the higher functionality, but this induce the increase in viscosity of resin.
Supple coatings having improved resistance to weather are obtained with aliphatic urethane
acrylates as compared to aromatic ones. Better weathering characteristics are achieved with
polyester based urethane / acrylates copolymer than polyether based urethane / acrylates
copolymer. The flexibility of cured film increases and the reactivity of urethane acrylates
decreases while increasing the molecular weight of polyol (Dzunuzovic et al., 2012). When
polyurethane is copolymerized with acrylate the additional acrylic segments, incorporated
play the role of internal plasticisers (Krol et al., 2005).

13
There are different types of finishing chemicals used in textile wet processing but limited
literature is available on the use of PU in textile finishing (Zia et al., 2011; Zuber et al.,
2011). The softest possible hand, improved crease, tear, recovery & abrasion resistance are
reported to be produced by softeners. They have exceptional role in refining stitching
properties of fabrics (Habereder, 2002). Hashem et al, (2009) considerably upgraded crease
free properties of cotton fabric by the use of ionic crosslinking principle. Amino functional
silicones softeners are commonly used in industry at present for softening finished goods of
textiles. In the established literature none of the researcher has reported the synthesis of
polyurethane acrylate/TiO2 composite for dental applications.
Very less literature is available regarding the synthesis and application of environmentally
friendly binder that can be used in textile finishing (Sultan et al., 2011; Sultan et al., 2012).
Much hard work is carried out to enhance the performance-to-cost ratio of the coatings.
Scientists have dedicated their time and effort for selecting the proper amalgamation of
polyurethanes present for attaining the polymer structure that is well-matched for a specific
particular enduse (Krol et al., 2005). PU acrylate oligomers attained a fast progress in recent
years. Keeping in view exceptional outdoor resistance of acrylic & multipurpose properties
of PUs the present research work is planned for synthesizing PU acrylate copolymers and
composites having the following aims and objectives:-
1. To synthesize and characterize PU acrylate copolymers for textile finishing application.
2. To study the physiochemical and morphological properties of synthesized PU acrylate
copolymer.
3. To prepare and investigate the properties of synthesized PU-PMMA-TiO2-based
composites for dental applications.
4. To study the cytotoxicity, the microscopic and thermo-mechanical properties, of prepared
PU-PMMA-TiO2 based composites.

14
Chapter 2
REVIEW OF LITERATURE
Polyurethanes are extensively used because of their extraordinary physical properties e.g. oil
and solvent resistance, high tensile strength, abrasion and tear resistance, less flexibility, etc.
as well as high versatility in chemical structures. The characteristics of different categories of
urethane polymers are reliant on effectual intermolecular forces, molecular weight, extent of
cross-linking, crystallinity and rigidity of chain segments. Because of several structural
changes that can be carried out in their development, urethanes can be well thought-out the
most extensively used polymers (Kaushik et al., 2011).
2.1. Thermo-Mechanical Properties of polyurethanes
In earlier research on chain extenders, it was found that certain combinations of
diisocyanates and diol of low molecular weight (Minoura et al., 1978) affect the properties of
elastomers. When a plot of the mechanical characteristics of the elastomers against the
number of methylene carbons in low molecular weight diol was drawn, it displayed a typical
zigzag pattern. The patterns were described by the difference in the packing behavior of
polymer chain and ability to form intermolecular hydrogen bonding. The PU having even
number of methylene units in polyol display better chain packing.This was also affirmed by
x-ray diffraction.
The mechanical characteristics are largely affected by the structure and dimensions of hard
and soft segments (Krol, 2007). In polyurethane oligomers, the hard segments give the
structural rigidity its hardness while the soft segments are responsible for its impact
resistance and flexibility (Tielemans, 2006).
Ramesh et al. (1991) made a comparison among the mechanical characteristics of numerous
PUs made using various diols or diamines as chain extenders and revealed that PU samples
that were made by using diamines displayed improved characteristics as compared to ones
extended with diols. It was due to the reason that with increase of intermolecular hydrogen
bonding the aggregating strength improved.
15
Xiao et al. (1995) compared three CEs of different length and found that longer the length of
CE, better were the elastomeric properties of the resulting PU materials
Yen et al. (2003) synthesized non ionic waterborne polyurethanes using two diamines EDA
(ethylene diamine) & DETA (diethylene triamine) as CE having different chain length and
number of reactive sites. He studied certain physical characteristics and dye ability of the
fabricated membranes of the products as well as their blends with the PU synthesized using
1,4 BD as CE. Taking into account the thermal properties of individual PUs, the Tg of
DETA-PU is the largest of the three, followed by EDA-PU, and that of 1,4-BD-PU is the
lowest. When PU is formed using diamines and blended with 1,4-BD-PU, the fabricated
objects display no Tm. The Tg of both PUs synthesized by the incorporation of EDA and
DETA blended with 1,4-BD-PU was increased and became much greater than pure PU. At
a blending ratio of 75/25 it became maximum. As far as mechanical properties are
concerned,.PU synthesized with diamine as CE has higher tensile strength as compared to
1,4BD-PU. The dyeability behavior of fabrics coated with PU synthesized using diamines
(EDA and DETA) as CE are much better as compared to coatings with PU synthesized
using 1,4B-D in terms of dye exhaustion ratio, colorfastness and color yield (K/S).
Rogulska et al. (2007) studied the influence of aliphatic-aromatic α,ω-alkane diols as CE on
the characteristics of polyurethanes and reported that the mechanical properties showed
better behavior as chain increased in length. They revealed that these polymers also exhibited
superb thermal characteristics. Azzam et al. (2007) made a comparison of the influence of
aromatic/heterocyclic diamine CE with aliphatic diols. He revealed that the thermal stability
of PU samples was not influenced by number of methylene units in the aliphatic diol. In their
investigations, the Youngs modulus and tensile strength were higher, whereas elongation at
break was lower at room temperature.
The mechanical properties of restorative materials that are tooth-colored materials are
evaluated using International Organization for Standardization (ISO). Elastic modulus and
hardness are among the numerous mechanical properties assessed for determination of
resistance to occlusal forces. Resistance of a material to penetration or indentation mainly
depends on its hardness. It has been related to ductility of materials, strength and proportional
limit and is used to guess the wear resistance of a material and its ability to abrade or be

16
abraded by opposing tooth structure and materials. Elastic modulus describes the relative
stiffness of a material. In stress-bearing occlusal areas materials having less modulus
undergo more deformation under masticatory strains resulting in catastrophic failure. To
endure distortion and cuspal fracture a great elastic modulus is needed. For cervical cavities,
materials should have a low modulus to allow the material to flex during tooth flexure (Yap
et al., 2004).
2.2. Surface characteristics of PU
Fabulyak and Lipatov (1970) are the pioneer in studying the molecular motion in surface
layers of polyurethane. In daily life wetability of solid surface, specially materials made of
polymers is of great importance (Rager et al., 1999). Manipulating the wettability with water
is vital in various unit processes of recent industrial procedures as well as the end use
properties of several commercial products. Many synthetic polymeric materials repel water
upon contact because they have relatively hydrophobic surfaces. Such hydrophobic surfaces
can be changed to hydrophilic one by employing chemical modification and surface
modification techniques. Wet chemical methods (Regen et al., 1983), corona discharge, close
plasma treatments (Owens, 1975), and other photochemical methods (Ranby et al., 1986) are
used to increase wettability of solid surfaces. The most useful method as chemical
modification is the increase of number of methylene units in alkane diol chain extender and
resulting in final PU (Barikani and Barmar, 1996). Depending on the methods, the nature and
the content, the increasing in number of methylene units in alkane diol CE influences the
bulk, as well as the surface properties. Hydrophilicity and crystallinity increase with
increasing the length of chain extender (Zia et al., 2008). An increase in the surface energy
of solid or decrease in surface tension of the liquid makes a solid surface becomes more
wettable (Noda and Rubingh, 1992). It has also been observed that by increasing CE length
reduces free volume as well as chain mobility in the PU membrane because with increasing
CE length, the conformational freedom for the packing of the hard segment is increased
which leads to better packing of the hard segment. This enhance the surface free energy.
Hence the increase in chain length favours the formation of more ordered structure.There are
several reasons due to which SPUs are used in many fields. To certain substrates they quickly
form hydrogen bonds. With substrates having active hydrogen they form covalent bonds.
They efficiently make the surfaces of most substrates wet and because of exhibiting less

17
viscosity, they can infiltrate permeable substrates. A polymer adapting for any required
application should have better surface properties related to its end use. Surface properties of
segmented polyurethanes are also important, therefore many studies have been done in
order to control and characterize them (Yih and Ratner, 1987; Hearn et al., 1988; Nakame et
al.,1996). Various approaches are applied to change the surface and interfacial characteristics
of segmented polyurethanes (Takahara et al., 1991; Silver et al., 1993; Yoon et al.,1994;
Nakame et al.,1999; Grasel and Cooper, 1989). The structure of the microphase separation
depend on the aptitude of the hard segments for better packing in hard segments. It also
depends on system thermodynamics. Due to their long and ordered arrangement soft
segments form crystalline structure in the segmented PU (Hu and Mondal., 2005).
2.3. Degradation of polyurethanes
Hydrolysis, oxidation, environmental stress cracking and enzymatic attack are common
paths for the degradation of polyurethanes. In recent years degradation of polyurethanes by
enzymes has received much attention (Sarkar et al., 2007)
The aliphatic ester linkages in polyester–urethanes are susceptible to hydrolytic degradation.
Santerre et al. (2005) proposed a mechanical model for the attack by hydrolytic enzymes.
Degradable polyurethanes are generally synthesized using diisocyanates for instance 1,4
diisocyanatobutane and lysine-diisocyanate (LDI, 2,6 - diisocyanatomethyl caproate),
hexamethylene diisocyanate whose final degradation products are more likely to be non-
toxic, i.e. lysine (Santerre et al., 2005).
2.4. Uses of polyurethanes
Different kinds of polymers used for the manufacturing of rubbers, foams (rigid or
flexible), coatings, elastomers, or adhesives can be synthesized depending on the mole ratio
of reagents, nature of isocyanate and polyol, reaction conditions, catalyst etc (Levchick and
Weil, 2004). Polyurethanes belong to a distinctive category of polymers having extensive
uses because by varying their constituents, their properties can be freely changed ( Keskin
and Usnmaz, 2010; Oprea et al., 1999). From the time when polyurethanes were discovered
by Otto Bayer and co-workers in 1937, these have been recognized as an exceptional class
of synthetic polymers having extensive uses. Fibers and molding are manufactured from

18
linear PUs (Urbanski et al., 1977). Many adhesives and coatings are produced from flexible
PUs (Saunders and Frisch, 1964). Sometimes PU based hard coatings are formulated with
stiffer polyurethanes. Rigid and flexible foamed plastics that make up the bulk of PUs
manufactured are being used in several forms (Fried, 1995). Due to their versatility,
polyurethanes have a great demand in the market. Particular usages of PUs are in the
furniture, textile finishing, locomotive, thermal insulation, building, and footwear industries
(Zia et al., 2007). The broad and extensive use of polyurethanes is because of their
outstanding chemical, mechanical and physical properties, superb abrasion resistance and
low temperature flexibility (Gite et al., 2010).
The waterborne coatings susceptible for ultraviolet (UV) curing are now widely used
because of their high curing speed, environment stability and low energy consumption
(Athawale and Kulkarni, 2010). They are utilized in fields such as flooring and furniture
because they have chemical resistance, outstanding mechanical characteristics, high hardness
and gloss. Fang et al. (2011) prepared new thermally resistant UV curable WPU coatings by
incorporating rigid triazine ring moiety into the main chain of PU. It has been studied that
incorporation of rigid chain in UVWPU improves the behaviour of resulting PU in many
aspects such as as water resistance, heat resistance and good mechanical properties. The
optimum dosage of the melamine was 4.70%. The TGA analysis showed that the 5% weight-
loss temperature of changed film was 253οC, that was raised by 105
οC than the UVWPU not
involving melamine. No change in color, crinkle, desquamate, dehisce and foamy were noted
after the changed film dried at 130οC for 2 h.
Another area of PU research is the development of WPU There is reduced product cost and
protection of environment if the organic solvent is replaced with water. In WPU the PU
backbone contains hydrophilic segments. These internal emulsifiers are cationic, nonionic, or
anionic. Depending on the chemical structure and the concentration of the monomers, WPU
can be tailored for use in various applications (Flickinger, 1999). The products of waterborne
polyurethane technology, radiation curable polyurethane dispersions have low volatile
organic content (VOC), rapid curing rate and the coatings show excellent chemical and
mechanical resistance for indoor (Deng et al., 2008; Jiang et al., 2009) and outdoor
applications (Wang, 2005). Waterborne polyurethanes (WPUs) are broadly utilized in
different fields such as coatings, adhesives and paints, since they are non-hazardous,

19
noninflammable and do not pollute the air due to no or little volatile organic compounds
(Dieterich, 1981). Eco-friendly nature, water borne polyurethanes made them a vital category
of polymeric materials in the paint and ink industries (Guo et al., 2012). Rigid PU foams are
used on a large scale mainly as thermal insulating materials and are manufactured mainly on
the base of the components derived from petroleum industry (Kuranska and Prociak, 2012).
2.5. Biocompatable behavior and biomedical uses of polyurethanes
Biologically it is necessary to assure that the novel product that has to be engaged for a
biomedical use will neither bring about adverse reactions nor release toxic compounds. This
can be proved in principle by means of in vitro cytotoxicity tests. For understanding the
interaction of biomaterials with living tissue (Hsu et al., 2010) used cell lines i.e., a culture of
Vero cells. Polyurethane shows biocompatible behaviour itself (Zia et al., 2011). Matsui et
al. (2012) combined polyurethane and chitin in two macromolecular configurations. He
studied the potential application of the two systems as biomaterials. Blends and networks
both exhibited great stability with less loss of mass in media mimicking living tissue.
Adhesion to Vero cells was less and no toxic products were released. These initial results in
vitro indicated that the materials are potentially biocompatible and can be used in biomedical
applications.
Zia et al. (2009) synthesized chitin-based polyurethane elastomers using polycaprolactone
(PCL) varying diisocyanate structure. Extension of the prepolymer was carried out using
1,4-butane diol (BDO) and/or chitin. The spectroscopic characterization of the samples by
the use of FTIR, 1
HNMR and 13
CNMR were in agreement with suggested structure of
polyurethane. By incorporation of chitin as CE and changing the diisocyanates from
aliphatic to aromatic, there was improvement in the mechanical properties. Results revealed
that these polymers can be used as biomedical implants especially surgical sutures. To
improve blood compatibility and hydrophilicity of PU film (He et al., 2011), the chemically
induced graft copolymerization of 2-hydroxyethyl methacrylate (HEMA) onto the surface of
PU film has been done via free radical polymerization using benzoyl peroxide as an initiator.
A platelet-rich plasma adhesion test and hemolysis test was used to evaluate the blood
compatibility of the films grafted. The platelet adhesion experiment showed that
polyurethane grafted polymerization with monomer of 2-hydroxy ethyl methacrylate had

20
good blood compatibility. Hemolysis rate of the PU-g-HEMA films was intensely reduced as
compared to the ungrafted PU films.
Laschke et al. (2010) analyzed invivo and invitro properties of nanosize hydroxyapatite
particles/poly(ester-urethane) (nHA/PU) composite scaffold for bone tissue engineering.
Compared to nHA-free PU scaffolds (control) the novel composite caused greater in vitro
adsorption of model proteins.When the response of inflammatory and angiogenic host tissue
was analysed in vivo in the dorsal skinfold chamber model. It was observed that
biocompatibility and vascularization were not affected by the implanted nHA/PU scaffolds
in comparison to control scaffolds.
Jiang et al. (2007) obtained waterborne polyurethanes with poly(caprolactone) (PCL),
isophorone diisocyanate (IPDI), poly(ethylene glycol) (PEG), 1,4-butandiol (BDO) and L-
lysine.The polymer show enough stability as a uniform dispersant in aqueous phase without
any additional dispersant. The synthesized WPU had very good tensile properties and could
be used as a biomaterial.
The IR and DSC data indicated that when the amount of PEG was increased there was a
change in micro phase separation that resulted in change of tensile properties. The change of
tensile properties as a function of time was the judgment of good biodegradability. The
prepared biodegradable polyurethanes can be used for drug delivery and soft tissue
engineering applications.
Urethane acrylates are explored as biomaterials useful in dental materials, contact lenses,
radiation and thermally sensitive materials. In restorative dentistry the matrix phases of
dental composites, are frequently di(meth)acrylate monomers. For dental applications certain
urethane di(meth)acrylates are also used. They have overcome the shortcomings of
previously available resins (Keskin & Usnmaz, 2010).
2.6. Properties of acrylates
Polyacrylates have exceptional performance in water resistance, solvent resistance and
weather ability as compared to polyurethane resin (Xu et al., 2012). Wang (2011) prepared
acrylate-based copolymer emulsion (ACE) for making humidity controlling inner wall
coatings. The incorporation of porous filler helped in moisture retention up to (274%). It

21
induce the moisture retention capability without any compromise on mechanical properties.
possessed humidity controlling functions. ACE possessed great capability for water
absorption (274%), so interior humidity increases and when the environment is dry or moist
there will be dehumidification. In general the acrylic coatings possess high gloss, hardness,
oxidation, high alkalinity and their resistance to hydrolysis in the course of prolonged
outdoor disclosure (weathering).
2.7. Polyurethane in combination with acrylate
In UV curable preparations urethane acrylates are among the major resins used. Along with
UV curing, kind of isocyanate, kind and molecular weight of polyol involved in synthesizing
are the main controlling factors that influence their properties. Better reactivity and stiffer
cured films with good abrasion and chemical resistance are achieved with higher
functionality, which provide higher degree of crosslinking during curing but this also
increase the viscosity. Much flexible coatings having improved resistance to weather are
obtained with aliphatic urethane acrylates as compared to their aromatic counterparts.
Improved weathering characteristics are exhibited with .polyester urethane acrylates than
polyether urethane acrylates. With the increase in molecular weight of polyol, the reactivity
of urethane acrylates is reduced while flexibility of cured film is increased (Dzunuzovic et
al., 2012). When polyurethane is copolymerized with acrylate, the additional acrylic
segments, incorporated play the role of internal plasticizers (Krol et al., 2005). There is a
great change in chain structure and crosslinking density when acrylate is incorporated in
WPUA. The cross linked polymer exhibits higher molecular weight with complicated
structure and having various functionalities. Hence the performance of WPUA is markedly
influenced by its average functionality and this makes possible to adjust crosslinking
structure and improve the mechanical properties of WPUA (Zhang et al., 2010).
Keskin and Usanmaz (2010) synthesized, low molecular weight hydroxyl terminated
poly(urethane) prepolymer. The hydroxyl ends were capped with acrylate. A macro
monomer was attained which cured to a macromolecule in the final thermosetting polymer or
a comparatively more viscoelastic material of a soft liner. The number-average molecular
weights (Mn) of the polymer synthesized were in the range of 2590–6234 g/mol. NMR,
FTIR spectroscopy equipped with attenuated total reflectance (ATR), DSC, TGA and gel

22
permeation chromatography (GPC), characterized the synthesized polymers. The unreacted
isocyanate groups must be removed to make the polymers applicable as a soft-liner material
in denture applications. They proved that by adopting suitable measures a prepolymer devoid
of remaining isocyanate can be prepared.
Xin et al. (2011) prepared cationic polyurethane-fluorinated acrylic (PUFA) hybrid latexes.
Radical copolymerization of vinyl terminated polyurethane macro monomers with fluorine –
containing acrylate i.e perfluoroalkylacrylate (FA) was carried out. Introduction of FA
monomer in the chain of the PUFA copolymer was confirmed by FTIR spectroscopy and X-
ray photoelectron spectroscopy (XPS). It was seen by particle size distribution analysis
(PSD) that increasing FA content increases particle size of PUFA. Core–shell structure. of
PUFA hybrid was indicated by TEM. A significant collection of fluorine on the film–air
interface, was seen by the analysis of the contact angles (CAs), XPS and atomic force
microscopy (AFM). This was much clear as PUFA hybrid film was annealed at higher
temperature. The effects of the molecular weight, soft segment, the N-methyldiethanolamine
(MDEA) content and the FA content on properties such as the surface tension of the PUFA
latexes, the surface free energy of the PUFA films and the thermal properties were studied.
The results showed that the MDEA content had contrary influence on latex’s and film’s
surface properties. Thermal stabilization usually brought by fluorine was not observed. The
study revealed that the surface tension of the latexes increased as soft segment molecular
weight increased while it decreased by increasing MDEA and FA amount. The surface free
energy of the films increased as the soft segment molecular weight and MDEA amount
increased while decreased with increase of FA content. The thermal stability became less as
MDEA amount increased and the soft segment molecular weight was reduced.
2.8. Polyurethane acrylic dispersions
Polyurethane–acrylic dispersions give very durable film because of the outstanding
mechanical properties, high scratch resistance of polyurethanes and good weathering
properties of the acrylics. Mequanint (2002) prepared phosphated polyurethane–acrylic
dispersions. Improved hydrophobicity and poor wettability of the polyurethane acrylic
dispersion films was shown by dynamic contact angle study. These dispersions are perfectly
suitable as pigment grinding medium due to their shear stability. The WPUA can attain

23
diverse properties and improved performance due to their particular segmented structure and
amendment using acrylate. They are successfully used in coatings for textiles, printing inks,
wood and vehicles, electronic materials, textiles and leather ( Xu et al., 2012). However,
WPU suffer from some weaknesses, such as relatively low heat resistance, poor resistance to
water, and less adhesion in moist atmospheres. These drawbacks consequently restrict their
usage as adhesives and coatings (Liu et al., 2011; Coutinho et al., 2003; Rahman et al., 2008;
Deng et al., 2007). Hence, these shortcomings can be overcome by modifying WPU through
hybridization, blending or cross-linking with other polymers (Wang, 2005; Zhang et al.,
2008; Deng, 2007). Amongst several materials used in WPU modifications, polyacrylate
(PA) is the most often used because of outstanding properties in terms of weatherability,
hardness, gloss and resistance to water. Physical blending of polyurethane and polyacrylate
polymers can be carried out to include their individual advantages. By making blends of
polyurethane with natural polymers, the new materials having improved properties along
with reserved biodegradability are attained. Hydrogen bonding interaction among hydroxyl
and urethane groups is responsible for good miscibility amongst polyurethane PU and
natural polymers in blends (Wang et al., 2009).
If the two polymers are incompatible, it is difficult to achieve ideal composite polymers
because of phase separation during blending. Therefore, sometimes the resultant blend shows
poor performance. Specific interactions can be developed to make two polymers belonging to
separate classes compatible. The processes include seeded emulsion polymerization,
chemical copolymerization and chemical grafting. Brown et al. (2005) made comparison
among cross-linked urethane/acrylic hybrids and physical blends of urethane dispersions and
acrylic emulsions. According to their study the mechanical properties of PU dispersions
based on urethane/acrylic hybrids are superior to those of PU dispersions/acrylic blends of
similar compositions. This is due to the reason that in hybrids the inter-phase compatibility
increases and hence there is better dispersion of phase segments in the hybrids. (Jiang et al.,
2007; Athawale and Kulkarne, 2010).

24
2.9. Polyurethane in blend with other polymers
Polymer blends are receiving much attention from both the scientific and industrial sectors.
Both of them are focusing on polymer blends because they are less expensive replacement
for forming totally new materials.
An effective way of improving the properties of polymers is blending them in suitable
proportions. The properties of blends are controlled by their morphology, properties of their
components and interaction among individual constituents of the blends.
Wan and Luo, (2004) blended ethylene–propylene–diene elastomer (EPDM) with
thermoplastic polyurethane (TPU). With an increase of EPDM, the tensile strength and
elongation at break increased considerably and reached the maximum values of 39.21 MPa
and 2659%, in that order. The blending of EPDM with TPU also improved the
processability of the blends because these systems exhibit decrease in viscosity and
activation energy at high shear rate.
Bao and Shi (2010) synthesized hyper branched polyurethane acrylate (HPUA). They
blended it with epoxy acrylate EB600 and Tripropylene glycol diacrylate, difunctional
(TPGDA) monomer in different ratios. Photo polymerization of the blends was carried out
using a UV lamp in the presence of Runtecure 1104 as a photo initiator at room temperature.
With the addition of only 5 wt% HPUA, rate of photo polymerization and final
unsaturation conversion was maximum. The modulus was not effected while the tensile
strength, of UV-cured films increased on the addition of less than 10 wt% HPUA i.e
62.56MPa for EB / HPUA (90 :10) film. The elongation at break increased continuously on
adding HPUA, attaining 130% in EBHPUA (70 : 30) film. The impact strength was twice
greater in EB/HPUA (70 : 30) film in comparison with pure EB600 film i.e. it also
enhanced on adding HPUA. From the DMTA measurements, it was shown that the Tg
lessened on HPUA addition. The ratios of Ts/Tg indicate HPUA has good compatibility with
EB600/TPGDA resin.
Poly(vinylidene fluoride) (PVDF) has superb mechanical characteristics, outstanding
resistance to chemicals and incredible resistance to weathering. TPUs possess chemical and
abrasion resistance, excellent physical properties ease of processing and good adhesion. By

25
blending these two polymers a high-performance engineering polymer can be manufactured.
Ma and Yang (2008) prepared compatibilized blends of PVDF with TPU using maleated
PVDF (PVDF-g-MA). There was superb compatibilization of PVDF with TPU. Mechanical,
rheological and morphological tests validated this compatibilization. Incorporation of
PVDF-g-MA into the PVDF/TPU blends resulted in an increment in storage modulus and
viscosity. Much finer morphology was clearly observed by SEM. The tensile testing showed
that the tensile strength and ultimate elongation achieved a significant improvement with
addition of PVDF-g-MA.
Matsui et al. (2012) prepared chitin/polyurethane blends for biomedical applications. Their
aim was its use as a biomaterial. The blends obtained were stable having less mass loss in
media mimicking living tissue. Adherence to Vero cells was less and no toxic products were
released indicating biocompatibility of blends and could be used as a biomaterials.
In another study polyurethane/acrylate hybrid composites with composition : 0, 10, 30, 50
and 70 wt. % of acrylic content, were prepared using emulsion polymerization of acrylic
monomers (methyl methacrylate/n-butyl acrylate/acrylic acid mixture. As the amount of
acrylic component was increased, the properties of hybrid film displayed a non-linear
behavior but physical blends exhibit thermodynamic dependence of properties on the PU/AC
mole ratio. The FTIR analysis indicated that acrylic–polyurethane compatibility was better in
hybrid systems as compared to physical blends. Hybrid composites with up to 70 wt.% of
acrylic component are homogeneous by SAXS. AFM analysis showed that blends are phase
segregated systems at all composition levels (Peruzzo et al., 2011).
2.10. Composites of polyurethanes
Kaushik et al., (2011) prepared polyurethane nano composites using modified clay (Cloisite
30B) as filler. The percentage of clay ranged from 0-5 wt % by weight of the nano
composite. Results of TEM and XRD confirmed the effective dispersion of clay in the
polyurethane matrix. TGA results revealed that the thermal stability of nanocomposites
increased with increasing amount of clay. Furthermore, percentage of char raised from 5.6%
to 12% with increasing percent of clay from 0% to 5%. On addition of 5% clay filler the
Young’s modulus enhanced to 300%. As compared to neat polyurethanes these nano
composites possessed poorer absorption of water and diffusivity values.

26
The PU/clay nanocomposites can be prepared by in situ polymerization by the use of
organically modified clay (C30B). It is a montmorillonite charged using quaternary
ammonium salt with one methyl, one tallow and two CH2CH2OH groups. The TPU
nanocomposites comprised of hydroxyl functionality showed the exfoliated clay dispersion
because of interaction among TPUs and the hydroxyl functionalities causing improvement in
mechanical properties (Dan et al., 2006). PU-esparto foams exhibited greater absolute and
normalized thermal conductivities in comparison to similar relative density of PU, PU-MMT
(montmorillonite) and even PU-esparto-MMT foams (Antunes et al., 2011).
It is noteworthy to state that no report is available on the preparation of blends of
polyurethane (PU)-polymethyl methacrylate (PMMA)/TiO2-based composites.
2.11. Restorative dental materials used
During the twentieth century the major restorative material used for teeth was dental
amalgam. The use of dental amalgam is declining intensely in modern dentistry (Lubisich et
al., 2011) . Although there is not much reliable proof available concerning harm produced
due to mercury existing in amalgam (Bellinger et al., 2008; Shenker et al., 2008). Certain
governments have restricted the use of mercury amalgam while others have made decision to
drop it totally from dentistry (Vidnes-Kopperud et al., 2009). For permanent dental
restorations there are currently two main groups, ceramics and composites (Strietzel and
Lahl., 2009). Ceramics (porcelains) are widely used as restorative materials in dentistry
because of their high biocompatibility and aesthetics (Garber and Goldstein, 1994; van
Noort, 2007). The ceramic group is subdivided into polycrystalline and glass ceramics. The
composites are subdivided in macro, micro, hybrid-filled- or nano-composites (Kahler et al;
2008). Ceramics tend to be more rigid and brittle, while composites are more compliant, soft
and stable under high wearing conditions (Coldea et al., 2013). In some countries resin-
based composite have entirely replaced mercury amalgam and their worldwide use continues
to increase (Ferracane, 2011). Recently Opdam et al. (2010), revealed that the performance
of composite restorations was better for large cavities as compared to amalgam. The first
resin-based materials were based on polymethyl methacrylate (PMMA) (Söderholm, 2007).
For nearly 50 years, composite resin has been used as a restorative material in dentistry
(Stein et al., 2005). For dental restorations dimethacrylate-based composites are still

27
presently available in the market (Leprince et al., 2013). Recently, more viable alternative
resins have been introduced through the development of new monomers such as the ‘ring-
opening’ monomers, for example, spiro-orthocarbonates, and epoxy-based resins used in the
silorane-based composites (Weinmann et al., 2005; Ilie and Hickel, 2006) and organically-
modified ceramics (Manhart et al., 2000).
2.12. Additives incorporated in polyurethanes used in dental material
Dentin is a biological composite, which is hydrated, it contains 70% inorganic material, 18%
organic matrix and 12% water (Mannocci, 2004). Throughout the thickness of dentin there
are dentinal tubules which are surrounded by highly mineralized peri tubular dentin and
fluid flows in the tubules in outward direction (Wang and Weiner, 1997). The mechanism of
bonding in current dentin bonding agents relies on the permeation of ambiphilic molecules
inside the acid-etched dentin (Frenkenberger, 1999).
The mechanisms involved in the adhesion between tooth structure and dental adhesives
include micromechanical interlocking, acid–base interactions, physical adsorption, chemical
and ionic bonding. Different scientists have tried to get a more reliable and stronger bond and
simplify the clinical procedure. Generally fresh groups of the dental bonding agents consist
of initiators of polymerization cross-linking agents, functional monomers and solvents. Water
chasing solvents i.e ethanol, acetone cause the bonding monomers perforate in the structure
of dentin which subsequently result in a hybrid layer from polymerized resin and collagen
fibrils (Pashley and Carvalho, 1997). In the presence of initiator the (meth) acrylates are
polymerized and cross linked if the system contains crosslinking agents. Micromechanical
retention then forms in the middle of resin and dentin/enamel surfaces accompanied by the
physico–chemical interactions (Nakabayashi et al., 1982; Solhi et al., 2012). At the resin –
dentin interface the adhesive layer exhibits lowest elastic modulus at the resin–dentin
interface amongst the constituents of the bonded complex. Mechanical properties of the
adhesive layer increase with the incorporation of fillers into the adhesives (Nunes et al.,
2001; Montes et al., 2001). There is increase in elastic modulus of adhesive on incorporation
of fillers, thus a layer having an elastic modulus between dentin and restoration is attained.
This middle layer, along with the resin-impregnated dentin, behaves as an elastic buffer. As a

28
result the resin–dentin interface gains sufficient strain capability to lodge the composite and
dentin both.
PMMA has been used in biomedical applications ever since 1950s as bone cement and as
dental restorative material since 1930s. Mechanical characteristics of PMMA based denture
materials are usually not sufficient for their clinical use (Vuorinenan et al., 2008).
When composites comprising of conservative glass fillers and those containing glass–
ceramic were compared it was exposed that the latter caused an increase in modulus and
flexural strength to a great extent though it did not affect diametric tensile strength (DTS). As
far as porous fillers of (glass–ceramic) are concerned, the porosity caused a sufficient
increment in flexural strength although it did not affect DTS. So porous fillers can be well
thought-out to be important for reinforcing dental composites (Zandinejada, 2006).
Although Rigid Rod Polymer (RRP), (self reinforced polyphenylene) polymer has good
mechanical characteristics, when RRP was incorporated as a filler in denture base resin as
filler, the mechanical properties were not improved. It can be explained on the fact that -
interpenetrating polymer network (IPN) was not formed among RRP fillers and polymer
matrix (Vuorinenan et al., 2008)
Pre polymerized fused fiber filler modified composites (PP-FFMC) particles exhibit the
tendency to improve the wear properties of dental composites much better. The improved
wearing may be attributable to two reasons. Firstly the size of particles incorporated in the
resin matrix was large which resist plucking out better as compared to conservative fillers.
Secondly Al2O3 present in fused fiber filler (FFF) material increased wear resistance as
compared to conventional filler (Ruddell, 2002). By varying the size of the dispersed phase
shrinkage- stress and shrinkage-stress rate also vary in a complicated way. The shrinkage-
stress values of composites with spherical fillers are lower in comparison with composites
having irregular filler particles (Satterthwaite et al., 2012).
Composites containing different amount of silica filler, with different particle size, but
having equal quantity of silanized silica and organic matrix exhibited comparable flexural
strength and flexural modulus. The composite having filler particle of smallest size displayed
lesser flexural modulus (Karabela and Sideridou, 2011)

29
As compared to a composite material containing only micro-fillers, nano-filled and hybrid
resin composites showed better stabilities in translucency and color as when only micro
fillers were present in the composite. Hybrid resin composites having nano- and micro-fillers
mixed in the ratio 2:1 exhibited outstanding stabilities in color and translucency. Moreover,
opalescence stability of nano-filled resin composites was also superior in comparison to
hybrid resin composites (Yu et al., 2010).
Camelleri (2011) studied the hydration characteristics of Portland cement substituted with
30% zirconium oxide mixed at water / cement ratio of 0.3. Calcium hydroxide, calcium
silicate hydrate, and negligible quantities of ettringite and monosulphate were the hydration
products of Portland cement replaced with 30% zirconium oxide mixed at water/cement ratio
of 0.3.When portland cement replaced with 30% zirconium oxide was used as a dental
material (radio pacifier), it oozed calcium ions on hydration. These calcium ions reacted
with phosphates existing in simulated tissue fluids forming calcium phosphate consequently
making bioactive cement that could be used as a root-end filling material. In the hydration
reaction zirconium oxide did not participate, it behaved as inert filler. Dental materials can
be rendered amply radiopaque by adding zirconium oxide .
In dentistry, posterior restorations (class I or II) require composites that show higher
mechanical properties, while anterior restorations (class IV–V) need composites that have
superior esthetics. The resin composite that meets all the requirements of both posterior and
anterior restorations has not emerged yet (Karabela and Sideridou, 2011).
2.13. Titanium dioxide as an additive in polyurethane biomaterials
Titanium dioxide is acknowledged as a versatile material in numerous medical usages.
Titanium and its alloys display the utmost appropriate properties for biomedical applications
owing to their high biocompatibility, corrosion resistance and mechanical strength
(Palmquist et al., 2010). Titanium implants have been successfully used to retain fixed and
removable dental prostheses (Albrektsson, 1995). In bulk form, implants are produced while
its porous structures provides sustenance for living cells (Pohler, 2000; Spoerke et al., 2005).
Resin composites having 0.1–0.25% titanium dioxide nanoparticles could mimic the
opalescence of human enamel (Yu et al., 2009).

30
Titanium dioxide has high mechanical strength, good corrosion resistance, fatigue resistance
(Rack and Qazi, 2006) and biocompatibility (Kasemo, 1983). Due to these characteristics it
can be used in biomedical applications. The reaction of titanium dioxide in biosystem is
intensely determined by the surface characteristics—its morphology, physical properties and
chemistry. By applying various surface modifications, surface properties may be changed
while the crucial bulk characteristics e.g., fatigue resistance and tensile strength (TS) remain
of a titanium oxide layer. Lewandowska et al. (2007) confirmed by XPS that the major
constituent of the titanium surface which is chemically modified is TiO2.
Titanium (Ti) is a familiar metallic biomaterial extensively used in orthopedic, dental and
devices getting in touch with blood. It can integrate well with soft tissues and bones. When
Ti comes in contact with blood plasma, it activates the intrinsic pathway of coagulation and
binds complement factor 3b. The properties of the material depend largely on the nm-thick
dense layer of TiO2 that is quickly formed on contact with air and water (Linderback et al.,
2010). Oh, et al. (2008) synthesized (TiO2) films for implant purposes using electrochemical
process in an electrolyte with sodium silicate solution as an additive. The anodic oxide films
formed displayed the greater precipitation capability of the bioactive Ca–P compounds.
2.14. Finishes in textile industry
Very less literature is available about the preparation and application of environmentally
friendly chemicals that can be used in finishing step in textile industry. Softeners provide the
softest possible hand to make better tear & abrasion resistance, crinkle recovery, and they are
remarkable for making better stitching properties of fabric. Because of these functional
reasons, softener chemicals are involved in nearly each finishing preparation applied to
fabrics (Tomasino, 1992; Mustafa and Fahmy, 2011). The best widely used functional
silicones in textile finishing steps are amino silicones. These are normally used in a micro-
emulsion form, having a droplet size varying from 40–150 nanometres. The oil droplet is
stabilized when emulsifier molecules surround it (Teli, 2000; Kulkarni et al., 2001).
Formaldehyde free long-lasting press finishing agents that can be used for cotton are
multifunctional carboxylic acids (Yang et al., 2000).
Hashem et al. (2009) revealed there is much enhancement in fabric resiliency and
softness degree, while retained strength remains unaffected by post-treatment of cotton

31
fabric (pretreated with carboxy methyl cellulose) with the amino based silicone micro
emulsion (SiE).The concentration of SiE was 30 g/L at pH 4 with a wet pickup of 100%.
Application was followed by drying at 100 ο
C for 5 min and curing at 170 ο
C for 3 min. In
the modified cellulose structure fixation of the amino-functional silicone softener takes place
by formation of semi-inter and/or intra-penetrated network (semi-IPN). As a result
crosslinking as well as softness is increased. Si–O–Si–cellulose complex formation is
confirmed by FTIR. SEM showed that cotton, CMC and ionic crosslinked cotton fabric
treated with SiE displayed greater surface smoothness and significant lessening in bulging
free fibers, trenches and furrows compared with the untreated.
Zuber et al. (2012) used polyvinyl alcohol (PVA) to modify cellulosic fabric. He prepared
solutions of different strength of three different commercial grades of PVA .These were
applied on cellulosic fabrics by pad dry cure method (Zia et al., 2011). Poly(vinyl alcohol)
fixes on the fabric by the formation of semi-inter-penetrated network structure. There was
improvement in rubbing fastness in the treated dyed samples when prepared PVA samples
were applied.
Zia et al. (2012) reported that the application of poly(vinyl alcohol) in the finishing step on
the textile fabrics improved anti-pilling property and increased the stiffness. The pilling is
the trend of the polyester fiber so the fabrics having blends of polyester/cotton displayed
higher pilling rating. Good anti-pilling property was observed in untreated printed fabrics
having same blend ratio as in white PC (i.e., polyester/cotton, 50:50), as compared to white
PC.
Sultan et al. ( 2011a) synthesized copolymers of PUA, based on TDI & IPDI and poly (2-
methyl-1,3-propylene glutarate), diol terminated and studied their physicochemical
characteristics. Solid content of PUA copolymers varied from 35–40% . Cyclo-aliphatic
based PU acrylate copolymers had higher dry weight content in comparison to aromatic
based. Shelf life of aliphatic based PU acrylate copolymer was better. All the prepared
samples had same emulsion appearance. When films were formed by dry heating, TDI based
PU acrylates emulsions gave yellowish tint while the IPDI based emulsion films looked
transparent white. As far as tackiness of the samples is concerned IPDI based films were
tack free while TDI based films displayed slight tackiness. PU acrylate copolymers based on

32
TDI and IPDI displayed same type of chemical resistance, excellent to acid environment
and very good to basic solutions.
Sultan et al. (2011b) has also synthesized polyurethane acrylate copolymers and applied
them on bleached, desized, printed, scoured, 100% cotton combed satin, striped weave
fabrics by dip-padding techniques. Pilling rating and emulsion stability showed double
dependence on the amount of vinyl terminated PU prepolymer. However both these
parameters showed inverse relationship with the percentage of butyl acrylate (BuA).
When the mole ratio of polyol was raised the emulsion stability as well as pilling rating
increased.

33
Chapter 3
MATERIALS AND METHODS
All the research work was done in the Institute of Chemistry, GC University, Faisalabad. The
study was divided into two parts. In this study two different aspects of PU acrylate
copolymers were studied. The description of these is as under.
Part 1 • Synthesis of polyurethane acrylate copolymers for textile applications.
• Spectroscopic, surface characterization, textile applications & testing of the
prepared copolymers.
Part II Polyurethane / Polymethyl methacrylate/TiO2 based composites.
Synthesis of the composites, spectroscopic and thermal characterization of the
composites.
Microscopic evaluation, evaluation of bio-compatibility and mechanical
properties of composites.
Part I Polyurethane acrylate copolymers to be used as finishing
auxiliary in textile
3.1 Chemicals / Instruments
Chemicals and instruments used in the research work are given as
3.1.1. Chemicals
Toluene diisocyanate (TDI), butyl acrylate (BuA), 2-hydroxy ethyl acrylate (HEA) were
bought from Sigma Chemical Co. (Saint Louis MO, USA). PCL, CAPA 2047A (molecular
weight 400), CAPA 2077A (molecular weight 750), CAPA 2100A (molecular weight 1000),
CAPA 2125A (molecular weight 1250), CAPA 2161 (molecular weight 1600), CAPA 2200A
(molecular weight 2000), CAPA 2302A (molecular weight 3000), CAPA 2403A (molecular
weight 4000) were kindly gifted by Perstorp Polyols Inc (Solvay Chemicals). Toledo, Ohio.
Potassium persulphate (KPS), sodium thiosulphate (Na2S2O3), polyoxyethylene glycol
octylphenol ethers, Na2CO3, polyvinyl alcohol (PVA), Montane 80 (HLB=4.3) and

34
Montanox 80 (HLB=15) were purchased from Merck chemicals (Darmstadt, Germany). 1,4-
(BDO), titanium dioxide and dimethyl formamide (DMF) were bought from Sigma Chemical
Co. (Saint Louis MO, USA). Poly-methyl methacrylate was purchased from Merck
Chemicals (Darmstadt, Germany) and used as received.
3.1.2. Instrument / Techniques used in whole study
Shimadzu Fourier Transform Infra-red (FT-IR)
Scanning Electron Microscopy(SEM) JEOL JSM-6490A)
Differential Scanning Calorimetry (DSC) STA-780 )
Universal Test Machine-Table top-50KN (11-250lb 313 Series)
Kruss G10 contact angle measuring system (DSA) (Kruss GmbH
Germany)
μ Quant (Bioteck, USA)
3.2 . Synthesis of Polyurethane
3.2.1. Analysis of Reactants
1. Molecular weight of polyol: The molecular weight of polycaprolactone (CAPA) was
determined using the method described in ASTM D- 4274C
2. Molecular weight of Poly methyl meth acrylate:The molecular weight of
polymethyl meth acrylate (PMMA) was determined by the method reported in
(ASTM D 6641).
3. Isocyanate (NCO) contents in the prepolymer: The isocyanate contents in the
prepolymer were found by titration with n-butylamine (ASTM D 2572-80).
Analytical grade chemicals were used in the research work.
3.2.2. Synthesis
three step synthesis.
a Synthesis of (NCO) terminated (PU) prepolymer (PAC-1)
PU prepolymers were synthesized following the documented method (Barikani &
Hepburn, 1986). At first (2 moles) of hydroxyl terminated poly caprolactone diols
was taken into a four-necked round bottom flask fitted with a heating oil bath, a

35
thermometer, a mechanical stirrer, a reflux condenser & a nitrogen gas inlet system.
Oil bath temperature was raised to 60οC. Under an atmosphere of nitrogen poly
caprolactone diol was stirred constantly for 30 min. Then the temperature was
increased to 80οC & 3 moles of diisocyanate was added to the reaction kettle. During
optimization of the experimental conditions it is confirmed that the synthesis of
(NCO) terminated polyurethane prepolymer completes in one hour. The FTIR
spectrum of the polyurethane prepolymer was taken for checking the progress of
polyurethane prepolymer formation (Scheme 1). The isocyanate contents of the PU
prepolymer were calculated & the reaction was stopped when the determined value
was near to the theoretical value (determined value 9.2%; theoretical value 9.29%).
R1 + R2OOHOCN
NCO terminated PU prepolymer
NCO
Isocyanate Macrodiol
Hn
R1OCN N
H
C O
O
R2O Cn
HN
O
R1 NCO
(a)
R2 =H2
C C*
O
5
Scheme 3.1: Synthesis of isocyanate terminated prepolymer
b Synthesis of vinyl terminated PU prepolymer
After the confirmation regarding the synthesis of NCO terminated polyurethane prepolymer,
the temperature of the reaction kettle was decreased to 60οC. Two moles of 2- HEA was then
added to the reaction mixture. The reaction was allowed to proceed for 30 minutes and a
viscous, milky material was obtained in the reaction kettle (Wang et al., 2008). This is the
indication that the synthesis of vinyl terminated polyurethane prepolymer is complete
(Scheme 3.2). The formation of the vinyl terminated prepolymer was confirmed by FTIR.

36
NCO terminated PU prepolymer
CH2 CH C
O
Vinyl terminated polyurethane prepolymer having unsaturation at its ends
O CH2 CH2 OHHydroxyethyl acrylate
HNC
O
OH2CH2C NH C
O
O C
OHN
n
HN C
O
O CH2
H2CR1 R2O R1 O C C
HCH2
O
OC
O
CH
H2C
(b)
(a)
Scheme 3.2: Synthesis of vinyl terminated PU prepolymer having unsaturation at its ends
c Copolymerization of vinyl end capped polyurethane prepolymer with BuA
As the formation of vinyl end capped polyurethane prepolymer was confirmed, the
copolymerization of vinyl endcapped polyurethane prepolymer was carried out with BuA by
emulsion polymerization. For polymerization to precede the following components were
added. Polyvinyl alcohol-PVA (as protective colloid), a mixture of Montane 80 (HLB=4.3)
and Montanox 80 (HLB=15) in the ratio of 30:70 in order to get the required emulsifier of
HLB value =11.79, that is the required emulsification system for the such polymerization
reaction, potassium persulphate (KPS) with Na2S2O3 (as redox initiator ). So the aqueous
solutions i.e., 10% Montane 80: Montanox 80 (30:70), 3% (w/v) of PVA and 0.2 % of
potassium persulphate (KPS) were prepared separately according to the formulation given in
Table 3.1 and used as required.

37
Vinyl terminated polyurethane prepolymer having unsaturation at its ends
CH C
O
OH2C
Butyl acrylate
Bu
R
CH2
CH
H2C
COOBu
*
n
HC
COOBu
*n
CH
*
H2CHC
COOBu
n
H2C
COOBu
*
n
Proposed PU Acrylate Copolymer
HNC
O
OH2CH2C NH C
O
O C
OHN
n
HN C
O
O CH2
H2CR1 R2O R1 O C
O
OC
O
Where R =
Scheme 3.3 : Formation of proposed PU Acrylate Copolymer
Table 3.1: Formulation for preparing PAC emulsions.
S. no. Constituents Amount
1* Vinyl terminated polyurethane prepolymer 2 g
2* Butyl acrylates 18 g
3 Polyvinyl alcohol 3 g (3% of emulsion)
4 Montane 80: Montanox 80 (30:70) 10 g (10% of emulsion)
5 Potassium persulphate (KPS) 0.2 g (0.2 % of emulsion)
Na2S2O3 One small crystal added in KPS
7 Distilled water 100 mL
*Both first two ingredients were 20% of emulsion
Following the detailed procedure mentioned above, a total of 7 samples of the emulsion of
butyl acrylate and vinyl terminated polyurethane prepolymers using toluene diisocyanate

38
were prepared varying the molecular weight of polycaprolactone diol in the PU prepolymer
step. The detailed formulation and sample code designation of all these samples is given
Table 3.2.
Table 3.2: Sample code designation and different formulation of polyurethane copolymer
varying molecular weight of polycapralactone diols
Sample
code
CAPAa
(MW)
CAPA
Trade
name
TDIb CAPA
c HEA
d VT-PU
e BuAC
f
PAC-1 400 2074A 3 2 2 10% 90%
PAC-2 750 2077A 3 2 2 10% 90%
PAC-3 1000 2100A 3 2 2 10% 90%
PAC-4 1250 2125A 3 2 2 10% 90%
PAC-5 1600 2161A 3 2 2 10% 90%
PAC-6 2000 2200A 3 2 2 10% 90%
PAC-7 4000 2403A 3 2 2 10% 90%
aDifferent molecular weights of Polycaprolactone diol
b Toluene-2,4-diisocyanate (mole ratio).
c Polycaprolactone diol (mole ratio).
d 2-Hydroxyethylacrylate (mole ratio).
e Vinyl terminated polyurethane prepolymer blend (%).
f Butyl acrylate blend (%).
To study the role of isocyanate moiety in the PU structure, the copolymer containing
isophorone diisocyanates (IPDI) and (4,4’-dicyclohexyl methane ) H12MDI were also
synthesized to make polyurethane.Then the polymer was copolymerized with butyl acrylate
with copolymerization reaction as above for TDI. By using the diisocyanates IPDI and
H12MDI, polycaprolactone diol of molecular weight 3000 further two series of samples of the
emulsion of butyl acrylate and vinyl terminated polyurethane prepolymers were prepared in
which the amount of VT-PU and BuAC was assorted progressively. The detailed formulation

39
and sample code designation of all these samples is given Table 3.3 and Table 3.4
respectively.
Table 3.3: Sample code designation and different formulation of polyurethane copolymer
using isophorone diisocyanate
Sample code CAPAa
(MW)
CAPA
Trade
name
IPDIb CAPA
c HEA
d VTPU
e BuAC
f
PAC-8 2200 2302A 3 2 2 10% 90%
PAC-9 2200 2302A 3 2 2 20% 80%
PAC-10 2200 2302A 3 2 2 30% 70%
PAC-11 2200 2302A 3 2 2 40% 60%
PAC-12 2200 2302A 3 2 2 50% 50% a Polycaprolactone diol
b Isophorone diisocyanate (mole ratio).
c Polycaprolactone diol (mole ratio).
d 2-Hydroxyethylacrylate (mole ratio).
e Vinyl terminated polyurethane prepolymer blend (%).
f Butyl acrylate blend (%).
Table 3.4: Sample code designation and different formulation of polyurethane copolymer
using 4,4’-dicyclohexyl methane (H12MDI)
Sample code CAPAa
(MW)
CAPA
Trade
name
H12MDIb CAPA
c HEA
d VTPU
e BuAC
f
PAC-13 2200 2302A 3 2 2 10% 90%
PAC-14 2200 2302A 3 2 2 20% 80%
PAC-15 2200 2302A 3 2 2 30% 70%
PAC-16 2200 2302A 3 2 2 40% 60%
PAC-17 2200 2302A 3 2 2 50% 50% a Polycaprolactone diol
b 4,4’-dicyclohexyl methane (H12MDI) (mole ratio).
c Polycaprolactone diol (mole ratio).
d 2-Hydroxyethylacrylate (mole ratio).
e Vinyl terminated polyurethane prepolymer blend (%).
f Butyl acrylate blend (%).

40
3.3 . Characterization
The synthesized PU Acrylate Copolymers were characterized by the technique itemized in
segment 3.1.2. Detailed explanation of the procedures and techniques is given as :
3.3.1. Techniques
3.3.1.I. Fourier Transform Infrared Spectroscopy
Fourier transform infra red spectra of PU acrylate emulsions were attained in ATR mode by a
Bruker-IFS 48 FT-IR spectrometer (Ettlingen, Germany). The IR spectra were taken in
wavelength region 400-1000 cm-1
.
3.3.1.II. SEM analysis
A focused beam of electrons scannes and creates images of sample in SEM. The electrons of
the beam interact with the electrons of the sample, the output of the different signals, which
are detected and which contain information about the topography of the surface of the sample
and the composition. The beam of electrons is scanned in a template rule raster scan, and the
position of the beam combine to create the detected signal into an image.
A small sample of PU-PMMA/TiO2 blends specimen was fixed into the sample chamber,
which could accommodate specimen up to 15cm in height. The samples were made
electrically conductive by coating with a thin layer of gold film using JEOL sputter coater
before analysis. Morphological studies were examined by Scanning Electron Microscopy
(JEOL JSM-6490A) at 20 kV and x33 and x100 magnifications
3.3.1.III. Differential scanning calorimetry
To comprehend the changes taking place in thermal characteristics of PU/PMMA TiO2
composites, DSC analysis was carried out by Perkin Elmer Thermal Analysis under nitrogen
atmosphere.
3.3.1.IV. Compression Test
Compression testing provides mechanical strength and properties of rigid cellular materials
under compressive loads. The compressive strength of polymer composite materials was

41
determined using the standard test method-ASTM D6641 (ASTM, 2004). In this test the
specimens are centered between two compression platens and the compressive load is applied
at a constant crosshead rate of 2.5 mm (0.1 in/min) for each 1 inch of sample thickness
Throughout the test crosshead travel and load are recorded. Depending on the characteristics
of the stress-displacement curve compressive strength can be determined in one of two
manners. Strain can more accurately be determined using an extensometer that measures the
distance between the upper and lower compression platens.
3.3.1.V. Contact angle measurement
To study extent of surface wettability the contact angle was measured, on a θ measuring
system (Kruss, Germany). This instrument makes use of precision optics and computer
control discs (CCD) cameras in combination with image processing hardware & software for
performing contact angle analysis accurately, easily and quickly. The contact angle () was
measured by five methods, Tangent method-1 (T-1), Tangent method-2 (T-2), Half Width
method ( HW), Circle fitting method (CIR) and Sessile drop fitting method (L-Y) at
controlled room temperature (20C) using Kruss (Germany), instrument having a software
for a drop shape analysis. Deionized water was used as the test liquid. Each given value is
the mean of 10 measurements.
3.3.1.VI. μ Quant
The μ Quant is a single-channel microplate spectrophotometer for research and development
and in vitro diagnostic use, designed to automatically perform endpoint analysis.. The
instrument has a long-life xenon flash light source, a holographic grating-based
monochromator, and UV grade fiber optics and lenses. This combination allows for
absorbance measurements in a spectral range from 200 nm to 999 nm in 1-nm increments.
The instrument bandpass is 2.4nm.
3.3.1.VII. Solid contents:
In order to measure solid contents, weighed volume of emulsion was taken in an aluminum
cup. The emulsion was then dried by placing in dry heating oven at 60ο till constant weight.
The solid contents were calculated as
Weight of unfilled aluminum cup =X

42
Weight of aluminum cup and PAC =Y
Weight of the aluminum cup and PAC after heating =Z
Z-XSolid contents (%) = 100
Y
3.3.1.VIII. Physical characterization and colorfastness properties
The appearance, stability of emulsion and tackiness of films were noted continuously and
reported. The colorfastness to rubbing and change in shade of the printed treated fabrics after
treatment with PAC copolymer were assessed using standard assessment system (ASTM,
2004).
3.3.1.IX. Pretreatment of fabric substrate having 50/50, 45/56 cotton/polyester blend
ratio
Mill desized, un-scoured, un-bleached grey fabrics and desized, scoured, bleached, white,
printed and dyed poly cotton, plain weaved fabrics (with almost 50/50, 45/56
cotton/polyester blend ratio) was provided by Sadaqat Textiles Mills Ltd., Khurrianwala,
Faisalabad, Pakistan. The characteristics i.e., quality of the fabrics, construction, count, blend
ratio, etc., are given in Table 3.3. Before treatment with PU acrylates copolymer, further
decontamination of fabric was done by washing in the laboratory at 100οC for 60 min by the
use of a solution comprising 2 g/L, Na2CO3 and 1 g/L, polyoxyethylene glycol octylphenol
ethers: C8H17–(C6H4)–(O–115 C2H4)1–25–OH: (Triton X-100), a nonionic surfactant
(BASF). A number of times the fabric was rinsed with hot water, then with cold water and
dried under prevailing environment.
3.3.1.X. Fabrics treatment with PAC copolymers emulsion
PAC emulsions containing different molecular weight of polycaprolactone diol were
prepared. Then various dilutions (i.e., 15 g/L, 30 g/L and 50 g/L) of the prepared PAC
samples were made and applied onto the plain weave poly-cotton fabrics as grey,
bleached,printed and dyed.(Table 3.5). After application of PUAC emulsion the fabric pieces
were dried at 100οC for 4 min and then cured at 140
οC for 5 min.

43
Table 3.5: Fabrics specification with quality and processed applications
S.
no.
Quality Construction/count Blend ratio
cotton/polyester
Processed application
01 Plain weave poly
cotton
(60×60/20×20) 49/51 White
02 Plain weave poly
cotton
(60×60/22×22) 52/48 Grey (unbleached)
03 Plain weave poly
cotton
(76×68/30×30) 51/49 Dyed with reactive dyes
04
05
Plain weave poly
cotton
Plain weave poly
cotton
(100×80/40×40)
(76×68/30×30)
52/48
44/56
Pigments printed
Pigment printed
3.3.1.XI. Pilling characterization
The plain weaved poly-cotton fabrics samples (Table 3.3) after being finished with different
dilutions of PU acrylate copolymer emulsions were assessed using pilling standard test
procedure ASTM D-3514-02.
3.3.1.XII. Antimicrobial evaluation
The dyed & printed treated & untreated fabrics were subjected to evaluate the antimicrobial
activity. For inhibition studies actively growing bacterial cells were utilized. First of all 1000
ml nutrient agar medium was prepared and poured 150 ml in each of four flasks. The flasks
containing nutrient agar medium was autoclaved for 15 minutes at 120οC then allowed to
cool. In to the above four flasks, 15μL of each kind of bacteria i.e., S. aureus, B. subtilus, E.

44
coli and P. multocida; were added. The nutrient agar medium, round twenty millilitre (mL)
was transferred into sterile petri dishes and left it, so as to solidify at ambient temperature.
When nutrient agar medium was solidified the fabric samples were placed on the solid
surface & kept in an incubator at 37oC for twenty four hours. Bacterial growth is inhibited in
a zone around the sample.After 24h the zones of inhibition were measured in millimeter
(mm).
Part II
Polyurethane/Polymethyl methacrylate/TiO2 based composites.
3.4. Chemicals
Toluene diisocyanate (TDI), BDO, titanium dioxide & dimethyl formamide (DMF) were
bought from Sigma Chemical Co (USA). PCL, CAPA 2403A (molecular weight 4000) were
kindly gifted by Perstorp Polyols (Solvay Chemicals) Inc. Toledo, Ohio. Poly-methyl
methacrylate was purchased from Merck Chemicals (Darmstadt, Germany). Its molecular
weight was confirmed following the method reported in the literature (ASTM 2004). Before
using the polyol and BDO were dried at 80C in vacuum for 24 h so that water vapors & air
bubbles are completely removed. The molecular weight of CAPA 2403A was confirmed by
the procedure reported in ASTM D-4274C. Toluene diisocyanate & the rest of chemicals
were used as received. All the reagents utilized in the present research were of analytical
grade and were used as such or otherwise have mentioned.
3.5. Synthesis of Polyurethane / Polymethyl methacrylate/TiO2 based
composites
3.5.1. Synthesis of polyurethane
The preparation of polyurethane prepolymers was done according to the recommended
method, however the conditions were optimized for this reaction system. At first 1 mole of
hydroxyl terminated poly caprolactone diol (polyol) CAPA2403A (Molecular weight 4000)
was taken into a reaction flask fitted with a mechanical stirrer, heating oil bath, & a nitrogen
gas inlet system. Oil bath temperature was increased to 60οC. Poly caprolactone diol was
melted and stirred constantly in an atmosphere of nitrogen gas for thirty minutes. Then 10

45
moles (Table 3.4) of toluene diisocyanate was poured into the reaction kettle with the help of
dropping funnel & the temperature was increased to 80οC. During optimization of the
experimental conditions it is confirmed that the formation of (NCO) terminated polyurethane
prepolymer completes in one hour. The progress of polyurethane prepolymer reaction was
confirmed by taking a FTIR spectrum of the polyurethane prepolymer. The amount of
isocyanate groups in the PU prepolymer were found & these values were close to the
theoretical value (determined value 9.27%; theoretical value 9.29%). PU prepolymer was
converted into final PU by stirring the prepolymer constantly & then adding CE, 1,4-butane
diol (9 moles). When the reaction mixture became homogenous, the dispersal of CE was
taken to be complete. A sheet of even mass was obtained when the liquid polymer was cast
into a Teflon plate. Curing of the prepared polymer was done by placing the Teflon sheet in
oven at 100οC for twenty four hours. The synthetic pathway for the preparation of PU is
presented in Scheme 3.4.

46
Scheme 3.4: Synthesis of PU
3.5.2 Preparation of blends of polyurethane-poly methyl methacrylate (PMMA) and TiO2
Different blends were prepared by dissolving different compositions of PU and PMMA
(Table 3.6) in dimethyl formamide (DMF). Titanium dioxide (2.5% of weight of polymer)
was added to the blends of PU and PMMA. Complete dispersion of TiO2 in the blends was
obtained by continuous stirring using magnetic stirrer for three hours. The solvent was
evaporated by heating in oven at 110οC.

47
Table 3.6: Sample code designation and different formulation of polyurethane and
PU/PMMA/TiO2 blends
Sr.
No.
Sample
Code
Formulation of polyurethane Composition
(PUd/PMMA
e)% by mass
Percentage of
TiO2 in the blends TDI
a CAPA
b BDO
c
1 PUACT 1 10 1 9 0/100 2.5
2 PUACT 2 10 1 9 10/90
2.5
3 PUACT 3 10 1 9 20/80 2.5
4 PUACT 4 10 1 9 40/60 2.5
5 PUACT 5 10 1 9 60/40 2.5
6 PUACT 6 10 1 9 80/20 2.5
7 PUACT 7 10 1 9 100/0 2.5 a Toluene-2,4-diisocyanate (mole ratio)
b Polycaprolactone diol (mole ratio)
c 1,4 butane diol (mole ratio)
d Polyurethane (%)
e Polymethyl methacylates (%)
3.5.3 .Preparation of pellets from blends
After the preparation of PU/PMMA/TiO2 based composites, the pellets were prepared using a
self-designed mechanical assembly (Fig 3.1) with controlled pressure. The cylinder ‘a’ is
placed into the cylindrical cavity ‘d’. The material whose pellets are required is placed inside
through the open mouth of the ‘d’, and the bolts ‘b’ and ‘c’ are fixed at the both ends of the
cylindrical volume ‘d’. A torque wrench is used to press the material placed inside the
cylindrical volume between the solid cylinder ‘a’ & bolt c inside‘d’. For this purpose 0.5 g
of the prepared material was placed inside the self-designed mechanical tool for the pellet
formation. The material inside the cylindrical volume was pressed using a pressure of 112
Nm2
with the help of torque wrench. After applying pressure the whole assembly was placed
in an oven at 150οC for 40 minutes. Then the assembly was taken out from the oven, allowed
to cool to room temperature and the formed pellet was recovered. In this way all other
pellets were prepared.

48
Fig 3.1: Self designed tool for preparing pellets (a) cylinder; (b & c) bolts;
(d ) cylindrical volume.

49
3.6. Characterization
Spectroscopic, thermal and microscopic characterization was carried out using the techniques
explained in section 3.3.1.
3.6.1. Evaluation of Biocompatability
3.6.1.I. Hemolytic activity
In order to evaluate biocompatibility, a cytotoxicity test was conducted using cell lines.
Hemolytic activity of the pellets was studied by the reported procedure (Sharma and Sharma,
2001) with some modification. For this purpose 3 mL of fresh blood was obtained from
human volunteers after consent and counseling. The blood was heparinized and centrifuged
for five minutes at 2500 rpm. Plasma was discarded and the cells were washed thrice with
5 mL of chilled (4oC) disinfected isotonic phosphate-buffered saline (PBS) pH 7.4.
Erythrocytes were kept (108 cells per mL) for every test. A 100 μL solution of each pellet
dissolved in dimethyl formamide was mixed with human erythrocytes (108cells/mL)
separately. Samples were kept in an incubator for 30 minutes at 37oC & shaken slightly after
10 minutes. Instantly following incubation, the samples were kept at 0C to 4 C for 5
minutes then centrifuged for 5 minutes at 2500 rpm. Then 100 μL of supernatant from each
tube was diluted 10 times with chilled PBS (4oC). Triton X-100 (0.1% v/v) was used as
positive control and phosphate buffer saline (PBS) was taken as negative control. The
absorbance was recorded at 576 nm using a μ Quant. The percent (%) RBCs lysis for each
sample was determined.
3.6.1.II. Mutagenic study by Ames bacterial reverse-mutation test (fluctuation test)
Reagent mixture comprising of Davis-Mingioli salt, D-glucose, bromo-cresol purple, D-
Biotin and L-Histidine were mixed aseptically in a sterile bottle. Reagent mixture, extract,
sterile deionized water, strains and standard mutagens were mixed in several bottles at the
amount indicated in Table 3.7.

50
Table 3.7: Set-up of the mutagenic study by Ames bacterial reverse-mutation test
(fluctuation assay)
Treatment
Volume added (ml)
Mutagen
standard Extract
Reagent
mixture
Deionized
water
Salmonella
test strain
Blank - - 2.5 17.5 -
Background - - 2.5 17.5 0.005
Standard
mutagen 0.1 - 2.5 17.4 0.005
Test sample - 0.005 2.5 17.5 0.005
Two mutant strains Salmonella typhimurium TA98 and TA100 were used. A 200 µL of the
prepared contents were dispensed into each well of a 96-well micro-titration plate. The plate
was placed in an air tight plastic sample holder to prevent evaporation and incubated at 37 ºC
for 4 days. The blank plate was observed first and the rest of plates were read only when all
wells in the blank plate were colored purple indicating the assay was not contaminated. The
background, standard, and test plates were scored visually and all yellow, partial yellow or
turbid wells were scored as positive wells while purple wells were scored as negative. The
extract was considered toxic to the test strain if all wells in the test plate showed purple
coloration. For an extract to be mutagenic, the number of positive wells had to be more than
twice the number of positive well in the background plate.

51
Chapter 4
RESULTS AND DISCUSSION
The research work was divided into two parts. The key purpose of the first part of this
research effort was the synthesis and characterization of PU acrylate copolymers and
evaluate their importance as finishing agents in textile industry. For this purpose
polyurethane acrylate copolymers were synthesized, according to the route outlined in
section 3.2.2. Two moles of hydroxyl terminated (ε- polycaprolactone) diol (section
3.2.2.1) was reacted with three moles of different diisocyanates. This lead to the
formation of –NCO terminated prepolymer (section 3.2.2.2) which gave a vinyl
terminated PU prepolymer on reaction with two moles of hydroxyl ethyl acrylate. To
copolymerize BuA with vinyl terminated polyurethane (section 3.22.3) emulsion
copolymerization was carried out in the last step. In the second part polyurethane/
polymethyl methacrylate titanium dioxide based composites were prepared.The detail of
their preparation is given in section 3.5.
Part 1
4.1. Molecular characterization of PUA copolymer emulsion based on
TDI
The PU acrylate copolymers synthesized in this research work were characterized to
confirm proposed molecular structure using FT-IR spectroscopy. This technique was
used as a key tool to monitor the every step of the synthetic pathway. After a chemical
reaction the appearance of new functional groups in a molecule can be easily identified by
using FTIR analysis. By placing a sample in the beam, if the frequency of radiation
matches the vibrational frequency of polar groups present in the molecule then it will
cause a change in the amplitude of molecular vibrations and the outcome is presented as
the infrared spectrum of the sample. An infrared spectrum is called fingerprint of a
sample. No two compounds can have the same IR spectrum because the combination of
atoms in each compound is different. So it helped in deciding the completion of various
steps in the synthetic pathway.
FTIR spectra of all the monomers and individual polymerization steps were recorded and
presented in Fig.4.1. FTIR spectra of (TDI), hydroxy terminated poly (ε-caprolactone

52
diol), isocyanate (NCO) end capped PU prepolymer acquired by reacting TDI and
hydroxy terminated poly (ε-caprolactone diol), hydroxy ethyl acrylate (HEA), vinyl
terminated PU prepolymer, butyl acrylate (BuA) and polyurethane acrylate copolymers
are collectively displayed in Fig.4.1. The assignment of peaks of the important functional
groups are presented and interpretted. FTIR spectrum of TDI (Fig. 4.1a) displays a very
sharp and an intense peak at 2241.28 cm−1
which correspond to the (–NCO) groups of
the TDI structure. The FT-IR spectrum displays strong peaks at 1516.05 cm−1
attributed
to the C C stretching of benzene ring. The peaks assignment of FTIR spectrum of poly
(ε-caprolactone) diol is presented in Fig 4.1b. The peak observed in the functional group
region of poly (ε-caprolactone diol) are assigned as : 3534 cm−1
(OH stretching
vibration); 2937.59 cm−1
(asymmetric CH2 stretching); 2876 cm−1
(symmetric CH2
stretching); 1724.36 cm−1
(CO stretching); 1168.86 cm−1
(CO stretching). These two
monomers (TDI & PCL) were reacted in the reaction flask and the reaction was
continued for 1 h at 100C. After optimization of the experimental conditions, it was
observed that formation of PU prepolymer is completed in 1h and isocyanate terminated
PU prepolymer is formed. FT-IR spectrum of isocyanate terminated polyurethane
prepolymer is shown in Fig. 4.1c. It can be clearly seen from the spectrum that the
reaction of isocyanate group with the OH group of the PCL has been completed and the
peak for the OH groups disappeared. The intensity of peak depicting (–NCO) groups has
been reduced to certain level with the result that (–NCO) terminated PU prepolymer has
been prepared. The peak associated with NH units appeared at 3239 cm−1
(Fig. 4.1c)
infers the appearance of urethane linkage. The other peaks observed in the FT-IR
spectrum of PU prepolymer were allocated as: 2930 cm−1
(CH2 symmetric stretching);
2893 cm−1
(CH2 asymmetric stretching ) 2267 cm−1
(isocyanate (–NCO) group); 1726
cm−1
(CO stretching of soft domain of poly (caprolactone) diol; 1190 cm−1
(CO
stretching of soft domain). The vanishing of sharp peak at 2241.28 cm−1
(–NCO) and the
presence of less sharp peak at 2267 cm−1
(–NCO), is a proof that the reaction has taken
place and the NCO terminated PU prepolymer has been prepared. The PU prepolymer has
also shown some of the characteristic absorption peaks (Fig. 4.1c) as: 1605 cm−1
(CC),
1534 cm−,11530 cm
−1 (N–H & C–N, bending and stretching respectively), 1720 cm
−1
(CO stretching) and 3339 cm−1
(N–H stretching). Further reaction of isocyanate
terminated PU prepolymer with 2-HEA following the established method was carried
out (Sultan et al., 2012). The FTIR spectrum of 2-HEA (Fig. 4.1d) has shown many

53
characteristics peaks i.e., a broad peak at 3433.29 cm−1
correspond to OH stretching
vibration; 2923.78 cm−1
, attributed to asymmetric CH2 stretching; 2883.58 cm−1
, assigned
to symmetric CH2 stretching; 1714.15 cm−1
, ascribed to C O stretching; 1545 cm−1
relates to CC stretching; 1193.94 cm−1
, consigned to C–O, C–C stretching. The vinyl
terminated polyurethane prepolymer was formed by reacting isocyanate terminated
polyurethane preplymer and 2-hydroxy ethyl acrylate. FTIR spectra of vinyl terminated
polyurethane polymer displays a well-defined peak of N–H stretching at 3333 cm−1
. This
peak is a very clear inference of the urethane linkage in the vinyl terminated polyurethane
prepolymer (Fig. 4.1e). The CH stretching of CH2 group was observed at 2929.87 cm−1
.
The FT-IR spectrum displays very intense peaks at 1716.65 cm−1
and 1531.48 cm−1
which
are attributed to the CO and CC stretching. respectively. It can be clearly seen in the
FTIR spectrum of vinyl terminated polyurethane prepolymer that isocyanate (NCO) peak
has been vanished. This indicates that NCO contents are completely utilized with that of
2-hydroxy ethyl acrylate forming vinyl terminated PU prepolymer. The chain extension
of vinyl terminated polyurethane prepolymer was carried out by adding butyl acrylate
(BuA). The FT-IR spectrum of BuA is presented in Fig. 4.1f. The FTIR spectrum of BuA
showed distinct characteristic peaks which are assigned as: 2949.16 cm−1
(asymmetric
CH2 stretching); 2832 cm−1
(symmetric CH2 stretching); 1724.36 cm−1
(CO stretching);
1534 cm−1
(CC stretching); 1188.15 cm−1
(C–O, C–C stretching). Formation of PU
acrylate copolymers takes place on reacting butyl acrylate with that of vinyl terminated
PU prepolymer. The FTIR spectrum of finally synthesized PU acrylate copolymers is
presented in Fig.4.1g. The FTIR spectrum shows characteristics peaks ie., 3371.57 cm−1
,
attributed to N–H stretching; 1693.49 cm−1
, correspond to carbonyl stretching; and
2929.87 cm−1
, 2847.70 cm−1
ascribed to CH2 anti-symmetric and symmetric stretching,
respectively. The perfect evidence concerning vibrational mode alterations owing to
incorporation of BuA in the polyurethane backbone in the course of the polymerization
reaction can be attained and hence the completion of the reaction can also be best studied
through FTIR analysis technique. It is worth to mention that the completion of
polymerization reaction can be confirmed by the appearance or disappearance of some
characteristics peaks. In this connection it can be seen that in the FTIR spectrum the
isocyanate (NCO) peak at 2267 cm−1
disappeared and the new N–H group displayed a
new peak at 3371.57 cm−1
which confirm the completion of polymerization reaction and
hence formation of proposed PU acrylate copolymer.

54
It is necessary to state that the N-H group in PU is able to form hard-hard segment H-
bonding with the carbonyl oxygen and hard-soft segment H-bonding with the ether
oxygen. The stronger hard-hard domain H-bond behaves as physical crosslinking sites
resulting in restricted segmental motion of the polymer chain leading to substantial phase
segregation among hard and soft domains. The phase segregation makes better
mechanical characteristics of polyurethanes, however, there is reduction in flexibility of
the resulting polyurethane (Lu et al., 2003; Subramani et al. 2004).

55
Fig 4.1: FT-IR spectra of monomers and final PU acrylate copolymers: (a) toluene-2,4-
diisocyanate (TDI); (b) Polycaprolactone diol(CAPA); (c) NCO terminated
polyurethane prepolymer; (d) 2-hydroxyethylacrylate (HEA); (e) vinyl
terminated polyurethane prepolymer; (f)butyl acrylate (BuA); (g) final
polyurethane acrylate copolymers

56
4.2. Physical characterization
The results regarding physical characterization of PU acrylate copolymers (PAC) varying
molecular weight of poly (ε-caprolactone) diols are presented in Table 4.1. Physical
characteristics of PAC samples such as solid contents (%), appearance of emulsion,
tackiness, film appearance and emulsion stability are reported in (Table 4.1). These
parameters are essential for extensive usage of emulsions in numerous applications. Solid
content of the prepared copolymer emulsions ranges from 33–36% which are in good
agreement with that of (Sultan et al., 2012). The results reported in Table 4.1 emphasis
that dry weight content of PU acrylate copolymer sample PAC-1 is smaller in
comparison to the PAC-7, although, equal amount of the vinyl terminated polyurethane
prepolymer was taken during emulsion polymerization with BuA. This slight continual
increase in the solid contents can be explained on the basis of gradual increase in
molecular weight of the macrodiols. So by increasing the molecular weight of the poly (ε-
caprolactone) diol, the resultant emulsion showed gradual increase in solid contents (%).
It is worth mentioning that high solid contents sample have a short drying time and form
film of uniform thickness.
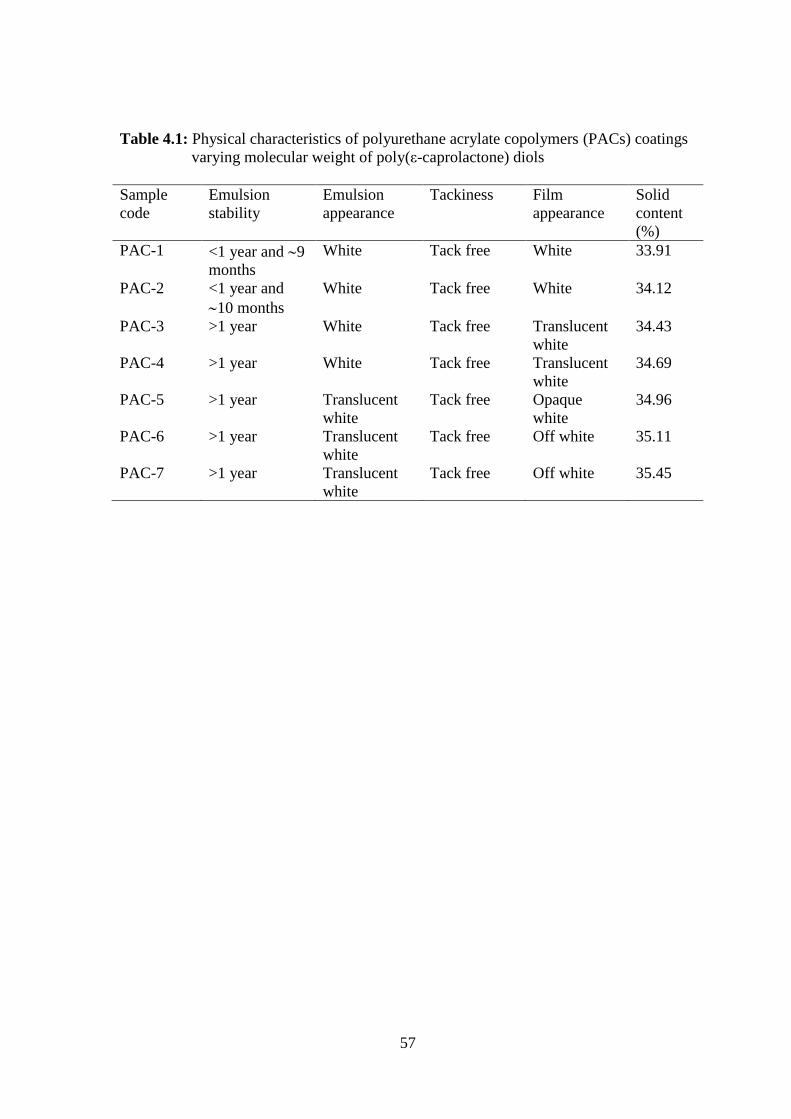
57
Table 4.1: Physical characteristics of polyurethane acrylate copolymers (PACs) coatings
varying molecular weight of poly(ε-caprolactone) diols
Sample
code
Emulsion
stability
Emulsion
appearance
Tackiness Film
appearance
Solid
content
(%)
PAC-1 <1 year and 9
months
White Tack free White 33.91
PAC-2 <1 year and
10 months
White Tack free White 34.12
PAC-3 >1 year White Tack free Translucent
white
34.43
PAC-4 >1 year White Tack free Translucent
white
34.69
PAC-5 >1 year Translucent
white
Tack free Opaque
white
34.96
PAC-6 >1 year Translucent
white
Tack free Off white 35.11
PAC-7 >1 year Translucent
white
Tack free Off white 35.45

58
The appearance of emulsion in all the studied samples is almost same i.e., white or
translucent white, however, samples containing molecular weight up to 1250 g/mol showed
white appearance and remaining showed translucent white. Tackiness is another physical
characteristic of the coated material. Regarding tackiness, all the prepared samples are tack
free. A gradual increase in translucency of the emulsion with increase in molecular weight of
poly (capro lactone) diols has been observed. It looks that the relatively more polarity of the
ester linkage in the poly (ε-caprolactone) diols (CAPA) moiety is responsible for this effect.
The results presented in Table 4.1 revealed that the stability of the emulsion in all the
synthesized PU acrylate copolymer samples continually increases by increasing the
molecular weight of PCL. By using low molecular weight PCL i.e., 400 and 750, the
stability of the emulsion is ~9 and ~10 months, respectively. However by using higher
molecular weight of PCL (>1000), the stability of the emulsion is observed greater than 1
year. The preparation of PU dispersion has been reported by many researchers (Dieterich and
Dieterich, 1973) and polyelectrolyte properties of polyurethane have also been filed time to
time. They also explained polyelectrolyte phenomenon of PU and correlated with the
stability of emulsions. Polyurethane may only show polyelectrolyte properties if there are
some specific functional groups (capable of carrying positive or negative charge) attached to
the polyurethane backbone. But in present study the length of flexible soft segment increases
with the increase in Mn of CAPA. The ester linkage of CAPA in the polymer controls the
hydrophilic properties, hence stability increase down the series. However in this case, no
such group is attached and the emulsion stability may be attributed to the biphase nature of
the PAC emulsion. It has been observed and reported in the above lines that the color of the
emulsion changes from white to translucent white by increasing the molecular weight of the
poly (ε-caprolactone) diol. The increase in translucency might be because of micelle
formation in the polymer chains having high molecular weight of CAPA. Therefore, with
increasing the molecular weight of the polyurethane acrylates copolymers, the stability
increases. However, if the molecular weight is too high, it will not dissolve in the solution
and instead of increasing stability it will form gel lumps, and ultimately results to decrease
molecular weight of CAPA 4000 g/mol (CAPA 2403A), the emulsions remain stable. The
resultant pattern of stability of the emulsion in the synthesized samples will have great
influence on the treated fabric samples yielding high tensile strength & stretch ability,

59
outstanding film forming properties, good body and handle for finished fabrics, exceptional
fastness to washing, resistant to dry cleaning, excellent pill resistance and high crease
resistance.
4.3. Colorfastness properties
The fastness of a material means the resistance of a material to change in any of its color
characteristics, to transfer of its colorants to adjacent material as a result of exposure of the
material to any environment that might come across in the duration of processing, testing,
storage or use of material. The behavior of the fabrics to resist the change in color to the
various testing parameters are called the colorfastness properties. In this research work the
rubbing or crockfastness of textile fabrics treated with PUAC emulsions were assessed and
compared with untreated one. The rubbing fastness of fabric samples was determined by
using a manual crockmeter. The rubbing hammer of this crockmeter was wrapped with dry or
wet white standard cotton cloth. It was rubbed against the sample fastened to the testing table
for ten cycles. Two white bleached fabric specimens were used for each fabric sample, one
for the dry and other for the wet tests. The cloth was then removed to evaluate the discolor
level in comparison with the standard gray scale. The effects on colorfastness to rubbing (dry
and wet) are displayed in Fig. 4.2. The results revealed that the treatment of polyurethane
acrylate copolymers has marked effect on the crockfastness properties of all the treated fabric
swatches. The untreated fabric sample has shown dry and wet rubbing rating 3 and 2/3,
respectively, whereas all the treated fabric swatches have shown dry rubbing rating in the
range of 3/4 to 4, and wet rubbing rating in the range of 3 to 3/4. The results presented in Fig.
4.2 clearly show that all the treated fabrics swatches exhibit certain improved resistance to
crocking. Though, the samples treated with polyurethane acrylate copolymer containing low
molecular weight of PCL have shown some lightly poor crock fastness as compared to those
containing high molecular weight. The display of such results might be because of formation
of stable tough coating layer on the treated fabrics. The performance of PAC emulsion based
on high molecular weight PCL is slightly better than those of containing lower molecular
weight PCL. This is very interesting display of structure property correlation. It looks that in
case of high molecular weight PCL the resulting PAC has high number of polar ester group
incorporated in the polymer chain. These provide more opportunity and have maximum
60
inter-chain interaction and polymer substrate interaction which results in better performance.
This improvement in the crock fastness of all the treated fabric swatches comes jointly with a
significant chemical versatility because of the existence of acrylic and urethane groups. It
has been reported in the established literature that PU show better solvent and chemical
resistance, and toughness (Sultan et al., 2012) while acrylic component on the other hand
shows high outdoor resistance and pigment ability (Kukanja et al., 2000). The combination
of both these components will ultimately show the better resistance against crocking. It is
also well known that acrylate polymer fit in a class of polymers that are talked normally as
plastics and are known because of their resistance to breaking, elasticity and transparency.

61
Fig.4.2: Colorfastness to rubbing data of treated and untreated printed poly-cotton fabric samples used for testing (ISO X12)

62
4.4. Pilling characterization
The pills are localized minor disturbances randomly spread on the surface. Observers rate
the pilling appearance of a fabric in visual evaluation by comparing pill properties such as
density, height and size to those of the visual standards. The first impression that an observer
probably will get when examining a pilled sample is pill density. It is often estimated by the
number of pills in a unit area. If pills are randomly or uniformly distributed over the selected
area for counting pills then this definition is accurate. When clomping occurs the results will
significantly vary with the area. A more rational estimator of pill density is based on the
distance of pills to their nearest neighbours. The length between two centers is the nearest
distance of two pills. The average size of pills is another important factor manipulating
pilling appearance. The contrast between a pill and its surrounding region reflects the height
of the pill. In a gray scale image, the contrast between two regions is measured by the
difference in intensity. In order to make the results obtained by the pilling evaluation system
consistent with the visual standards, the ASTM photographic pilling standards is first
analyzed using the system and the rating equation is built based on the pilling properties of
these photographs. There is no significant difference between grade 1 & 2 although the
average size of pills has a decreasing trend when the pilling grade increases, this is because
pills are worn off as their size increases to a certain level. Hence, for rating pilled samples
average pill size is not sufficient. The density and % area of pills show relatively lucid
decreases with the pilling grade, though the relationships are non linear. Finishing plays a
critical role in pilling. Its main role is to stabilize the fibers inside the yarn and minimize
protusion of loose fibers out of the fabric surface, hence reduce the process of surface naping.
This can be achieved via heat setting, singeing, brushing, cropping or with chemical
treatment. In this study poly-cotton fabric swatches have been treated with polyurethane
acrylate copolymer in order to get better pilling rating. The results presented in Table 4.2
show clear separation lines among the five pilling propensity groups and a progressive trend
between the no pilling (rating 5) and the most severe pilling (rating 1) samples. The results in
Table 4.2 show that the 10 pilling samples (8 experimental samples and 2 standard samples)
are successfully classified into five pilling grades. The results (Table 4.2) revealed that there
is a pronounced effect of PU acrylate emulsion over the pilling rating of the treated fabric
swatches. By increasing the molecular weight of the PCL there is continual increasing in the

63
pilling rating. Hence, the high molecular weight of polyol (CAPA) is known to be the most
effective in better pilling rating. This may be attributed to the better emulsion stability of the
synthesized polymeric emulsions. By increasing the molecular weight of the poly (ε-
caprolactone) diols, the emulsion stability continually increased. It is worth mentioning that
pure cellulosic fabrics do not show any pilling tendency itself, so all the observed pilling
rating in the treated or untreated fabrics is due to the polyester fibers which has been blended
in the poly-cotton fabrics during spinning. Consequently, by increasing the molecular weight
of PCL the number of ester unit increases, and it should result in poor pilling rating. But in
this study, the reverse results have been observed and the reason may be attributed to the
excellent penetration of the synthesized material into the fabrics due to very small micelle
size. Further this decrease in micelle size may result because of high molecular weight of the
poly (caprolactone) diol used in the formulation. It is worthwhile mentioning that high
molecular weights always result to produce small micelle size which is evident from the
translucent appearance of emulsion. This small micelle size will certainly provide better
opportunity of penetration in terms of antipilling behavior, alter the fabrics roughness to the
rich hand soft. It can be observed that all the treated fabrics swatches displayed relatively
good results in comparison to standard samples obtainable from the market. In comparison to
all the samples, PAC-7 displayed excellent results. The reason for this performance is good
stability of emulsion and compatibility of the co-polymerized samples.

64
Table 4.2: Pilling evaluation rating of white, grey, dyed and printed fabrics after application of of series PAC samples in different
dilutions
*The sample available in the market under the trade names
Sample code
Strength of solution
applied
Type of fabric
White (60×60/20×20)
15g/L 30g/L 50g/L
Grey (unbleached) (60×60/22×22)
15g/L 30g/L 50g/L
Dyed (76×68/30×30)
15g/L 30g/L 50g/L
Printed (100×80/40×40)
15g/L 30g/L 50g/L
PAC-1 2/3 2/3 3 2 2 2 3 ¾ 4 ¾ 3/4 4/5
PAC-2 2/3 2/3 3 2 2/3 2 3 ¾ 4 ¾ 4 4/5
PAC-3 2/3 2/3 3 2 2/3 2/3 3/4 ¾ 4 4 4 4/5
PAC-4 3 3 3 2 2/3 2/3 3/4 ¾ 4 4 4 4/5
PAC-5 3 3/4 3/4 2 2/3 2/3 3/4 4 4 4 4/5 4/5
PAC-6 3 3/4 3/4 2/3 3 3 3/4 4 4/5 4/5 4/5 4/5
PAC-7 3/4 3/4 3/4 2/3 3 3 3/4b 4 4 4/5 4/5 4/5
Untreated sample 1/2 1/2 2/3 3
Std. sample
1(EFD*)
2 2 3 3
Std. sample 2 (SE*) 2 2 3 3

65
4.5. Antimicrobial activity
Polyurethane is a biocompatible and has been reported several times in the literature (Zia et
al., 2009a: Zia et al., 2009b). In this study an attempt has been made in order to check the
antimicrobial activity of the poly-cotton fabrics treated with PU acrylate copolymer samples
(Table 4.3). Conferring to disc diffusion assay, the printed fabric samples on which the
polyurethane acrylate emulsions were applied showed inhibition towards all pathogenic
bacteria including Bacillus subtilus and Staphylococcus aureus which are gram positive and
Eschericia coli and Parmatella multocida which are gram negative bacteria. All the
emulsions showed comparable activity against gram positive and gram negative bacteria.
Yagci, et al, (2011) prepared self-stratifying antimicrobial polyurethane coatings and
reported that the resultant films displayed very effective antimicrobial activity against both
the gram-positive Staphylococcus aureus and gram-negative Escherichia coli type bacteria. It
can be seen that the antimicrobial activity of the untreated fabric is better as compared to
PAC samples having low molecular weight of PCL moieties in PU backbone (PAC-1).the
fabric sample treated with PAC emulsion having low molecular weight of PCL moieties in
PU backbone (PAC-1). It has been reported that untreated fabrics showed some degree of
antimicrobial activity (AATCC, 1993). All the copolymer samples synthesized from butyl
acrylate and PU based on TDI and CAPA of various molecular weights have shown very
promising antimicrobial activity. However, the activity of these copolymer samples increases
by increasing the polymer chain length of poly (ε-caprolactone) based macrodiols. The
increase in the chain length of CAPA displays gradual increase in hydrophilicity. It is well
understood that the antimicrobial activity depends on the hydrophilicity of PU samples
because hydrophilic surfaces offer close interaction with aqueous microbe suspension which
results in the better performance of hydrophilic polyurethane acrylate copolymers. It has also
been observed that the antimicrobial activity response towards different bacteria is different.
Regarding the comparison between the gram positive and gram negative bacteria, the
reduction rate of E. coli is slower as compared to that of S. aureus (Denyer, 1995). Prolonged
interaction time is required for inactivation of E. coli than S. aureus.(Fig. 4.3)

66
Fig 4.3: Photograph presenting the antimicrobial evaluation of treated fabrics using
diffusion assay.

67
Table 4.3: Antibacterial activity of printed and dyed poly-cotton fabrics using polyurethane acylate copolymer emulsions (50g/L)
against a panel of bacterial species assayed by disc diffusion method
Sample
code
Inhibition zone (mm) in printed fabric (100×80/40×40) Inhibition zone (mm) in dyed fabric (76×68/30×30)
Bacterial
species
Bacillus
subtilus
Staphylococcus
aureus
Eschericia
coli
Parmatella
multocida
Bacillus
subtilus
Staphylococc
us aureus
Eschericia
coli
Parmatella
multocida
PAC-1 12 12 12 12 - -
PAC-2 12 13 14 12 - -
PAC-3 14 14 15 13 - - - -
PAC-4 15 16 16 14 - - - -
PAC-5 16 16 17 15 14 14 12 -
PAC-6 18 18 17 15 14 14 13 12
PAC-7 20 21 19 16 15 15 14 13
Untreated
sample
13 13 13 12 - - - -
All the readings are average of four determinations.

68
The prepared polyurethane acrylate emulsions were also applied on to the dyed fabric
swatches and antimicrobial results are presented in Table 4.3. It was observed that the
untreated fabric swatches and swatches treated with PU acrylate emulsions having low
molecular weight of PCL have not shown any inhibition zone. It means growth of none of
the bacteria (Eschericia coli, B. subtilus, S. aureus and P.multocida) was inhibited by such
fabric swatches. Both gram positive and gram negative bacteria have shown comparable
trend to the dyed fabrics swatches treated with PAC samples having high molecular weight
of poly (caprolacone ) diols. However, the zone inhibition shown by B. subtilus and S. aureus
is slightly greater than E. coli and P. multocida. The results revealed that the bacterial
inhibition activities depended on bacterial strains. In the dyed treated fabrics although all the
treated samples have shown comparable trend. In comparison to the dyed and printed treated
fabrics swatches, the printed fabrics swatches displayed better results in comparison to the
dyed one. Such results might be due to strong binder layer formed over the surface of the
printed fabrics. On the other hand the dyed fabrics swatches may have developed some
temporary link with PU acrylates which showed cyto-toxicity and less or non-antimicrobial
activity.

69
Table 4.4: Contact angle measurement of dyed samples using water as polar liquid and varying molecular weight of PCL
Sample
code
CAPA
(Molecular
weight)
Contact angle θ
Time required for
disappearance of drop
(sec)
Tangent
method-
1 (T-1)
Tangent
method-2
(T-2)
Half Width
method ( HW)
Circle fitting
method (CIR)
Sessile drop
fitting method
(L-Y)
PAC-1 400 109 109 104 104 108 150
PAC-2 750 96.5 95.3 92.8 90.2 94.6 120
PAC-3 1000 94.2 95.4 91.9 90.3 89.5 100
PAC-4 1250 80 80.2 85 82 89 90
PAC-5 1600 75.6 89.5 77.1 76.9 72.8 60
PAC-6 2000 65.8 64.2 70 68.5 67 30
PAC-7 4000 60.2 57.2 55.8 56.9 53.1 5
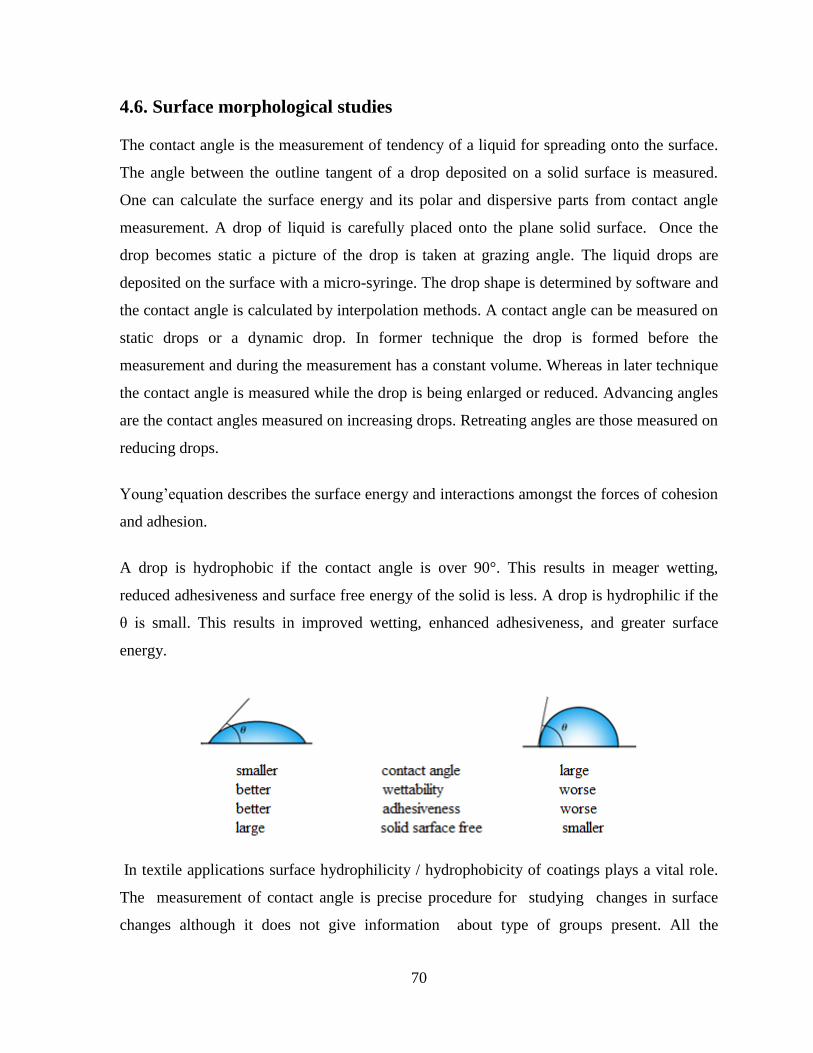
70
4.6. Surface morphological studies
The contact angle is the measurement of tendency of a liquid for spreading onto the surface.
The angle between the outline tangent of a drop deposited on a solid surface is measured.
One can calculate the surface energy and its polar and dispersive parts from contact angle
measurement. A drop of liquid is carefully placed onto the plane solid surface. Once the
drop becomes static a picture of the drop is taken at grazing angle. The liquid drops are
deposited on the surface with a micro-syringe. The drop shape is determined by software and
the contact angle is calculated by interpolation methods. A contact angle can be measured on
static drops or a dynamic drop. In former technique the drop is formed before the
measurement and during the measurement has a constant volume. Whereas in later technique
the contact angle is measured while the drop is being enlarged or reduced. Advancing angles
are the contact angles measured on increasing drops. Retreating angles are those measured on
reducing drops.
Young’equation describes the surface energy and interactions amongst the forces of cohesion
and adhesion.
A drop is hydrophobic if the contact angle is over 90°. This results in meager wetting,
reduced adhesiveness and surface free energy of the solid is less. A drop is hydrophilic if the
θ is small. This results in improved wetting, enhanced adhesiveness, and greater surface
energy.
In textile applications surface hydrophilicity / hydrophobicity of coatings plays a vital role.
The measurement of contact angle is precise procedure for studying changes in surface
changes although it does not give information about type of groups present. All the

71
interaction forces among liquid and the outer most monolayer of test specimen material are
measured with it. When the interactions amongst the phases under study are strong, the drop
of liquid spreads on the solid and makes it wet. The results regarding contact angle of water
with the fabric on which prepared PAC samples have been applied are listed in Table 4.4.
By increasing the molecular weight of PCL, there is a continual decrease in contact angle. It
can also be seen that the time required for disappearance decreases from 150 seconds to 5
seconds. The results present in Table 4.4 revealed that the water drop disappear in 150
seconds from the surface of sample PAC-1 whereas it disappear very quickly (just in 5
seconds) from the surface of PAC-7. These variations can be attributed to the increased
hydrophilicity of the prepared samples with increase in molecular weight of PCL. In case of
high molecular weight PCL, the resulting PAC has high number of polar ester group
incorporated in the polymer chain and increase in chain length show gradual increase in
hydrophilicity. It is well known that, the hydrophilic surface gives a low contact angle
because it has high surface energy and therefore, spreads the drop of polar liquid, while the
hydrophobic surface have a low free energy gives a high contact angle (Garbassi, et al.,
1998). In other words, a solid surface can be made more wettable either by lowering the
surface tension of the liquid or by increasing the surface energy of the solid (Zia et al, 2009).
4.7. Molecular characterization of PUA copolymer emulsion based on
H12MDI
FTIR spectra of all the monomers and individual polymerization steps were recorded. FTIR
spectra of (H12MDI), isocyanate (NCO) end capped PU prepolymer acquired by reacting
H12MDI and hydroxy terminated poly (caprolactone diol), vinyl terminated PU prepolymer
and propposed polyurethane acrylate copolymers are displayed in Fig.4.4 while the FTIR
spectra of hydroxy terminated poly (caprolactone diol), Hydroxy ethyl acrylate (HEA) and
Butyl acrylate (BuA) are displayed in Fig.4.1 The assignment of peaks of the important
functional groups are presented and interpretted. FTIR spectrum of H12MDI (Fig. 4.4a)
displays a very sharp and an intense peak at 2258.71 cm−1
which correspond to the (–NCO)
groups of the H12MDI structure. The FT-IR spectrum displays peak at 2930.52 cm−1
attributed to the CH2 symmetric stretching of cyclohexane ring while the peak at 2862.35
cm−1
corresponds to CH2 antisymmetric stretching. The peaks assignment of FTIR spectrum

72
of poly (caprolactone) diol is presented in Fig 4.1 and interpreted in section 4.1. The peak
observed in the functional group region of poly (caprolactone diol) are assigned as: 3534
cm−1
(OH stretching vibration); 2937.59 cm−1
(asymmetric CH2 stretching); 2876 cm−1
(symmetric CH2 stretching); 1724.36 cm−1
(CO stretching); 1168.86 cm−1
(CO stretching).
These two monomers (H12MDI & PCL) were reacted in the reaction flask and the reaction
was continued for 1 h at 100C. After optimization of the experimental conditions, it was
observed that formation of PU prepolymer is completed in 1h and isocyanate terminated PU
prepolymer is formed. FT-IR spectrum of isocyanate terminated polyurethane prepolymer is
shown in Fig. 4.4b. It can be clearly seen from the spectrum that the reaction of isocyanate
group with the OH group of the PCL has been completed and the peak for the OH groups
disappeared. The intensity of peak depicting (–NCO) groups has been reduced to certain
level with the result that (–NCO) terminated PU prepolymer has been prepared. The peak
associated with NH units appeared at 3325.33 cm−1
(Fig. 4.4b) infers the appearance of
urethane linkage. The other peaks observed in the FT-IR spectrum of PU prepolymer were
allocated as 2945.30 cm−1
(CH symmetric stretching of CH2 groups); 2268.64 cm−1
(isocyanate (–NCO) group); 1724.36 cm−1
(CO stretching of soft domain of poly
(caprolactone) diol; 1165 cm−1
(CO stretching of soft domain). The vanishing of sharp peak
at 2258.71 cm−1
(–NCO) and the presence of less sharp peak at 2258.64 cm−1
(–NCO), is a
proof that the reaction has taken place and the NCO terminated PU prepolymer has been
prepared. The PU prepolymer has also shown some of the characteristic absorption peaks
(Fig. 4.4b) as: 1521.84 cm−,1
1463.97 cm−1
(N–H & C–N, bending and stretching
respectively). Further reaction of isocyanate terminated PU prepolymer with 2-HEA
following the established method was carried out (Sultan et al., 2012). The FTIR spectrum of
2-HEA displayed in Fig. 4.1d and interpreted in section 4.1.
The vinyl terminated polyurethane prepolymer was formed by reacting isocyanate terminated
polyurethane prepolymer and 2-hydroxy ethyl acrylate. FTIR spectra of vinyl terminated
polyurethane pre polymer displays a well-defined peak of N–H stretching at 3375.43 cm−1
.
This peak is assigned to creation of urethane linkage in the vinyl terminated polyurethane
prepolymer (Fig. 4.4c). The CH symmetric stretching of CH2 group was detected at 2935.87
cm−1
while assymetric stretching at 2862.36. The FT-IR spectrum displays very intense
peaks at 1720.50 cm−1
and 1521.84 cm−1
which are attributed to the CO and CC

73
stretching, respectively. It can be clearly seen in the FTIR spectrum of vinyl terminated
polyurethane prepolymer that isocyanate (NCO) peak has been vanished. This indicates that
NCO contents are completely utilized with that of 2-hydroxy ethyl acrylate forming vinyl
terminated PU prepolymer. The chain extension of vinyl terminated polyurethane prepolymer
was carried out by adding butyl acrylate (BuA). The FT-IR spectrum of BuA is presented in
Fig. 4.1f and interpreted in section 4.1. Formation of PU acrylate copolymers takes place on
reacting butyl acrylate with that of vinyl terminated PU prepolymer. The FTIR spectrum of
finally synthesized PU acrylate copolymers is presented in Fig.4.4d. The FTIR spectrum
shows characteristics peaks ie., 3354.21 cm−1
, attributed to N–H stretching; 1730.15 cm−1
,
correspond to carbonyl stretching; and 2962.66cm−1
, 2847.70 cm−1
ascribed to CH symmetric
and assymmetric stretching respectively. The perfect evidence concerning vibrational mode
alterations owing to incorporation of BuA in the polyurethane backbone in the course of the
polymerization reaction can be attained and hence the completion of the reaction can also be
best studied through FTIR analysis technique. It is worth to mention that the completeness of
polymerization reaction can be confirmed by the appearance or disappearance of some
characteristics peaks. In this connection it can be seen that the isocyanate (NCO) peak at
2258.72 cm−1
in the FTIR spectrum disappeared and the new N–H group displayed a new
peak at 3354.21 cm−1
which confirm the completion of polymerization reaction and hence
formation of proposed PU acrylate copolymer.

74
Fig 4.4.a FT-IR spectrum of H12MDI
Fig 4.4.b: FTIR spectrum of NCO terminated polyurethane prepolymer prepared by
reacting H12MDI and CAPA 2000

75
Fig 4.4.c: FTIR spectrum of vinyl terminated PU prepolymer prepared by reacting
H12MDI based NCO terminated PU prepolymer and HEA
Fig
4.4.d: FTIR spectrum of proposed PU acrylate copolymer synthesized by the
emulsion copolymerization of H12MDI based vinyl terminated PU and BuA

76
4.8. Molecular characterization of PUA copolymer emulsion based on
IPDI
FTIR spectra of all the monomers and individual polymerization steps were recorded. FTIR
spectra of (IPDI), isocyanate (NCO) end capped PU prepolymer acquired by reacting IPDI
and hydroxy terminated poly (caprolactone diol), vinyl terminated PU prepolymer, and
polyurethane acrylate copolymers are displayed in Fig. 4.5 while the FTIR spectra of
hydroxy terminated poly (caprolactone diol), Hydroxy ethyl acrylate (HEA) and Butyl
acrylate (BuA) are displayed in Fig.4.1. The assignment of peaks of the important
functional groups are presented and interpretted. FTIR spectrum of IPDI (Fig. 4.5a) displays
a very sharp and an intense peak at 2247.07 cm−1
which correspond to the (–NCO) groups of
the IPDI structure. The FT-IR spectrum displays peak at 2951.09 cm−1
attributed to the CH2
symmetric stretching of benzene ring while CH2 bending is displayed at 1463.97. The peak
at 1359.82 is for C(CH3)2 present on the carbocyclic ring of IPDI. The peaks assignment of
FTIR spectrum of poly (caprolactone) diol is presented in Fig 4.1b. and interpreted in
section 4.1. These two monomers (IPDI & PCL) were reacted in the reaction flask and the
reaction was continued for 1 h at 100C. After optimization of the experimental conditions, it
was observed that formation of PU prepolymer is completed in 1h and isocyanate terminated
PU prepolymer is formed. FT-IR spectrum of isocyanate terminated polyurethane
prepolymer is shown in Fig. 4.5b. It can be clearly seen from the spectrum that the reaction
of isocyanate group with the OH group of the PCL has been completed and the peak for the
OH groups disappeared. The intensity of peak depicting (–NCO) groups has been reduced to
certain level with the result that (–NCO) terminated PU prepolymer has been prepared. The
peak associated with NH units appeared at 3325.33 cm−1
(Fig. 4.5b) infers the appearance of
urethane linkage. The other peaks observed in the FT-IR spectrum of PU prepolymer were
allocated as: 2945.30 cm−1
(CH symmetric stretching of CH2); 2945.30 cm−1
2258.64 cm−1
(isocyanate (–NCO) group); 1724.36 cm−1
(CO stretching of soft domain of poly
(caprolactone) diol; 1165 cm−1
(CO stretching of soft domain). The vanishing of sharp peak
at 2247.07 cm−1
(–NCO) and the presence of less sharp peak at 2258.64 cm−1
(–NCO), is a
proof that the reaction has taken place and the NCO terminated PU prepolymer has been
prepared. The PU prepolymer has also shown some of the characteristic absorption peaks
(Fig. 4.5c) as: 1521.84 cm−,11463.97 cm
−1 (N–H & C–N, bending and stretching

77
respectively). Further reaction of isocyanate terminated PU prepolymer with 2-HEA
following the established method was carried out (Sultan et al., 2012). The FTIR spectrum of
2-HEA is displayed in Fig. 4.1d and interpreted in section 4.1.
The vinyl terminated polyurethane prepolymer was formed by reacting isocyanate terminated
polyurethane preplymer and 2-hydroxy ethyl acrylate. FTIR spectra of vinyl terminated
polyurethane polymer displays a well-defined peak of N–H stretching at 3743.83 cm−1
. This
peak is assigned to creation of urethane linkage in the vinyl terminated polyurethane
prepolymer (Fig. 4.5c). The CH symmetric stretching of CH2 group was detected at 2927.94
cm−1
and asymmetric stretching at 2862.36 cm−1
. The FT-IR spectrum displays very intense
peaks at 1714.42 cm−1
and 1541.12 cm−1
which are attributed to the CO and CC stretching
respectively. It can be clearly seen in the FTIR spectrum of vinyl terminated polyurethane
prepolymer that isocyanate (NCO) peak has been vanished. This indicates that NCO contents
are completely utilized with that of 2-hydroxy ethyl acrylate forming vinyl terminated PU
prepolymer. The chain extension of vinyl terminated polyurethane prepolymer was carried
out by adding butyl acrylate (BuA). The FT-IR spectrum of BuA is presented in Fig. 4.1f and
interpreted in section. Formation of PU acrylate copolymers takes place on reacting butyl
acrylate with that of vinyl terminated PU prepolymer. The FTIR spectrum of finally
synthesized PU acrylate copolymers is presented in Fig. 4.5d. The FTIR spectrum shows
characteristics peaks i.e., 3356.14 cm−1
, attributed to N–H stretching; 1730.15 cm−1
,
correspond to carbonyl stretching; and 2962.66cm−1
, 2847.70 cm−1
ascribed to CH symmetric
and anti-symmetric stretching respectively. The perfect evidence concerning vibrational
mode alterations owing to incorporation of BuA in the polyurethane backbone in the course
of the polymerization reaction can be attained and hence the completion of the reaction can
also be best studied through FTIR analysis technique. It is worth to mention that the
completeness of polymerization reaction can be confirmed by the appearance or
disappearance of some characteristics peaks.In this connection it can be seen that in the
FTIR spectrum the isocyanate (NCO) peak at 2258.72 cm−1
disappeared and the new N–H
group displayed a new peak at 3354.21 cm−1
which confirm the completion of
polymerization reaction and hence formation of proposed PU acrylate copolymer.

78
Fig 4.5.a: FTIR spetrum of IPDI
Fig 4.5.b: FTIR spectrum of NCO terminated PU prepolymer based on IPDI prepolymer
prepared by reacting IPDI and CAPA 2000
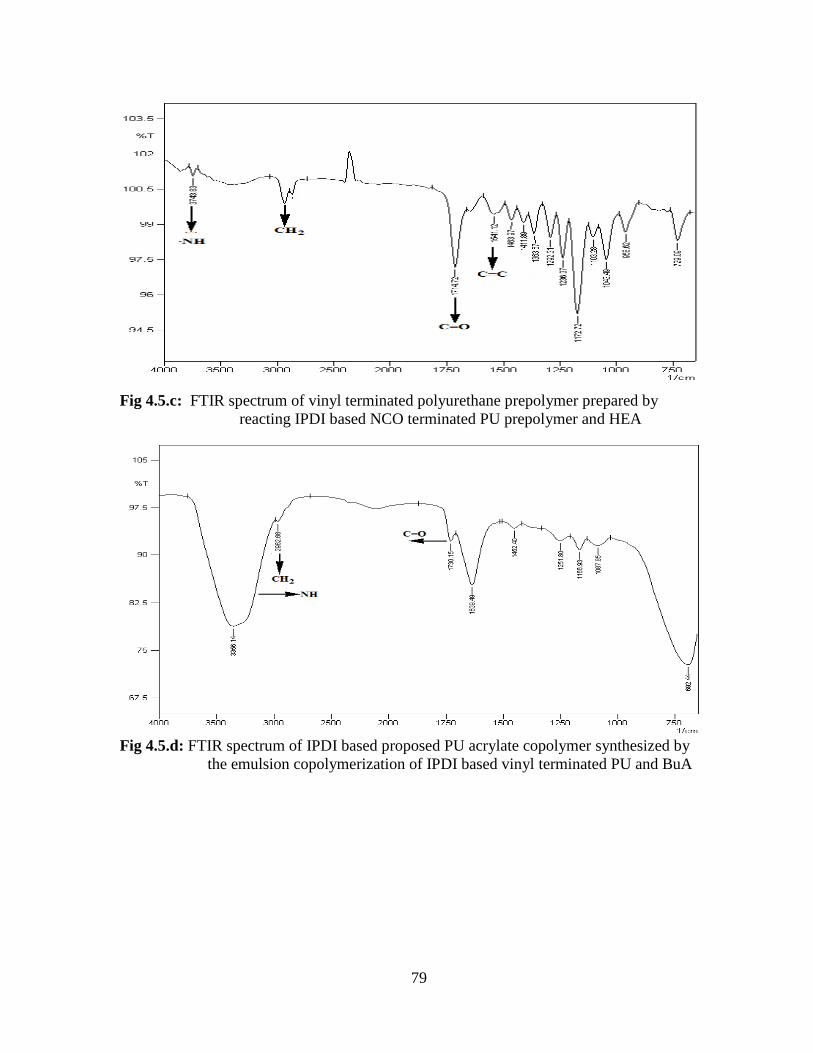
79
Fig 4.5.c: FTIR spectrum of vinyl terminated polyurethane prepolymer prepared by
reacting IPDI based NCO terminated PU prepolymer and HEA
Fig 4.5.d: FTIR spectrum of IPDI based proposed PU acrylate copolymer synthesized by
the emulsion copolymerization of IPDI based vinyl terminated PU and BuA

80
4.9. Colorfastness and pilling characteristics of fabric after application of
IPDI based PAC copolymer samples
4.9.1. Colorfastness properties of printed fabric
The results of colorfastness to rubbing (dry and wet) of printed samples treated with
synthesized IPDI based PU acrylates are presented in Fig.4.6. The printed untreated fabric
swatch has shown dry and wet rubbing rating 4 and 3, respectively, whereas printed treated
fabric swatches have shown the dry rubbing rating in the range of 4 to 4/5, and wet rubbing
rating in the range of 3/4 to 4. The results revealed that the treatment of polyurethane
acrylates copolymers has pronounced effect on the crock fastness properties of all the treated
fabric swatches. The dry rubbing fastness of the treated printed fabric has shown much better
rating as compared to wet one. It is clear from the results (Fig.4. 6) that the samples PAC-8,
PAC-9, PAC-11 & PAC-12 have shown comparable trend in dry and wet crock fastness
while the sample PAC-10 have shown the best improvement in both dry and wet rubbing
fastness among all the studied samples synthesized using IPDI. The better improvement in
the sample PAC-10 might be due to better proportional compatibility of the ingredients
which provide both dispersion, and penetration and make effective coating. It is worth to
mention that all the treated samples have shown better crock fastness as compared to
untreated samples which clearly indicates that the PU acrylates are potential candidates as
textile finishing agent with ongoing investigation on crock fastness.

81
Fig 4.6: Colorfastness to rubbing data of the printed fabrics treated with synthesized IPDI based PU acrylates in different dilutions

82
4.9.2. Colorfastness properties of dyed fabric
The results of colorfastness to rubbing (dry and wet) of dyed samples treated with
cycloaliphatic diisocyanates (IPDI) based PU acrylates are presented in Fig 4.7. The results
revealed that the treatment of polyurethane acrylates copolymers improved the dry and wet
rubbing fastness properties of all the treated dyed fabric swatches. The untreated dyed fabric
swatch has shown dry and wet rubbing rating 2 and 2, respectively, whereas all the treated
dyed fabrics swatches have shown dry rubbing rating in the range of 2 to 4, and wet rubbing
rating in the range of 2 to 3/4. The rubbing fastness of sample PAC-10 and PAC-11 are
comparable and much better than all the other samples. The PAC-9 has shown medium
improvement while the sample PAC-8 and PAC-12 have shown least improvement.
However, all the treated samples have shown better results than the untreated sample. The
least improvement in sample PAC-8 and PAC-12 may be due to incompatibility of the
ingredients in samples.
The results presented in Fig 4.6 & Fig 4.7 clearly indicate that the rubbing fastness of printed
fabric swatches shows better results as compared to the rubbing fastness of dyed fabric
swatches. The printed fabric owes this ability to the affinity of -NH group of PAC samples to
the fibers. It is worth to mention that water soluble dyes (reactive dyes) usually show some
poor fastness as compared to water insoluble dyes or pigments. This accounts for their poor
results in comparison to printed fabric
.

83
Fig 4.7: Colorfastness to rubbing data of dyed fabric sample treated with synnthesized PAC samples in different dilutions

84
4.9.3. Pilling characterization
Poly-cotton fabric swatches were treated with different dilutions (15g/L, 30g/L, 50g/L) of
prepared polyurethane acrylate copolymer emulsions. The pilling result of white, printed and
dyed PC (polyester/cotton blends) fabrics of all the studied samples are presented in Table
4.5. It is clear from the results (Table 4.5) that the treatment of fabric with different
concentrations of prepared PAC emulsion has imparted anti pilling property to the fabric.
The results presented in Table 4.5 have shown clear separation lines among the five pilling
propensity groups and a progressive trend between the no pilling (rating 5) and the most
severe pilling (rating 1). The printed fabric showed greatest improvement in pilling rating in
comparison with the white and dyed fabrics. The treated printed fabric samples have shown
remarkable improvement in pilling after application on the printed fabric swatches with all
the prepared copolymer emulsions i.e., PAC-8, PAC-9, PAC-10, PAC-11 & PAC -12. The
PAC-8 & PAC-9 have shown comparable results with the white and dyed fabric whereas
PAC-10 showed the best improvement against pilling for the white, dyed & printed fabric.
The copolymer emulsions PAC-11, PAC-12 imparted good anti-pilling property to the dyed
fabric swatches than the white one. The pilling results showed that pilling rating improved by
decreasing the amount of butyl acrylate (BuA) and/or by increasing the proportion of vinyl
terminated PU prepolymer and vice versa.
.
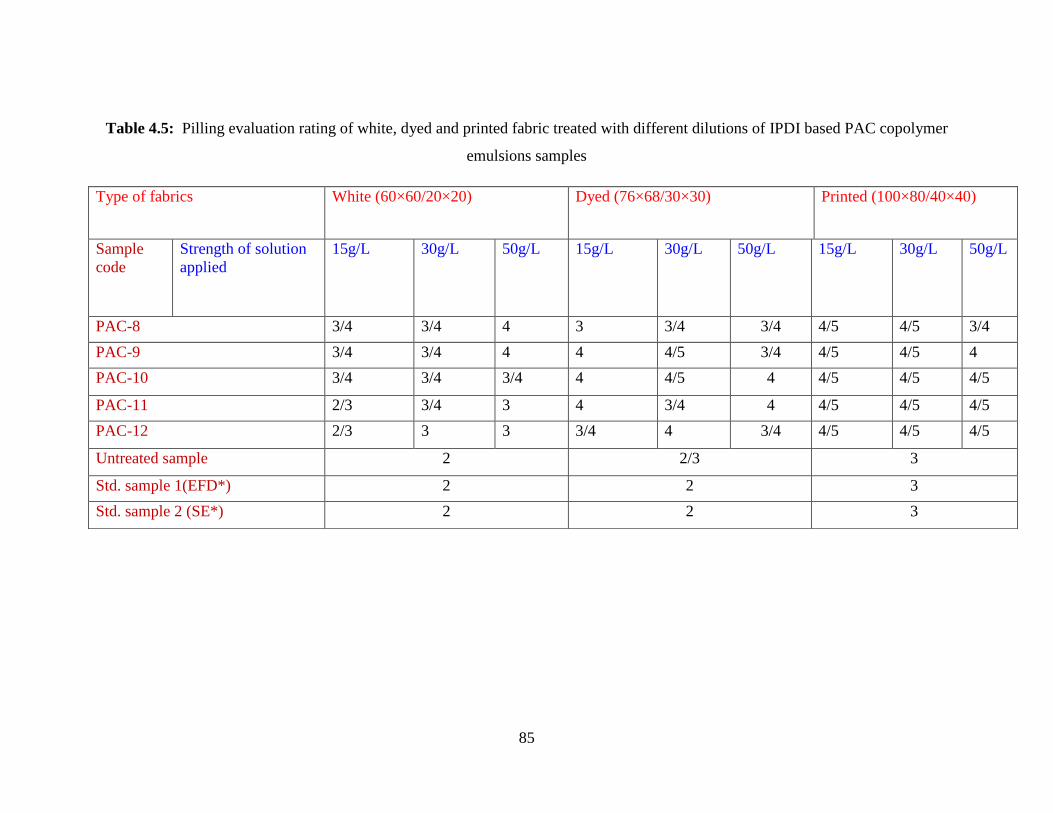
85
Table 4.5: Pilling evaluation rating of white, dyed and printed fabric treated with different dilutions of IPDI based PAC copolymer
emulsions samples
Type of fabrics White (60×60/20×20)
Dyed (76×68/30×30)
Printed (100×80/40×40)
Sample
code
Strength of solution
applied
15g/L 30g/L 50g/L 15g/L 30g/L 50g/L 15g/L 30g/L 50g/L
PAC-8 3/4 3/4 4 3 3/4 3/4 4/5 4/5 3/4
PAC-9 3/4 3/4 4 4 4/5 3/4 4/5 4/5 4
PAC-10 3/4 3/4 3/4 4 4/5 4 4/5 4/5 4/5
PAC-11 2/3 3/4 3 4 3/4 4 4/5 4/5 4/5
PAC-12 2/3 3 3 3/4 4 3/4 4/5 4/5 4/5
Untreated sample 2 2/3 3
Std. sample 1(EFD*) 2 2 3
Std. sample 2 (SE*) 2 2 3

86
4.10 Colorfastness and pilling characteristics of fabric after application of
H12MDI based PAC emulsion
4.10.1 Colorfastness properties of dyed and printed fabric
The result of colorfastness to rubbing (dry and wet) of printed and dyed fabric after application
of H12MDI based PAC copolymer are presented in Table 4.6. A glance of the Table 4.6 reveals
that the rating of colorfastness of the dyed and printed was increased by decreasing the amount
of butyl acrylate (BuA) and by increasing the percentage of vinyl terminated PU prepolymer.
PAC-15 have shown the best results, whereas and PAC-17 showed poor performance. In the
process of copolymerization, firstly BuA was charged along with the emulsifier and some other
ingredients as mentioned in Table 3.1. So monomer-swollen particles of BuA were generated.
Inside these monomer-swollen particles of BuA, copolymerization was carried out. It might be
due to because when the PU/BuA concentration was increased from 10/90 to 30/70%, the chance
of copolymerization was increased resulting in large micellies of cross linked copolymer along
with the tendency of acrylates to swell. But after that the concentration of BuA was low
regarding to swelling of monomer-swollen particles, generating relatively smaller micelle size
even concentration of PU was increased further.

87
Table 4.6: Colorfastness to rubbing data of the printed and dyed fabrics samples treated with synthesized H12MDI based polyurethane
acrylates
Nature of
fabrics Description PAC-13 PAC-14 PAC-15 PAC-16 PAC-17 Untreated
Applied
strength
Dry Wet Dry Wet Dry Wet Dry Wet Dry Wet Dry Wet
Dyed 15g/L 4 4 4/5 3 4/5 3/4 4/5 3/4 3/4 3 3 2/3
30g/L 4 3/4 4/5 3/4 4/5 4 4/5 3 3/4 2/3
50g/L 4 3/4 4 3/4 4/5 4 4 3 3 2/3
Printed 15g/L 4 3/4 4 3/4 4/5 4 4 3/4 3/4 3 3/4 2/3
30g/L 4 3/4 4/5 3/4 4/5 4 4/5 3/4 3/4 2/3
50g/L 4 3 4 3/4 4/5 3/4 4 3 3/4 2/3
88
4.10.2. Pilling characterization
The pilling result of dyed, printed and white fabrics of the samples PAC-13 to PAC-174.8 are
presented in Table 4.7. The prepared PAC emulsions were applied after dilution (i.e. 15 g/L, 30
g/L and 50 g/L). Comparison was made between the cycloaliphatic and aliphatic diisocyanates in
order to study the effect of variation in Chemistry of these monomers on the properties of final
copolymer. To maintain the similarity of systems for appropriate comparison, the concentration
of emulsifier was same in both of the series It is clear from the results (Table 4.7) that the fabric
acquires anti pilling property after treatment with different concentrations of the prepared PAC
emulsions. It can be seen by comparing treated and untreated fabric that improvement in the
pilling rating is pronounced in the white fabric as compared to the dyed and printed fabric ones.
Similar pattern of results was obtained when IPDI based copolymer emulsions were applied
(Table 4.7). However, improvement in pilling rating is more pronounced by the application of
IPDI based PAC copolymers in comparison with the H12MDI ones. This can be attributed to
difference in hydrophilic nature of two different diisocyanates; H12MDI has two 6-carbon rings
while in chemical structure of IPDI just one 6-carbon ring is available. Therefore, nature of IPDI
is relatively less hydrophobic. This hydrophilicity helped in more penetration of more stable
emulsion allowing easy penetration of prepared copolymer into the fabric imparting antipilling
property.

89
Table 4.7: Pilling evaluation rating of the printed and dyed fabrics samples treated with synthesized H12MDI based PAC copolymer
Nature of
fabrics
Description PAC-13 PAC-14 PAC-15 PAC-16 PAC-17 Untreated
Applied
strength
Printed 15g/L 4 4/5 4/5 4 3/4 4
30g/L 4 4/5 4/5 4 3/4
50g/L 4/5 4/5 4/5 4/5 3
Dyed 15g/L 3/4 4 4/5 4 3/4 3/4
30g/L 4 4/5 4/5 4 4
50g/L 4 4/5 4/5 4/5 4
White 15g/L 2/3 2/3 2/3 2/3 2/3 2
30g/L 2/3 3 3 2/3 2/3
50g/L 3 3/4 3/4 3/4 3

90
PART 11
In this part of study a PU polymer was prepared by reacting TDI with PCL (molecular weight
4000) and the chain was extended with 1,4-butane diol. The series of blends were prepared by
varying the percent compositions of prepared polyurethane (PU), polymethyl methacylates
(PMMA) and titanium dioxide (TiO2).
4.11. Molecular characterization
The FTIR spectra of all the monomers and individual polymerization steps were recorded and
presented in Fig. 4.8. The FTIR spectra of TDI, hydroxy terminated poly (ε-caprolactone) diol,
isocyanate and isocyanate NCO terminated polyurethane prepolymer formed by reacting
toluene-2,4-diisocyanate and hydroxy terminated poly (ε-caprolactone) diol are collectively
presented in Fig. 4.8. The assignment of peaks of the important functional group are presented
and explained. The FTIR spectrum of TDI (Fig. 4.1a) displays a very sharp and an intense peak
at 2241.28 cm−1
which corresponds to the –NCO groups linked to the TDI structure. The FT-IR
spectrum displays intense peaks at 1516.05 cm−1
attributed to the C C stretching of benzene
ring. The assignment of FTIR peaks of poly (caprolactone) diol (PCL) is presented in Fig 4.8b.
The peaks seen in the functional group region of polycaprolactone were allocated as: 3534
cm−1
(OH stretching vibration); 2937.59 cm−1
(asymmetric CH2 stretching); 2876 cm−1
(symmetric CH2 stretching); 1724.36 cm−1
(CO stretching); 1168.86 cm−1
(CO stretching).
These two monomers (TDI & PCL) were added in the reaction flask and the reaction was
continued for 1 h at 100C. After optimization of the experimental conditions it was observed
that formation of polyurethane prepolyεmer is completed in 1h and isocyanate terminated PU
prepolymer is formed. The FT-IR spectrum of isocyanate terminated polyurethane prepolymer
has been given in Fig. 4.8c. It is clearly seen from the spectrum that isocyanate group of the
TDI and the OH group of the PCL have reacted and therefore, the signal for the OH groups
vanished while the intensity of (–NCO) groups has lessened to certain degree with the result
that (–NCO) terminated PU prepolymer has been formed, a signal for NH units appeared at
3239 cm−1
(Fig. 4.8c). The other peaks observed in the FT-IR spectrum of PU prepolymer were
assigned as: 2930 cm−1
( symmetric CH2 stretching); 2893 cm−1
(symmetric CH2 stretching);
2893 cm−1
(asymmetric CH2 stretching); 2267 cm−1
(isocyanate (–NCO) group); 1726 cm−1

91
(CO stretching of soft segment of poly (ε-caprolactone) diol; 1190 cm−1
(CO stretching of soft
domain ). The presence of relatively weak peak at about 2267 cm−1
correspond to remaining –
NCO groups at ends of prepolymer, also confirm the formation of the isocyanate terminated PU
prepolymer. To complete the polymerization, the polyurethane prepolymer was then reacted
with 1,4-butane diol to form final polyurethane. The peak assignment of FTIR spectrum of 1,4-
butane diol is represented in Fig.4.8.d. The FTIR spectra of 1,4-butane diols (Fig. 4.8d)
displayed wide OH stretching vibration band appeared at 3452 cm1
. The peaks observed at
2930, and 2844 cm1
, correspond to CH2 symmetric and asymmetric stretching vibrations,
correspondingly. To deliver clear evidence regarding the vibrational mode changes owing to
incorporation of 1,4-butane diol in to the PU backbone in the course of the polymerization
reaction, FT-IR spectrum of polyurethane based on 1,4-butane diol obtained from the cast film is
displayed in Fig. 4.8e. In the FT-IR spectrum of the polyurethane sample, the appearance of N–
H peak at 3330 cm1
and the disappearance of the NCO peak at 2255 cm1
confirmed that
polymerization reaction is complete. The suggested structure of the ultimate polyurethane
polymer is supported by FTIR spectral study. Distinctive bands of urethane groups were shown
in the FTIR spectrum at 3330 cm1
(N–H stretching); symmetric CH2 stretching vibrations at
2947 cm1
symmetric CH2 stretching vibrations of CH2 groups at 2810 cm1
. Other observed
peaks were allocated as: 1728 cm1
, 1642 cm1
(CO bond); 1599cm1
, 1529cm1
(NH
deformations); 1407 cm1
(CH bending vibration); 1311 cm1
(CH2 wagging). By the reaction of
the PU prepolymer with 1,4-butane diol, the FT-IR spectra displayed a very sharp, new peak at
about 1728 cm1
which was allocated to CO stretching of soft segment of PCL. The other peaks
related to the absorption of –NH, –CO, –CHN were appeared at 3330 cm1
, 1728 cm1
and 1464
cm1
, in that order, which indicate the newly prepared proposed product exhibiting –NHCOO
group.

92
Fig. 4.8: FT-IR spectra: (a) TDI; (b) Poly (ε-caprolactone) diol (molecular weight 4000)
(CAPA); (c) PU prepolymer; (d) BDO; (e) Final polyurethane .

93
Seven samples with different composition of blends were prepared (Table 3.6) and characterized.
FT-IR scans of all the prepared samples are given in Fig.4.9. In the FT-IR spectrum of PUACT 1
(pristine PMMA and TiO2), the appearance of C=O and CH symmetric and asymmetric
stretching vibrations of CH2 confirm the structure of PMMA. The FT-IR spectra of blends of PU-
PMMA/TiO2 are also presented in Fig.4.9 and are designated as PUACT 2, PUACT 3, PUACT
4, PUACT 5 and PUACT 6, whereas the FTIR scan of pristine PU and TiO2 is entitled as
PUACT 7. All the FT-IR spectra of the blends of PU/PMMA/TiO2 (PUACT 2 to PUACT 6)
clearly show the appearance of N–H, C=O and CH symmetric and asymmetric stretching
vibrations of CH2 at the proper frequency and confirms the involvement of PU-PMMA blends.
The FTIR spectrum of PUACT 7 is also given in Fig.4.9 and mandatory peaks appeared are
assigned at their relevant position. It can be noted in comparison of all the FTIR scans that there
is no NH peak in the PUACT 1 because this sample only contain pristine PMMA and TiO2 and
all the other FTIR scans have shown the prominent peak of N–H, C=O and CH2 at the relevant
frequency region

94
Fig.4.9: FT-IR spectra: (a) PUACT 1 (100% PMMA/0% PU); (b) PUACT 2 (90%
PMMA/10% PU); (c) PUACT 3 (80% PMMA/20% PU); (d) PUACT 4 (60%
PMMA/40% PU); (e) PUACT 5 (40% PMMA/60% PU); (f) PUACT 6 (20%
PMMA/80% PU); (g) PUACT 7 (0% PMMA/100%PU)

95
4.12. Scanning electron microscopy (SEM) analysis
The polymer chains consist of backbone of carbon, the energetic electrons striking the surface
can impair, the organic chain. The SEM images were taken to investigate the morphology of
prepared PU-PMMA/TiO2 blends with different mass percent of PU and PMMA in the blends
(Fig. 4.10 a & b, Fig 4.11). From the SEM images (Fig.4.10a) of the prepared PU-PMMA/TiO2
composite blends, it can be clearly observed that the TiO2 contents are well dispersed in polymer
matrix and all the individual components can be easily identified. This homogeneity in
dispersion of the TiO2 contents in the PU /PMMA matrix will certainly help in improving the
mechanical properties of the prepared blends. The red zone area in the Fig. 4.10a has been
magnified (x500 to x1000) and presented in Fig. 10b. From the SEM images (Fig.4.11) of the
fractured surface of the of PUPMMA/TiO2 composite blends, it can be clearly observed that the
fractured surface of composites become less rugged with increase of PU contents and decrease of
PMMA contents, suggesting increasing interfacial bonding between TiO2 contents and
PU/PMMA matrix. The homogeneity in dispersion of the TiO2 contents in the PU/PMMA matrix
increased with decrease in the PMMA ratio and vice versa. Moreover, it can be seen that the
TiO2 contents are well dispersed in polymer matrix for PUACT5, PUACT6 and PUACT7, and
there are much shadow round the particles in these images.

96
Fig 4.10: Scanning electron microscope (SEM) images of PU-PMMA/TiO2 blends
a) X 500 & b) X1000 magnifications

97
Fig 4.11: Scanning electron microscope (SEM) images of PU-PMMA/TiO2 blends: (a)
PUACT 1, (b) PUACT 2, (c) PUACT 3, (d) PUACT 4, (e) PUACT 5, (f) PUACT
6, (g) PUACT 7

98
4.13. Mechanical properties of the blended samples
The hardness data of the synthesized PU/PMMA/TiO2 samples is presented in Table 4.8. The
results revealed that all the blended samples have shown comparable hardness results, however,
the samples having entire PMMA (PUACT 1) and sample having 20% PU and 80% PMMA
(PUACT 2) have shown equal hardness. The hardness of the studied samples gradually increases
with increase in the PU mass percent, however, the sample having 100% PU and 0% PMMA
(PUACT 5) has shown comparable results to the sample PUACT 3 (having 40% PU and 60%
PMMA). This trend of increasing rigidity of the sample attributed to the compatibility of the PU
and PMMA with that of TiO2. The existing trend of the hardness indicates that both the PU and
PMMA are responsible for the production of tough materials.With respect to the direction of
loading, the compression test is simply the opposite of the tension test. The load and the
displacement are recorded while the sample is compressed in compression testing. The
compression tests result in mechanical properties that include the compressive yield stress,
compressive modulus of elasticity and compressive ultimate stress. Compressive yield stress is
measured in a way identical to that done for tensile yield strength. When testing plastics, the
compressive yield stress is measured at the point of permanent yield on the stress-strain curve.
For most of the commonly used structural materials moduli are generally greater in compression.
The compression results are presented in Fig. 4.12 (a & b). The results revealed that among all
the studied samples, maximum applied load i.e., 1397 (Kgf) was observed by the sample PUACT
1 (0% PU and 100% PMMA) and this sample has shown maximum resistance against load. By
decreasing the mass percent of the PMMA, the load bearing capacity of the samples decreases,
so slight fracture was observed in sample PUACT 2 and clear fracture was observed in sample
PUACT 3. However, the sample PUACT 4 (80% PU and 20% PMMA) have shown good load
bearing capacity (i.e., 1101 Kgf) as compared to all the other samples having various mass
percent of PU. Although the sample PUACT 5 (100% PU and 0% PMMA) has also shown load
bearing capacity ,however, the maximum applied load to this sample is 489 Kgf and further
some pores in the un-checked sample was also observed. In comparison to all the studied
samples, no fracture was observed against the applied load in the sample PUACT 1, PUAT 4 and
PUACT 5, and finally concluding the best one among the above three the PUACT 4 is more
suitable for suggesting the dental materials because of the following reasons: 1) the sample
PUACT 1 has been prepared with 100% PMMA (and 0% PU) which show less biocompatible
99
behavior and also have shown least hardness factor (i.e., 88); 2) the sample PUACT 4 have
shown maximum load bearing capacity and maximum hardness (i.e., 95); and also did not show
any toxic effect during the cell culture assay because 80 % (mass percent) of PU (20 % PMMA)
has been blended in this sample. The established literature has reported that the polyurethane is
biocompatible material and can be inserted inside the living organism which does not result to
any toxic effect. The sample PUACT 5 have been blended with 100% PU (and 0% PMMA) with
hardness factor 90, max applied load was also very less, and further having pores onto the
surface of the sample is one of the other drawback of this sample. The value of the PUACT 5 is
much harder to determine for a compression test since many material do not exhibit rapid
fracture in compression.

100
Table 4.8: Compression results of the prepared PU/PMMA/TiO2 blends samples
Sample
Code
Composition
(PUa/PMMA
b)
% by mass
Hardness
Shore A
Load at
yield
(Kgf)
Load at
fracture
(Kgf)
Max.
Applied
Load
(Kgf)
Remarks
PUACT 1 0/100 88 1010.4 --- 1397 No fracture observed
PUACT 3 20/80 88 593.2 753 ---- Slight fracture observed
PUACT 4 40/60 91 524.2 685 --- Fracture observed
PUACT 6 80/20 95 693.9 1101 1101 No Fracture observed
PUACT 7a 100/0 90 186.4 --- 489.1 No fracture observed.
acPores on untested samples were also observed.
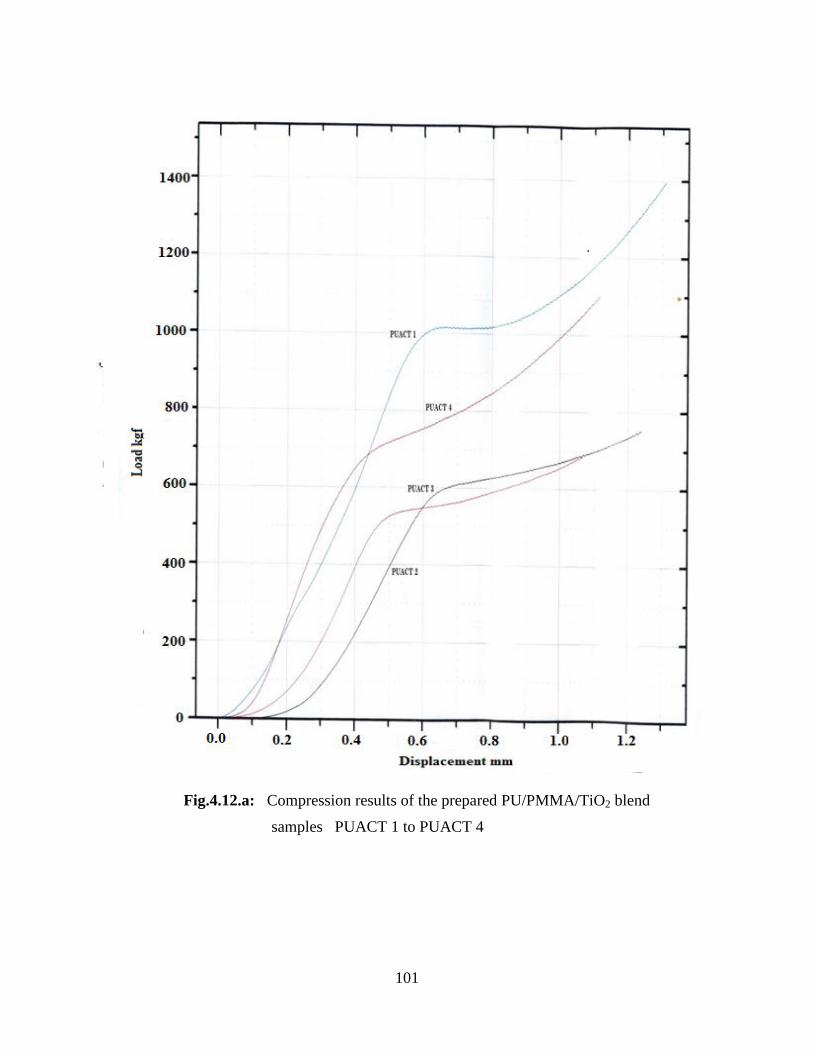
101
Fig.4.12.a: Compression results of the prepared PU/PMMA/TiO2 blend
samples PUACT 1 to PUACT 4

102
Fig.4.12.b: Compression results of the prepared PU/PMMA/TiO2 blend
samples; PUACT 5

103
4.14. Biocompatibility evaluation
4.14.1. Evaluation of cytotoxicity
Hemolytic activity of the prepared PU-PMMA/TiO2 blends was evaluated following the method
reported in the chapter 3. For this purpose, phosphate buffer saline (PBS) and 1% (v/v) Triton X-
100 were used as reference and results are reported in Table 4.9. The results revealed that no
hemolysis (0%) and full hemolysis (100%) was observed in the presence of PBS and 1% (v/v)
Triton X-100, respectively. As indicated by the scale (given at the bottom of the Table 4.9), the
percent lysis caused by the blends of PU-PMMA/TiO2 samples is within the range of no toxicity
(as per scale of toxicity level). No sample showed any toxic behavior towards the living cells. In
the comparison of the entire studied samples, the sample PUACT 7 (100% PU/0% PMMA) has
shown least non-toxic behavior and this value towards toxicity is increased with increasing the
contents of PMMA, however the mean values of the individual sample remained in the limit of
the non-toxicity. Although PU and PMMA also showed biocompatible behavior, however in
this study it may be concluded that the contents of the PU in the blends are responsible for
higher level of biocompatibility as shown by the samples. It has been presented in the literature
that non-cytotoxic chemistry of PU makes these polymer blends good candidates for continued
development as biomedical implants (Guelcher et al., 2005)

104
Table 4.9: Toxicity level of the blended samples of PU/PMMA/TiO2 blends
aAverage of three measurements
bStandard deviation
cDiemthyl formamide
dPhosphate buffer saline
S. No Toxicity levela
(mean %)
S.Db %)
PUACT 1 9.24 0.68
PUACT 2 8.71 0.30
PUACT 3 7.45 0.59
PUACT 4 4.60 0.33
PUACT 5 2.33 0.45
PUACT 6 0.80 0.06
PUACT 7 0.64 0.09
DMFc 0.1 0.02
PBSd 0.00 0.03
Triton 100.00 0.05
Scale 1-10: No toxic; 11-25: Slightly toxic;
26-50: moderately toxic; 50-100: highly toxic

105
4.14.2. Mutagenic activity
Mutagenic activity of compounds were measured with the the Ames fluctuation test according to
TA 98 and TA 100 methods using K2Cr2O7 and NaN3 as standard mutagen, respectively and the
results are presented in Table 4.10.
The results presented in Table 4.10 revealed that the standard sample and samples PUACT 1 and
PUACT 2 have shown mutagenic behaviors using both the test methods. While all the other
studied samples have shown non–mutagenic behavior. It may be attributed to the fact that the
PU-PMMA/TiO2 based composite showed improved biocompatibility and lower mutagenicity
than the control and the level of biocompatibility increased with increasing contents of PU in the
blends. The biocompatibility encompasses many aspects of a material, including its physical,
mechanical, and chemical properties, as well as its potential cytotoxic, mutagenic, and allergenic
effects, so that no significant injuries or toxic effects on the biological function of cells and
individuals arise. It is worth to mention that biocompatible materials cannot be mutagenic or
influence inflammatory mediators causing systemic responses, including toxicity, tissue injury,
teratogenic or carcinogenic effects. Such materials must be free of agents that may cause allergic
responses to individuals sensitive to these substances. On the basis of the result presented in
Table 4.9 and 4.10 it may be concluded that although all the samples have shown biocompatible
behavior however the level of biocompatibility increases with increase in contents of PU in the
blends.

106
Table 4.10: Mutagenic activity of compounds in the Ames fluctuation test using TA
98 and TA 100 using different standard mutagens
Sample description Mutagenic activity of compounds in the
Ames fluctuation test using TA 98 using
K2Cr2O7 as standard mutagen
Mutagenic activity of compounds in the
Ames fluctuation test using TA 100
using NaN3 as standard mutagen
Number of positive
wells/ 96 wells
Result Number of positive
wells/ 96 wells
Result
Background 24 - 25 -
Standard mutagen 92 Mutagenic 90 Mutagenic
PUACT 1 54 Mutagenic 52 Mutagenic
PUACT 2 66 Mutagenic 81 Mutagenic
PUACT 3 42 Non-mutagenic 34 Non-mutagenic
PUACT 4 21 Non-mutagenic 44 Non-mutagenic
PUACT 5 36 Non-mutagenic 43 Non-mutagenic
PUACT 6 45 Non-mutagenic 36 Non-mutagenic
PUACT 7 22 Non-mutagenic 48 Non-mutagenic

107
4.15. Thermal analysis
DSC is a thermoanalytical procedure that measures the difference in the quantity of heat required
for raising temperature of a sample and reference as a function of temperature. The sample and
reference both are kept at equal temperature during the test. For a DSC analysis the sample
holder temperature increases linearly with time. Over the range of temperatures to be scanned the
sample which is to be taken as a reference should exhibit well defined heat capacity. The
fundamental rule on which the procedure is based is that, when the sample experiences
transitions in phase, greater or as smaller amount of heat will be required to flow to it as
compared to the reference to retain both at equal temperature For endothermic process like
melting process greater amount of heat flows towards the sample which is required for raising
temperature of reference & sample at equal rate. This is because sample will absorb heat as it
experiences endothermic phase transition from solid to liquid. If the sample undergoes
exothermic processes (e.g. crystallization) a smaller amount of heat is required for raising the
temperature of the sample. Differential scanning calorimeters are capable of measuring the
quantity of heat absorbed or released during such transitions by detecting the difference in heat
flow among the sample and reference. As the temperature of amorphous solids is increased glass
transitions may occur when molecular mobility starts in the amorphous region. As Tg is a second
order transition, this transition is seen as a step in the baseline of the recorded DSC signal. This
is because no formal phase change is occurring, the sample is experiencing a change in heat
capacity. The viscosity of amorphous solid decreases by increasing temperature. For naturally
organizing themselves in a crystalline form, the molecules might attain enough freedom of
motion at the crystallization temperature (Tc). The transition from amorphous solid to
crystalline solid is heat releasing phenomenon and as a result a peak in the DSC signal is
obtained. The sample eventually reaches its melting temperature (Tm) as the temperature
increases. An endothermic peak in the DSC curve is formed as a result of melting. DSC is
helpful in making phase diagrams for numerous chemical systems because of its capability for
determining transition temperatures and enthalpies. Glass transitions are of processes of utmost
significance in polymeric materials since they govern the physical state as well as ultimate
mechanical characteristics of the material. The Tg signifies a point at which dramatic changes
come about in polymer characteristics. It is the temperature that when achieved the amorphous

108
polymers experience a changeover from a glassy to a rubbery state. The Tg of a dental composite
is merely of importance if it falls in the range of intraoral temperatures (Knox et al., 2000; Moore
et al., 1999). The dental composites should possess Tg greater as compared to the maximum
temperature in the oral cavity to preserve the material’s physical and mechanical characteristics.
In the present study the Tg of PU/PMMA/TiO2 based composites is 50ο C, (Fig 4.13) while Tm is
352.4ο C and the heat of enthalpy (ΔH is 1985.497J/g) from DSC measurement. This value of Tg
is slightly above the temperature of oral cavity as established in literature. So the prepared
composite can be used as a dental material.

109
Fig. 4.13: DSC scan of PU/PMMA /TiO2 composites

110
Chapter 5
SUMMARY
This study comprises on two parts. In the first part of study polyurethane acrylate copolymers
(PAC) were synthesized via emulsion polymerization following three step synthesis process
varying diisocyanate structure, hydroxy terminated poly(caprolactone) diol, 2-
hydroxyethylacrylate and butyl acrylate. Structural characteristics of the synthesized
polyurethane acrylate copolymers (PAC) were studied using Fourier Transform Infrared (FT-IR)
spectrophotometer and are with accordance with the proposed PAC structure. The
physicochemical properties such as solid contents (%), tackiness, film appearance and emulsion
stability were studied, discussed and co-related with other findings. The plain weave poly-cotton
printed fabrics after application of PAC was evaluated following colorfastness standard test
method. The results revealed that emulsion stability is the main controlling factor of the
synthesized material in order to get better applications and properties. The emulsion stability of
the synthesized material increased with increase in molecular weight of the polycaprolactone
diol. The pilling characteristic, rubbing fastness and antimicrobial activities of the plain weave
poly-cotton grey, white, printed and dyed fabric swatches after application of PAC were
evaluated. The results revealed that by increasing the molecular weight of PCL in the
synthesized PAC samples, the antimicrobial activities increased, pilling rating improved and this
behavior was interpreted in term of increasing hydrophilic character. Pilling rating also improved
by decreasing the amount of butyl acrylate (BuA) and/or by increasing the percentage of vinyl
terminated PU prepolymer and vice versa.
In the second part of the study PU/PMMA / TiO2, based composites were prepared and
characterized. For the synthesis PU prepolymer was prepared by the reaction of toluene-2,4-
diisocyanate and poly caprolactone diol and the chain was further extended with 1,4-butane diol
to get final polyurethane (PU. The progress of reaction was confirmed by FTIR analysis. A series
of blends were prepared by varying the percent compositions of prepared PU, procured
polymethyl methacylates (PMMA) and titanium dioxide (TiO2). Pellets were formed from the
prepared blends (PU-PMMA/TiO2) using a self-designed mechanical tool. The chemistry of all
of the blended samples was confirmed through FTIR analysis. Scanning electron microscope

111
images were also taken to confirm the incorporation of the TiO2 contents into the prepared
blends. The micrographs confirmed that the PU-PMMA/TiO2 nanocomposites present a
homogeneous and fully dispersed micro-morphology. The micrograph images showed that the
average size of PU-PMMA/TiO2 nanocomposites is round about 60-70 nm. Biocompatability
evaluation was carried out susing cytotoxicity test and Mutagenic study by an Ames Bacterial
Reverse-Mutation Test (Fluctuation Test). No sample showed any toxic behavior toward the
living cells. The level of biocompatibility increased with increasing content of PU in the blends.
The Tg of the PU–PMMA–TiO2-based composites was 50οC, whereas their Tm was 352.4
οC, and
their heat of enthalpy (ΔH) was 1985.497 J/g, as obtained from DSC measurement. This value of
Tg was slightly above the temperature of the oral cavity, as established in the literature.
Mechanical properties such as hardness and compressive strength were studied and discussed.
The results of the study revealed that the blended sample having 80% PU, 20% PMMA content
with 2.5 g TiO2 in 100 g mixture of PU and PMMA is very suitable for suggesting dental
materials.

112
REFERENCES
American Association of Textile Colorists and Chemists. (1968). Standard test method. D-
79.
Albrektsson, T. (1995). Principles of osseointegration. In, Dental and Maxillofacial
Implantology, Hobkirk JA and Watson K, (edn), 1st edn, Mosby-Wolfe, London, 9-
19.
Aneja, A. & Wilkes, G. L. (2003). A systematic series of ‘model’ PTMO based segmented
polyurethanes reinvestigated using atomic force microscopy. Polymer, 44(23), 7221-
7228.
Antunes, M., Cano, Á.,Haurie, L. & Velasco, J. I. (2011). Esparto wool as reinforcement in
hybrid polyurethane composite foams. Industrial Crops and Products, 34(3), 1641-
1648.
ASTM Standards. (2004). American Society of Testing Materials. ASTM International USA.
Athawale, V. D., & Kulkarni, M. A. (2009). Preparation and properties of urethane/acrylate
composite by emulsion polymerization technique. Progress in Organic Coatings,
65(3), 392-400.
Athawale,V.D. & Kulkarni, M.A. (2010). Synthesis, characterization, and comparison of
polyurethane dispersions based on highly versatile anionomer, ATBS, and
conventional DMP. Journal of Coatings Technology and Research, 7 189–199
Azzam, R.A., Mohamed, S. K., Tol, V., Everaet, V., Reynaers, H. & Goderis. (2007).
Synthesis and thermo-mechanical characterization of high performance polyurethane
elastomers based on heterocyclic and aromatic diamine chain extenders. Polymer
Degradation and Stability. 92, 1316-1325.
Bajsic, E. G. & Rek, V. (2001). Thermal stability of polyurethane elastomers before and after
UV irradiation. Journal of Applied Polymer Science, 79(5), 864-873.
Bao, F. & Shi, W. (2010). Synthesis and properties of hyperbranched polyurethane acrylate
used for UV curing coatings. Progress in Organic Coatings, 68(4), 334-339.
Barikani, M. & Hepburn, C. (1987). The relative thermal stability of polyurethane
elastomers, 3. Influence of chain extender structure. Cellular Polymers, 6, 47-67.

113
Barikani, M. & Hepburn, C., (1987). The relative thermal stabilityof polyurethane
elastomers, Influence of chain extender structure. Cellular Polymers, 6, 47-67,
Barikani, M. and C. Hepburn. (1986). Isocyanurate crosslinking as a means of producing
thermally stable polyurethane elastomers. Cellular Polymers, 5, 169-185.
Barikani, M. & Barmar, M. (1996). Thermoplastic polyurethane elastomers, Synthesis and
study of effective structural parameters. Iranian Polymer Journal, 5, 231-235.
Barikani, M., Zia, K. M., Bhatti, I. A., Zuber, M. & Bhatti, H. N. (2008). Molecular
engineering and properties of chitin based shape memory polyurethane elastomers.
Carbohydrate Polymers, 74, 621–626.
Bellinger, D. C., Trachtenberg, F., Zhang, A., Tavares, M., Daniel, D. & McKinlay, S.
(2008). Dental amalgam and psychosocial status, the New England Children’s
Amalgam Trial. Journal of Dental Research, 7, 470–474.
Brown, R. A., Coogan, R. G., Fortier, D. G., Reeve, M. S. & Rega, J. D. (2005). Comparing
and contrasting the properties of urethane/acrylic hybrids with those of corresponding
blends of urethane dispersions and acrylic emulsions. Progress in Organic Coatings,
52(1), 73-84.
Camilleri, J., Cutajar, A. & Mallia, B. (2011). Hydration characteristics of zirconium oxide
replaced Portland cement for use as a root-end filling material. Dental Materials,
27(8), 845-854.
Christenson, E.M, Dadsetan M., Wiggins M, Anderson, J.M. & Hiltner, A. (2004). Poly
(carbonate urethane) biodegradation, in vivo studies. Journal of Biomedical Materials
Research, 69A, 407e16.
Coldeaa, A., Swaina, M. V. & Thiel, N. (2013). Mechanical properties of polymer-
infiltrated-ceramic-network materials. Dental, doi.org/10.1016/j.dental.2013.01.002
Coutinho, F. M. B., Delpech, M. C., Alves, T. L. & Ferreira, A. A. (2003). Degradation
profiles of cast films of polyurethane and poly(urethane-urea) aqueous dispersions
based on hydroxy-terminated polybutadiene and different diisocyanates. Polymer
Degradation and Stability, 81(1), 19-27.
Da Silva, G. R., da Silva-Cunha Jr, A., Behar-Cohen, F., Ayres, E. & Orefice, R. L. (2010).
Biodegradation of polyurethanes and nanocomposites to non-cytotoxic degradation
products. Polymer Degradation and Stability, 95(4), 491-499.

114
Dan, C. H., Lee, M. H., Kim, Y. D., Min, B. H. & Kim, J. H. (2006). Effect of clay modifiers
on the morphology and physical properties of thermoplastic polyurethane/clay
nanocomposites. Polymer, 47(19), 6718-6730.
Deng, J., Cao, J., Li, J., Tan, H., Zhang, Q. & Fu, Q. (2008).Mechanical and surface
properties of polyurethane/fluorinated multi-walled carbon nanotubes composites.
Journal of Applied Polymer Science, 108(3), 2023-2028.
Deng, X., Liu, F., Luo, Y., Chen, Y., & Jia, D. (2007). Preparation, structure and properties
of comb-branched waterborne polyurethane/OMMT nanocomposites. Progress in
Organic Coatings, 60(1), 11-16.
Denyer, S.P. (1995) Mechanisms of action of antibacterial biocides. International
Biodeterioration & Biodegradation, 36, 227-245.
Dieterich, D. (1981). Aqueous emulsions, dispersions and solutions of polyurethanes;
synthesis and properties. Progress in Organic Coatings, 9(3),281-340.
Dieterich, D. & Dieterich, D. (1973). Polyurethane polyelectrolytes and process for preparing
same USPTO, Patent Number, 3756992, Issue Date, September 4,1973.
Dzunuzovic, E. S., Tasic, S. V., Bozic, B. R., Dzunuzovic, J. V., Dunjic, B. M., & Jeremic,
K. B. (2012). Mechanical and thermal properties of UV cured mixtures of linear and
hyperbranched urethane acrylates. Progress in Organic Coatings, 74(1), 158-164.
Fabulyak, F. G. & Lipatov, V. U. S. (1970). Molecular motion in surface layers of
polyurethane. Polymer Science USSR, 12, 831-848.
Fang, Z. H., Duan, H. Y., Zhang, Z. H., Wang, J., Li, D. Q. & Huang, Y. X. (2011). Novel
heat-resistance UV curable waterborne polyurethane coatings modified by melamine.
Applied Surface Science, 257(11), 4765-4768.
Ferracane, J. L. (2011). Resin composite – state of the art. Dental Materials, 27, 29–38.
Flickinger, G. L., Dairanieh, I. S., & Zukoski, C. F. (1999). The rheology of aqueous
polyurethane dispersions.Journal of Non-Newtonian Fluid Mechanics, 87(2–3), 283-
305.
Fouda, M. M. G., & Fahmy, H. M. (2011). Multifunctional finish and cotton cellulose fabric.
Carbohydrate Polymers, 86(2), 625-629.

115
Frankenberger, R., Sindel, J., Krämer, N. & Petschelt, A. (1999). Dentin bond strength and
marginal adaptation, direct compositeresins vs. ceramic inlays. Operative Dentistry,
24,147–55.
Fried, J.R. (1995). Polymer Science and Technology. Prentice-Hall, PTR, Englewood CliHs,
NJ
Frisch, K. C. & Dieter, J.A. (1975). Polymer-Plastics Technology and Engineering 4(1).
Garbassi, F., Mora, M. & Occhiello, E. (1998). Polymer surfaces, from physics to
technology. Chichester, John Wiley & Sons
Garber, D. A. & Goldstein R, E. (1994). Porcelain and Composite Inlays and Onlays,Esthetic
Posterior Restorations, Quintessence, Chicago.
Garrett, J. T., Siedlecki, C.A. & Runt, J.P.(2001). Microdomain Morpholology of
Poly(urethane urea) Multiblock Copolymers. Macromolecules, 34, 7066-7070
Gite, V. V., Mahulikar, P. P. & Hundiwale, D. G. (2010). Preparation and properties of
polyurethane coatings based on acrylic polyols and trimer of isophorone diisocyanate.
Progress in Organic Coatings, 68(4), 307-312.
Grasel, T.G. & Cooper, S.L. (1989). Properties and biological interactions of polyurethane
anionomers-effect of sulfonate incorporation, Journal of Biomedical Materials
Research, 23, 311-338.
Guelcher, S. A., Gallagher, K. M., Didier, J. E., Klinedinst, D. B., Doctor, J. S. & Goldstein,
A. S. (2005). Synthesis of biocompatible segmented polyurethanes from aliphatic
diisocyanates and diureadiol chain extenders. ActaBiomaterialia, 1(4), 471-484.
Guo, Y.-h., Li, S.-c., Wang, G. S., Ma, W. & Huang, Z. (2012). Waterborne
polyurethane/poly(n-butyl acrylate-styrene) hybrid emulsions, Particle formation,
film properties, and application. Progress in Organic Coatings, 74(1), 248-256.
Guo, Y.H., Li, S.C., Wang, G.S., Ma, W. & Huang, Z. (2012). Waterborne
polyurethane/poly(n-butyl acrylate-styrene) hybrid emulsions, Particle formation,
film properties, and application. Progress in Organic Coatings, 74(1), 248-256.
Habereder, P. (2002). Silicon-Weichmacher, Struktur-Wirkungsbeziehungen. Melliand
Textilberichte, 83, 336–338.

116
Hashem, M., Ibrahim, N. A., El-Shafei, A., Refaie, R. & Hauser, P. (2009). An eco-friendly –
novel approach for attaining wrinkle – free/soft-hand cotton fabric. Carbohydrate
Polymers, 78(4), 690-703.
He, C., Wang, M., Cai, X., Huang, X., Li, L. & Zhu, H. (2011). Chemically induced graft
copolymerization of 2-hydroxyethyl methacrylate onto polyurethane surface for
improving blood compatibility. Applied Surface Science, 258(2), 755-760.
Hearn, M. J., Ratner, B.D. & Bringgs, D. (1988). SIMS and XPS studies of polyurethane
surfaces. 1. Preliminary studies. Macromolecules, 21, 2950-2959.
Hegedus, C.R., Pulley, D.F., Spadafora, S.J., Eng, A.T. & Hirst, D.J. (1989). A review of
organic coating technologyfor U.S. naval aircraft. Journal of Coatings Technology,
61, 31–42.
Hsu, S.-h., Tseng, H.-J. & Lin, Y.-C. (2010). The biocompatibility and antibacterial
properties of waterborne polyurethane-silver nanocomposites. Biomaterials, 31(26),
6796-6808.
Hu, J. L. & Mondal, S. (2005). Structural characterization and mass transfer properties of
segmented polyurethane, Influence of block length of hydrophilic segments. Polymer
International, 54, 764-771.
Ibarboure, E., Baron, A., Papon, E. & Rodriguez-Hernandez, J. (2009). Self-assembly of
graft polyurethanes having both crystallizablepoly(ε-caprolactone) blocks and soft
poly(n-butyl acrylate) segments. Thin Solid Films, 517(11), 3281-3286.
Ilie, N. & Hickel, R. (2006). Silorane-based dental composite, behavior and abilities. Journal
of Dental Materials,25, 445–454.
JapiassuResende Montes, M. A., de Goes, M. F., Bernardi da Cunha, M. R. & Borges Soares,
A. (2001). A morphological and tensile bond strength evaluation of an unfilled
adhesive with low-viscosity composites and a filled adhesive in one and two coats.
Journal of Dentistry, 29(6), 435-441.
Jiang, G., Tuo, X., Wang, D. & Li, Q. (2009). Preparation, characterization, and properties of
fluorinated polyurethanes. Journal of Polymer Science Part A, Polymer Chemistry,
47(13), 3248-3256.
Jiang, X., Li, J., Ding, M., Tan, H., Ling, Q. & Zhong, Y. (2007). Synthesis and degradation
of nontoxic biodegradable waterborne polyurethanes elastomer with poly(ε-

117
caprolactone) and poly(ethylene glycol) as soft segment. European Polymer Journal,
43(5), 1838-1846.
Kahler, B., Kotousov, A. & Swain, M.V. (2008). On the design of dental resin-based
composites, a micromechanical approach. Acta Biomaterialia, 4,165–72.
Karabela, M. M., & Sideridou, I. D. (2011). Synthesis and study of properties of dental resin
composites with different nanosilica particles size. Dental Materials, 27(8), 825-835.
Kasemo, B. (1983). Biocompatibility of titanium implants, Surface science aspects. The
Journal of Prosthetic Dentistry, 49(6), 832-837.
Kaushik, A., Ahuja, D. & Salwani, V. (2011). Synthesis and characterization of organically
modified clay/castor oil based chain extended polyurethane nanocomposites.
Composites Part A, Applied Science and Manufacturing, 42(10), 1534-1541.
Keskin, S., & Usanmaz, A. (2010). Hydroxyl-terminated poly(urethane acrylate) as a soft
liner in dental applications, Synthesis and characterization. Journal of Applied
Polymer Science, 117(1), 458-466.
Knox, J., Jones, M.L., Hubsch, P. & Middleton, J. (2000). The influence of orthodontic
adhesive properties on the quality of orthodontic attachment. Angle Orthodontist,
70(3), 241-256.
Krol, P. (2007). Synthesis methods, chemical structures and phase structures of linear
polyurethanes. Properties and applications of linear polyurethanes in polyurethane
elastomers, copolymers and ionomers. Progress in Materials Science, 52(6), 915-
1015.
Krol, P., Król, B., Pikus, S. & Skrzypiec, K. (2005). Study on the synthesis and on
supermolecular structures of a water-dilutable urethane-acrylic copolymer applicable
as a binder for powdered Al2O3. Colloids and Surfaces A, Physicochemical and
Engineering Aspects, 259(1–3), 35-44.
Kukanja, D., Golob, J., Ic-Valant, Z. & Krajnc, A. M. (2000). The structure and properties of
acrylic–polyurethane hybrid emulsions and comparison with physicalblends. Journal
of Applied Polymer Science, 78, 67–80.
Kulkarni, R., Deshpande, A. & Share, B. (2001). Silicon for textile finishing. Colourage, 21.
Kuranska, M., & Prociak, A (2012).Porous polyurethane composites with natural fibres.
Composites Science and Technology, 72(2), 299-304.

118
Lan, P. N., Corneillie, S., Schacht, E., Davies, M. & Shard, A. (1996). Synthesis and
characterization of segmented polyurethanes based on amphiphilic polyether diols.
Biomaterials, 17(23), 2273-2280.
Laschke, M. W., Strohe, A., Menger, M. D., Alini, M. & Eglin, D. (2010). In vitro and in
vivo evaluation of a novel nanosize hydroxyapatite particles/poly(ester-urethane)
composite scaffold for bone tissue engineering. ActaBiomaterialia, 6(6), 2020-2027.
Lee, H.-T., Wu, S.-Y., & Jeng, R.-J. (2006). Effects of sulfonatedpolyol on the properties of
the resultant aqueous polyurethane dispersions. Colloids and Surfaces A,
Physicochemical and Engineering Aspects, 276(1–3), 176-185.
Lee, K. H., & Kim, B. K. (1996). Structure-property relationships of polyurethane anionomer
acrylates. Polymer, 37(11), 2251-2257.
Leloup, G. (2013). Progress in dimethacrylate-based dental composite technology and curing
efficiency. D e n t a l m a t e r i a l s ,2 9 ,139–156
Leprince, J. G., William M. Palin, W. M., Mohammed A. Hadisc, M. A Devaux, J., Gaetane
Levchik, S. V. & Weil, E. D. (2004). Thermal decomposition, combustion and fire-
retardancy of polyurethanes—a review of the recent literature. Polymer International,
53(11), 1585-1610.
Lewandowska, M., Roguska, A., Pisarek, M., Polak, B., Janik-Czachor, M. & Kurzydłowski,
K. J. (2007). Morphology and chemical characterization of Ti surfaces modified for
biomedical applications. Biomolecular Engineering, 24(5), 438-442.
Linderback, P., Harmankaya, N., Askendal, A., Areva, S., Lausmaa, J. & Tengvall, P. (2010).
The effect of heat- or ultra violet ozone-treatment of titanium on complement
deposition from human blood plasma. Biomaterials, 31(18), 4795-4801.
Liu, D., Matinlinna, J. P. & Pow, E. H. N. (2012). Insights into porcelain zirconia bonding.
Journal of Adhesion Science and Technology, 26, 1249–1265.
Liu, X., Xu, K., Liu, H., Cai, H., Su, J. & Fu, Z. (2011). Preparation and properties of
waterborne polyurethanes with natural dimer fatty acids based polyester polyol as soft
segment. Progress in Organic Coatings, 72(4), 612-620.
Lu, Y., Zhang, L., Zhang, X. & Zhou, Y. (2003). Effects of secondary structure on
miscibility and properties of semi-IPN from polyurethane and benzyl
konjacglucomannan .Polymer, 44(21), 6689-6696.

119
Lubisich, E. B., Hilton, T. J., Ferracane, J. L., Pashova, H. I. & Burton, B. (2011).
Association between caries location and restorative material treatment provided.
Journal of Dentistry, 39, 302–308.
Ma, H. & Yang, Y. (2008). Rheology, morphology and mechanical properties of
compatibilized poly(vinylidene fluoride) (PVDF)/thermoplastic polyurethane (TPU)
blends. Polymer Testing, 27(4), 441-446.
MacGregor, C.J. & Parker, R.A. (1983). Loaded polyurethane articles (The Goodyear Tire &
amp; Rubber Company, Akron, OH, USA). Composites, 14(3), 326.
Manhart, J., Kunzelmann, K. H., Chen, H.Y. & Hickel, R. (2000).Mechanical properties of
new composite restorative materials. Journal of Biomedical Materials Research, 53,
353–361.
Mannocci, F., Pilecki, P., Bertelli, E. & Watson, T. F. (2004). Density of dentinal tubules
affects the tensile strength of root dentin. Dental Materials, 20(3), 293-296.
Marchant, R. E. (1992). Biodegradability of biomedical polymers. In, Hamid, S.H., Amin,
M.B., Maadhah, A.G. (Eds.), Handbook of Polymer Degradation. Marcel Dekker,
Inc., New York, pp. 617–631.
Matsui, M., Ono, L. & Akcelrud, L. (2012). Chitin/polyurethane networks and blends,
Evaluation of biological application. Polymer Testing, 31(1), 191-196.
Mequanint, K., Sanderson, R. & Pasch, H. (2002). Phosphated polyurethane–acrylic
dispersions, synthesis, rheological properties and wetting behaviour. Polymer, 43(19),
5341-5346
Minoura, Y. S., Yamashita, H., Okamoto, T. M., Izawa, M. & Kohmoto, S. (1978).
Crosslinking and mechanical property of liquid rubber.II. Curative effect of aromatic
diols. Journal of Applied Polymer Science, 22, 3101-3110.
Minoura,Y.S., Yamashita, H., Okamoto,T., Matsuo, M. & Izawa S.K. (1978). Crosslinking
and mechanical property of liquid rubber.I Curative effect of aromatic diols. Journal
of Applied Polymer Science, 22, 1817-1844
Mondal, S. & Hu, J.L. (2007). Shape memory study of thermoplastic segmented
polyurethane, influence of hard segment. Polymer. Plastics. Technology. 46,939–942

120
Montes, M. A., Goes, M. F., Cunha, M. R. & Soares, A.B. (2001). A morphological and
tensile bond strength evaluation of anunfilled adhesive with low viscosity composites
and a filledadhesive in one and two coats. Journal of Dentistry, 29,435–41.
Moore, R.J., Watts, J.T.F., Hood, J. A. A. & Burritt, D.J. (1999). Intra-oral temperature
variation over 24 hours. European Journal of Orthodontics, 21(3), 249-61.
Nakabayashi, N., Kojima, K. & Masuhara,E. (1982) ‘The promotion of adhesion by the
infiltration of monomers into tooth substrates’. Journal of Biomedical Materials
Research,16, 265–73.Morphological Studies of Polyurethane Elastomers
Nakamae, K., Nishino, T., & Asaoka, S. (1996). Microphase separation and surface
properties of segmented polyurethane, Effect of hard segment content. International
Journal of Adhesion, 16, 233-239.
Nakamae, K., Nishino, T. & Asaoka, S. (1999). Relationships between interfacial properties
andstructure of segmented polyurethane having functional groups. Internation
Journal of Adhesion, 19, 345-351.
Noda, I. & Rubingh, D. N. (1992). Polymer Solutions, Blends, and Interfaces, Elsevier
Science BV, 1-21.
Nunes, M. F., Swift, E. J. & Perdigão, J. (2001). Effects of adhesive composition on
microtensile bond strength to human dentin. American Journal of Dentistry, 14(6),
340-343.
Oh, H.-J., Lee, J.-H., Kim, Y.-J., Suh, S.-J., Lee, J.-H. & Chi, C.-S. (2008). Surface
characteristics of porous anodic TiO2 layer for biomedical applications. Materials
Chemistry and Physics, 109(1), 10-14.
Opdam, N. J., Bronkhorst, E. M., Loomans, B.A. & Huysmans, M.C. (2010).12- Year
survival of composite vs. amalgam restorations. Journal of Dental Research, 89,
1063.
Oprea, S., Vlad, S., Stanciu, A., Ciobanu, C., & Macoveanu, M. (1999). Synthesis and
characterization of poly(urethane-urea-acrylate)s. European Polymer Journal, 35(7),
1269-1277.
Ortel, G. (1993). Polyurethane Handbook. Hanser Publishers, New York, ISBN 3-446-
17198-3.

121
Owens, D K. (1975). The mechanism of corona and ultraviolet light-induced self-adhesion of
poly(ethylene terephthalate) film. Journal of Applied Polymer Science, 19, 3315-
3326.
Palmquist, A., Omar, O. M., Esposito, M., Lausmaa, J., & Thomsen, P. (2010). Titaniumoral
implants, surface characteristics, interface biology and clinical outcome. Journal of
the Royal Society Interface,6; 7Suppl 5, 515–527.
Pashley, D. H. & Carvalho, R. M. (1997). Dentine permeability and dentine adhesion.
Journal of Dentistry, 25(5), 355-372.
Peruzzo, P. J., Anbinder, P. S., Pardini, O. R., Vega, J., Costa, C. A. & Galembeck, F.,
(2011). Waterborne polyurethane/acrylate, Comparison of hybrid and blend systems.
Progress in Organic Coatings, 72(3), 429-437.
Petrovic, Z.S., Javani, I. & Divjoakovic. (1998). Structure and physical properties of
segmented polyurethane elastomer containing chemical crosslinks in the hard
segment. Journal of Polymer Science. Part B, Polymer Physics, 36, 221-235.
Pohler, O. E. M. (2000). Unalloyed titanium for implants in bone surgery. Injury, 31, D7-
D13.
Powers, J. M. & Sakaguchi, R. L. (2006). Craig’s Restorative Dental Materials, Elsevier, St
Louis.
PukanszkyJr, B., Bagdi, K., Tovolgyi, Z., Varga, J., Botz, L. & Hudak, S., (2008).
Nanophase separation in segmented polyurethane elastomers, Effect of specific
interactions on structure and properties. European Polymer Journal, 44(8), 2431-
2438.
Rack, H. J. & Qazi, J. I. (2006). Titanium alloys for biomedical applications. Materials
Science and Engineering, C, 26(8), 1269-1277.
Rager, T., Meyer, G., Wegner, K., Mathauer, W., Machtle, W. & Schrof, D.U. (1999). Block
copolymer micelles as seed in emulsion polymerization. Macromolecular, Chemistry
and Physics, 200, 1681-1691.
Rahman, M. M., Kim, E.-Y., Yun Kwon, J., Yoo, H.-J. & Kim, H.-D. (2008). Cross-linking
reaction of waterborne polyurethane adhesives containing different amount of ionic
groups with hexamethoxymethyl melamine. International Journal of Adhesion and
Adhesives, 28(1–2), 47-54.
122
Ramesh, S., Rajalinggam, P. & Radhakrishnan, G. (1991). Chain extended polyurethanes-
Synthesis and characterization. Polymer International, 25, 253-256.
Ranby, B.,Gao, Z.M., Hult, A. & Zhang, P.Y. (1986). Modification of polymer surfaces by
graft copolymerization, Journal of Polymer, 27, 38-39.
Regen, S. L, Kirszensztejn, P. Singh, A. (1983). A new approach for modifying polymer
surfaces. Macromolecules, 16, 335-338.
Reisch, M. S. (1990). Marine paint makers strive to meet environmental concerns. Chemical
and Engineering News, 17, 39–68.
Rogulska, M., Kultys, A. & Podkoscielny, W. (2007). Studies on thermoplastic
polyurethanes based on new diphenylethane-derivatives diols.II.Synthesis and
characterization of segmented polyurethanes from HDI and MDI. European Polymer
Journal, 43, 1402-1414.
Ruddell, D. E., Maloney, M. M. & Thompson, J. Y. (2002). Effect of novel filler particles on
the mechanical and wear properties of dental composites. Dental Materials, 18(1),
72-80.
Rueda-Larraz, L., d’Arlas, B. F., Tercjak, A., Ribes, A., Mondragon, I., & Eceiza, A.
(2009).Synthesis and microstructure–mechanical property relationships of segmented
polyurethanes based on a PCL–PTHF–PCL block copolymer as soft segment.
European Polymer Journal, 45(7), 2096-2109.
Saha, T. K., Khan, M. A. & Idriss Ali, K. M. (1994). Physical and mechanical properties of
Ultraviolet (UV) cured films. Radiation Physics and Chemistry, 44(4), 409-414.
Santerre, J. P., Woodhouse, K., Laroche, G. & Labow, R. S. (2005).Understanding the
biodegradation of polyurethanes, From classical implants to tissue engineering
materials. Biomaterials, 26(35), 7457-7470.
Sarkar, D., & Lopina, S. T. (2007). Oxidative and enzymatic degradations of l-tyrosine based
polyurethanes. Polymer Degradation and Stability, 92(11), 1994-2004.
Satterthwaite, J. D., Maisuria, A., Vogel, K. & Watts, D. C. (2012).Effect of resin-composite
filler particle size and shape on shrinkage-stress. Dental Materials, 28(6), 609-614.
Saunders, J.H. & Frisch, K.C. (1964). Polyurethanes, Chemistry and Technology, Part II,
Technology. Interscience Publishers, New York.

123
Sharma, P. & Devi Sharma, J. (2001). In vitro hemolysis of human erythrocytes — by plant
extracts with antiplasmodial activity. India Journal of Ethnopharmacology, 74, 239–
243.
Shenker, B. J., Maserejian, N. N., Zhang, A. & McKinlay, S. (2008). Immune function
effects of dental amalgam in children, a randomized clinical trial. Journal of
American Dental Association, 139, 1496–1505.
Silver, J. H., Lewis, K. B., Ratner, B. D. & Cooper, S.L. (1993). Effect of polyol type on the
surface structure of sulfonate-containing polyurethanes. Journal of biomedical
Materials Research, 27, 735-745.
Soderholm, K. J. (2007). Dental adhesives how it all started and later evolved. Journal of
Adhesion Dental Supply, 2, 227–230.
Solhi, L., Atai, M., Nodehi, A., Imani, M., Ghaemi, A. & Khosravi, K. (2012). Poly(acrylic
acid) grafted montmorillonite as novel fillers for dental adhesives, Synthesis,
characterization and properties of the adhesive. Dental Materials, 28(4), 369-377.
Spoerke, E. D., Murray, N. G., Li, H., Brinson, L. C., Dunand, D. C. & Stupp, S. I. (2005). A
bioactive titanium foam scaffold for bone repair. ActaBiomaterialia, 1(5), 523-533.
Stein, P. S., Sullivan, J., Haubenreich, J. E. & Osborne, P. B. (2005).Composite resin
inmedicine and dentistry. Journal of Long Term Effect Med Implants, 15, 641–654.
Strietzel, R. & Lahl, C. (2009) .Einführung in die CAD/CAM-Systeme.Teil V Dental Labor
10, 1400–1407.
Subramani, S., Park, Y.J., Cheong, I.W & Kim, J.H. (2004). Polyurethane ionomer
dispersions from a blocked aromatic-diisocyanate prepolymer. Polymer International,
53,1145-1152.
Sultan, M., Bhatti, H. N., Zuber, M., Bhatti, I. A. & Sheikh, M. A. (2011). Improvement of
performance behavior of cellulosic fiber with polyurethane acrylate copolymers.
Carbohydrate Polymers, 86(2), 928-935.
Sultan, M., Zia, K. M., Bhatti, H. N., Jamil, T., Hussain, R. & Zuber, M. (2012).Modification
of cellulosic fiber with polyurethane acrylate copolymers. Part I, Physicochemical
properties. Carbohydrate Polymers, 87(1), 397-404.
Takahara, A., Okkema, A. Z., Wabers, H. & Cooper, S.L. (1991). Effect of hydrophilic soft
segment side chains on the surface properties and blood compatibility of

124
segmentedpoly(urethaneureas). Journal of Biomedical Materials Research,25, 1095-
1118.
Teli, M.D., Paul, R. & Pardeshi, P. D. (2000). Softener in textile industry, Chemistry,
classification and applications. Colourage, 47, 17-28.
Tielemans, M., Roose, P., Groote, P. D. & Vanovervelt, J.-C.(2006). Colloidal stability of
surfactant-free radiation curable polyurethane dispersions. Progress in Organic
Coatings, 55(2), 128-136.
Tomasino, C. (1992). Chemistry and technology of fabric preparation & finishing. USA,
College of Textiles, North Carolina State Uni., pp. 134–153.
Ulrich, H. (1983. Polyurethane. In, Modern Plastics Encyclopedia, Vol. 60. McGraw-Hill,
New York, pp. 76–84.
Urbanski, J., Czerwinski, W., Janicka, K., Majewska, F. & Zowall, H. (1977).Handbook of
Analysis of Synthetic Polymers and Plastics.EllisHorwood Limited, Chichester, UK.
Van Noort, R. (2007). Introduction to Dental Materials, Elsevier, Philadelphia.
Vidnes-Kopperud, S., Tveit, A. B., Gaarden, T., Sandvik, L. & Espelid, I. (2009).Factors
influencing dentists’ choice of amalgam and tooth-colored restorative materials for
Class II preparations in younger patients. ActaOdontologicaScandinavica, 67, 74–79.
Vuorinen, A.-M., Dyer, S. R., Lassila, L. V. J. & Vallittu, P. K. (2008). Effect of rigid rod
polymer filler on mechanical properties of poly-methyl methacrylate denture base
material. Dental Materials, 24(5), 708-713.
Wang, F., Hu, J. Q. & Tu, W. P. (2008). Study on microstructure of UV-curable
polyurethane acrylate films. Progress in Organic Coatings, 62, 245–250.
Wang, L.-F.(2005). Effect of soft segment length on the thermal behaviors of fluorinated
polyurethanes. European Polymer Journal, 41(2), 293-301.
Wang, R.-M., Wang, J.-F., Wang, X.-W., He, Y.-F., Zhu, Y.-F. & Jiang, M.-L.(2011).
Preparation of acrylate-based copolymer emulsion and its humidity controlling
mechanism in interior wall coatings. Progress in Organic Coatings, 71(4), 369-375.
Wang, R.Z. & Weiner, S. (1997). Strain-structure relations in human teeth using Moire
fringes. Journal of Biomechanics, 31(2),135–41.

125
Wang, X. & Luo, X. (2004).A polymer network based on thermoplastic polyurethane and
ethylene–propylene–diene elastomer via melt blending, morphology, mechanical
properties, and rheology. European Polymer Journal, 40(10), 2391-2399.
Wang, Y., Kimura, K., & Dubin, P. L. (2000). Polyelectrolyte-micelle coacervation, Effects
of micelle surface charge density, polymer molecular weight, and polymer/ surfactant
ratio. Macromolecules, 3, 3324–3331.
Wang, Y., Lue, A., & Zhang, L. (2009). Rheological behavior of waterborne
polyurethane/starch aqueous dispersions during cure. Polymer, 50(23), 5474-5481.
Weinmann, W., Thalacker, C. & Guggenbergeer, R. (2005).Siloranes in dental composites.
Dental Mateials, 21, 68–74.
Xiao, H., Xiao, K. C. & Frish.(1995). Polyurethane-urea anionmer dispersions.Journal of
Macromolecular Science, Pure and Applied, 32, 169-177.
Xin, H., Shen, Y. & Li, X. (2011). Novel cationic polyurethane-fluorinated acrylic hybrid
latexes, Synthesis, characterization and properties. Colloids and Surfaces A,
Physicochemical and Engineering Aspects, 384(1–3), 205-211.
Xu, H., Qiu, F., Wang, Y., Wu, W., Yang, D. & Guo, Q. (2012). UV-curable waterborne
polyurethane-acrylate, preparation, characterization and properties. Progress in
Organic Coatings, 73(1), 47-53.
Yagci, M. B., Bolca, S., Heuts, J. P. A., Ming, W. & de With, G. (2011). Self-stratifying
antimicrobial polyurethane coatings. Progress in Organic Coatings, 72(3), 305-314.
Yang, C.Q., Wei, W. & Lickfield, G.C. (2000). The Mechanical Strength of Durable Press
Finished Cotton Fabrics, Part II. Comparison of Crosslinking Agents with Different
Molecular Structures, Textile Research Journal, 70, 143-147.
Yap, A. U. J., Wang, X., Wu, X., & Chung, S. M. (2004). Comparative hardness and
modulus of tooth-colored restoratives, A depth-sensing microindentation study.
Biomaterials, 25(11), 2179-2185.
Yen, M. S., Chen, P.Y. & Tasi, H.C. (2003).Synthesis, properties and dyeing application of
nonionic waterborne polyurethanes with different chain length of ethyl diamines as
the chain extender. Journal of Applied Polymer Science, 90, 2824-2833.

126
Yih, R. S. & Ratner, B. D. (1987). A comparison of two angular dependent ESCA algorithms
useful for constructing depth profiles of surfaces. Journal of Electron Spectroscopy
and Related Phenomena, 43, 61-68.
Yoon, S. C., Ratner, B. D., Ivan, B. & Kennedy. J. P. (1994). Surface and bulk structure of
segmentedpoly(ether urethanes) with perfluoro chain extenders. Incorporation of
poly(dimethylsiloxane)and polyisobutylene macroglycols. Macromolecules, 27,
1548-1554.
Young, R. J. & Lovell, P. A. (1994). Introduction to Polymers, 2nd Edition.Chapman & Hall,
London.
Yu, B., Ahn, J.-S., Lim, J. I. & Lee, Y.-K.(2009). Influence of TiO2 nanoparticles on the
optical properties of resin composites. Dental Materials, 25(9), 1142-1147.
Yu, B., Lim, H.-N. & Lee, Y.-K.(2010). Influence of nano- and micro-filler proportions on
the optical property stability of experimental dental resin composites. Materials &
amp; Design, 31(10), 4719-4724.
Zandinejad, A. A., Atai, M., & Pahlevan, A. (2006).The effect of ceramic and porous fillers
on the mechanical properties of experimental dental composites. Dental Materials,
22(4), 382-387.
Zhang, C., Zhang, X., Dai, J., & Bai, C. (2008). Synthesis and properties of PDMS modified
waterborne polyurethane–acrylic hybrid emulsion by solvent-free method. Progress
in Organic Coatings, 63(2), 238-244.
Zhang, T., Wu, W., Wang, X., & Mu, Y. (2010). Effect of average functionality on properties
of UV-curable waterborne polyurethane-acrylate. Progress in Organic Coatings,
68(3), 201-207.
Zia, K. M., Bhatti, H. N. & Ahmad Bhatti, I. (2007). Methods for polyurethane and
polyurethane composites, recycling and recovery, A review. Reactive and Functional
Polymers, 67(8), 675-692.
Zia, K. M., Bhatti, I. A., Barikani, M., Zuber, M. & Islam ud, D. (2008). Surface
characteristics of UV-irradiated polyurethane elastomers extended with α, ω-alkane
diols. Applied Surface Science, 254(21), 6754-6761.
Zia, K. M., Tabassum, S., Barkaat-ul-Hasin, S., Zuber, M., Jamil, T. & Jamal, M. A. (2011).
Preparation of rich handles soft cellulosic fabric using amino silicone based softener.

127
Part-I, Surface smoothness and softness properties. International Journal of
Biological Macromolecules, 48(3), 482-487.
Zia, K. M., Tabassum, S., Barkaat-ul-Hasin, S., Zuber, M., Jamil, T. & Jamal, M. A. (2011).
Preparation of rich handles soft cellulosic fabric using amino silicone based softener.
Part-I, Surface smoothness and softness properties. International Journal of
Biological Macromolecules, 48(3), 482-487.
Zia, K. M., Zuber, M., Bhatti, I. A., Barikani, M. & Sheikh, M. A. (2009).Evaluation of
biocompatibility and mechanical behavior of chitin-based polyurethane
elastomers.Part-II, Effect of diisocyanate structure. International Journal of
Biological Macromolecules, 44(1), 23-28.
Zia, K. M., Zuber, M., Rizwan, A., Jamil, T., Tabasum, S. & Shahid, M. (2012).
Modification of cellulosic fabric using polyvinyl alcohol—Part-I, Physicochemical
properties. Carbohydrate Polymers, 87(3), 2063-2067.
Zia, K.M., Zuber, M., Bhatti, I.A., Barikani, M. & Sheikh, M.A. (2009). Evaluation of
biocompatibility and mechanical behavior of polyurethane elastomers based on
chitin/1,4-butane diol blends, International Journal of Biological Macromolecules 44,
18.
Zia, K. M., Zuber, M., Bhatti, I. A., Barikani, M. & Sheikh, M. A. (2009). Evaluation of
biocompatibility and mechanical behavior of chitin-based polyurethane elastomers.
Part-II: Effect of diisocyanate structure. International Journal of Biological
Macromolecules, 44(1), 23-28.
Zuber, M., Zia, K. M., Bhatti, I. A., Jamil, T., Fazalur, R. & Rizwan, A. (2012). Modification
of cellulosic fabric using polyvinyl alcohol, part-II, Colorfastness properties.
Carbohydrate Polymers, 87(4), 2439-2446.
Zuber, M., Zia, K. M., Tabassum, S., Jamil, T., Barkaat-ul-Hasin, S. & Khosa, M. K. (2011).
Preparation of rich handles soft cellulosic fabric using amino silicone based softener,
part II, Colorfastness properties. International Journal of Biological Macromolecules,
49(1), 1-6.

128
LIST OF PUBLICATIONS
1. Tabasum, S., Zuber, M., Jabbar, A. & Zia, K. M. (2013). Properties of the modified
cellulosic fabrics using polyurethane acrylate copolymers. Carbohydrate Polymers,94
(2), 866-873
2. Tabasum, S., Zuber, M., Jamil, T., Shahid, M. & Rizwan Hussain, R. (2013).
Antimicrobial and pilling evaluation of the modified cellulosic fabrics using
polyurethane acrylate co-polymers. International Journal of Biological
Macromolecules 56, 99– 105.
3. Zuber, M., Tabasum, S., Hussain, R. & Bukhari, H. I. (2013). Blends of
polyurethane-polymethyl methacrylate/TiO2-based Composites. Korean Journal of
chemical Engineering. 30 (8), 1652-1658
4. Zuber, M., Tabasum, S., Jamil, T., Shahid, M., Rizwan Hussain, R., Ferase, K. S. &
Bhatti, K. P. (2013). Biocompatibility and microscopic evaluation of PU-
PMMA/Tio2-based composites for dental applications. Journal of Applied Polymer
Science.doi:1002/APP39806.

Author's personal copy
Carbohydrate Polymers 94 (2013) 866– 873
Contents lists available at SciVerse ScienceDirect
Carbohydrate Polymers
jou rn al hom epa ge: www.elsev ier .com/ locate /carbpol
Properties of the modified cellulosic fabrics using polyurethaneacrylate copolymers
Shazia Tabasum, Mohammad Zuber, Abdul Jabbar, Khalid Mahmood Zia ∗
Institute of Chemistry, Government College University, Faisalabad 38030, Pakistan
a r t i c l e i n f o
Article history:Received 23 November 2012Received in revised form15 December 2012Accepted 13 January 2013Available online 11 February 2013
Keywords:Polyurethane acrylate copolymersPoly(caprolactone) diolFT-IRColorfastnessEmulsion stability
a b s t r a c t
Polyurethane acrylate copolymers (PAC) were synthesized via emulsion polymerization following threestep synthesis process using toluene-2,4-diisocyanate, hydroxy terminated poly(caprolactone) diol,2-hydroxyethylacrylate (HEA) and butyl acrylate (BuA). Structural characteristics of the synthesizedpolyurethane acrylate copolymer (PAC) were studied using Fourier Transform Infrared (FT-IR) spec-trophotometer and are with accordance with the proposed PAC structure. The physicochemical propertiessuch as solid contents (%), tackiness, film appearance and emulsion stability were studied, discussed andco-related with other findings. The plain weave poly-cotton printed fabrics after application of PAC wasevaluated applying colorfastness standard test method. The results revealed that emulsion stability isthe main controlling factor of the synthesized material in order to get better applications and properties.The emulsion stability of the synthesized material increased with increase in molecular weight of thepolycaprolactone diol.
© 2013 Elsevier Ltd. All rights reserved.
1. Introduction
The hard and soft segments of polyurethane result to form amicrophase separated structure, which brings them to be used invarious ways such as adhesives, coatings, biomedical materials andelastomers (Barikani & Hepburn, 1986, 1987). Polyurethane elas-tomers (PUEs) are possibly the most versatile classes of polymers asthey can be molded, injected, extruded and recycled (Zia, Bhatti, &Bhatti, 2007). Molecular characterization and morphological stud-ies of PUEs have been reported by many researchers (Rogulska,Podkoscielny, Kultys, Pikus, & Pozdzik, 2006; Zia, Barikani, Zuber,Bhatti, & Bhatti, 2008). The effect of the diisocyanate structure(Rogulska et al., 2006) and chain extender (CE) length using�,�-alkane diols on the crystallinity, surface morphology (Zia,Barikani, Zuber, Bhatti, & Bhatti, 2008) and thermo-mechanicalproperties (Zia, Barikani, Bhatti, Zuber, & Bhatti, 2008a) of PUEshave also been investigated and well documented. Regardingestablished literature on chitin based polyurethane synthesis,characterization and application, extensive work on structuralcharacterization, crystalline patterns, and thermal properties ofchitin-based polyurethane elastomers (PUEs) have been compre-hensively reported elsewhere (Zia, Barikani, Bhatti, Zuber, & Bhatti,2008b; Zia, Barikani, Zuber, Bhatti, & Sheikh, 2008; Zia, Bhatti,
∗ Corresponding author. Tel.: +92 300 6603967; fax: +92 041 9200671.E-mail address: [email protected] (K.M. Zia).
Barikani, Zuber, & Sheikh, 2008). In vitro biocompatibility andcytotoxicity of chitin/1,4-butanediol blend based polyurethaneelastomers have been reported in the literature (Zia, Zuber, Bhatti,Barikani, & Sheikh, 2009c, 2009d). Few reports have been foundon the structural characterization of chitin-based polyurethaneelastomers and their shape memory characteristics (Barikani, Zia,Bhatti, Zuber, & Bhatti, 2008; Zia, Zuber, Barikani, Bhatti, & Khan,2009). Surface morphology of starch (Matsushita et al., 2008), cel-lulose (Yokota, Kitaoka, & Wariishi, 2008), and chitin–humic acid(Santosa, Siswanta, Sudiono, & Utarianingrum, 2008) have alsobeen investigated and well documented. XRD studies and surfacecharacteristics of UV-irradiated and non-irradiated chitin-basedand alkane diols based polyurethane elastomers have also been pre-sented elsewhere (Zia, Barikani, Khalid, Honarkar, & Ehsan-ulHaq,2009; Zia, Barikani, Zuber, Bhatti, & Barmar, 2009a, 2009b). Themicrostructure of a polyurethane block itself is generally knownto be composed of different phases, i.e., it is based on domainswhich have been built of hard urethane-type segments derivedfrom diisocyanates, and on soft domains which have been builtfrom flexible segments derived from polyol components (Barikaniet al., 2008; Zia, Zuber, Barikani, Jabbar, & Khosa, 2010; Zia, Zuber,Mahboob, Sultana, & Sultana, 2010). By controlling variables suchas functionality, chemical composition and the molecular weight ofthe different reactants, a wide class of materials with significantlyvarying properties can be obtained (Zuber, Zia, Mahboob, Hassan,& Bhatti, 2010).
Waterborne polyurethanes (WPUs) are widely used in differ-ent fields such as coatings, adhesives and paints, since they are
0144-8617/$ – see front matter © 2013 Elsevier Ltd. All rights reserved.http://dx.doi.org/10.1016/j.carbpol.2013.01.087
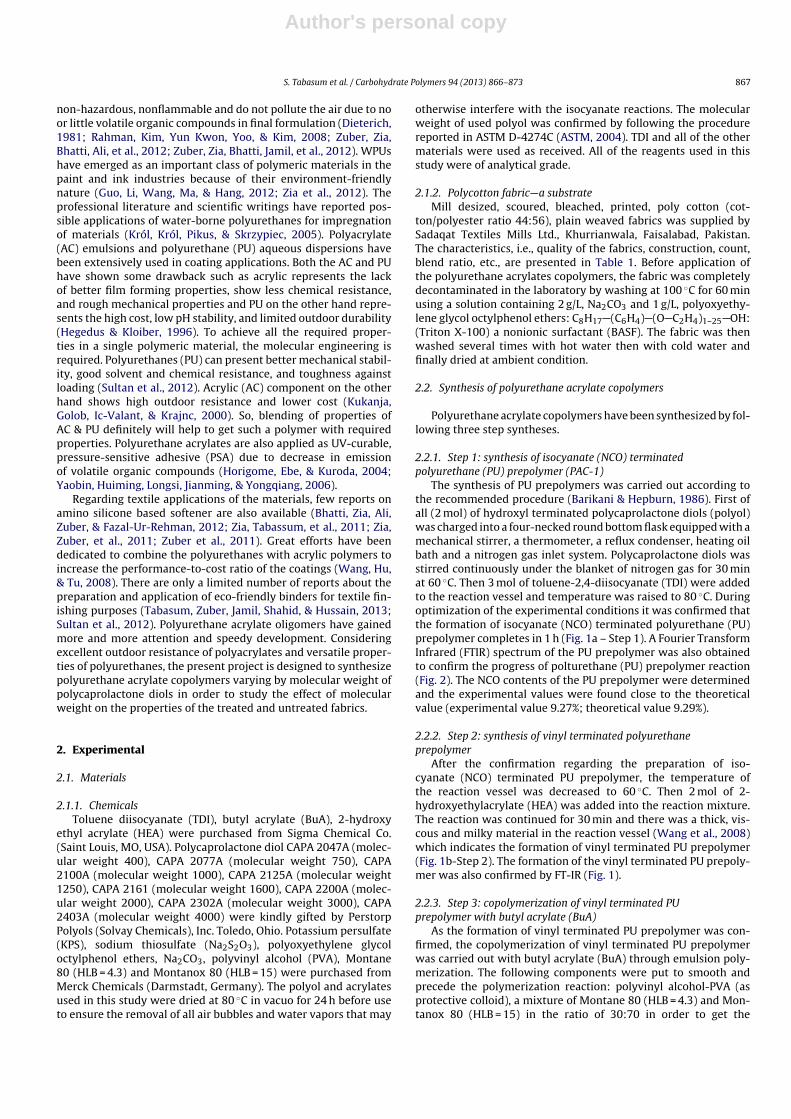
Author's personal copy
S. Tabasum et al. / Carbohydrate Polymers 94 (2013) 866– 873 867
non-hazardous, nonflammable and do not pollute the air due to noor little volatile organic compounds in final formulation (Dieterich,1981; Rahman, Kim, Yun Kwon, Yoo, & Kim, 2008; Zuber, Zia,Bhatti, Ali, et al., 2012; Zuber, Zia, Bhatti, Jamil, et al., 2012). WPUshave emerged as an important class of polymeric materials in thepaint and ink industries because of their environment-friendlynature (Guo, Li, Wang, Ma, & Hang, 2012; Zia et al., 2012). Theprofessional literature and scientific writings have reported pos-sible applications of water-borne polyurethanes for impregnationof materials (Król, Król, Pikus, & Skrzypiec, 2005). Polyacrylate(AC) emulsions and polyurethane (PU) aqueous dispersions havebeen extensively used in coating applications. Both the AC and PUhave shown some drawback such as acrylic represents the lackof better film forming properties, show less chemical resistance,and rough mechanical properties and PU on the other hand repre-sents the high cost, low pH stability, and limited outdoor durability(Hegedus & Kloiber, 1996). To achieve all the required proper-ties in a single polymeric material, the molecular engineering isrequired. Polyurethanes (PU) can present better mechanical stabil-ity, good solvent and chemical resistance, and toughness againstloading (Sultan et al., 2012). Acrylic (AC) component on the otherhand shows high outdoor resistance and lower cost (Kukanja,Golob, Ic-Valant, & Krajnc, 2000). So, blending of properties ofAC & PU definitely will help to get such a polymer with requiredproperties. Polyurethane acrylates are also applied as UV-curable,pressure-sensitive adhesive (PSA) due to decrease in emissionof volatile organic compounds (Horigome, Ebe, & Kuroda, 2004;Yaobin, Huiming, Longsi, Jianming, & Yongqiang, 2006).
Regarding textile applications of the materials, few reports onamino silicone based softener are also available (Bhatti, Zia, Ali,Zuber, & Fazal-Ur-Rehman, 2012; Zia, Tabassum, et al., 2011; Zia,Zuber, et al., 2011; Zuber et al., 2011). Great efforts have beendedicated to combine the polyurethanes with acrylic polymers toincrease the performance-to-cost ratio of the coatings (Wang, Hu,& Tu, 2008). There are only a limited number of reports about thepreparation and application of eco-friendly binders for textile fin-ishing purposes (Tabasum, Zuber, Jamil, Shahid, & Hussain, 2013;Sultan et al., 2012). Polyurethane acrylate oligomers have gainedmore and more attention and speedy development. Consideringexcellent outdoor resistance of polyacrylates and versatile proper-ties of polyurethanes, the present project is designed to synthesizepolyurethane acrylate copolymers varying by molecular weight ofpolycaprolactone diols in order to study the effect of molecularweight on the properties of the treated and untreated fabrics.
2. Experimental
2.1. Materials
2.1.1. ChemicalsToluene diisocyanate (TDI), butyl acrylate (BuA), 2-hydroxy
ethyl acrylate (HEA) were purchased from Sigma Chemical Co.(Saint Louis, MO, USA). Polycaprolactone diol CAPA 2047A (molec-ular weight 400), CAPA 2077A (molecular weight 750), CAPA2100A (molecular weight 1000), CAPA 2125A (molecular weight1250), CAPA 2161 (molecular weight 1600), CAPA 2200A (molec-ular weight 2000), CAPA 2302A (molecular weight 3000), CAPA2403A (molecular weight 4000) were kindly gifted by PerstorpPolyols (Solvay Chemicals), Inc. Toledo, Ohio. Potassium persulfate(KPS), sodium thiosulfate (Na2S2O3), polyoxyethylene glycoloctylphenol ethers, Na2CO3, polyvinyl alcohol (PVA), Montane80 (HLB = 4.3) and Montanox 80 (HLB = 15) were purchased fromMerck Chemicals (Darmstadt, Germany). The polyol and acrylatesused in this study were dried at 80 ◦C in vacuo for 24 h before useto ensure the removal of all air bubbles and water vapors that may
otherwise interfere with the isocyanate reactions. The molecularweight of used polyol was confirmed by following the procedurereported in ASTM D-4274C (ASTM, 2004). TDI and all of the othermaterials were used as received. All of the reagents used in thisstudy were of analytical grade.
2.1.2. Polycotton fabric—a substrateMill desized, scoured, bleached, printed, poly cotton (cot-
ton/polyester ratio 44:56), plain weaved fabrics was supplied bySadaqat Textiles Mills Ltd., Khurrianwala, Faisalabad, Pakistan.The characteristics, i.e., quality of the fabrics, construction, count,blend ratio, etc., are presented in Table 1. Before application ofthe polyurethane acrylates copolymers, the fabric was completelydecontaminated in the laboratory by washing at 100 ◦C for 60 minusing a solution containing 2 g/L, Na2CO3 and 1 g/L, polyoxyethy-lene glycol octylphenol ethers: C8H17 (C6H4) (O C2H4)1–25 OH:(Triton X-100) a nonionic surfactant (BASF). The fabric was thenwashed several times with hot water then with cold water andfinally dried at ambient condition.
2.2. Synthesis of polyurethane acrylate copolymers
Polyurethane acrylate copolymers have been synthesized by fol-lowing three step syntheses.
2.2.1. Step 1: synthesis of isocyanate (NCO) terminatedpolyurethane (PU) prepolymer (PAC-1)
The synthesis of PU prepolymers was carried out according tothe recommended procedure (Barikani & Hepburn, 1986). First ofall (2 mol) of hydroxyl terminated polycaprolactone diols (polyol)was charged into a four-necked round bottom flask equipped with amechanical stirrer, a thermometer, a reflux condenser, heating oilbath and a nitrogen gas inlet system. Polycaprolactone diols wasstirred continuously under the blanket of nitrogen gas for 30 minat 60 ◦C. Then 3 mol of toluene-2,4-diisocyanate (TDI) were addedto the reaction vessel and temperature was raised to 80 ◦C. Duringoptimization of the experimental conditions it was confirmed thatthe formation of isocyanate (NCO) terminated polyurethane (PU)prepolymer completes in 1 h (Fig. 1a – Step 1). A Fourier TransformInfrared (FTIR) spectrum of the PU prepolymer was also obtainedto confirm the progress of polturethane (PU) prepolymer reaction(Fig. 2). The NCO contents of the PU prepolymer were determinedand the experimental values were found close to the theoreticalvalue (experimental value 9.27%; theoretical value 9.29%).
2.2.2. Step 2: synthesis of vinyl terminated polyurethaneprepolymer
After the confirmation regarding the preparation of iso-cyanate (NCO) terminated PU prepolymer, the temperature ofthe reaction vessel was decreased to 60 ◦C. Then 2 mol of 2-hydroxyethylacrylate (HEA) was added into the reaction mixture.The reaction was continued for 30 min and there was a thick, vis-cous and milky material in the reaction vessel (Wang et al., 2008)which indicates the formation of vinyl terminated PU prepolymer(Fig. 1b-Step 2). The formation of the vinyl terminated PU prepoly-mer was also confirmed by FT-IR (Fig. 1).
2.2.3. Step 3: copolymerization of vinyl terminated PUprepolymer with butyl acrylate (BuA)
As the formation of vinyl terminated PU prepolymer was con-firmed, the copolymerization of vinyl terminated PU prepolymerwas carried out with butyl acrylate (BuA) through emulsion poly-merization. The following components were put to smooth andprecede the polymerization reaction: polyvinyl alcohol-PVA (asprotective colloid), a mixture of Montane 80 (HLB = 4.3) and Mon-tanox 80 (HLB = 15) in the ratio of 30:70 in order to get the

Author's personal copy
868 S. Tabasum et al. / Carbohydrate Polymers 94 (2013) 866– 873
Table 1Fabrics specification with quality and processed applications.
S. no. Quality Construction/count Blend ratio cotton/polyester Processed application
01 Plain weave poly cotton (76 × 68/30 × 30) 44/56 Pigments printed
Emulsifier systems of HLB value = 11.79, which is required forthe such polymerization reaction, potassium persulfate (KPS) withNa2S2O3 (as redox initiator). Sample code designation and differ-ent formulation of polyurethane acrylate copolymers (PAC) varyingmolecular weights of polycaprolactone diols is presented in Table 2.Aqueous solutions, i.e., 10% Montane 80:Montanox 80 (30:70), 3%
(w/v) of PVA and 0.2% of potassium persulfate (KPS) were preparedseparately following the formulation given in Table 3.
For this purpose 50% portions of the prepared above three solu-tions (emulsifier, PVA, KPS) were charged into the reaction vesselwith one third (6 g) of butyl acrylate with continuing stirring for 1 hand labeled as ‘A’. The remaining butyl acrylate (two-third, i.e., 12 g)
Fig. 1. Synthesis of polyurethane acrylate co-polymers containing polycaprolactone as a soft segment: (a) Step 1: preparation of NCO terminated polyurethane (PU)prepolymer, (b) Step 2: vinyl terminated PU prepolymer, and (c) Step 3: proposed polyurethane acrylate co-polymers.

Author's personal copy
S. Tabasum et al. / Carbohydrate Polymers 94 (2013) 866– 873 869
Table 2Sample code designation and different formulation of polyurethane copolymer varying molecular weight of polycapralactone diols.
Sample code CAPAa (MW) CAPA Trade name TDIb CAPAc HEAd VT-PUe (%) BuACf (%)
PAC-1 400 2074A 3 2 2 10 90PAC-2 750 2077A 3 2 2 10 90PAC-3 1000 2100A 3 2 2 10 90PAC-4 1250 2125A 3 2 2 10 90PAC-5 1600 2161A 3 2 2 10 90PAC-6 2000 2200A 3 2 2 10 90PAC-7 4000 2403A 3 2 2 10 90
a Different molecular weights of polycaprolactone diol.b Toluene-2,4-diisocyanate (mole ratio).c Polycaprolactone diol (mole ratio).d 2-Hydroxyethylacrylate (mole ratio).e Vinyl terminated polyurethane prepolymer blend (%).f Butyl acrylate blend (%).
was mixed up with 2 g of vinyl terminated polyurethane prepoly-mer using magnetic stirrer and labeled as the reagent ‘B’. After 1 hstirring of the above reagent mixer ‘A’; remaining halves of the solu-tions (emulsifier, PVA, KPS), and half of the reagent ‘B’ were chargedinto the ‘A’ with continuous stirring at 60 ◦C and the reaction wascontinued for another 1 h. The viscosity of the reaction mixture wasobserved to increase gradually with time. After 2 h of the reactionprogress, the remaining half of the ‘B’ was charged into the reactionvessel and the reaction was continued for other 1 h with continu-ous stirring. As a result the emulsion polymerization of the abovereactants was completed in almost 3 h with continuous stirring at60 ◦C (Fig. 1c – Step 3).
Following the detailed procedure mentioned above, a total of the7 samples of the emulsion of butyl acrylate and vinyl terminatedpolyurethane prepolymers were prepared varying the molecularweight of polycaprolactone diol in the PU prepolymer step. Thedetailed formulation of all these samples is given in Table 2. Whiteand translucent white emulsions were obtained which were savedfor further investigations. A schematic illustration of the chemicalroute for synthesis of PU acrylate copolymer is given in Fig. 1a–c(Steps 1–3).
2.3. Dry weight contents (solid contents)
Dry weight contents (solid contents) of PAC copolymers weredetermined by drying a weighed volume of emulsion in aluminumcups using dry heating oven at 60 ◦C for 3 h till constant weight. Thecalculation was done as following:
Solid contents (%) = C − A
B× 100
Weight of empty aluminum cup = A; weight of aluminum cup andPAC = B; weight of the aluminum cup and PAC after heating = C.
Table 3Preparation of polyurethane acrylate copolymer (PAC) emulsions.
S. no. Ingredients Quantity
1 Vinyl terminated polyurethaneprepolymer
2 g (2% of emulsion)
2 Butyl acrylates 18 g (18% of emulsion)3 Polyvinyl alcohol 3 g (3% of emulsion)4 Montane 80:Montanox 80
(30:70)10 g (10% of emulsion)
5 Potassium persulphate (KPS) 0.2 g (0.2% of emulsion)6 Na2S2O3 One crystal added in KPS7 Distilled water Water to make the volume
up to 100 mL
2.4. Molecular characterization
Molecular characterization of synthesized polyurethane acry-late copolymer sample containing different molecular weights wasconfirmed using Fourier Transform Infrared (FT-IR) spectroscopy.FT-IR scans of the prepared copolymer samples were obtained inthe transmission mode using a Shimadzu Fourier Transform Infra-red (FT-IR) spectrometer.
2.5. Treatment of fabrics with polyurethane acrylate copolymersemulsion
After the preparation of polyurethane acrylate copolymersemulsions containing different molecular weight of polycaprolac-tone diol, various dilutions (i.e., 15 g/L, 30 g/L and 50 g/L) of theprepared PAC samples were made and applied onto the printedpoly-cotton fabric. After application, the treated printed fabric sam-ples were dried at 100 ◦C for 4 min and then cured at 140 ◦C for5 min.
2.6. Physical characterization and colorfastness properties
The solid contents (%), emulsion stability and emulsionappearance were also observed continuously and reported. The col-orfastness to rubbing and change in shade of the printed treatedfabrics after application of PU acrylate copolymer were evaluatedapplying standard test method (AATCC, 1968; ASTM, 2004).
3. Results and discussion
3.1. Molecular characterization
FTIR spectra of all the monomers and individual polymeriza-tion steps were recorded and presented in Fig. 2. FTIR spectra oftoluene-2,4-diisocyanate (TDI), hydroxy terminated polycaprolac-tone diol, isocyanate (NCO) terminated PU prepolymer obtained bythe reaction of TDI and hydroxy terminated poly(caprolactone diol),2-hydroxyethylacrylate (HEA), vinyl terminated polyurethane(PU) prepolymer, butyl acrylate (BuA) and polyurethane acrylatecopolymers are jointly presented in Fig. 2. The peaks assignmentof the important functional group are presented and interpreted.FTIR spectrum of toluene-2,4-diisocyanate (TDI) (Fig. 2a) showa very sharp and an intense peak at 2241.28 cm−1 which cor-responds to the isocyanate ( NCO) groups attached to the TDIstructure. The FT-IR spectrum shows sharp peaks at 1516.05 cm−1
attributed to the C C stretching of benzene ring. The peaks assign-ment appeared in FTIR spectrum of poly(caprolactone) diol (PCL)is presented in Fig. 2b. The observed peaks in the functionalgroup region of PCL were assigned as: 3534 cm−1 (OH stretchingvibration); 2937.59 cm−1 (asymmetric CH2 stretching); 2876 cm−1

Author's personal copy
870 S. Tabasum et al. / Carbohydrate Polymers 94 (2013) 866– 873
Table 4Physical characteristics of polyurethane acrylate copolymers (PACs) coatings varying molecular weight of polycaprolactone diols.
Sample code Emulsion stability Emulsion appearance Tackiness Film appearance Solid content (%)
PAC-1 >1 year and ∼9 months White Tack free White 33.91PAC-2 >1 year and ∼10 months White Tack free White 34.12PAC-3 <1 year White Tack free Translucent white 34.43PAC-4 <1 year White Tack free Translucent white 34.69PAC-5 <1 year Translucent white Tack free Opaque white 34.96PAC-6 <1 year Translucent white Tack free Off white 35.11PAC-7 <1 year Translucent white Tack free Off white 35.45
(symmetric CH2 stretching); 1724.36 cm−1 (C O stretching);1168.86 cm−1 (C O stretching). These two monomers (TDI & PCL)were reacted in the reaction flask and the reaction was lasted for1 h at 100 ◦C. After optimization of the experimental conditions, itwas observed that formation of polyurethane prepolymer is com-pleted in 1 h and isocyanate terminated PU prepolymer has beenproduced. FT-IR spectrum of NCO terminated PU prepolymer hasbeen given in Fig. 2c. It can be clearly observed from the spec-trum that isocyanate ( NCO) group has been reacted with the OHgroup of the PCL and therefore the signal for the OH groups disap-peared and that of the intensity of isocyanate ( NCO) groups hasreduced to some extent resulting that isocyanate terminated PUprepolymer has been formed with a signal for NH units appeared at3239 cm−1 (Fig. 2c). The other peaks observed in the FT-IR spectrumof PU prepolymer were assigned as: 2930 cm−1 (CH symmetricstretching of CH2); 2893 cm−1 (CH asymmetric stretching of CH2groups); 2267 cm−1 (isocyanate ( NCO) group); 1726 cm−1 (C Ostretching of soft segment of poly(caprolactone) diol); 1190 cm−1
(C O stretching of soft segment). Disappearance of intense peak2241.28 cm−1 ( NCO) and appearance of less intense peak at about2267 cm−1 ( NCO), confirms the completion of reaction and forma-tion of the NCO terminated PU prepolymer. The PU prepolymer hasalso shown some characteristic absorption peaks (Fig. 2c) whichwere assigned as: 1534 cm−1, 1530 cm−1 (N H and C N, bend-ing and stretching respectively), 1605 cm−1 (C C), 1720 cm−1 (C Ostretching) and 3339 cm−1 (N H stretching). The isocyanate ter-minated PU prepolymer was further reacted with 2-hydroxyl ethylacrylate (HEA) following the established reported method (Sultanet al., 2012). The FTIR spectrum of 2-HEA (Fig. 2d) has shownmany characteristics peaks, i.e., a broad peak at 3433.29 cm−1
corresponds to OH stretching vibration; 2923.78 cm−1, attributedto asymmetric CH2 stretching; 2883.58 cm−1, assigned to sym-metric CH2 stretching; 1714.15 cm−1, ascribed to C O stretching;1545 cm−1 relates to C C stretching; 1193.94 cm−1, consigned toC O, C C stretching. The vinyl terminated PU prepolymer wasformed by the reaction of isocyanate terminated PU prepolymerwith that of 2-hydroxy ethyl acrylates. FTIR spectra of vinyl ter-minated PU polymer show a well-defined peak of N H stretchingat 3333 cm−1 attributed to the formation of urethane linkage inthe vinyl terminated PU prepolymer (Fig. 2e). The CH stretchingof CH2 group was observed at 2929.87 cm−1. The FT-IR spectrumshows very sharp peaks at 1716.65 cm−1 and 1531.48 cm−1 whichare attributed to the C O and C C stretching of the synthesizedmaterial, respectively. It is clearly observed in the FTIR spectrumof vinyl terminated PU prepolymer that isocyanate (NCO) peakhas been disappeared indicating the complete utilization of theNCO contents with that of 2-hydroxy ethyl acrylate forming vinylterminated PU prepolymer. The chain extension of vinyl termi-nated PU prepolymer was carried out with the addition of butylacrylate. The FT-IR spectrum of butyl acrylate (BuA) is presentedin Fig. 2f. The FTIR spectrum of BuA showed distinct characteris-tic peaks which are assigned as: 2949.16 cm−1 (asymmetric CH2stretching); 2832 cm−1 (symmetric CH2 stretching); 1724.36 cm−1
(C O stretching); 1534 cm−1 (C C stretching); 1188.15 cm−1 (C O,C C stretching). The reaction of butyl acrylate with that of vinyl
terminated polyurethane prepolymer leads to the formation of PUacrylate copolymers. The FTIR spectrum of finally synthesized PUacrylate copolymers is presented in Fig. 2g. The FTIR spectrumshows characteristic peaks, i.e., 3371.57 cm−1, attributed to N Hstretching; 1693.49 cm−1, corresponds to carbonyl stretching; and2929.87 cm−1, 2847.70 cm−1 ascribed to CH anti-symmetric andsymmetric stretching, respectively. The clear information aboutthe vibrational mode changes due to involvement of butyl acrylateto the polyurethane backbone during the polymerization reactioncan be obtained and hence the completion of the reaction can alsobe best studied through FTIR analysis technique. It is worth men-tioning that the completeness of polymerization reaction can beconfirmed by the appearance or disappearance of some character-istic peaks. As in the case, the FTIR spectra the isocyanate (NCO)peak at 2267 cm−1 disappeared and the N H peak at 3371.57 cm−1
appeared, confirm the completion of polymerization reaction andhence formation of proposed polyurethane acrylate copolymer.
3.2. Physical characterization
The results regarding physical characteristics of polyurethaneacrylate copolymers (PAC) varying molecular weight of polycapro-lactone diols are presented in Table 4. Physical characteristics ofPAC samples such as solid contents (%), emulsion appearance, tacki-ness, film appearance and emulsion stability are reported in Table 4.These parameters are essential for further use of emulsions in var-ious applications. Solid content of the synthesized material is inthe ranges of 33–36% which are in good agreement with that ofSultan et al. (2012). The reported results in Table 4 emphasis thatdry weight content of PU acrylate copolymer sample PAC-1 is lesseras compared to the PAC-7, although, equal amount of the vinylterminated polyurethane prepolymer was taken during emulsionpolymerization with BuA. This slight continual increase in the solidcontents can be explained on the basis of the gradual increase inthe macrodiols. So, by increasing the molecular weight of the poly-caprolactone diol the resultant emulsion showed gradual increasein solid contents (%). It is worth mentioning that high solid contentssample have a short drying time and form an adjustable film thick-ness in fewer passes.
Emulsion appearance in all the studied samples is almost same,i.e., white or translucent white, however sample containing molec-ular weight up to 1250 g/mol show white and remaining showtranslucent white appearance. A gradual increase in translucencyof the emulsion with increase in molecular weight of polycapro-lactone diols has been observed. It looks that the relatively morepolarity of the ester linkage in the polycaprolactone diols (CAPA)moiety is responsible for this effect. The results presented inTable 4 revealed that the emulsion stability of all the preparedpolyurethane acrylate copolymer samples continually increases byincreasing the molecular weight of the soft segment (PCL). By usinglow molecular weight PCL, i.e., 400 and 750, the stability of theemulsion is ∼9 and ∼10 months, respectively. However by usinghigher molecular weight of PCL (>1000) the stability of the emulsionis observed greater than 1 year. The preparation of polyurethanedispersion has been reported by many researchers (Dieterich &

Author's personal copy
S. Tabasum et al. / Carbohydrate Polymers 94 (2013) 866– 873 871
Fig. 2. FT-IR spectra: (a) toluene-2,4-diisocyanate (TDI); (b) polycaprolactone diol(CAPA); (c) NCO terminated polyurethane prepolymer; (d) 2-hydroxyethylacrylate(HEA); (e) vinyl terminated polyurethane prepolymer; (f) butyl acrylate (BuA); (g)Final polyurethane acrylate copolymers (PUAC).
Dieterich, 1973) and polyelectrolyte properties of polyurethanehave also been filed time to time. Polyelectrolyte phenomenonof PU well defines the stability of emulsions. Polyurethane mayonly show polyelectrolyte properties if there are some specificfunctional groups (capable of carrying positive or negative charge)attached to the polyurethane backbone. However in this case, nosuch group is attached and the emulsion stability may be attributedto the biphase nature of the PAC emulsion. It has been observed andreported in the above lines that the color of the emulsion changesfrom white to translucent white by increasing the molecular weightof the polycaprolactone diol. The acrylate based PU samples hav-ing high molecular weight of CAPA gave translucent emulsion. Thismight be due to better interaction because of more hydrophilicregions in the polymer chain. Therefore, with increasing the molec-ular weight of the polyurethane acrylates copolymers, the stabilityincreases. However, if the molecular weight is too high, it will notdissolve in the solution and instead of increasing stability it willform gel lumps, and ultimately results to decrease the emulsionstability (Wang, Kimura, & Dubin, 2000). Therefore it can be con-cluded that up to the use of molecular weight of CAPA 4000 g/mol(CAPA 2403A), the emulsions remain stable. The resulting orderof emulsion stability of the prepared samples will surely be greatinfluenced on the treated fabrics samples imparting high tensilestrength and stretch-ability, excellent film forming characteristics,good body and handle for finished fabrics, excellent wash-fastness,resistant to dry cleaning, high crease resistance and excellent pillresistance.
3.3. Colorfastness properties
The properties of the fabrics to resist the change in color towardsthe various testing parameters are called the colorfastness prop-erties. The results of colorfastness to rubbing (dry and wet) arepresented in Fig. 3. The results revealed that the treatment ofpolyurethane acrylates copolymers has pronounced effect on thecrock fastness properties of all the treated fabric swatches. Theuntreated fabric swatch has shown dry and wet rubbing rating 3and 2/3, respectively, whereas all the treated fabrics swatches haveshown dry rubbing rating in the range of 3/4 to 4, and wet rubbingrating in the range of 3 to 3/4. It is clear from the results (Table 4)all the treated fabrics swatches have shown some better resistanceto crocking. However, the samples treated with polyurethane acry-late copolymer containing low molecular weight of PCL have shownsome slightly poor crock fastness as compared to those contain-ing high molecular weight. The display of such results might bebecause of formation of stable tough coating layer on the treatedfabrics. The performance of PAC emulsion based on high molec-ular weight PCL is slightly better than those of containing lowermolecular weight PCL. This is very interesting display of struc-ture property correlation. It looks that in case of high molecularweight PCL the resulting PAC has higher number of polar estergroups incorporated in the polymer chain. These provide moreopportunity and have maximum inter-chain interaction and poly-mer substrate interaction which results in better performance. Thisimprovement in the crock fastness of all the treated fabric swatchesmay also come jointly with a remarkable chemical versatility dueto the presence of the acrylic and urethane ( NHCOO ) groups. Ithas been reported in the established literature that PU show bet-ter solvent and chemical resistance, and toughness (Sultan et al.,2012) and polyacrylates (AC) component on the other hand showshigh outdoor resistance and pigment ability (Kukanja et al., 2000).The combination of both these components will ultimately showthe better resistance against crocking. It is also well know thatacrylate polymer belongs to a group of polymers which could bereferred to generally as plastics and are noted for their transparencyand resistance to breakage and elasticity. These lines also support

Author's personal copy
872 S. Tabasum et al. / Carbohydrate Polymers 94 (2013) 866– 873
Fig. 3. Colorfastness to rubbing data of treated and untreated printed poly-cotton fabric (ISO X12).
the stability and resultant properties of the synthesized PAC emul-sion.
4. Conclusion
Polyurethane acrylate copolymers (PAC) samples were preparedvarying molecular weight of polycaprolactone diol reacting withtoluene-2,4-diisocyanate (TDI), and chain was extended with 2-hydroxy ethyl acrylate to form vinyl terminated PU preploymer,and finally the co-polymerization was completed by free radi-cal polymerization using butyl acrylate in emulsification process.The FTIR spectra of the monomers, prepolymers and copolymersconfirmed the proposed PACs structure. The physical characteriza-tion such as solid contents (%), emulsion appearance and emulsionstability were studied and discussed. The different dilutions ofsynthesized polyurethane acrylate copolymer were applied on tothe mill desized, bleached, printed poly-cotton plain weave fab-rics using dip-padding techniques. The outcome of the results fullycorrelates the structure property relationship of the synthesizedmaterials.
Acknowledgements
The reported research work is the part of PhD thesis of Ms. ShaziaTabsum. Financial support of Higher Education Commission (HEC),Government of Pakistan regarding indigenous 5000 scholarshipbatch-VI is highly appreciated and acknowledged for the conductof this research work. The authors are also thankful to PerstorpPolyols (Solvay Chemicals, Inc. Toledo, Ohio) for gifting the polyolssamples.
References
AATCC. (1968). Standard test method. D-79.ASTM Standards. (2004). Standard test method for pilling resistance and other related
surface changes of textile fabrics: Elastomeric Pad 1 (D 3514-02). USA: AmericanSociety of Testing Material, ASTM International.
Barikani, M., & Hepburn, C. (1986). Isocyanurate crosslinking as a means of producingthermally stable polyurethane elastomers. Cellular Polymer, 5, 169–185.
Barikani, M., & Hepburn, C. (1987). The relative thermal stability of polyurethaneelastomers: 3. Influence of chain extender structure. Cellular Polymers, 6, 47–67.
Barikani, M., Zia, K. M., Bhatti, I. A., Zuber, M., & Bhatti, H. N. (2008). Molecular engi-neering and properties of chitin based shape memory polyurethane elastomers.Carbohydrate Polymers, 74, 621–626.
Bhatti, I. A., Zia, K. M., Ali, Z., Zuber, M., & Fazal-Ur-Rehman. (2012). Modification ofcellulosic fibers to enhance their dyeability using UV-irradiation. CarbohydratePolymers, 89(3), 783–787.
Dieterich, D. (1981). Aqueous emulsions, dispersions and solutions ofpolyurethanes; synthesis and properties. Progress in Organic Coatings,9(3), 281–340.
Dieterich, D., & Dieterich, D. (1973). Polyurethane polyelectrolytes and process forpreparing same. USPTO, Patent Number: 3756992, Issue Date: September 4,1973.
Guo, Y.-H., Li, S.-C., Wang, G.-S., Ma, W., & Hang, Z. (2012). Waterbornepolyurethane/poly(n-butyl acrylate-styrene) hybrid emulsions: Particle for-mation, film properties, and application. Progress in Organic Coatings, 74,248–256.
Hegedus, C. R., & Kloiber, K. (1996). Aqueous acrylic-polyurethane hybrid disper-sions and their use in industrial coatings. Journal of Coatings Technology, 68(860),39–48.
Horigome, K., Ebe, K., & Kuroda, S. (2004). UV curable pressure-sensitive adhe-sives for fabricating semicondutors. II. The effect of functionality of acrylatemonomers on the adhesive properties. Journal of Applied Polymer Science, 93,2889–2895.
Król, P., Król, B., Pikus, S., & Skrzypiec, K. (2005). Study on the synthesis and onsupermolecular structures of a water-dilutable urethane–acrylic copolymerapplicable as a binder for powdered Al2O3. Colloids and Surfaces A: Physicochem-ical & Engineering Aspects, 259, 35–44.
Kukanja, D., Golob, J., Ic-Valant, Z., & Krajnc, A. M. (2000). The structure and prop-erties of acrylic–polyurethane hybrid emulsions and comparison with physicalblends. Journal of Applied Polymer Science, 78, 67–80.
Matsushita, Y., Suzuki, A., Sekiguchi, T., Saito, K., Imai, T., & Fukushima, K. (2008).Mapping of the cationic starch adsorbed on pulp fibers by ToF-SIMS. AppliedSurface Science, 255, 1022–1024.
Rahman, M. M., Kim, E.-Y., Yun Kwon, J., Yoo, H.-J., & Kim, H.-D. (2008). Cross-linkingreaction of waterborne polyurethane adhesives containing different amount ofionic groups with hexamethoxymethyl melamine. International Journal of Adhe-sion and Adhesives, 28(1–2), 47–54.
Rogulska, M., Podkoscielny, W., Kultys, A., Pikus, S., & Pozdzik, E. (2006). Studies onthermoplastic polyurethanes based on new diphenylethane-derivative diols. I.Synthesis and characterization of nonsegmented polyurethanes from HDI andMDI. European Polymer Journal, 42, 1786–1797.
Santosa, S. J., Siswanta, D., Sudiono, S., & Utarianingrum, R. (2008). Chitin–humicacid hybrid as adsorbent for Cr(III) in different of tannery wastewater treatment.Applied Surface Science, 254, 7846–7850.
Sultan, M., Zia, K. M., Bhatti, H. N., Jamil, T., Hussain, R., & Zuber, M. (2012).Modification of cellulosic fiber with polyurethane acrylate copolymers. Part I:Physicochemical properties. Carbohydrate Polymers, 87, 397–404.
Tabasum, S., Zuber, M., Jamil, T., Shahid, M., & Hussain, R. (2013). Antimicro-bial activity and pilling evaluation of the modified cellulosic fabrics usingpolyurethane acrylate copolymers. International Journal of Biological Macro-molecules, http://dx.doi.org/10.1016/j.ijbiomac.2013.01.024
Wang, F., Hu, J. Q., & Tu, W. P. (2008). Study on microstructure of UV-curablepolyurethane acrylate films. Progress in Organic Coatings, 62, 245–250.
Wang, Y., Kimura, K., & Dubin, P. L. (2000). Polyelectrolyte-micelle coacervation:Effects of micelle surface charge density, polymer molecular weight, and poly-mer/surfactant ratio. Macromolecules, 3, 3324–3331.
Yaobin, R., Huiming, P., Longsi, L., Jianming, X., & Yongqiang, Y. (2006). Synthesis ofpolyurethane acrylate and application to ultraviolet-curable pressure-sensitiveadhesive. Polymer-Plastics Technology and Engineering, 45, 495–502.
Yokota, S., Kitaoka, T., & Wariishi, H. (2008). Surface morphology of cellulose filmsprepared by spin coating on silicon oxide substrates pretreated with cationicpolyelectrolyte. Applied Surface Science, 253, 4208–4214.
Zia, K. M., Barikani, M., Bhatti, I. A., Zuber, M., & Bhatti, H. N. (2008a). Syn-thesis and thermo-mechanical characterization of polyurethane elastomersextended with �,�-alkane diols. Journal of Applied Polymer Science, 109,1840–1849.
Zia, K. M., Barikani, M., Bhatti, I. A., Zuber, M., & Bhatti, H. N. (2008b). Syn-thesis and characterization of novel biodegradable thermally stable chitinbased polyurethane elastomers. Journal of Applied Polymer Science, 110,769–776.

Author's personal copy
S. Tabasum et al. / Carbohydrate Polymers 94 (2013) 866– 873 873
Zia, K. M., Barikani, M., Khalid, A. M., Honarkar, H., & Ehsan-ulHaq. (2009). Surfacecharacteristics of UV-irradiated chitin based polyurethane elastomers. Carbohy-drate Polymers, 77, 621–627.
Zia, K. M., Barikani, M., Zuber, M., Bhatti, I. A., & Barmar, M. (2009a). Surface char-acteristics of polyurethane elastomers based on chitin/1,4-butane diol blends.International Journal of Biological Macromolecules, 44, 182–185.
Zia, K. M., Barikani, M., Zuber, M., Bhatti, I. A., & Barmar, M. (2009b). XRD studiesof UV-irradiated chitin-based polyurethane elastomers. Carbohydrate Polymers,77, 54–58.
Zia, K. M., Barikani, M., Zuber, M., Bhatti, I. A., & Bhatti, H. N. (2008). Morphologi-cal studies of polyurethane elastomers extended with �,�-alkane diols. IranianPolymer Journal, 17, 61–72.
Zia, K. M., Barikani, M., Zuber, M., Bhatti, I. A., & Sheikh, M. A. (2008). Molecularengineering of chitin based polyurethane elastomers. Carbohydrate Polymers,74, 149–158.
Zia, K. M., Bhatti, H. N., & Bhatti, I. A. (2007). Methods for polyurethane andpolyurethane composites, recycling and recovery: A review. Reactive and Func-tional Polymer, 67, 675–692.
Zia, K. M., Bhatti, I. A., Barikani, M., Zuber, M., & Sheikh, M. A. (2008). XRD stud-ies of chitin based polyurethane elastomers. International Journal of BiologicalMacromolecules, 43, 136–141.
Zia, K. M., Tabassum, S., Barkaat-ul-Hasin, S., Zuber, M., Jamil, T., & Jamal, M. A.(2011). Preparation of rich handles soft cellulosic fabric using amino siliconebased softener. Part-I: Surface smoothness and softness properties. InternationalJournal of Biological Macromolecules, 48, 482–487.
Zia, K. M., Zuber, M., Barikani, M., Bhatti, I. A., & Khan, M. B. (2009). Surface char-acteristics of chitin based shape memory polyurethane elastomers. Colloids andSurfaces B: Biointerfaces, 72, 248–252.
Zia, K. M., Zuber, M., Bhatti, I. A., Barikani, M., & Sheikh, M. A. (2009c). Evaluation ofbiocompatibility and mechanical behavior of polyurethane elastomers based onchitin/1,4-butane diol blends. International Journal of Biological Macromolecules,44, 18–22.
Zia, K. M., Zuber, M., Bhatti, I. A., Barikani, M., & Sheikh, M. A. (2009d). Evaluationof biocompatibility and mechanical behavior of chitin polyurethane elastomers.Part-II: Effect of diisocyanate structure. International Journal of Biological Macro-molecules, 44, 23–28.
Zia, K. M., Zuber, M., Barikani, M., Hussain, R., Jamil, T., & Anjum, S. (2011). Cyto-toxicity and mechanical behavior of chitin-bentonite clay based polyurethanebio-nanocomposites. International Journal of Biological Macromolecules, 49(5),1131–1136.
Zia, K. M., Zuber, M., Barikani, M., Jabbar, A., & Khosa, M. K. (2010). XRD pattern ofchitin based polyurethane bio-nanocomposites. Carbohydrate Polymers, 80(2),540–544.
Zia, K. M., Zuber, M., Mahboob, S., Sultana, T., & Sultana, S. (2010). Surface character-istics of UV-irradiated chitin-based shape memory polyurethanes. CarbohydratePolymers, 80(1), 229–234.
Zia, K. M., Zuber, M., Rizwan, A., Jamil, T., Tabasum, S., & Shahid, M. (2012). Mod-ification of cellulosic fabric using polyvinyl alcohol. Part-I: Physicochemicalproperties. Carbohydrate Polymers, 87(3), 2063–2067.
Zuber, M., Zia, K. M., Bhatti, I. A., Ali, Z., Arshad, M. U., & Saif, M. J. (2012). Modi-fication of cellulosic fibers by UV-irradiation. Part II: After treatments effects.International Journal of Biological Macromolecules, 51(5), 743–748.
Zuber, M., Zia, K. M., Bhatti, I. A., Jamil, T., Fazal-ur-Rehman, & Rizwan, A. (2012).Modification of cellulosic fabric using polyvinyl alcohol. Part II: Colorfastnessproperties. Carbohydrate Polymers, 87(4), 2439–2446.
Zuber, M., Zia, K. M., Mahboob, S., Hassan, M., & Bhatti, I. A. (2010). Synthesis of chitin-bentonite clay based polyurethane bio-nanocomposites. International Journal ofBiological Macromolecules, 47(2), 196–200.
Zuber, M., Zia, K. M., Tabassum, S., Jamil, T., Barkaat-ul-Hasin, S., & Khosa, M. K.(2011). Preparation of rich handles soft cellulosic fabric using amino siliconebased softener. Part II: Colorfastness properties. International Journal of BiologicalMacromolecules, 49, 1–6.

Author's personal copy
International Journal of Biological Macromolecules 56 (2013) 99– 105
Contents lists available at SciVerse ScienceDirect
International Journal of Biological Macromolecules
jo u r n al hom epa ge: ww w.elsev ier .com/ locate / i jb iomac
Antimicrobial and pilling evaluation of the modified cellulosic fabricsusing polyurethane acrylate copolymers
Shazia Tabasuma, Mohammad Zubera,∗, Tahir Jamilb, Muhammad Shahidc, Rizwan Hussaind
a Institute of Chemistry, Government College University, Faisalabad 38030, Pakistanb Department of Polymer Engineering and Technology, University of the Punjab, Lahore, Pakistanc Department of Chemistry and Biochemistry, University of Agriculture, Faisalabad 38040, Pakistand P.O. Box 2216, NESCOM, Islamabad, Pakistan
a r t i c l e i n f o
Article history:Received 11 December 2012Received in revised form 1 January 2013Accepted 18 January 2013Available online xxx
Keywords:Polyurethane acrylate copolymersPoly (caprolactone) diolPillingAntimicrobial activityEmulsion stability
a b s t r a c t
Polyurethane acrylate copolymers (PACs) were synthesized by three step synthesis process via emul-sion polymerization using toluene-2,4-diisocyanate, hydroxy terminated poly (caprolactone) diol (PCL),2-hydroxyethylacrylate (HEA) and butyl acrylate (BuA). The proposed structure of the synthesizedpolyurethane acrylate copolymer (PAC) was confirmed using Fourier transform infrared (FTIR) spec-trophotometer. The pilling characteristic and antimicrobial activities of the plain weave poly-cotton grey,white, printed and dyed fabric swatches after application of PAC were evaluated. The results revealedthat by increasing the molecular weight of PCL in the synthesized PAC samples, the antimicrobial activi-ties increased and this behavior was interpreted in term of increasing hydrophilic character. An increasein pilling ratings of the treated samples has been observed by increasing the molecular weight of thepolycaprolactone diols in the synthesized PAC samples.
© 2013 Elsevier B.V. All rights reserved.
1. Introduction
Polyurethane elastomers (PUEs) are possibly the most versa-tile classes of polymers as they can be molded, injected, extrudedand recycled [1]. Molecular characterization and morphologi-cal studies of PUEs have been reported [2,3]. The effect of thediisocyanate structure [2] and chain extender (CE) length using�,�-alkane diols on the crystallinity, surface morphology [3]and thermo-mechanical properties [4] of PUEs have also beeninvestigated and well documented. Extensive work on structuralcharacterization, crystalline patterns, and thermal properties ofchitin-based polyurethane elastomers (PUEs) have been compre-hensively reported elsewhere [5–8]. Few reports have been foundon the structural characterization of chitin-based polyurethanewith their shape memory characteristics [9,10]. Surface morphol-ogy of starch [11], cellulose [12], and chitin–humic acid [13] hasalso been investigated and well documented. XRD studies and sur-face characteristics of UV-irradiated, non-irradiated chitin-basedpolyurethane elastomers and chitin based PU bio-nanocomposites[14–19], and structural, surface and thermo-mechanical charac-teristics of UV-irradiated polyurethane elastomers extended with�,�-alkane diols have been comprehensively presented elsewhere[20–22]. The physicochemical properties including colorfastness
∗ Corresponding author. Tel.: +92 321 6682375; fax: +92 041 9200671.E-mail address: [email protected] (M. Zuber).
and surface properties of treated finished fabrics using polyvinylalcohol [23,24], polyurethane acrylate copolymers [25] have alsobeen reported. Modifications of cellulosic fibers to enhance theirdye-ability and their after-treatment affects using UV-irradiationhave also been filed [26,27]. Regarding textile applications of thematerials many reports on amino silicone based softener are alsoavailable [28,29].
Waterborne polyurethanes (WPUs) have potential array ofcommercial applications involving coatings, adhesives and paints,since they are non-hazardous, nonflammable and do not pol-lute the air due to no or little volatile organic compounds[30]. Preparation and properties of urethane/acrylate compositeby emulsion polymerization technique, and comparative studybetween core–shell and physicochemical properties of interpen-etrating network (IPN) structure of polyurethane/polyacrylatecomposite emulsions have been well documented [31,32]. LatexIPNs based on polyurethane, polyacrylate and epoxy resin have alsobeen reported elsewhere [33]. Particle formation, film properties,and application of waterborne polyurethane/poly(n-butyl acrylate-styrene) hybrid emulsions [34], comparison of hybrid and blendsystems in waterborne polyurethane/acrylate and self-assembly ofgraft polyurethanes having both PCL blocks and soft poly(n-BuA)segments have been reported [35,36]. Literature regarding syn-thesis and properties of poly(acrylates-co-urethane) adhesives andhyperbranched polyurethane acrylate used for UV curing coatingsis also a part of some studies [37,38]. The professional litera-ture and scientific writings have reported possible applications of
0141-8130/$ – see front matter © 2013 Elsevier B.V. All rights reserved.http://dx.doi.org/10.1016/j.ijbiomac.2013.01.024

Author's personal copy
100 S. Tabasum et al. / International Journal of Biological Macromolecules 56 (2013) 99– 105
Table 1Specification of fabrics with quality (construction/count and blend ratio) and type of processing done on the fabrics.
S. no. Quality Construction/count Blend ratio cotton/polyester
Type of processing of fabrics
01 Plain weave poly cotton (60 × 60/20 × 20) 49/51 White02 Plain weave poly cotton (60 × 60/22 × 22) 52/48 Grey (unbleached)03 Plain weave poly cotton (76 × 68/30 × 30) 51/49 Dyed with reactive dyes04 Plain weave poly cotton (100 × 80/40 × 40) 52/48 Pigment printed
waterborne polyurethanes [39]. Acrylic (AC) emulsions andpolyurethane (PU) aqueous dispersions have been extensively usedin coating applications. It is worth mentioning that acrylic finishesexhibit the lack of film forming properties and PU on the other handrepresents the high cost, low pH stability, limited outdoor durabil-ity [40]. To achieve all the required properties in a single polymericmaterial, the molecular engineering is required. Polyurethanes(PUs) can present better mechanical stability, good solvent andchemical resistance, excellent biocompatibility [41–43] and tough-ness against loading [25]. Acrylic (AC) component on the otherhand shows high outdoor resistance, pigment ability, and lowercost [44]. So, blending of properties of AC & PU definitely willhelp to get such a polymer with required properties. Great effortshave been dedicated to combine the polyurethanes with acrylicpolymers to increase the performance-to-cost ratio of the coatings[45]. There are only a limited number of reports about the prepa-ration and application of eco-friendly binders for textile finishingpurposes [25]. Polyurethane acrylate oligomers have gained moreand more attention and speedy development. Considering excel-lent outdoor resistance of acrylic and versatile biocompatibilityof polyurethanes the present project is designed to synthesizepolyurethane acrylate copolymers with polycaprolactone diols ofvarious molecular weights. The effect of molecular weight of PCLincorporated in PU based finish on the properties of the treated anduntreated fabrics has been studied and discussed.
2. Experimental
2.1. Materials
2.1.1. ChemicalsToluene diisocyanate (TDI), butyl acrylate (BuA), 2-hydroxy
ethyl acrylate (HEA) were purchased from Sigma Chemical Co.(St. Louis, MO, USA). Polycaprolactone diol CAPA 2047A (molec-ular weight 400), CAPA 2077A (molecular weight 750), CAPA2100A (molecular weight 1000), CAPA 2125A (molecular weight1250), CAPA 2161 (molecular weight 1600), CAPA 2200A (molec-ular weight 2000), CAPA 2302A (molecular weight 3000), CAPA2403A (molecular weight 4000) were kindly gifted by PerstorpPolyols (Solvay Chemicals, Inc. Toledo, OH). Potassium persulphate(KPS), sodium thiosulphate (Na2S2O3), polyoxyethylene glycol
octylphenol ethers, Na2CO3, polyvinyl alcohol (PVA), Montane80 (HLB = 4.3) and Montanox 80 (HLB = 15) were purchased fromMerck Chemicals (Darmstadt, Germany). The polyol and acrylatesused in this study were dried at 80 ◦C in vacuo for 24 h before useto ensure the removal of all air bubbles and water vapors that mayotherwise interfere with the isocyanate reactions. The molecularweight of used polyol was confirmed by following the procedurereported in ASTM D-4274C [46]. TDI and all of the other materialswere used as received. All of the reagents used in this study wereof analytical grade.
2.1.2. Polycotton fabric – a substrateMill desized, un-scoured, un-bleached grey fabrics and desized,
scoured, bleached, white, printed and dyed poly cotton, plainweaved fabrics (with almost 50/50 cotton/polyester blend ratio)was supplied by Sadaqat Textiles Mills Ltd., Khurrianwala, Fai-salabad, Pakistan. The characteristics i.e., quality of the fabrics,construction, count, blend ratio, etc., are presented in Table 1.Before application of the polyurethane acrylates copolymer, thefabric was further decontaminated in the laboratory by wash-ing at 100 ◦C for 60 min using a solution containing 2 g/L,Na2CO3 and 1 g/L, polyoxyethylene glycol octylphenol ethers:C8H17–(C6H4)–(O–C2H4)1–25–OH: (Triton X-100) a nonionic sur-factant (BASF). The fabric was then washed several times with hotwater then with cold water and finally dried at ambient conditions.
2.2. Synthesis of polyurethane acrylate copolymers
Polyurethane acrylate copolymers have been synthesized by fol-lowing three step syntheses. In first step, the synthesis of isocyanate(NCO) terminated polyurethane (PU) prepolymer was carried outaccording to the recommended procedure [3]. For this purpose 2moles of hydroxyl terminated poly caprolactone diols (polyol) wasreacted with 3 moles of toluene-2,4-diisocyanate (TDI) in order toget isocyanate (NCO) terminated polyurethane (PU) prepolymer(Fig. 1a). A Fourier transform infrared (FTIR) spectrum of the PU pre-polymer was obtained to confirm the progress of reaction (Fig. 2).In the second step NCO terminated PU prepolymer was reactedwith 2-hydrxy ethyl acrylates to get vinyl terminated PU prepoly-mer which was finally copolymerized with butyl acrylates. Thedetailed procedure regarding preparation of NCO terminated PU
Table 2Sample code designation and different formulation of polyurethane copolymer varying molecular weight of polycapralactone diols.
Sample code CAPAa (MW) CAPA trade name TDIb CAPAc HEAd VT-PUe BuACf
PAC-1 400 2074A 3 2 2 10% 90%PAC-2 750 2077A 3 2 2 10% 90%PAC-3 1000 2100A 3 2 2 10% 90%PAC-4 1250 2125A 3 2 2 10% 90%PAC-5 1600 2161A 3 2 2 10% 90%PAC-6 2000 2200A 3 2 2 10% 90%PAC-7 4000 2403A 3 2 2 10% 90%
a Different molecular weights of polycaprolactone diol.b Toluene-2,4-diisocyanate (mole ratio).c Polycaprolactone diol (mole ratio).d 2-Hydroxyethylacrylate (mole ratio).e Vinyl terminated polyurethane prepolymer blend (%).f Butyl acrylate blend (%).
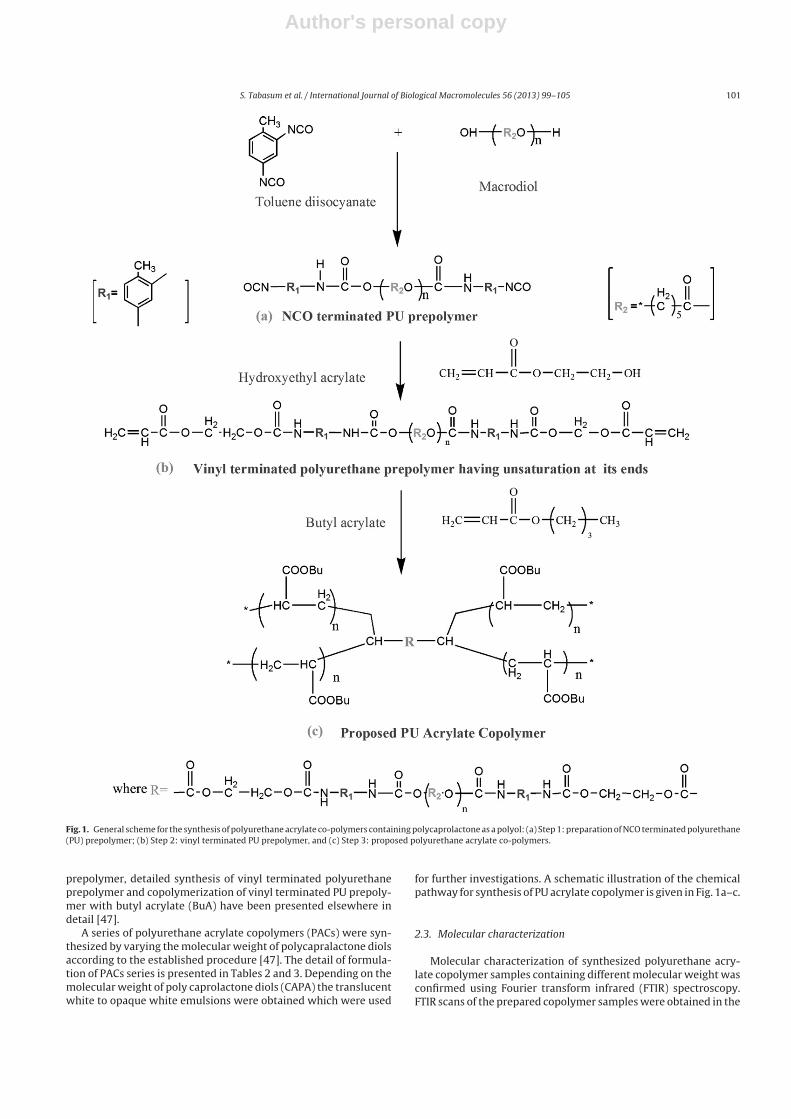
Author's personal copy
S. Tabasum et al. / International Journal of Biological Macromolecules 56 (2013) 99– 105 101
Fig. 1. General scheme for the synthesis of polyurethane acrylate co-polymers containing polycaprolactone as a polyol: (a) Step 1: preparation of NCO terminated polyurethane(PU) prepolymer; (b) Step 2: vinyl terminated PU prepolymer, and (c) Step 3: proposed polyurethane acrylate co-polymers.
prepolymer, detailed synthesis of vinyl terminated polyurethaneprepolymer and copolymerization of vinyl terminated PU prepoly-mer with butyl acrylate (BuA) have been presented elsewhere indetail [47].
A series of polyurethane acrylate copolymers (PACs) were syn-thesized by varying the molecular weight of polycapralactone diolsaccording to the established procedure [47]. The detail of formula-tion of PACs series is presented in Tables 2 and 3. Depending on themolecular weight of poly caprolactone diols (CAPA) the translucentwhite to opaque white emulsions were obtained which were used
for further investigations. A schematic illustration of the chemicalpathway for synthesis of PU acrylate copolymer is given in Fig. 1a–c.
2.3. Molecular characterization
Molecular characterization of synthesized polyurethane acry-late copolymer samples containing different molecular weight wasconfirmed using Fourier transform infrared (FTIR) spectroscopy.FTIR scans of the prepared copolymer samples were obtained in the

Author's personal copy
102 S. Tabasum et al. / International Journal of Biological Macromolecules 56 (2013) 99– 105
Fig. 2. FTIR spectra: (a) toluene-2,4-diisocyanate (TDI); (b) polycaprolactone diol(CAPA); (c) 2-hydroxyethylacrylate (HEA); (d) butyl acrylate (BuA); (e) finalpolyurethane acrylate copolymers (PAC).
Table 3Preparation of polyurethane acrylate copolymer (PAC) emulsions.
S. no. Ingredients Quantity
1 Vinyl terminated polyurethaneprepolymer
2 g
2 Butyl acrylates 18 g3 Polyvinyl alcohol 3 g4 Montane 80:Montanox 80 (30:70) 10 g5 Potassium persulphate (KPS) 0.2 g6 Na2S2O3 0.01 g in KPS7 Distilled water Water to make the
volume up to 100 ml
transmission mode using a Shimadzu Fourier Transform Infra-red(FT-IR) spectrometer.
2.4. Treatment of fabrics with polyurethane acrylate copolymersemulsion
After the preparation of polyurethane acrylate copolymersemulsions containing polycaprolactone diol of different molecu-lar weight, various dilutions (i.e., 15 g/L, 30 g/L and 50 g/L) of theprepared PAC sample were made and were applied onto the white,grey, printed and dyed, processed poly-cotton fabric. After applica-tion of the PAC emulsion, the treated grey, white, dyed and printedfabric samples were dried at 80 ◦C for 3 min and then cured at 140 ◦Cfor 5 min.
2.5. Pilling characterization
The plain weaved poly-cotton fabrics after different processedapplications (Table 1) was finished with different dilutions of PUacrylate copolymer emulsions and was evaluated applying pillingstandard test method ASTM D-3514-02 [46].
2.6. Antimicrobial evaluation
The treated and untreated, dyed and printed samples of fabricwere subject to evaluate the antimicrobial activity in order to checkthe effect of dyes and pigments on the cytotoxicity. The activelygrowing bacterial cells were used for inhibition studies. First of all1000 ml nutrient agar medium was prepared and poured 150 mleach in four flasks. The flasks containing nutrient agar mediumwas autoclaved for 15 min at 120 ◦C then allowed to cool. Into theabove four flasks, 15 �L of each kind of bacteria i.e., Staphylococcusaureus, Bacillus subtilus, Escherichia coli and Parmatella multocida;was added. About 20 ml of the nutrient agar medium was pouredinto sterile Petri plates and allowed to set at room temperature.Then the fabric samples were placed in the Petri dishes and incu-bated at 37 ◦C for 24 h. In case of any leaching of the agent fromthe sample to the surroundings (agar in this case), bacterial growthis inhibited in a zone around the sample, the width of which isdetermined by the diffusion of the active compound in the sur-roundings. After incubation, the zones of inhibition were measuredin mm.
3. Results and discussion
3.1. Molecular characterization
The FTIR spectra of all the monomers and individual polymer-ization steps were recorded and presented in Fig. 2. FTIR spectra oftoluene-2,4-diisocyanate (TDI), hydroxy terminated poly caprolac-tone diol, 2-hydroxyethylacrylate (HEA), butyl acrylate (BuA) andpolyurethane acrylate copolymers are jointly presented in Fig. 2.The peaks assignment of the important functional group are pre-sented and comprehensively discussed elsewhere in our previousstudy [47]. At first stage, the isocyanate (NCO) group of toluene-2,4-diisocyanate (TDI) is reacted with hydroxyl group (OH) of thepolycaprolactone diol to form isocyanate terminated PU prepoly-mer. In Fig. 2a, it is clear that a very sharp and an intense peakat 2241.28 cm−1 corresponds to the isocyanate ( NCO) groupsattached to the TDI structure has reacted with hydroxyl group(3534 cm−1; OH stretching vibration) of the poly (caprolactone)diol (PCL). The reaction of both the monomers results in the for-mation of isocyanate (NCO) terminated PU prepolymer. It can beclearly observed from the spectrum that isocyanate ( NCO) grouphas been reacted with the OH group of the PCL and therefore the

Author's personal copy
S. Tabasum et al. / International Journal of Biological Macromolecules 56 (2013) 99– 105 103
Table 4Pilling evaluation rating of white, grey, dyed and printed fabrics.
Sample code Type of fabrics
White (60 × 60/20 × 20) Grey (60 × 60/22 × 22) (unbleached) Dyed (76 × 68/30 × 30) Printed (100 × 80/40 × 40)
Strength of solution applied 15 g/L 30 g/L 50 g/L 15 g/L 30 g/L 50 g/L 15 g/L 30 g/L 50 g/L 15 g/L 30 g/L 50 g/L
PAC-1 2/3 2/3 3 2 2 2 3 3/4 4 3/4 3/4 4/5PAC-2 2/3 2/3 3 2 2/3 2 3 3/4 4 3/4 4 4/5PAC-3 2/3 2/3 3 2 2/3 2/3 3/4 3/4 4 4 4 4/5PAC-4 3 3 3 2 2/3 2/3 3/4 3/4 4 4 4 4/5PAC-5 3 3/4 3/4 2 2/3 2/3 3/4 4 4 4 4/5 4/5PAC-6 3 3/4 3/4 2/3 3 3 3/4 4 4/5 4/5 4/5 4/5PAC-7 3/4 3/4 3/4 2/3 3 3 3/4 4 4 4/5 4/5 4/5
Untreated sample 1/2 1/2 2/3 3Std. sample 1 (EFDa) 2 2 3 3Std. sample 2 (SEa) 2 2 3 3
a The sample available in the market under the trade names
signal for the OH groups disappeared and that of the intensityof isocyanate ( NCO) groups has reduced to some extent result-ing that isocyanate terminated PU prepolymer has been formedwith a signal for NH units appeared at 3239 cm−1 (Fig. 2c). Theother peaks observed in the FTIR spectrum of PU prepolymerwere assigned as: 2930 cm−1 (CH symmetric stretching of CH2);2893 cm−1 (CH asymmetric stretching of CH2 groups); 2267 cm−1
(isocyanate ( NCO) group); 1726 cm−1 (C O stretching of softsegment of poly (caprolactone) diol; 1190 cm−1 (C O stretchingof soft segment). Disappearance of intense peak 2241.28 cm−1
( NCO) and appearance of less intense peak at about 2267 cm−1
( NCO), confirm the reaction and formation of the NCO termi-nated PU prepolymer. The isocyanate terminated PU prepolymerwas further reacted with 2-hydroxyl ethyl acrylate (HEA) fol-lowing the established methods [25,47]. The FTIR spectrum of2-HEA (Fig. 2d) has shown many characteristics peaks which canbe assigned as: OH stretching vibration (3433.29 cm−1); asym-metric CH2 stretching (2923.78 cm−1); symmetric CH2 stretching(2883.58 cm−1); C O stretching (1714.15 cm−1); C C stretching(1545 cm−1). The reaction of isocyanate terminated PU prepolymerwith that of 2-hydroxy ethyl acrylates produced vinyl terminatedPU prepolymer. FTIR spectrum of vinyl terminated PU polymershows a well-defined peak at 3333 cm−1 attributed to the formationof NH linkage in the vinyl terminated PU prepolymer (Fig. 2e).The peaks appeared in the spectrum are assigned as: CH stretch-ing of CH2 (2929.87 cm−1); C O stretching (1716.65 cm−1); C Cstretching (1531.48 cm−1). It is clearly observed in the FTIR spec-trum of vinyl terminated PU prepolymer that isocyanate (NCO)peak has been disappeared indicating the complete utilization ofthe NCO contents with that of 2-hydroxy ethyl acrylate formingvinyl terminated PU prepolymer. The chain extension of vinyl ter-minated PU prepolymer was carried out with the incorporationof butyl acrylate moiety via free radical polymerization (Fig. 2f).The FTIR spectrum of BuA showed distinct characteristic peakswhich are assigned as: 2949.16 cm−1 (asymmetric CH2 stretch-ing); 2832 cm−1 (symmetric CH2 stretching); 1724.36 cm−1 (C Ostretching); 1534 cm−1 (C C stretching); 1188.15 cm−1 (C O, C Cstretching). The reaction of butyl acrylate with that of vinyl ter-minated polyurethane prepolymer leads to the formation of PUacrylate copolymers (Fig. 2g). The FTIR spectrum of PU acry-late copolymers shows characteristic peaks i.e., 3371.57 cm−1,attributed to N H stretching; 1693.49 cm−1, corresponds to car-bonyl stretching; and 2929.87 cm−1, 2847.70 cm−1 ascribed to CHanti-symmetric and symmetric stretching, respectively. The clearinformation about the vibrational mode changes and the comple-tion of the reaction can also be best studied through FTIR analysistechnique.
3.2. Pilling characterization
Pill density is the first impression that an observer probablywill get when examining a pilled sample. The average pill sizeand pill frequency is another important parameter which effecton the quality of the finished fabrics. The finishing plays a criticalrole in improving the fabric quality by reducing the pill forma-tion. Its main role is to stabilize the protruded fibers inside theyarn and remove the surface nap. This can be achieved via heatsetting, singeing, brushing, cropping or with chemical treatment.In this study poly-cotton fabric swatches have been treated withpolyurethane acrylate copolymer in order to get better rating ofpilling. The results presented in Table 4 show clear separation linesamong the five pilling propensity groups and a progressive trendbetween the no pilling (rating 5) and the most severe pilling (rat-ing 1) samples. The results in Table 4 show that the 10 samples(8 experimental samples and 2 standard samples) are successfullyclassified into five pilling grades. The results (Table 4) revealed thatthere is a pronounced effect of PU acrylate emulsion over the pillingof the treated fabric swatches. By increasing the molecular weightof the PCL in the polyurethane, the resultant finish displayed a grad-ual improvement in the pilling rating. Hence the high molecularweight polyol (CAPA) is known to be the most effective in betterpilling rating. This may be attributed to the better emulsion stabil-ity of the synthesized polymeric emulsions. It has been previouslyreported that by increasing the molecular weight of the polycapro-lactone diols, the emulsion stability continually increased [47]. Itis worth mentioning that pure cellulosic fabrics do not show anypilling tendency itself, so all the observed pilling rating in thetreated or untreated fabrics is due to the polyester fibers whichhas been blended in the poly-cotton fabrics during spinning. Con-sequently, by increasing the molecular weight of PCL the numberof ester unit increases, and it should be results in poor pilling rat-ing. But in this study, the reverse results have been observed andthe reason may be attributed to the excellent penetration of thesynthesized material into the fabrics due to very small micelle size.Further this decrease in micelle size may result because of highmolecular weight of the polycaprolactone diol used in the formu-lation. It is worthwhile mentioning that high molecular weightsalways result to produce small micelle size. This small micellesize will certainly alter the fabrics roughness to the rich handsoft. It can be observed that all the treated fabrics swatches haveshown comparatively good results as compared to standard sam-ples available in the market. In comparison to all the samples, PAC-7has shown best results. This behavior may be attributed to thegood emulsion stability and compatibility of the co-polymerizedsamples.

Author's personal copy
104 S. Tabasum et al. / International Journal of Biological Macromolecules 56 (2013) 99– 105
Table 5Antibacterial activity of printed and dyed poly-cotton fabrics using polyurethane acrylate copolymer emulsions against a panel of bacterial species assayed by disc diffusionmethod.
Samplecode
Inhibition zone (mm) in printed fabric (100 × 80/40 × 40) Inhibition zone (mm) in dyed fabric (76 × 68/30 × 30)
Bacterialspecies
Bacillussubtilus
Staphylococcusaureus
Escherichiacoli
Parmatellamultocida
Bacillussubtilus
Staphylococcusaureus
Escherichiacoli
Parmatellamultocida
PAC-1 12 12 12 12 – –PAC-2 12 13 14 12 – –PAC-3 14 14 15 13 – – – –PAC-4 15 16 16 14 – – – –PAC-5 16 16 17 15 14 14 12 –PAC-6 18 18 17 15 14 14 13 12PAC-7 20 21 19 16 15 15 14 13
Untreatedsample
13 13 13 12 – – – –
All the readings are average of four determinations.
3.3. Antimicrobial activity
Polyurethane is a biocompatible material and has been reportedseveral times in the literature [41,42]. In this study an attempthas been made in order to check the antimicrobial activity of thepoly-cotton fabrics treated with PU acrylates copolymers samples(Table 5). Conferring to disc diffusion assay, the printed fabric sam-ples on which the polyurethane acrylate emulsions were appliedshowed inhibition toward all pathogenic bacteria including B. sub-tilus and S. aureus which are gram positive bacteria and E. coli andP. multocida which are gram negative bacteria. All the emulsionsshowed comparable activity against gram positive and negativebacteria. Yagci et al. [48] prepared self-stratifying antimicrobialpolyurethane coatings and reported that the resultant films showedstrong antimicrobial activity against both gram-positive S. aureusand gram-negative E. coli type bacteria. It can be observed that theantimicrobial activity of the untreated fabrics is better as comparedto the PAC samples having low molecular weight of PCL moietiesin PU backbone (PAC-1). It has been reported that untreated fabricsshowed some degree of antimicrobial activity [49]. All the copoly-mer samples synthesized from butyl acrylate and PU based on TDIand CAPA of various molecular weights have shown very promis-ing antimicrobial activity. However the activity of these copolymersamples increases with the increase in chain length of polycapro-lactone based macrodiols. It has been observed and also reported inour previous study [47] that the increase in the chain length of CAPAresults to show gradual increase in hydrophilicity. It is well under-stood that the antimicrobial activity depends on the hydrophilicityof PU samples because hydrophilic surfaces provide intimate con-tact with aqueous microbe suspension which results in the betterperformance of hydrophilic polyurethane acrylate copolymers. Ithas also been observed that the antimicrobial activity responsetoward different bacteria is different. Regarding the comparisonbetween the gram positive and gram negative bacteria, the reduc-tion rate of E. coli is slower than that of S. aureus [50]. Longer contacttime is needed to inactivate E. coli than S. aureus (Fig. 3).
The prepared polyurethane acrylate emulsions were alsoapplied onto the dyed fabric swatches and results are presentedin Table 5. It was observed that the untreated fabric swatches andswatches treated with PU acrylate emulsions having low molec-ular weight of PCL have not shown any inhibition zone. It meansgrowth of none of the bacteria (E. coli, B. subtilus, S. aureus and P.multocida) was inhibited by such fabric swatches. Both gram pos-itive and gram negative bacteria have shown comparable trend tothe dyed fabrics swatches treated with PAC samples having highmolecular weight of polycaprolactone diols. However, the zone ofinhibition shown by B. subtilus and S. aureus is slightly greater thanE. coli and P. multocida. The results revealed that the degree of
Fig. 3. Photograph presenting the antimicrobial evaluation of treated fabrics usingdisc diffusion assay.
bacterial inhibition activities also depended on the nature of bac-terial strains. In the dyed treated fabrics although all the treatedsamples have shown comparable trend. In comparison to the dyedand printed treated fabric swatches, the printed fabric swatcheshave shown better results as compared to the dyed ones. Suchresults might be due to strong binder layer formed over the sur-face of the printed fabrics. On the other hand the dyed fabricsswatches may have developed some temporary link with PU acry-lates resulting showed cyto-toxicity and less or zero antimicrobialactivity.
4. Conclusion
A series of polyurethane acrylate copolymers (PACs) sampleswere synthesized using poly caprolactone diols of various molec-ular weight and toluene-2,4-diisocyanate (TDI), and chain wasextended with 2-HEA to form vinyl terminated PU prepolymer.The vinyl terminated prepolymer was copolymerized with butylacrylate by free radical based emulsion polymerization. The FTIRspectra of the monomers, PU prepolymers, and vinyl terminatedPU prepolymer and copolymers confirmed the proposed PAC struc-ture. The prepared PAC samples were applied onto the differentquality plain weave poly-cotton white, grey, printed and dyed fab-rics swatches using dip-padding techniques. The pilling ratingsand antimicrobial activities of the treated fabric swathes wereimproved by increasing the molecular weight of PCL in PAC sam-ples. The outcome of the results fully correlates the structureproperty relationship of the synthesized materials.

Author's personal copy
S. Tabasum et al. / International Journal of Biological Macromolecules 56 (2013) 99– 105 105
Acknowledgements
The reported research work is the part of PhD thesis of Ms ShaziaTabsum. Financial support of Higher Education Commission (HEC),Government of Pakistan regarding indigenous 5000 scholarshipbatch-VI is highly appreciated and acknowledged for the conduct ofthis research work. The authors are also thankful to Perstorp Polyols(Solvay Chemicals, Inc. Toledo, OH) for gifting the polyols samples.
References
[1] K.M. Zia, H.N. Bhatti, I.A. Bhatti, Methods 366 for polyurethane andpolyurethane composites, recycling and recovery: a review, Reactive and Func-tional Polymers 67 (2007) 675.
[2] M. Rogulska, W. Podkoscielny, A. Kultys, S. Pikus, E. Pozdzik, Studies on ther-moplastic polyurethanes based on new diphenylethane-derivative diols. I.Synthesis and characterization of nonsegmented polyurethanes from HDI andMDI, European Polymer Journal 42 (2006) 1786.
[3] K.M. Zia, M. Barikani, M. Zuber, I.A. Bhatti, H.N. Bhatti, Morphological studiesof polyurethane elastomers extended with �, �-alkane diols, Iranian PolymerJournal 17 (2008) 61.
[4] K.M. Zia, M. Barikani, I.A. Bhatti, M. Zuber, H.N. Bhatti, Synthesis and thermo-M., mechanical characterization of polyurethane elastomers extended with �,�-alkane diols, Journal of Applied Polymer Science 109 (2008) 1840.
[5] K.M. Zia, M. Barikani, M. Zuber, I.A. Bhatti, M.A. Sheikh, Molecular engineering ofchitin based polyurethane elastomers, Carbohydrate Polymers 74 (2008) 149.
[6] K.M. Zia, I.A. Bhatti, M. Barikani, M. Zuber, M.A. Sheikh, XRD studies of chitinbased polyurethane elastomers, International Journal of Biological Macro-molecules 43 (2008) 136.
[7] K.M. Zia, M. Barikani, I.A. Bhatti, M. Zuber, H.N. Bhatti, Synthesis and charac-terization of novel biodegradable thermally stable chitin based polyurethaneelastomers, Journal of Applied Polymer Science 110 (2008) 769.
[8] M. Zuber, K.M. Zia, S. Mahboob, M. Hassan, I.A. Bhatti, Synthesis of chitin-bentonite clay based polyurethane bio-nanocomposites, International Journalof Biological Macromolecules 47 (2010) 196.
[9] M. Barikani, K.M. Zia, I.A. Bhatti, M. Zuber, H.N. Bhatti, Molecular engineer-ing and properties of chitin based shape memory polyurethane elastomers,Carbohydrate Polymers 74 (2008) 621.
[10] K.M. Zia, M. Zuber, M. Barikani, I.A. Bhatti, M.B. Khan, Surface characteristicsof chitin based shape memory polyurethane elastomers, Colloids Surfaces B:Biointerfaces 72 (2009) 248.
[11] Y. Matsushita, A. Suzuki, T. Sekiguchi, K. Saito, T. Imai, K. Fukushima, Mappingof the cationic starch adsorbed on pulp fibers by ToF-SIMS, Applied SurfaceScience 255 (2008) 1022.
[12] S. Yokota, T. Kitaoka, H. Wariishi, Surface morphology of cellulose films pre-pared by spin coating on silicon oxide substrates pretreated with cationicpolyelectrolyte, Applied Surface Science 253 (2008) 4208.
[13] S.J. Santosa, D. Siswanta, S. Sudiono, R. Utarianingrum, Chitin–humic acidhybrid as adsorbent for Cr(III) in different of tannery wastewater treatment,Applied Surface Science 254 (2008) 7846.
[14] K.M. Zia, M. Barikani, M. Zuber, I.A. Bhatti, M. Barmar, Surface characteristics ofpolyurethane elastomers based on chitin/1,4-butane diol blends, InternationalJournal of Biological Macromolecules 44 (2009) 182.
[15] K.M. Zia, M. Barikani, M. Zuber, I.A. Bhatti, M. Barmar, XRD studies of UV-irradiated chitin-based polyurethane elastomers, Carbohydrate Polymers 77(2009) 54.
[16] K.M. Zia, M. Barikani, A.M. Khalid, H. Honarkar, Ehsan-ulHaq, Surface charac-teristics of UV-irradiated chitin based polyurethane elastomers, CarbohydratePolymers 77 (2009) 621.
[17] K.M. Zia, I.A. Bhatti, M. Barikani, M. Zuber, H.N. Bhatti, XRD studies ofpolyurethane elastomers based on chitin/1,4-butane diol blends, CarbohydratePolymers 76 (2009) 183.
[18] K.M. Zia, M. Zuber, M. Barikani, A. Jabbar, M.K. Khosa, XRD pattern of chitinbased polyurethane bio-nanocomposites, Carbohydrate Polymers 80 (2010)540.
[19] K.M. Zia, M. Zuber, S. Mahboob, T. Sultana, S. Sultana, Surface characteristics ofUV-irradiated chitin-based shape memory polyurethanes, Carbohydrate Poly-mers 80 (2010) 229.
[20] K.M. Zia, M. Zuber, M. Barikani, I.A. Bhatti, M.A. Sheikh, Structural characteris-tics of UV-irradiated polyurethane elastomers extended with�, �-alkane diols,Journal of Applied Polymer Science 113 (2009) 2843.
[21] K.M. Zia, I.A. Bhatti, M. Barikani, M. Zuber, M.A. Sheikh, Thermo-mechanicalcharacteristics of UV-irradiated polyurethane elastomers extended with�, �-alkane diols, Nuclear Instruments and Methods in Physics Research Section B267 (2009) 1811.
[22] K.M. Zia, I.A. Bhatti, M. Barikani, M. Zuber, Islam-ud-Din, Surface characteris-tics of UV-irradiated polyurethane elastomers extended with �,�-alkane diols,Applied Surface Science 254 (2008) 6754.
[23] M. Zuber, K.M. Zia, I.A. Bhatti, A. Rizwan, T. Jamil, Modification of cellulosicfabric using polyvinyl alcohol, Part-II. Colorfastness properties, CarbohydratePolymers 87 (2012) 2439.
[24] K.M. Zia, M. Zuber, A. Rizwan, T. Jamil, M. Shahid, Modification of cellulosic fab-ric using polyvinyl alcohol, Part-I. Physicochemical properties, CarbohydratePolymers 87 (2012) 2063.
[25] M. Sultan, K.M. Zia, H.N. Bhatti, T. Jamil, R. Hussain, M. Zuber, Modification ofcellulosic fiber with polyurethane acrylate copolymers. Part I. Physicochemicalproperties, Carbohydrate Polymers 87 (2012) 397.
[26] M. Zuber, K.M. Zia, I.A. Bhatti, Z. Ali, M.U. Arshad, M.J. Saif, Modification ofcellulosic fibers by UV-irradiation. Part II. After treatments effects, InternationalJournal of Biological Macromolecules 51 (2012) 743.
[27] I.A. Bhatti, K.M. Zia, A. Zobia, M. Zuber, Fazal-ur-Rehman, Modification ofcellulosic fibers to enhance its dyeability using UV-irradiation treatment, Car-bohydrate Polymer 89 (3) (2012) 783.
[28] K.M. Zia, S. Tabassum, S. Barkaat-ul-Hasin, M. Zuber, T. Jamil, M.A. Jamal, Prepa-ration of rich handles soft cellulosic fabric using amino silicone based softener,Part-I. Surface smoothness and softness properties, International Journal ofBiological Macromolecules 48 (2011) 482.
[29] M. Zuber, K.M. Zia, S. Tabassum, T. Jamil, S. Barkaat-ul-Hasin, M.K. Khosa,Preparation of rich handles soft cellulosic fabric using amino silicone basedsoftener, Part II. Colorfastness properties, International Journal of BiologicalMacromolecules 49 (2011) 1.
[30] D. Dieterich, Aqueous emulsions, dispersions and solutions of polyurethanes;synthesis and properties, Progress in Organic Coatings 9 (1981) 281.
[31] V.D. Athawale, M.A. Kulkarni, Preparation and properties of urethane/acrylatecomposite by emulsion polymerization technique, Progress in Organic Coatings65 (2009) 392.
[32] S.L. Chai, M.M. Jin, H.M. Tan, Comparative study between core–shell andinterpenetrating network structure polyurethane/polyacrylate compositeemulsions, European Polymer Journal 44 (2008) 3306.
[33] L. Chen, S. Chen, Latex interpenetrating networks based on polyurethane, poly-acrylate and epoxy resin, Progress in Organic Coatings 49 (2004) 252.
[34] Y.-h. Guo, S.-c. Li, G.-s. Wang, W. Ma, Z. Huang, Waterbornepolyurethane/poly(n-butyl acrylate-styrene) hybrid emulsions: particleformation, film properties, and application, Progress in Organic Coatings 74(2012) 248.
[35] E. Ibarboure, A. Baron, E. Papon, J. Rodriguez-Hernandez, Self-assembly of graftpolyurethanes having both crystallizable poly(�-caprolactone) blocks and softpoly(n-butyl acrylate) segments, Thin Solid Films 517 (2009) 3281.
[36] P.J. Peruzzo, P.S. Anbinder, O.R. Pardini, J. Vega, C.A. Costa, F. Galembeck, J.I.Amalvy, Waterborne polyurethane/acrylate: comparison of hybrid and blendsystems, Progress in Organic Coatings 72 (2011) 429.
[37] M. Li, Z. Zheng, S. Liu, Y. Su, W. Wei, X. Wang, Synthesis and properties ofpoly(acrylates-co-urethane) adhesives for low surface energy materials, Inter-national Journal of Adhesion and Adhesives 31 (2011) 565.
[38] F. Bao, W. Shi, Synthesis and properties of hyperbranched polyurethane acry-late used for UV curing coatings, Progress in Organic Coatings 68 (2010)334.
[39] P. Król, B. Król, S. Pikus, K. Skrzypiec, Study on the synthesis and on supermolec-ular structures of a water-dilutable urethane-acrylic copolymer applicable asa binder for powdered Al2O3, Colloids and Surfaces A: Physicochemical andEngineering Aspects 259 (2005) 35.
[40] C.R. Hegedus, K. Kloiber, Aqueous acrylic–polyurethane hybrid dispersions andtheir use in industrial coatings, Journal of Coating of the Technology 68 (1996)39.
[41] K.M. Zia, M. Zuber, I.A. Bhatti, M. Barikani, M.A. Sheikh, Evaluation of bio-compatibility and mechanical behavior of polyurethane elastomers basedon chitin/1,4-butane diol blends, International Journal of Biological Macro-molecules 44 (2009) 18.
[42] K.M. Zia, M. Zuber, I.A. Bhatti, M. Barikani, M.A. Sheikh, Evaluation of biocom-patibility and mechanical behavior of chitin polyurethane elastomers. Part-II.Effect of diisocyanate structure, International Journal of Biological Macro-molecules 44 (2009) 23.
[43] K.M. Zia, M. Zuber, M. Barikani, R. Hussain, T. Jamil, S. Anjum, Cytotoxicityand mechanical behavior of chitin–bentonite clay based polyurethane bio-nanocomposites, International Journal of Biological Macromolecules 49 (2011)1131.
[44] D. Kukanja, J. Golob, Z. Ic-Valant, A.M. Krajnc, The structure and properties ofacrylic–polyurethane hybrid emulsions and comparison with physical blends,Journal of Applied Polymer Science 78 (2000) 67.
[45] F. Wang, J.Q. Hu, W.P. Tu, Study on microstructure of UV-curable polyurethaneacrylate films, Progress in Organic Coatings 62 (2008) 245.
[46] ASTM Standards, American Society of Testing Material, ASTM International,USA, 2004.
[47] S. Tabasum, M. Zuber, A. Jabbar, K.M. Zia, Properties of the mod-ified cellulosic fabrics using polyurethane acrylate copolymers vary-ing molecular weight of polycaprolactone diols, Carbohydrate Polymer,doi.org/10.1016/j.carbpol.2013.01.087.
[48] M.B. Yagci, S. Bolca, J.P.A. Heuts, W. Ming, G. de With, Self-stratifyingantimicrobial polyurethane coating, Progress in Organic Coatings 72 (2011)305.
[49] American Association of Textile Colorist and Chemist, Durability of SomeAntibacterial Treatments, third edition, Pharmaceutical Products Press, Bing-hamton, NY, 1993.
[50] S.P. Denyer, Mechanisms of action of antibacterial biocides, InternationalBiodeterioration & Biodegradation 36 (1995) 227.

1652
†To whom correspondence should be addressed.
E-mail: [email protected]
Korean J. Chem. Eng., 30(8), 1652-1658 (2013)DOI: 10.1007/s11814-013-0111-y
INVITED REVIEW PAPER
Blends of polyurethane-polymethyl methacrylate/TiO2-based composites
Mohammad Zuber*,†, Shazia Tabasum*, Rizwan Hussain**, Muhammad Bilal Khan***, and Iftikhar Hussain Bukhari*
*Institute of Chemistry, Government College University, Faisalabad 38030, Pakistan**National Engineering and Scientific Commission (NESCOM), P. O. Box 2216, Islamabad, Pakistan
***National University of Science and Technology, NUST, Islamabad, Pakistan(Received 14 April 2013 • accepted 24 June 2013)
Abstract−Polyurethanes (PUs) prepolymer was prepared by the reaction of toluene-2,4-diisocyanate (TDI) and poly
caprolactone diols and the chain was further extended with 1,4-butane diol (1,4-BDO) to get final polyurethane (PU).
FTIR spectra of the monomers, PU prepolymer, chain extender and final PU confirmed the reaction progress. A series
of blends were prepared by varying the percent compositions of prepared PU, procured polymethyl methacylates (PMMA)
and titanium dioxide (TiO2). Pellets were formed from the prepared blends (PU-PMMA/TiO2) using a self-designed
mechanical tool. Scanning electron microscope (SEM) images were also taken to confirm the incorporation of the TiO2
contents into the prepared blends. Mechanical properties such as hardness and compressive strength were studied and
discussed. The results of the study reveal that the blended sample having 80% PU, 20% PMMA content with 2.5 g
TiO2 in 100 g mixture of PU and PMMA is very suitable for suggesting dental materials.
Key words: Polyurethane, PMMA, Titanium Dioxide, FTIR, SEM, Compression Strength
INTRODUCTION
Studies of tooth-related genetic disorders and knockout enamel
demonstrate that the correct formation of the dentin-enamel inter-
face is essential for proper tooth function. The problem of interface
stability is also very important with respect to tissue repair, where
implant failure often occurs due to a weak interface between tissues
and repair materials. It is likely that interactions between dentin and
enamel tissue during initial mineralization events play an important
role in the proper formation of the interface [1]. Polymers can be
modified for better and critically important interfaces. Polyurethane
elastomers (PUEs) are possibly the most versatile classes of poly-
mers as they can be molded, injected, extruded, recycled [2] and
can be easily modified by varying the diisocyanate structure [3] and
chain extender (CE) length using a, w-alkane diols [4,5]. Synthesis,
characterization of UV-curable and waterborne polyurethane disper-
sions [6,7], effect of blocked polyisocyanate based PU composites
[8] and PU/natural rubber blends [9,10] have been studied compre-
hensively. Bio-based hyperbranched PU [11-14], PLA-based hybrid
bio-composite [15], PP/nitroxide-mediated radical graft polymeriza-
tion of styrene [16] and influences of clay type, content and dispersion
state on PET/clay nanocomposites [17,18] have been documented
in the established literature.
Among the many materials used, polyacrylate (PA) is the most
frequently used in water borne polyurethane (WPU) modifications
due to its excellent properties in terms of hardness, weather ability,
water resistance and gloss [19]. Urethane acrylates are explored as
biomaterials useful in contact lenses, radiation, thermally sensitive
materials, and dental materials [20]. A large number of reports on
the use of reinforcing materials in polyurethane acrylate copolymers
are available in the literature [21,22]. Modified clay has been used
as a filler to improve the mechanical properties [23,24]. The contrast
between composites containing conventional glass fillers and those
containing glass-ceramic revealed that the latter increased flexural
strength and modulus significantly, although it did not affect the
diametric tensile strength (DTS). Among porous fillers (glass-cer-
amic), the porosity increased flexural strength significantly but did
not affect flexural modulus and DTS. Therefore, porous fillers can
be considered as an important and applicable way to reinforce dental
composites [25]. At the resin-dentin interface, the adhesive layer
has the lowest elastic modulus among the components of the bonded
complex. Inclusion of fillers into an adhesive causes an increase in
its elastic modulus providing a layer with an elastic modulus between
dentin and restoration [26,27]. Incorporation of zirconium oxide
into the dental material has also been reported in the literature [28].
Titanium is known as a good, biologically safe material for various
medical applications. In bulk form, it is used for the production of
implants [29], whereas in the form of porous structures, it provides
support for living cells [30]. Resin composites with 0.1-0.25% tita-
nium dioxide nanoparticles could simulate the opalescence of human
enamel [31]. Titanium shows excellent mechanical strength, fatigue
resistance [32], good corrosion resistance and biocompatibility [33].
Due to its excellent properties in biomedical applications, some re-
ports are also available using titanium oxide (TiO2) films for implant-
applications by electrochemical process in an electrolyte with sodium
silicate solution as an additive [34]. To achieve all the required proper-
ties in a single material, molecular engineering is required. Polyure-
thanes (PU) can present better mechanical stability, good solvent
and chemical resistance, excellent biocompatibility [35-37] and tough-
ness against loading. Acrylic (AC) component, on the other hand,
shows high outdoor resistance, pigment ability, and lower cost [38].
The incorporation of TiO2 will definitely improve the mechanical
properties and enhance the biocompatibility. It is noteworthy that

Blends of polyurethane-polymethyl methacrylate/TiO2-based composites 1653
Korean J. Chem. Eng.(Vol. 30, No. 8)
no report is available on the preparation of blends of polyurethane
(PU)-polymethyl methacrylate (PMMA)/TiO2-based composites.
It is a common procedure to prepare polyurethane by step growth
reaction of diisocyanate and polyol, and the chain is further extended
with diols or diamines, and hence incorporation of nanofillers into
the matrix of polyurethane. However, we did not find any report
regarding the preparation of PU-PMMA/TiO2 based composites.
Blending of properties of AC, PU and TiO2 definitely will help in
getting such a polymer with the required properties. Keeping in view
the excellent requisite characteristics of the component material and
to tailor the dental material for the required properties, this study has
been conducted.
Scheme 1. Synthetic route for the preparation of polyurethane/polymethyl methacrylate/TiO2 based composites.
Table 1. Sample code designation and different formulation of polyurethane and PU/PMMA/TiO2 blends
Sr. no. Sample codeFormulation of polyurethane Composition (PUd/PMMAe)
% by mass
Percentage of TiO2
in the blends
Hardness data of
blends (Shore A)TDIa CAPAb BDOc
1 PUACT 1 10 1 9 0/100 2.5 88
2 PUACT 2 10 1 9 20/80 2.5 88
3 PUACT 3 10 1 9 40/60 2.5 91
4 PUACT 4 10 1 9 80/20 2.5 95
5 PUACT 5 10 1 9 100/0 2.5 90
aToluene-2,4-diisocyanate (mole ratio)bPolycaprolactone diol (mole ratio)c1,4 Butane diol (mole ratio)dPolyurethane (%)ePolymethyl methacylates (%)
EXPERIMENTAL
1. Materials
1-1. Chemicals
Toluene diisocyanate (TDI), 1,4-butane diol (BDO), titanium diox-
ide and dimethyl formamide (DMF) were purchased from Sigma
Chemical Co. (Saint Louis MO, USA). Polycaprolactone diol CAPA
2403A (molecular weight 4000) was kindly gifted by Perstorp Poly-
ols (Solvay Chemicals), Inc. Toledo, Ohio. Poly-methyl methacry-
late was purchased from Merck Chemicals (Darmstadt, Germany).
Its molecular weight was confirmed following the method reported
in the literature [39]. The polyol and BDO used in this study were

1654 M. Zuber et al.
August, 2013
dried at 80 oC in vacuo for 24 h before use to ensure the removal
of all air bubbles and water vapors that may otherwise interfere with
the isocyanate reactions. TDI and all of the other materials were
used as received. All of the reagents used in this study were of ana-
lytical grade.
1-2. Step 1: Synthesis of Polyurethane
The synthesis of PU prepolymers was carried out according to
the recommended procedure [5]. First, 1 mole (Table 1) of hydroxyl
terminated poly caprolactone diol (polyol) CAPA2403A (Molecular
weight 4000) was charged into a four-necked round bottom flask
equipped with a mechanical stirrer, a thermometer, a reflux con-
denser, heating oil bath and a nitrogen gas inlet system. The temper-
ature of the oil bath was increased to 60 oC. Poly caprolactone diol
was melted and stirred continuously under the blanket of nitrogen
gas for 30 min. Then 10 moles (Table 1) of toluene-2,4-diisocyanate
(TDI) was added to the reaction vessel and temperature was raised
to 80 oC. During optimization of the experimental conditions it is
confirmed that the formation of isocyanate (NCO) terminated poly-
urethane (PU) prepolymer completes in one hour. Fourier trans-
form infrared (FTIR) spectrum of the PU prepolymer was also ob-
tained to confirm the progress of polyurethane (PU) prepolymer
reaction. The NCO contents of the PU prepolymer were determined
and the experimental values found close to the theoretical value (ex-
perimental value 9.27%; theoretical value 9.29%). The PU pre-
polymer was converted into the final PU by stirring the prepolymer
vigorously and then adding a previously degassed chain extender,
1,4-butane diol (9 moles). When homogeneity was obtained in the
reaction mixture, the dispersion of chain extender was considered
complete and the liquid polymer was cast into a Teflon plate to form
a uniform sheet of 2-3 mm thickness. The synthesized polymer was
then placed in a hot air circulating oven at 100 oC and cured for 24 h.
The synthetic route for the synthesis of polyurethane is shown in
Scheme 1.
1-3.Step 2: Preparation of Blends of Polyurethane-poly Methyl Meth-
acrylate (PMMA) and TiO2
A series of blends was prepared by dissolving different compo-
sitions of PU and PMMA (Table 1) in dimethyl formamide (DMF).
Titanium dioxide-TiO2 (2.5% of weight of polymer) was added to
the blends of PU and PMMA. Complete dispersion of TiO2 in the
blends was obtained by continuous stirring with a magnetic stirrer
for three hours. The solvent was evaporated by drying in an oven
at 110 oC. The synthetic route for the preparation of polyurethane-
polymethyl methacrylate/TiO2 is shown in Scheme 1.
1-4. Step 3: Preparation of Pellets from Blends
Pellets were prepared by using the following parts of the self-
designed mechanical tool. The cylinder ‘a’ is placed into the cylin-
drical volume ‘d’. The material whose pellets are required is placed
inside through the open mouth of the ‘d’, and the bolts ‘b’ and ‘c’
are fixed at the both end of the cylindrical volume ‘d’. The self-
designed components of the mechanical tool are shown in Fig. 1(a).
Fig. 1. Pellet formation (a) Self-designed mechanical tool for pellet formation; (b) Torque wrench and self-designed mechanical tool forpellet formation; (c) Pressure being applied with a torque wrench; (d) Pellet formed using the self-designed assembly.

Blends of polyurethane-polymethyl methacrylate/TiO2-based composites 1655
Korean J. Chem. Eng.(Vol. 30, No. 8)
A torque wrench as shown in the Fig.1(b) is used to press the material
placed inside the cylindrical volume between the solid cylinder ‘a’
and bolts ‘c’ inside ‘d’. For this purpose 0.5 g of the prepared material
was placed inside the self-designed mechanical tool for the pellet
formation. The material inside the cylindrical volume was pressed
using a pressure of 112 Nm−1 with the help of Torque wrench (Fig.
1(c)).
After applying pressure (112 Nm−1) with the help of a torque
wrench, the instrument is placed in an oven at 100 oC for 60 minutes.
The instrument is then taken out from the oven and allowed to cool
down. The pellet is taken out from the cylindrical volume by loosing
the end of bolt ‘c’. The pellet is taken out as shown in Fig. 1(d) by
opening the knob ‘c’, and then the pellet comes out attached to the
cylinder ‘d’.
2. Molecular Characterization
Molecular characterization of the monomers used in the synthe-
sis, the intermediate compounds and the final material formed at
the end of complete polymerization were confirmed by Fourier trans-
form infrared (FT-IR) spectroscopy. FT-IR scans of the prepared
copolymer samples were obtained in the transmission mode using
a Shimadzu Fourier Transform Infra-red (FT-IR) spectrometer.
3. Scanning Electron Microscopy (SEM) Analysis
A small sample of PU-PMMA/TiO2 blends specimen was fit into
the sample chamber, which could accommodate a specimen up to
15 cm in height. PU-PMMA/TiO2 blends specimens were made
electrically conductive by coating with a thin layer of gold film using
JEOL sputter coater before analysis. Morphological studies were
examined by scanning electron microscopy (JEOL JSM-6490A)
at 20 kV.
4. Compression Test
Compression testing provides mechanical strength and properties
of rigid cellular materials under compressive loads. The compressive
strength and stiffness properties of polymer matrix composite mate-
rials were determined by using the standard test method-ASTM
D6641 [39]. In this test specimens are centered between two com-
pression platens and compressive load is applied at a constant cross-
head rate of 2.5 mm (0.1 in/min) for each 1 inch of sample thick-
ness. Crosshead travel and load are recorded throughout the test.
Compressive strength can be determined in one of two manners
depending on the characteristics of the stress-displacement curve.
Strain can more accurately be determined using an extensometer
that measures the distance between the upper and lower compres-
sion platens.
RESULTS AND DISCUSSION
1. Structural Characterization
FTIR spectra of all the monomers and individual polymeriza-
tion steps were recorded and presented in Fig. 2. FTIR spectra of
toluene-2,4-diisocyanate (TDI), hydroxy terminated poly caprolac-
tone diol, isocyanate and (NCO) terminated PU prepolymer ob-
tained by the reaction of TDI and hydroxy terminated poly (capro-
lactone diol) are jointly presented in Fig. 2. The peaks assignments
of the important functional group are presented and discussed. The
FTIR spectrum of toluene-2,4-diisocyanate (TDI) (Fig. 2(a)) show
a very sharp and an intense peak at 2,241.28 cm−1 which correspond
to the isocyanate (-NCO) groups attached to the TDI structure. The
FT-IR spectrum shows sharp peaks at 1,516.05 cm−1 attributed to
the C=C stretching of benzene ring. The peaks assignment of FTIR
spectrum of poly (caprolactone) diol (PCL) is presented in Fig. 2(b).
The observed peaks in the functional group region of PCL were
assigned as: 3,534 cm−1 (OH stretching vibration); 2,937.59 cm−1
(asymmetric CH2 stretching); 2,876 cm−1 (symmetric CH2 stretch-
ing); 1,724.36 cm−1 (C=O stretching); 1,168.86 cm−1 (C-O stretch-
ing). These two monomers (TDI & PCL) reacted in the reaction
flask and the reaction lasted for 1 h at 100 oC. After optimization of
the experimental conditions it was observed that formation of poly-
urethane prepolymer was completed in 1 h and isocyanate terminated
PU prepolymer was formed. FT-IR spectrum of NCO terminated
PU prepolymer is given in Fig. 2(c). It can be clearly observed from
Fig. 2. FT-IR spectra: (a) toluene-2,4-diisocyanate (TDI); (b) Poly-caprolactone diol (CAPA); (c) polyurethane (PU) prepoly-mer; (d) 1,4 butane diol (BDO); (e) Final polyurethane (PU).

1656 M. Zuber et al.
August, 2013
the spectrum that isocyanate (-NCO) group has reacted with the
OH group of the PCL, and therefore the signal for the OH groups
disappeared and that of the intensity of isocyanate (-NCO) groups
has reduced to some extent, resulting in that isocyanate terminated
PU prepolymer has been formed with a signal for NH units appear-
ing at 3,239 cm−1 (Fig. 2(c)). The other peaks observed in the FT-
IR spectrum of PU prepolymer were assigned as: 2,930 cm−1 (CH
symmetric stretching of CH2); 2,893 cm−1 (CH asymmetric stretch-
ing of CH2 groups); 2,267 cm−1 (isocyanate (-NCO) group); 1,726
cm−1 (C=O stretching of soft segment of poly (caprolactone) diol;
1,190 cm−1 (C-O stretching of soft segment). Disappearance of an
intense peak 2,241.28 cm−1 (-NCO) and the appearance of a rela-
tively weak peak at about 2,267 cm−1 (-NCO), confirm the formation
of the NCO terminated PU prepolymer. To complete the polymer-
ization, the PU prepolymer was further reacted with 1,4-butane diol
to form final polyurethane. The peak assignment of FTIR spec-
trum of 1,4-butane diol is represented in Fig. 2(d). FT-IR spectra of
1,4-butane diols (Fig. 2(d)) showed that broad OH stretching vibration
band appeared at 3,452 cm−1. The peaks observed at 2,930 and 2,844
cm−1 correspond to CH symmetric and asymmetric stretching vibra-
tions of CH2 groups, respectively. To provide clear information about
the vibrational mode changes due to involvement of 1,4-BDO into
the polyurethane backbone during the polymerization reaction, FT-
IR spectrum of PU based on 1,4-BDO obtained from the cast film
is shown in Fig. 2(e). In the FT-IR spectrum of the PU sample, the
appearance of N-H peak at 3,330 cm−1 and the disappearance of
the NCO peak at 2,255 cm−1 confirmed the completion of polymer-
ization reaction. The FTIR spectra of the predesigned PU obtained
support the proposed structure of the final PU polymer. FTIR spectra
showed characteristic bands of urethane groups at 3,330 cm−1 (N-H
stretching); CH symmetric stretching vibrations of CH2 at 2,947 cm−1;
CH asymmetric stretching vibrations of CH2 groups at 2,810 cm−1.
The other peaks observed were assigned as: 1,728 cm−1, 1,642 cm−1
(C=O bond); 1,599 cm−1, 1,529 cm−1 (NH bending); 1,407 cm−1 (CH
bending vibration); 1,311 cm−1 (CH2 wagging). By further reaction
of the PU prepolymer with 1,4-BDO, the FT-IR spectra showed a
very strong, new peak at about 1,728 cm−1 which was assigned to
C=O stretching of soft segment of PCL. Another new peak was also
observed at about 1,464 cm−1 which was assignable to urethane
-NH group. The other peaks related to the absorption of -NH, -CO,
-CHN were appeared at 3,330 cm−1, 1,728 cm−1 and 1,464 cm−1, re-
spectively, which indicates the newly synthesized proposed prod-
uct has -NHCOO group.
2. Interaction between the PU-PMMA and TiO2 Particles
Inorganic/polymer nanocomposites are a relatively new class of
materials. Compared to conventional composites, the nanocompos-
ites exhibit improved physical properties, such as thermal and mech-
anical, due to the much stronger interfacial interactions between the
nanofillers and polymer matrices. Inorganic/organic nanohybrids
could combine the advantages of organic polymers and nanomate-
rials. Possible interfacial interaction mechanism and the secondary
structure of macromolecular chain could lead to the formation of
extensive intermolecular interactions easily, which reduces the index
of hydrogen deficiency and the unsaturated degree.
An FT-IR study of pristine PU-PMMA and PU-PMMA/TiO2
was done to investigate the information about the interactions of
TiO2 with PU-PMMA molecules. The results revealed that the char-
acteristic peaks of pure PU-PMMA copolymer and PU-PMMA/
TiO2 are still maintained in the spectrum, and there is no signifi-
cant difference among the peaks in IR studies. It may be proved
that the structure of PU-PMMA was not affected by the presence
of TiO2 implying that the TiO2 did not react with the PU-PMMA
molecules. Obviously, this result indicates a strong and uniform phys-
ical interaction between PU-PMMA and TiO2 nanoparticles and may
be owing to interfacial synergistic forces such as hydrogen bond-
ing or electrostatic interactions between the organic and inorganic
components. These interactions can alter the original vibration mode
of molecules, atoms or pendant groups on the interface between
organic and inorganic components, which may have some effects
on the resultant properties of the material.
3. Scanning Electron Microscope (SEM) Analysis
SEM images were taken to investigate the micro-morphology
of prepared PU-PMMA/TiO2 blends with different mass percent
of PU and PMMA in the blends (Fig. 3). From the SEM images
(Fig. 3) of the prepared PU-PMMA/TiO2 composite blends, it can
be clearly observed that the TiO2 particles are well dispersed in the
polymer matrix and all the individual components can be easily iden-
tified. This homogeneity in dispersion of the TiO2 contents in the
PU/PMMA matrix will certainly help to improve the mechanical
properties of the prepared blends. The red zone area in the Fig. 3(a)
has been magnified (×500 to ×1,000) and presented in Fig. 3(b). It
is worth mentioning that individual components, i.e., PU, PMMA
and TiO2, can be easily identifiable in the presented images.
As discussed above, SEM analysis was used to measure the distri-
Fig. 3. Scanning electron microscope (SEM) images of PU-PMMA/TiO2 blends.

Blends of polyurethane-polymethyl methacrylate/TiO2-based composites 1657
Korean J. Chem. Eng.(Vol. 30, No. 8)
bution of nano-TiO2 particles in the PU-PMMA films. The micro-
structure surface of the PU-PMMA based on TiO2 particles shows
a very compact multilayer net-work structure due to mutual net-
working of PU and PMMA embedded TiO2 particles in the result-
ing matrix. Moreover, the particles seemed to be very uniformly
dispersed on the surface of the PU-PMMA, which provides direct
evidence regarding the micro-structure and the formation of true
PU-PMMA/TiO2 nanocomposites. The micrographs confirmed that
the PU-PMMA/TiO2 nanocomposites present a homogeneous and
fully dispersed micromorphology. It can observed from the micro-
graph images that the average size of PU-PMMA/TiO2 nanocom-
posites is round about 60-70 nm. The obtained results accord with
those of previous findings [40,41].
4. Mechanical Properties of the Blended Samples
The hardness data of the synthesized PU/PMMA/TiO2 samples
is presented in Table 1. The results revealed that all the blended sam-
ples have shown comparable hardness results; however, the sam-
ples having entire PMMA (PUACT 1) and sample having 20% PU
and 80% PMMA (PUACT 2) have shown equal hardness. The hard-
ness of the studied samples gradually increases with increase in the
PU mass percent; however, the sample having 100% PU and 0%
PMMA (PUACT 5) has shown comparable result to the sample
PUACT 3 (having 40% PU and 60% PMMA). This trend of in-
creasing rigidity of the sample attributed to the compatibility of the
PU and PMMA with that of TiO2. The existing trend of the hard-
ness indicates that both the PU and PMMA are responsible for the
production of tough material.
A compression test is simply the opposite of the tensile test with
respect to the direction of loading. In compression testing the sam-
ple is compressed while the load and the displacement are recorded.
The compression tests result in mechanical properties that include
the compressive yield stress, compressive ultimate stress, and com-
pressive modulus of elasticity. Compressive yield stress is meas-
ured in a manner identical to that done for tensile yield strength.
When testing plastics, the compressive yield stress is measured at
the point of permanent yield on the stress-strain curve. Moduli are
generally greater in compression for most of the commonly used
structural materials. The compression results are presented in Fig.
4(a) & (b). The results revealed that among all the studied samples,
maximum applied load, i.e., 1,397 (Kgf), was observed by the sample
PUACT 1 (0% PU and 100% PMMA), and this sample has shown
maximum resistance against load. By decreasing the mass percent
of the PMMA, the load-bearing capacity of the samples decreases,
resulting in a slight fracture that was observed in sample PUACT
2, and a clear fracture was observed in sample PUACT 3. How-
ever, the sample PUACT 4 (80% PU and 20% PMMA) has shown
good load bearing capacity (i.e., 1,101 Kgf) as compared to all the
other samples having various mass percent of PU. Although the
sample PUACT 5 (100% PU and 0% PMMA) has also shown load
bearing capacity, the max applied load to this sample is 489 Kgf.
Furthermore, some pores in the un-checked sample (PUACT 5)
were also observed. In comparison to all the studied samples, no
fracture was observed against the applied load in the samples PUACT
1, PUAT 4 and PUACT 5. Finally, concluding the best one among
the above three, PUACT 4 is more suitable for suggesting dental
materials because of the following reasons: (i) the sample PUACT 1
was prepared with 100% PMMA (and 0% PU) which shows less
biocompatible behavior and also least hardness factor (i.e., 88); (ii)
the sample PUACT 4 has shown maximum load bearing capacity
and maximum hardness (i.e., 95); and also may show less toxic effect
during the cell culture assay because 80% (mass percent) of PU
(20% PMMA) was blended in this sample. The established litera-
ture has reported the polyurethane is a biocompatible material and
can be inserted inside the living organism, which does not result in
any toxic effect [35,36]; (iii) the sample PUACT 5 was blended with
100% PU (and 0% PMMA) with hardness factor 90, max applied
load was also much less, and further, having pores onto the surface
of the sample is one of the other drawbacks of this sample. The value
of the PUACT 5 is much harder to determine for a compression
test since many materials do not exhibit rapid fracture in compres-
sion. Materials such as most plastics that do not rupture can have
their results reported as the compressive strength at a specific defor-
mation such as 1%, 5%, or 10% of the sample’s original height. Same
trend has been shown by the PUACT 5.
CONCLUSION
Polyurethane prepolymer was prepared using toluene-2,4-diiso-
cyanate (TDI) and poly caprolactone diols (molecular weight 4,000
Fig. 4. Compression results of the prepared PU/PMMA/TiO2 blendssamples (a) PUACT 1 to PUACT 4; (b) PUACT 5.

1658 M. Zuber et al.
August, 2013
g/mol), and the chain was further extended with 1,4-butane diol to
get final polyurethane. Spectroscopic data confirmed the proposed
polyurethane structure. The prepared polyurethane and procured
polymethyl methacylates were blended with different percent com-
position taking constant proportion of titanium dioxide. A self-de-
signed mechanical tool was used for pellet formation to study the
compressive behavior of prepared blended pellets. The results re-
vealed that samples having 80% polyurethane (PU), 20% polyme-
thyl methacrylates (PMMA) with 2.5 g titanium dioxide in 100 g
mixture of PU and PMMA are very suitable for suggesting dental
materials.
ACKNOWLEDGEMENTS
The reported research work is the part of PhD thesis of Ms Shazia
Tabsum. Financial support of the Higher Education Commission
(HEC), Government of Pakistan regarding indigenous 5000 schol-
arship batch-VI is highly appreciated and acknowledged for the con-
duct of this research work. The authors are also thankful to Perstorp
Polyols (Solvay Chemicals), Inc., Toledo, Ohio for gifting the poly-
ols samples.
REFERENCES
1. J. Arends, J. L. Ruben and D. Inaba, Adv. Dent. Res., 11, 403 (1997).
2. K. M. Zia, M. Barikani, I. A. Bhatti, M. Zuber and H. N. Bhatti, J.
Appl. Polym. Sci., 109, 1840 (2008).
3. M. Rogulska, W. Podkoscielny, A. Kultys, S. Pikus and E. Pozdzik,
Eur. Polym. J., 42, 1786 (2006).
4. K. M. Zia, M. Zuber, M. Barikani, I. A. Bhatti and M. A. Sheikh, J.
Appl. Polym. Sci., 113, 2843 (2009).
5. K. M. Zia, M. Barikani, M. Zuber, I. A. Bhatti and H. N. Bhatti, Iran.
Polym., J., 17, 61 (2008).
6. S. D. Seul, J. M. Lim, S. H. Ha and Y. H. Kim, Korean J. Chem.
Eng., 22, 745 (2005).
7. K. M. Zia, I. A. Bhatti, M. Barikani, M. Zuber and Islam-ud-Din,
Appl. Surf. Sci., 254, 6754 (2008).
8. Y. Choe, S. Park, W. Kim and D. Park, Korean J. Chem. Eng., 22,
750 (2005).
9. T.-J. Yim, S. Y. Kim and K.-P. Yoo, Korean J. Chem. Eng., 19, 159
(2002).
10. K.-H. Yeon, J.-H. Song and S.-H. Moon, Korean J. Chem. Eng., 21,
867 (2004).
11. M. Barikani, K. M. Zia, I. A. Bhatti, M. Zuber and H. N. Bhatti, Car-
bohyd. Polym., 74, 621 (2008).
12. K. M. Zia, M. Zuber, M. Barikani, I. A. Bhatti and M. B. Khan, Col-
loids Surf. B., 72, 248 (2009).
13. K. M. Zia, I. A. Bhatti, M. Barikani, M. Zuber and M. A. Sheikh,
Int. J. Biol. Macromol., 43, 136 (2008).
14. K. M. Zia, M. Barikani, I. A. Bhatti, M. Zuber and H. N. Bhatti, J.
Appl. Polym. Sci., 110, 769 (2008).
15. M. R. Kaiser, B. Hazleen, Anuar, B. Noorasikin, Samat, B. Sham-
sul and A. Razak, Iran. Polym. J., 22, 123 (2013).
16. M. Abbasian, M. Shahparian, S. Esmaeily and S. Bonab, Iran. Polym.
J., 22, 209 (2013).
17. M. Zuber, K. M. Zia, S. Mahboob, M. Hassan and I. A. Bhatti, Int.
J. Biol. Macromol., 47, 196 (2010).
18. K. M. Zia, M. Zuber, M. Barikani, A. Jabbar and M. K. Khosa, Car-
bohyd. Polym., 80, 540 (2010).
19. H. Xu, F. Qiu, Y. Wang, W. Wu, D. Yang and Q. Guo, Prog. Org.
Coat., 73, 47 (2012).
20. K. M. Zia, M. Zuber, S. Mahboob, T. Sultana and S. Sultana, Carbo-
hyd. Polym., 80, 229 (2010).
21. J. D. Satterthwaite, A. MaNisuria, K. Vogel and D. C. Watts, Dent.
Mater., 28, 609 (2012).
22. K. M. Zia, M. Barikani, A. M. Khalid, H. Honarkar and Ehsan-ul-
Haq, Carbohyd. Polym., 77, 621 (2009).
23. A. Kaushik, D. Ahuja and V. Salwani, Composites, Part A, 42, 1534
(2011).
24. K. M. Zia, M. Barikani, M. Zuber, I. A. Bhatti and M. Barmar, Int.
J. Biol. Macromol., 44, 182 (2010).
25. A. A. Zandinejad, M. Atai and A. Pahlevan, Dent. Mater., 22, 382
(2006).
26. M. F. Nunes, E. J. Swif and J. Perdigão, Am. J. Dent., 14, 340 (2001).
27. M. A. Japiassú Resende, M. F. de Goes, M. R. Bernardi da Cunha
and A. Borges Soares, J. Dentis., 29, 435 (2001).
28. J. Camilleri, A. Cutajar and B. Mallia, Dent. Mater., 27, 845 (2011).
29. K. M. Zia, M. Barikani, I. A. Bhatti, M. Zuber and M. Barmar, Car-
bohyd. Polym., 77, 54 (2009).
30. E. D. Spoerke, N. G. Murray, H. Li, L. C. Brinson, D. C. Dunand
and S. I. Stupp, Acta Biomater., 1, 523 (2009).
31. M. Zuber, K. M. Zia and M. Barikani, Adv. Struct. Mater., 18, 55
(2013).
32. B. Kasemo, J. Prosthetic Dentis., 49, 832 (1983).
33. P. Linderbäck, N. Harmankaya, A. Askendal, S. Areva, J. Lausmaa
and P. Tengvall, Biomaterials, 31, 4795 (2010).
34. H.-J. Oh, J.-H. Lee, Y.-J. Kim, S.-J. Suh, J.-H. Lee and C.-S. Chi,
Mater. Chem. Phys., 109, 10 (2008).
35. K. M. Zia, M. Zuber, I. A. Bhatti, M. Barikani and M. A. Sheikh,
Int. J. Biol. Macromol., 44, 18 (2009).
36. K. M. Zia, M. Zuber, I. A. Bhatti, M. Barikani and M. A. Sheikh,
Int. J. Biol. Macromol., 44, 23 (2009).
37. K. M. Zia, M. Zuber, M. Barikani, R. Hussain, T. Jamil and S.
Anjum, Int. J. Biol. Macromol., 49, 1131 (2011).
38. D. Kukanja, J. Golob, Z. Ic-Valant and A. M. Krajnc, J. Appl. Polym.
Sci., 67, 80 (2000).
39. ASTM Standards. American society for testing and materials,
ASTM International USA (2004).
40. J. Chen, Y. Zhou, Q. Nan, X. Ye, Y. Sun, F. Zhang ane Z. Wang, Eur.
Polym. J., 43, 4151 (2007).
41. P. Liua, H. Liua, G. Liua, K. Yaob and W. Lvb, Appl. Surf. Sci., 258,
9593 (2012).

Biocompatibility and Microscopic Evaluation ofPolyurethane–Poly(methyl methacrylate)–TitnaniumDioxide Based Composites for Dental Applications
Mohammad Zuber,1 Shazia Tabasum,1 Tahir Jamil,2 Muhammad Shahid,3
Rizwan Hussain,4 Khalid Sajjad Feras,5 Khalid Pervez Bhatti6
1Institute of Chemistry, Government College University, Faisalabad 38030, Pakistan2Department of Polymer Engineering and Technology, Punjab University Lahore, Pakistan3Department of Chemistry and Biochemistry, University of Agriculture, Faisalabad 38040, Pakistan4National Engineering and Scientific Commission, Islamabad, Pakistan5National Forensic Institute, Lahore, Pakistan6Pakistan Council for Science and Technology, P.O. Box 2216, Islamabad, PakistanAQ6Correspondence to: M. Zuber (E - mail: [email protected])
ABSTRACT: We prepared and then blende polyurethanes (PUs) with poly(methyl methacrylate)s (PMMAs) and TiO2 by varying the
percentage compositions to form pellets. The chemistry of all of the blended samples was confirmed by Fourier transform infrared
spectroscopy. The incorporation of TiO2 into the PU–PMMA matrix was confirmed with scanning electron microscopy analysis. Dif-
ferential scanning calorimetry analysis and compression testing was performed, and the results are discussed. The cytotoxicity level of
the prepared blends displayed dependence on the composition ratio of the PU–PMMA blends. The results reveal that the optimum
PU contents in the PU–PMMA–TiO2 blend were responsible for its better biocompatibility. VC 2013 Wiley Periodicals, Inc. J. Appl. Polym.
Sci. 2013, 000, 39806.
KEYWORDS: biomedical applications; blends; microscopy; polyurethanes; properties and characterization
Received 14 February 2013; accepted 1 August 2013DOI: 10.1002/app.39806
INTRODUCTION
Dentin and enamel are two mineralized tissues with strikingly
different mechanical and structural properties that normally
operate jointly for decades without any damage under their
environment. The formation of dentin takes place before the
formation of enamel and is initiated by the odontoblasts of the
pulp. Unlike enamel, dentin continues to form throughout life,
and its formation can be initiated in response to stimuli, such
as tooth decay.1 Such an outstanding mechanical endurance
requires an extraordinarily strong bond between these two tis-
sues. Studies of tooth-related genetic disorders and knockout
animals have demonstrated that the correct formation of the
dentin–enamel interface is essential for proper tooth function.
The problem of interface stability is also very important with
respect to tissue repair, where implant failure often occurs
because of the weak interface between the tissues and repair
materials. It is well understood that interactions between dentin
and enamel tissues during the initial mineralization process play
an important role in the proper formation of this critically
important interface.2 Polymers can be modified for better and
critically important interfaces. PU elastomers are possibly the
most versatile classes of polymers, as they can be molded,
injected, extruded, and recycled3 and can be easily modified by
the variation of the diisocyanate structure and chain-extender
length with a,x-alkane diols.4,5 Structural modifications in poly-
urethane (PU)6–11 and PU acrylate copolymers for textile appli-
cations12–14 have also been of interest to many researchers.
Among the many materials used, polyacrylate is the most fre-
quently used in waterborne PU modifications because of its
excellent properties in terms of hardness, weatherability, water
resistance, and gloss.14,15 The prepared PU–poly(methyl methac-
rylate) (PMMA)-based waterborne PU can be extensively used
for textile applications;14 however, the incorporation of TiO2
into the structure of PU–PMMA is expected to provide excel-
lent biocompatibility and other related properties. Urethane
acrylate copolymers have been explored as biomaterials that are
useful in contact lenses, thermally sensitive materials, and dental
materials.16 A large number of reports on the use of reinforcing
VC 2013 Wiley Periodicals, Inc.
WWW.MATERIALSVIEWS.COM J. APPL. POLYM. SCI. 2013, DOI: 10.1002/APP.3980639806 (1 of 9)
J_ID: z8e Customer A_ID: APP39806 Cadmus Art: APP39806 Ed. Ref. No.: 2013-02-0595.R2 Date: 19-August-13 Stage: Page: 1
ID: pachiyappanm Time: 19:13 I Path: N:/3b2/APP#/Vol00000/130849/APPFile/JW-APP#130849

materials in PU acrylate copolymers are available in the litera-
ture.17,18 Modified clay has been used as a filler to improve their
mechanical properties.19,20 The contrast between composites
containing conventional glass fillers and those containing glass–
ceramic blends revealed that the latter showed significantly
increased flexural strength and modulus, although the difference
did not affect the diametric tensile strength. Among porous
glass–ceramic fillers, the porosity increased the flexural strength
significantly but did not affect the flexural modulus and diamet-
ric tensile strength. Therefore, porous fillers can be considered
as an important and applicable way to reinforce dental compo-
sites.21 At the resin–dentin interface, the adhesive layer has the
lowest elastic modulus among the components of the bonded
complex. The inclusion of fillers in an adhesive causes an
increase in its elastic modulus and provides a layer with an elas-
tic modulus between the dentin and restoration.22,23 The incor-
poration of zirconium oxide into the dental material has also
been reported in the literature.24 Titanium dioxide is known as
a good, biologically safe material for various medical applica-
tions. In bulk form, it is used for the production of implants,25
whereas in the form of porous structures, it provides support
for living cells.26 Resin composites with 0.1–0.25% titanium
dioxide nanoparticles could simulate the opalescence of human
enamel.27 Titanium dioxide containing binders showed excellent
mechanical strength, fatigue resistance,28 good corrosion resist-
ance, and biocompatibility.29 Because of its excellent properties
in biomedical applications, some reports are also available on
the use of titanium dioxide (TiO2) films for implant applica-
tions by electrochemical processes in an electrolyte with sodium
silicate solution as an additive.30 To achieve all of the required
properties in a single material, molecular engineering is
required. PUs can present better mechanical stability, good sol-
vent and chemical resistance, excellent biocompatibility,31–33
and toughness against loading. The acrylic component, on the
other hand, is a low-cost material having a high outdoor resist-
ance and pigment ability.34 It is considered that the incorpora-
tion of TiO2 will definitely improve the mechanical properties
and enhance the biocompatibility. It is noteworthy that no
report is available on the preparation of blends of PU–PMMA–
TiO2-based composites. It is a common procedure to prepare
PU by a step-growth reaction of diisocyanate and polyol, and
the chain is further extended with diols or diamines. Hence,
nanofillers are incorporated into the matrix of PU. However, we
have not found any reports on the preparation of PU–PMMA–
TiO2-based composites. The blending of the properties of the
acrylic component, PU, and TiO2 will definitely help to get
such a polymer with the required properties. Keeping in view
the excellent requisite characteristics of the component material
and to tailor dental material for the required properties, we
conducted this study.
EXPERIMENTAL
Materials
Chemicals. Toluene diisocyanate (TDI), 1,4-butane diol (BDO),
titanium dioxide, and dimethylformamide (DMF) were pur-
chased from Sigma Chemical Co. (Saint Louis, MO). Poly(cap-
rolactone diol) (CAPA 2403A, molecular weight 5 4000) was
kindly gifted by Perstorp Polyols (Solvay Chemicals, Inc.,
Figure 1. General schematic for the preparation of the PU–PMMA–TiO2-based composites. [Color figure can be viewed in the online issue, which is
available at wileyonlinelibrary.com.]
J_ID: z8e Customer A_ID: APP39806 Cadmus Art: APP39806 Ed. Ref. No.: 2013-02-0595.R2 Date: 19-August-13 Stage: Page: 2
ID: pachiyappanm Time: 19:13 I Path: N:/3b2/APP#/Vol00000/130849/APPFile/JW-APP#130849
ARTICLE WILEYONLINELIBRARY.COM/APP
WWW.MATERIALSVIEWS.COM J. APPL. POLYM. SCI. 2013, DOI: 10.1002/APP.3980639806 (2 of 9)

Toledo, Ohio). PMMA was purchased from Merck Chemicals
(Darmstadt, Germany). Its molecular weight was confirmed
with a method reported in the literature.35 The polyol and BDO
used in this study were dried at 80�C in vacuo for 24 h before
use to ensure the removal of all of the air bubbles and water
vapor that may have otherwise interfered with the isocyanate
(NCO) reactions. The molecular weight of the polyol we used
was confirmed by a procedure reported in ASTM D 4274C.35
TDI and all of the other materials were used as received. All of
the reagents used in this study were analytical grade.
Synthesis of PU and PU–PMMA–TiO2 Blends
The synthesis of the PU prepolymers was carried out according
to a recommended procedure.5 During optimization of the
experimental conditions, we confirmed that the formation of
the NCO-terminated PU prepolymer was complete in 1 h. The
Fourier transform infrared (FTIR) spectrum of the PU prepoly-
mer was also obtained to confirm the completion of the PU
prepolymer reaction. The NCO contents of the PU prepolymer
were determined, and the experimental value found was close
to the theoretical value (experimental value 5 9.27%, theoretical
value 5 9.29%). We carried out the conversion of the PU pre-
polymer into the final PU by stirring the prepolymer vigorously
and then adding a previously degassed chain extender, BDO.
The detailed synthesis procedure was presented in our previous
article.36 The synthetic route for the synthesis of PU is shown
in FigureF1 1.
After the preparation of PU, a series of blends of PU–PMMA–
TiO2 were prepared by the dissolution of different compositions
of PU and PMMA (TableT1 I) in DMF. Titanium dioxide (TiO2;
2.5 wt % of the polymer) was added to the blends of PU and
PMMA. The complete dispersion of TiO2 in the blends was
obtained by continuous stirring with a magnetic stirrer for 3 h.
The solvent was evaporated by drying in oven at 110�C. The
synthetic route for the preparation of PU–PMMA–TiO2 is
shown in Figure 1.
After the preparation of the PU–PMMA–TiO2 blends, pellets
were prepared with the self-designed mechanical tool; the
detailed procedure for the formation of the pellets from the
blends was presented elsewhere.36 The final prepared pellets are
shown in FigureF2 2.
Molecular Characterization
Molecular characterization of the monomers used in the synthe-
sis, the intermediate compounds, and the final material formed
at the end of complete polymerization was confirmed with
FTIR spectroscopy. FTIR scans of the prepared copolymer sam-
ples were obtained in the transmission mode with a Shimadzu
FTIR spectrometer.
Hemolytic Activity
To evaluate the biocompatibility, a cytotoxicity test was con-
ducted with cell lines. The hemolytic activity of the pellets was
studied by the method reported by Sharma and Sharma37 with
some modifications. For this purpose, 3 mL of freshly obtained
heparinized human blood was collected from volunteers after
consent and counseling. Blood was centrifuged for 5 min at
2500 rpm. Plasma was discarded, and the cells were washed
three times with 5 mL of chilled (4�C) sterile isotonic
phosphate-buffered saline (PBS) at pH 7.4. Erythrocytes were
maintained (108 cells/mL) for each assay. A volume of 100 lL
of solution of each pellet dissolved in DMF was mixed with
human erythrocytes (108 cells/mL) separately. The samples were
incubated at 37�C for 30 min and agitated after 10 min.
Table I. Sample Code Designations and Different Formulations of the PU and PU–PMMA–TiO2 Blends
PU formulation (molar ratio)
Sample no. Sample code TDI CAPAa BDOPU–PMMA compositionby mass (%) TiO2 in blend (%)
1 PUACT 1 10 1 9 0/100 2.5
2 PUACT 2 10 1 9 10/90 2.5
3 PUACT 3 10 1 9 20/80 2.5
4 PUACT 4 10 1 9 40/60 2.5
5 PUACT 5 10 1 9 60/40 2.5
6 PUACT 6 10 1 9 80/20 2.5
7 PUACT 7 10 1 9 100/0 2.5
a Poly(caprolactone diol).
Figure 2. Pellets prepared from the PU–PMMA–TiO2 blends. [Color
figure can be viewed in the online issue, which is available at
wileyonlinelibrary.com.]
J_ID: z8e Customer A_ID: APP39806 Cadmus Art: APP39806 Ed. Ref. No.: 2013-02-0595.R2 Date: 19-August-13 Stage: Page: 3
ID: pachiyappanm Time: 19:14 I Path: N:/3b2/APP#/Vol00000/130849/APPFile/JW-APP#130849
ARTICLE WILEYONLINELIBRARY.COM/APP
WWW.MATERIALSVIEWS.COM J. APPL. POLYM. SCI. 2013, DOI: 10.1002/APP.3980639806 (3 of 9)

Immediately after incubation, the samples were placed at 0 to
4�C for 5 min and then centrifuged for 5 min at 2500 rpm.
After incubation, 100 lL of supernatant was taken from each
tube and diluted 10 times with chilled PBS (4�C). Triton X-100
(0.1% v/v) was used as positive control, PBS was taken as a
negative control, and we carried out the same procedural steps.
The absorbance was recorded at 576 nm with a l Quant (Bio-
teck). The percentage of RBCAQ7 lysis for each sample was
calculated.
Mutagenic Study by an Ames Bacterial Reverse-Mutation Test
(Fluctuation Test)
A reagent mixture composed of Davis–Mingioli salt, D-glucose,
Bromocresol Purple, D-biotin, and L-histidine were mixed asep-
tically in a sterile bottle. The reagent mixture, extract, sterile
deionized water, strains, and standard mutagens were mixed in
several bottles with the amounts indicated in TableT2 II.
Two mutant strains of Salmonella typhimurium, TA98 and
TA100, were used. A volume of 200 lL of the prepared contents
was dispensed into each well of a 96-well microtitration plate.
The plate was placed in an airtight plastic sample holder to pre-
vent evaporation and incubated at 37�C for 4 days. The blank
plate was observed first, and the rest of plates were read only
when all wells in the blank plate were purple; this indicated that
the assay was not contaminated. The background, standard, and
test plates were scored visually, and all yellow, partially yellow,
or turbid wells were scored as positive wells, whereas purple
wells were scored as negative wells. The extract was considered
toxic to the test strain if all wells in the test plate showed purple
coloration. For an extract to be mutagenic, the number of posi-
tive wells had to be more than twice the number of positive
wells in the background plate.
Scanning Electron Microscopy (SEM) Analysis
A small sample of PU–PMMA–TiO2 blend specimen was fit
into the sample chamber, which could accommodate a specimen
up to 15 cm in height. The specimens of the PU–PMMA–TiO2
blends were made electrically conductive by coating with a thin
layer of gold film with a JEOL sputter coater before analysis.
The morphological studies were performed by SEM (JEOL
JSM-6490A) at 20 kV and at 33 and 1003 magnifications.
Thermal and Mechanical Analyses
To comprehend the changes taking place in the thermal char-
acteristics of the PU–PMMA–TiO2 composites, we carried out
differential scanning calorimetry (DSC) analysis. It was done
with a PerkinElmer thermal analyzer under a nitrogen
atmosphere.
The compressive strength and stiffness properties of the poly-
mer matrix composite materials were determined with the
standard test method ASTM D 6641. In this test, specimens
Table II. Setup of the Mutagenic Study with the Ames Bacterial Reverse-Mutation Test (Fluctuation Assay)
Volume added (mL)
Treatment Mutagen standard Extract Reagent mixture Deionized water Salmonella test strain
Blank — — 2.5 17.5 —
Background — — 2.5 17.5 0.005
Standard mutagen 0.1 — 2.5 17.4 0.005
Test sample — 0.005 2.5 17.5 0.005
Figure 3. FTIR spectra: (a) PUACT 1 (100% PMMA/0% PU), (b) PUACT
2 (90% PMMA/10% PU), (c) PUACT 3 (80% PMMA/20% PU), (d)
PUACT 4 (60% PMMA/40% PU), (e) PUACT 5 (40% PMMA/60% PU),
(f) PUACT 6 (20% PMMA/80% PU), and (g) PUACT 7 (0% PMMA/
100% PU). [Color figure can be viewed in the online issue, which is avail-
able at wileyonlinelibrary.com.]
J_ID: z8e Customer A_ID: APP39806 Cadmus Art: APP39806 Ed. Ref. No.: 2013-02-0595.R2 Date: 19-August-13 Stage: Page: 4
ID: pachiyappanm Time: 19:14 I Path: N:/3b2/APP#/Vol00000/130849/APPFile/JW-APP#130849
ARTICLE WILEYONLINELIBRARY.COM/APP
WWW.MATERIALSVIEWS.COM J. APPL. POLYM. SCI. 2013, DOI: 10.1002/APP.3980639806 (4 of 9)

were cantered between two compression platens, and a com-
pressive load was applied at a constant crosshead rate of 2.5
mm (0.1 in/min) for each 1 in. of sample thickness. Crosshead
travel and load were recorded throughout the test.
RESULTS AND DISCUSSION
Structural Characterization
FTIR spectra of all of the monomers and the individual poly-
merization steps were recorded and were presented in our pre-
vious study.36 The detailed peak assignments of the important
functional group appearing in the FTIR spectra were presented
and comprehensively discussed elsewhere.36 Seven samples with
different compositions of the blends were prepared (Table I)
and characterized. FTIR scans of all of the prepared samples are
given in FigureF3 3. In the FTIR spectrum of PUACT 1 (pristine
PMMA and TiO2), the appearance of C@O and CH symmetric
and asymmetric stretching vibrations of CH2 confirmed the
structure of PMMA. The FTIR spectra of the blends of PU–
PMMA–TiO2 are also presented in Figure3 and are designated
as PUACT 2, PUACT 3, PUACT 4, PUACT 5, and PUACT 6,
whereas the FTIR scan of the pristine PU and TiO2 is titled
PUACT 7. All of the FTIR spectra of the PU–PMMA–TiO2
blends (PUACT 2 to PUACT 6) clearly showed the appearance
of NAH, C@O, and CH symmetric and asymmetric stretching
vibrations of CH2 at the proper frequency and confirmed the
involvement of the PU–PMMA blends. The detailed FTIR peaks
assignment appearing in the PU–PMMA blends was presented
in a previous report.36 The FTIR spectrum of PUACT 7 is also
given in Figure 3; significant peaks were assigned at their rele-
vant position. It could be noted in the comparison of all of the
FTIR scans that there were no NH peaks in the PUACT 1
because this sample only contained pristine PMMA and TiO2,
and all of the other FTIR scans showed the prominent peaks of
NAH, C@O, and CH2 at the proper frequency region. The
FTIR scans presented higher intensity C@O peaks in all of the
spectra. It is worth mentioning that the DMF showed a lower
C@O stretching frequency at 1675 cm21 than an unsubstituted
C@O bond when it remained in the sample. So, we confirmed
that the DMF used as a solvent was completely removed.
Biocompatibility Evaluation
The hemolytic activity of the prepared PU–PMMA–TiO2 blends
was evaluated with the method discussed previously. For this
purpose, PBS and 1% v/v Triton X-100 were used as references.
The results are reported in Table T3III. The results revealed that
no hemolysis (0%) and full hemolysis (100%) was observed in
the presence of PBS and 1% v/v Triton X-100, respectively. As
indicated by the scale (given at the bottom of Table III), the
percentage lysis caused by the blends of the PU–PMMA–TiO2
samples was within the range of no toxicity (as per scale of tox-
icity level). No sample showed any toxic behavior toward the
living cells. In a comparison of all of the studied samples, the
PUACT 7 sample (100% PU/0% PMMA) showed least nontoxic
behavior, and this value toward toxicity increased with increas-
ing content of PMMA; however, the mean values of the individ-
ual samples remained in the limit of nontoxicity. Although
PMMA also showed biocompatible behavior, we concluded that
the contents of PU in the blends were responsible for higher
level of biocompatibility, as shown by the samples. It has been
Table III. Toxicity Levels of Samples of the PU–PMMA–TiO2 Blends
Sample no.Mean toxicitylevel (%)a
Standarddeviation (%)
PUACT 1 9.24 0.68
PUACT 2 8.71 0.30
PUACT 3 7.45 0.59
PUACT 4 4.60 0.33
PUACT 5 2.33 0.45
PUACT 6 0.80 0.06
PUACT 7 0.64 0.09
DMF 0.1 0.02
PBS 0.00 0.03
Triton 100.00 0.05
a The values were the averages of three measurements. The scale was asfollows: 1–10, nontoxic; 11–25, slightly toxic; 26–50, moderately toxic;and 50–100, highly toxic.
Table IV. Mutagenic Activity of Compounds in the Ames Fluctuation Test with TA98 and TA100 with Different Standard Mutagens
With TA98 and K2Cr2O7 as the standardmutagen
With TA100 and NaN3 as the standardmutagen
Sample descriptionNumber of positivewells per 96 wells Result
Number of positivewells per 96 wells Result
Background 24 — 25 —
Standard mutagen 92 Mutagenic 90 Mutagenic
PUACT 1 54 Mutagenic 52 Mutagenic
PUACT 2 66 Mutagenic 81 Mutagenic
PUACT 3 42 Nonmutagenic 34 Nonmutagenic
PUACT 4 21 Nonmutagenic 44 Nonmutagenic
PUACT 5 36 Nonmutagenic 43 Nonmutagenic
PUACT 6 45 Nonmutagenic 36 Nonmutagenic
PUACT 7 22 Nonmutagenic 48 Nonmutagenic
J_ID: z8e Customer A_ID: APP39806 Cadmus Art: APP39806 Ed. Ref. No.: 2013-02-0595.R2 Date: 19-August-13 Stage: Page: 5
ID: pachiyappanm Time: 19:14 I Path: N:/3b2/APP#/Vol00000/130849/APPFile/JW-APP#130849
ARTICLE WILEYONLINELIBRARY.COM/APP
WWW.MATERIALSVIEWS.COM J. APPL. POLYM. SCI. 2013, DOI: 10.1002/APP.3980639806 (5 of 9)

presented in the literature that the noncytotoxic chemistry of PU
makes these polymer blends good candidates for continued devel-
opment as biomedical implants.38 In a similar manner, a study was
conducted on the cytotoxicity of PU–PMMA-based material.39
Mutagenic Activity
The mutagenic activity of the compounds were measured
with the Ames fluctuation test according to the TA98 and
TA100 methods with K2Cr2O7 and NaN3 as standard
Figure 4. (a) SEM images of the PU–PMMA–TiO2 blends: (a) PUACT 1, (b) PUACT 2, (c) PUACT 3, (d) PUACT 4, (e) PUACT 5, (e) PUACT 6, and
(e) PUACT 7. (2) SEM images of the PU–PMMA–TiO2 blends showing the dispersion of TiO2. [Color figure can be viewed in the online issue, which
is available at wileyonlinelibrary.com.]
J_ID: z8e Customer A_ID: APP39806 Cadmus Art: APP39806 Ed. Ref. No.: 2013-02-0595.R2 Date: 19-August-13 Stage: Page: 6
ID: pachiyappanm Time: 19:14 I Path: N:/3b2/APP#/Vol00000/130849/APPFile/JW-APP#130849
ARTICLE WILEYONLINELIBRARY.COM/APP
WWW.MATERIALSVIEWS.COM J. APPL. POLYM. SCI. 2013, DOI: 10.1002/APP.3980639806 (6 of 9)

mutagens, respectively, and the results are presented in
TableT4 IV.
The results presented in Table IV reveal that the standard sam-
ple and PUACT 1 and PUACT 2 samples showed mutagenic
behaviors with both test methods, although all of the other
studied samples showed nonmutagenic behavior. This was
attributed to the fact that the PU–PMMA–TiO2-based compos-
ite showed improved biocompatibility and lower mutagenicity
than the control and the level of biocompatibility increased
with increasing content of PU in the blends. The biocompatibil-
ity encompasses many aspects of a material, including its physi-
cal, mechanical, and chemical properties and its potential
cytotoxic, mutagenic, and allergenic effects, so that no signifi-
cant injuries or toxic effects on the biological function of cells
and individuals arise. It is worth mentioning that biocompatible
materials cannot be mutagenic or influence inflammatory medi-
ators to cause systemic responses, including toxicity, tissue
injury, or teratogenic or carcinogenic effects. Such materials
must be free of agents that may cause allergic responses to indi-
viduals sensitive to these substances. On the basis of the results
presented in Tables III and IV, we concluded that although all
of the samples showed biocompatible behavior, the level of bio-
compatibility increased with increasing contents of PU in the
blends.
SEM Analysis
Polymers, like other substrates, can be scanned with SEM to
show the surface morphology, but some factors can affect the
image. The polymer chains are composed of carbon backbones,
and the organic chain can be damaged by energetic electrons
hitting the surface. SEM images were taken to investigate the
morphology of the prepared PU–PMMA–TiO2 blends with dif-
ferent mass percentages of PU and PMMA in the blends (Figure
F4 4). From the SEM images (Figure 4) of the fractured surface of
the of the PU–PMMA–TiO2 composite blends, we could clearly
see that the fractured surface of the composites became less
rugged with increasing PU contents and decreasing PMMA con-
tents; this suggested increasing interfacial bonding between the
TiO2 contents and PU–PMMA matrix. The homogeneity in the
dispersion of the TiO2 contents in the PU–PMMA matrix
increased with decreasing PMMA ratio and vice versa. More-
over, we observed that the TiO2 contents were well dispersed in
the polymer matrix in PUACT5, PUACT6, and PUACT7, and
there was much shadow around the particles in these images.
DSC Analysis
The glass-transition temperature (Tg) of a dental composite is
merely of importance if it falls in the range of intraoral temper-
atures. Dental composites should possess Tg values greater than
the maximum temperature in the oral cavity to preserve the
material’s physical and mechanical characteristics. In this study,
the Tg of the PU–PMMA–TiO2-based composites was 50�C,
whereas their Tm was 352.4�C, and their heat of enthalpy (DH)
was 1985.497 J/g, as obtained from DSC measurement (Figure
F55). This value of Tg was slightly above the temperature of the
oral AQ2cavity, as established in the literature.
Compression Testing for the Blended Samples
The compressive yield stress was measured in a manner identi-
cal to that used for the tensile yield strength. When testing plas-
tics, the compressive yield stress was measured at the point of
permanent yield on the stress–strain curve. The moduli are gen-
erally greater in compression for most commonly used struc-
tural materials. The compression results are presented in Table
T5V. The results reveal that among all of the studied samples, the
maximum applied load, that is, 1397 Kgf was observed for the
PUACT 1 sample (0% PU and 100% PMMA), and this sample
showed the maximum resistance against load. By decreasing the
mass percentage of the PMMA, the load-bearing capacity of the
samples decreased, and this resulted in the slight fracture
observed in the PUACT 3 sample, and a clear fracture was
observed in the PUACT 4 sample. However, the PUACT 6 sam-
ple (80% PU and 20% PMMA) showed a good load-bearing
capacity (i.e., 1101 Kgf) compared to all of the other samples
having various mass percentages of PU. Although the PUACT 7
Figure 4. Continued
Figure 5. DSC scan of the PU–PMMA–TiO2 blends.
J_ID: z8e Customer A_ID: APP39806 Cadmus Art: APP39806 Ed. Ref. No.: 2013-02-0595.R2 Date: 19-August-13 Stage: Page: 7
ID: pachiyappanm Time: 19:14 I Path: N:/3b2/APP#/Vol00000/130849/APPFile/JW-APP#130849
ARTICLE WILEYONLINELIBRARY.COM/APP
WWW.MATERIALSVIEWS.COM J. APPL. POLYM. SCI. 2013, DOI: 10.1002/APP.3980639806 (7 of 9)

sample (100% PU and 0% PMMA) also showed load-bearing
capacity, the maximum applied load to this sample was 489
Kgf. Further, some pores in the unchecked sample (PUACT 7)
were also observed. In comparison to all of the studied samples,
no fracture was observed against the applied load in the PUACT
1, PUAT 6, and PUACT 7 sample, and finally, we concluded
that the best one among the previous three, PUACT 6, was
more suitable for dental materials because of the following rea-
sons: (1) PUACT 1 was prepared with 100% PMMA (and 0%
PU), which showed less biocompatible behavior and also
showed the lowest hardness factor (i.e., 88); (2) PUACT 6
showed the maximum load-bearing capacity and maximum
hardness (i.e., 95) and also showed less toxic effects during the
cell culture assay because 80 mass % of PU (20% PMMA) was
blended in this sample, and (3) the sample PUACT 7 was
blended with 100% PU (and 0% PMMA) with a hardness factor
of 90; the maximum applied load was also much lower. Also,
the fact that this sample had pores on the surface was another
of its drawbacks. The value of PUACT 7 was much harder to
determine for the compression test because many materials do
not exhibit rapid fracture in compression.
CONCLUSIONS
PUs were prepared with TDI, poly(caprolactone diol)s (molecu-
lar weight 5 4000 g/mol), and BDO. Spectroscopic data con-
firmed the proposed PU structure. The blends were prepared
with various compositions with PU, PMMA, and TiO2 with dif-
ferent mass percentages. Pellets were prepared from the blends,
and FTIR scans confirmed their chemical structure. SEM analy-
sis confirmed the incorporation of TiO2 into the PU–PMMA
matrix. The thermal and mechanical properties were also
affected by the composition of the PU–PMMA blends. The
results revealed that the mass percentage of PU in the blends of
PU–PMMA–TiO2 were responsible for their better biocompati-
bility. In addition to its structural and thermal characteristics,
the other unique characteristic of these composites included its
biocompatibility and compression resistance.
ACKNOWLEDGMENTS
The reported research was part of one of the author’s (S.T.’s) Ph.D.
thesis. Financial support from the Higher Education Commission of
Pakistan (via Indigenous 5000 Scholarship Batch VI) is highly appre-
ciated and acknowledged. The authors are also thankful to Perstorp
Polyols (Solvay Chemicals), Inc., for the gift of the polyol samples. AQ1
REFERENCES
1. Zuber, M.; Zia, K. M.; Barikani, M. Adv. Struct. Mater.
2013, 18, 55.
2. Arends, J.; Ruben, J. L.; Inaba, D. Adv. Dent. Res. 1997, 11,
403.
3. Zia, K. M.; Bhatti, H. N.; Bhatti, I. A. React. Funct. Polym.
2007, 67, 675.
4. Zia, K. M.; Barikani, M.; Zuber, M.; Bhatti, I. A.; Bhatti, H.
N. Iran. Polym. J. 2008, 17, 61.
5. Zia, K. M.; Barikani, M.; Bhatti, I. A.; Zuber, M.; Bhatti, H.
N. J. Appl. Polym. Sci. 2008, 109, 1840.
6. Zia, K. M.; Zuber, M.; Barikani, M.; Bhatti, I. A.; Sheikh,
M. A. J. Appl. Polym. Sci. 2009, 113, 2843.
7. Zia, K. M.; Bhatti, I. A.; Barikani, M.; Zuber, M.; Sheikh,
M. A. Nucl. Instrum. Methods Phys. Res. Sect. B. 2009, 267,
1811.
8. Zia, K. M.; Bhatti, I. A.; Barikani, M.; Zuber, M.; Islam-Ud-
Din. Appl. Surf. Sci. 2008, 254, 6754. AQ3
9. Zuber, M.; Zia, K. M.; Bhatti, I. A.; Jamil, T.; Fazal-ur-
Rehman; Rizwan, A. Carbohydr. Polym. 2012, 87, 2439. AQ3
10. Zia, K. M.; Zuber, M.; Rizwan, A.; Jamil, T.; Tabasum, S.;
Shahid, M. Carbohydr. Polym. 2012, 87, 2063.
11. Sultan, M.; Zia, K. M.; Bhatti, H. N.; Jamil, T.; Hussain, R.;
Zuber, M. Carbohydr. Polym. 2012, 87, 397.
12. Zuber, M.; Zia, K. M.; Bhatti, I. A.; Ali, Z.; Arshad, M. U.;
Saif, M. J. Int. J. Biol. Macromol. 2012, 51, 743.
13. Bhatti, I. A.; Zia, K. M.; Ali, Z.; Zuber, M.; Fazal-ur-
Rehman. Carbohydr. Polym. 2012, 89, 783. AQ3
14. Tabasum, S.; Zuber, M.; Jabbar, A.; Zia, K. M. Carbohydr.
Polym. 2013, 94, 866.
15. Xu, H.; Qiu, F.; Wang, Y.; Wu, W.; Yang, D.; Guo, Q. Prog.
Org. Coat. 2012, 73, 47.
16. Keskin, S.; Usanmaz, A. J. Appl. Polym. Sci. 2010, 117, 458.
17. Satterthwaite, J. D.; Maisuria, A.; Vogel, K.; Watts, D. C.
Dent. Mater. 2012, 28, 609.
18. Karabela, M. M.; Sideridou, I. D. Dent. Mater. 2011, 27,
825.
Table V. Compression Results of the Prepared PU–PMMA–TiO2 Blend Samples
Samplecode
PU–PMMAcomposition bymass (%)
Shore Ahardness
Load at yield(Kgf)
Load atfracture (Kgf)
Maximum appliedload (Kgf) Remarks
PUACT 1 0/100 88 1010.4 — 1397 No fracture observed
PUACT 3 20/80 88 593.2 753 — Slight fracture observed
PUACT 4 40/60 91 524.2 685 — Fracture observed
PUACT 6 80/20 95 693.9 1101 1101 No fracture observed
PUACT 7a 100/0 90 186.4 — 489.1 No fracture observed
a Pores on the untested samples were also observed.
J_ID: z8e Customer A_ID: APP39806 Cadmus Art: APP39806 Ed. Ref. No.: 2013-02-0595.R2 Date: 19-August-13 Stage: Page: 8
ID: pachiyappanm Time: 19:15 I Path: N:/3b2/APP#/Vol00000/130849/APPFile/JW-APP#130849
ARTICLE WILEYONLINELIBRARY.COM/APP
WWW.MATERIALSVIEWS.COM J. APPL. POLYM. SCI. 2013, DOI: 10.1002/APP.3980639806 (8 of 9)

19. Kaushik, A.; Ahuja, D.; Salwani, V. Compos. A 2011, 42, 1534.
20. Dan, C. H.; Lee, M. H.; Kim, Y. D.; Min, B. H.; Kim, J. H.
Polymer 2006, 47, 6718.
21. Zandinejad, A. A.; Atai, M.; Pahlevan, A. Dent. Mater. 2006,
22, 382.
22. Nunes, M. F.; Swift, E. J.; Perdig~ao, J. Am. J. Dent. 2001, 14, 340.
23. Japiass�u Resende Montes, M. A.; de Goes, M. F.; Bernardi
da Cunha, M. R.; Borges Soares, A. J. Dent. 2001, 29, 435.
24. Camilleri, J.; Cutajar, A.; Mallia, B. Dent. Mater. 2011, 27, 845.
25. Pohler, O. E. M. Injury 2000, 31, D7.
26. Spoerke, E. D.; Murray, N. G.; Li, H.; Brinson, L. C.;
Dunand, D. C.; Stupp, S. I. Acta Biomater. 2005, 1, 523.
27. Yu, B.; Ahn, J.-S.; Lim, J. I.; Lee, Y.-K. Dent. Mater. 2009,
25, 1142.
28. Kasemo, B. J. Prosth. Dent. 1983, 49, 832.
29. Linderb€ack, P.; Harmankaya, N.; Askendal, A.; Areva, S.;
Lausmaa, J.; Tengvall, P. Biomaterials 2010, 31, 4795.
30. Oh, H.-J.; Lee, J.-H.; Kim, Y.-J.; Suh, S.-J.; Lee, J.-H.; Chi,
C.-S. Mater. Chem. Phys. 2008, 109, 10.
31. Zia, K. M.; Zuber, M.; Bhatti, I. A.; Barikani, M.; Sheikh, M.
A. Int. J. Biol. Macromol. 2009, 44, 18.
32. Zia, K. M.; Zuber, M.; Bhatti, I. A.; Barikani, M.; Sheikh, M.
A. Int. J. Biol. Macromol. 2009, 44, 23.
33. Zia, K. M.; Zuber, M.; Barikani, M.; Hussain, R.; Jamil, T.;
Anjum, S. Int. J. Biol. Macromol. 2011, 49, 1131.
34. Kukanja, D.; Golob, J.; Ic-Valant, Z.; Krajnc, A. M. J. Appl.
Polym. Sci. 2000, 78, 67.
35. Annual Book of ASTM Standards; D 4274C and D 6641;
American Society of Testing and Materials: West
Conshohocken, PA, 2004; Vol. 08.02. AQ5
36. Tabasum, S.; Zuber, M.; Hussain, H.; Bukhari, I. H. Korean
J. Chem. Eng., to appear. AQ4
37. Sharma, P.; Sharma, J. D. J. Ethnopharmacol. 2001, 74, 239.
38. Guelcher, S. A.; Gallagher, K. M.; Didier, J. E.; Klinedinst, D.
B.; Doctor, J. S.; Goldstein, A. S.; Wilkes, G. L.; Beckman, E.
J.; Hollinger, J. O. Acta Biomater. 2005, 1, 471.
39. Tabasum, S.; Zuber, M.; Jamil, T; Shahid, M.; Hussain, R.
Int. J. Biol. Macromol. 2013, 66, 99.
J_ID: z8e Customer A_ID: APP39806 Cadmus Art: APP39806 Ed. Ref. No.: 2013-02-0595.R2 Date: 19-August-13 Stage: Page: 9
ID: pachiyappanm Time: 19:15 I Path: N:/3b2/APP#/Vol00000/130849/APPFile/JW-APP#130849
ARTICLE WILEYONLINELIBRARY.COM/APP
WWW.MATERIALSVIEWS.COM J. APPL. POLYM. SCI. 2013, DOI: 10.1002/APP.3980639806 (9 of 9)


