The following smoking prevalence information is derived from consumer surveys conducted by ACNielsen (NZ) Ltd in people’s homes. These surveys include tobacco-related questions (commissioned by the Ministry of Health). Smoking prevalence information relates to those aged 15 years and over. Further details about the survey are provided in Appendix 1.
Tobacco Facts May 2001 3
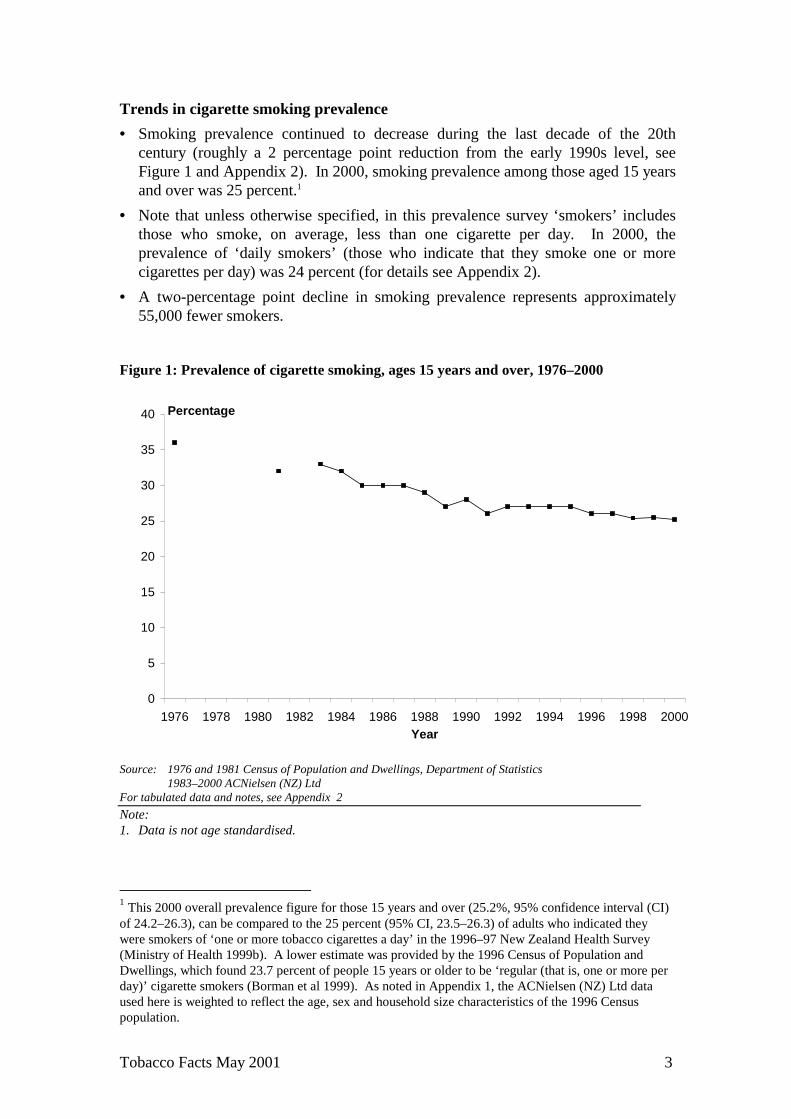
Trends in cigarette smoking prevalence
• Smoking prevalence continued to decrease during the last decade of the 20th century (roughly a 2 percentage point reduction from the early 1990s level, see Figure 1 and Appendix 2). In 2000, smoking prevalence among those aged 15 years and over was 25 percent.1
• Note that unless otherwise specified, in this prevalence survey ‘smokers’ includes those who smoke, on average, less than one cigarette per day. In 2000, the prevalence of ‘daily smokers’ (those who indicate that they smoke one or more cigarettes per day) was 24 percent (for details see Appendix 2).
• A two-percentage point decline in smoking prevalence represents approximately 55,000 fewer smokers.
Figure 1: Prevalence of cigarette smoking, ages 15 years and over, 1976–2000
Source: 1976 and 1981 Census of Population and Dwellings, Department of Statistics 1983–2000 ACNielsen (NZ) Ltd For tabulated data and notes, see Appendix 2
Note: 1. Data is not age standardised.
1 This 2000 overall prevalence figure for those 15 years and over (25.2%, 95% confidence interval (CI) of 24.2–26.3), can be compared to the 25 percent (95% CI, 23.5–26.3) of adults who indicated they were smokers of ‘one or more tobacco cigarettes a day’ in the 1996–97 New Zealand Health Survey (Ministry of Health 1999b). A lower estimate was provided by the 1996 Census of Population and Dwellings, which found 23.7 percent of people 15 years or older to be ‘regular (that is, one or more per day)’ cigarette smokers (Borman et al 1999). As noted in Appendix 1, the ACNielsen (NZ) Ltd data used here is weighted to reflect the age, sex and household size characteristics of the 1996 Census population.
• The decline in smoking prevalence experienced by all age groups during the 1980s has slowed for those 35 years and over and appears to have discontinued for those less than 35 years of age in the 1990s.
• For ages 15–24 years, smoking has persistently been more prevalent among females than males, with no decreases evident for either gender during the 1990s.
• For ages 25–34 years, male and female smoking prevalence has been similar, with no decreases evident for either gender during the 1990s.
• For ages 35–54 years, smoking has generally been more prevalent among males, with both genders showing slight decreases in smoking prevalence in the 1990s.
• For those 55 years and over, smoking has generally been more prevalent among males than females, with both genders showing a decreasing prevalence.
Figure 2: Prevalence of cigarette smoking, by age group, 1983–2000
Source: ACNielsen (NZ) Ltd For tabulated data and notes, see Appendix 2
Note: 1. Data is not age standardised.
0
5
10
15
20
25
30
35
40
1983 1985 1987 1989 1991 1993 1995 1997 1999Year
Percentage
15-24 Years25-34 Years35-54 Years55+ Years
Tobacco Facts May 2001 5
Smoking prevalence among youth
• In 2000, approximately one quarter of 15–19 year olds indicated they were smokers, this increased to about a third for 20–24 years olds.
• Smoking prevalence increases rapidly during the late teens. At younger ages there is a large difference between those who have ‘ever smoked’ and daily smokers. (See Appendix 2: caution should be used in interpreting these data, as there are wide confidence intervals (CI) for these population groups with their relatively small sample sizes.)2
Smoking prevalence by household income and labour force status
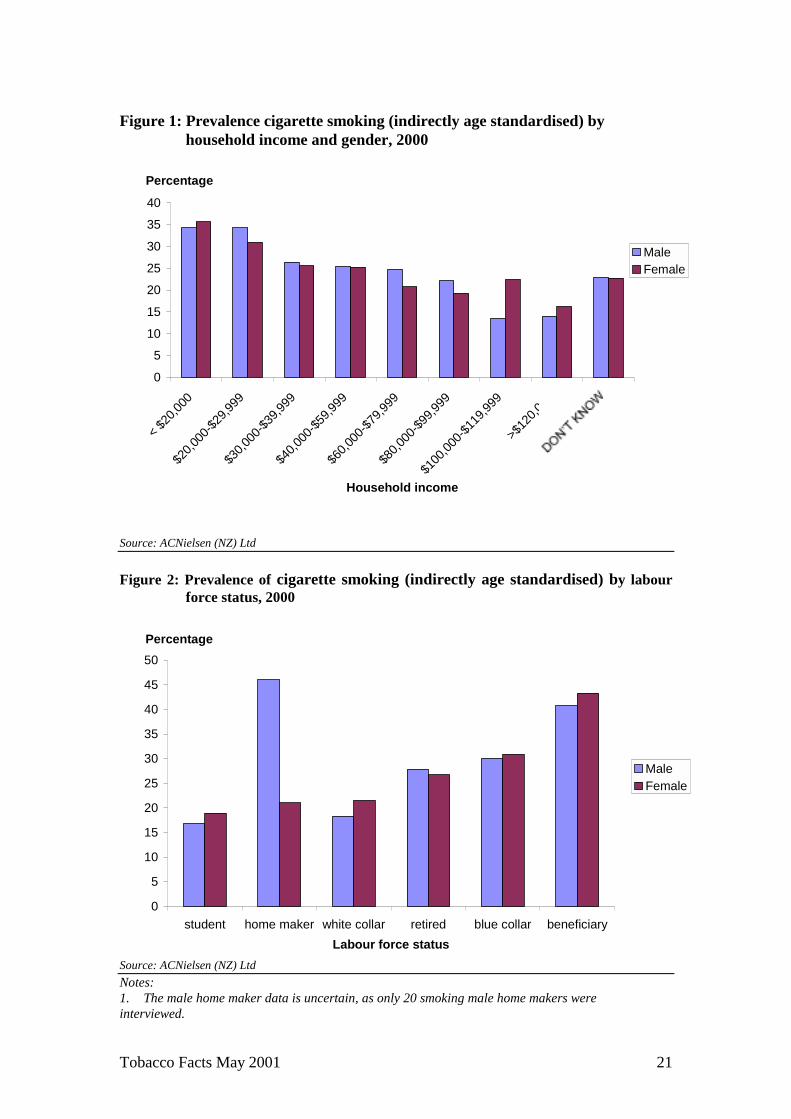
• The highest cigarette smoking prevalence is reported by those with low incomes and respondents indicating they were ‘beneficiaries’ (see Appendix 2, Figure 1 and 2).
Regional variation
• A previous regional analysis of smoking prevalence noted a clustering of areas of high smoking prevalence in the central and eastern North Island (Wilson and Borman 1998).
• Pooled 1998–2000 prevalence data, indirectly standardised by District Health Board (DHB) region, had high smoking prevalence in the central and eastern North Island, as well as high female smoking rates in Northland and the West Coast. In particular, there was statistically significantly high smoking prevalence in the Tairawhiti DHB region for both genders, and high male smoking prevalence in the Taranaki and Hawke’s Bay DHB regions and high female smoking prevalence in the Northland, Lakes, Whanganui and the West Coast DHB regions (see Map 1 and 2 in Appendix 2).
2 The 95 percent confidence intervals indicate that if the sample is repeated 100 times, the true population prevalence is expected to be within the lower and upper confidence interval values 95 times out of 100. Calculation of confidence intervals has taken account of the clustered nature of the data using the statistical software package SUDAAN, except in the District Health Board (DHB) regional analysis where indirect standardisation was used.
Tobacco Facts May 2001 6
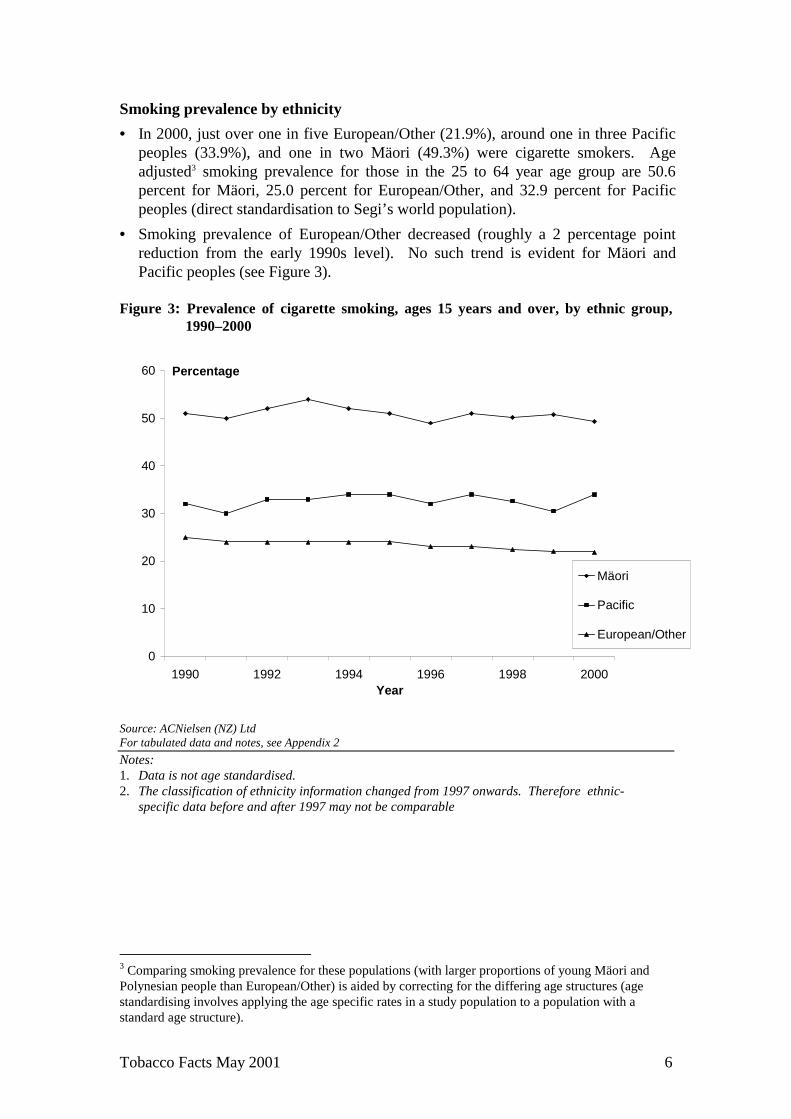
Smoking prevalence by ethnicity
• In 2000, just over one in five European/Other (21.9%), around one in three Pacific peoples (33.9%), and one in two Mäori (49.3%) were cigarette smokers. Age adjusted3 smoking prevalence for those in the 25 to 64 year age group are 50.6 percent for Mäori, 25.0 percent for European/Other, and 32.9 percent for Pacific peoples (direct standardisation to Segi’s world population).
• Smoking prevalence of European/Other decreased (roughly a 2 percentage point reduction from the early 1990s level). No such trend is evident for Mäori and Pacific peoples (see Figure 3).
Figure 3: Prevalence of cigarette smoking, ages 15 years and over, by ethnic group,
1990–2000
Source: ACNielsen (NZ) Ltd For tabulated data and notes, see Appendix 2
Notes: 1. Data is not age standardised. 2. The classification of ethnicity information changed from 1997 onwards. Therefore ethnic-
specific data before and after 1997 may not be comparable
3 Comparing smoking prevalence for these populations (with larger proportions of young Mäori and Polynesian people than European/Other) is aided by correcting for the differing age structures (age standardising involves applying the age specific rates in a study population to a population with a standard age structure).
0
10
20
30
40
50
60
1990 1992 1994 1996 1998 2000Year
Percentage
Mäori
Pacific
European/Other
Tobacco Facts May 2001 7
Number of cigarettes smoked per day
• When asked, ‘on average, how many cigarettes do you smoke in an average day?’, cigarette smokers most commonly indicated that they smoked between 6 and 10 cigarettes on an average day (23% of males, 34% of females) (see Figure 4). (‘Cigarette smokers’ includes smokers of ready-made cigarettes and smokers of roll-your-own cigarettes.)
• Overall, 59 percent of cigarette smokers smoked less than 10 cigarettes per day. Thirty-three percent smoked between 11 and 20 cigarettes per day.
• Eight percent of cigarette smokers indicated smoking more than 20 cigarettes per day (11% of males, 6% of females) (see Figure 4).
• Male smokers aged 55 years and older tended to smoke most heavily, with 18 percent reporting that they smoked more than 20 cigarettes on an average day. In the same age group, 8 percent of women smoked 20 or more cigarettes per day (see Figure 5).
• Using midpoints of the response categories, it is estimated that during 2000, the average smoker smoked 12 cigarettes per day (males, 13 cigarettes per day; females, 11 cigarettes per day). Mäori and European/Others ethnic groups both reported smoking 12 cigarettes per day, while Pacific respondents reported smoking 9 cigarettes per day.
• From 1997 to 2000, the number of cigarettes smoked per smoker per day decreased from 13 to 12 (see Table 1).
Table 1: Average number of cigarettes smoked per smoker, 1997–2000
Year Average number of cigarettes smoked per day
1997 13.1
1998 13.6
1999 12.1
2000 11.9 Source: ACNielsen (NZ) Ltd
Tobacco Facts May 2001 8
Figure 4: Average number of cigarettes smoked on an average day, by gender, 2000
Source: ACNielsen (NZ) Ltd
Figure 5: Percentage of smokers smoking more than 20 cigarettes per day, by age
and gender, 2000
Source: ACNielsen (NZ) Ltd
0
5
10
15
20
25
30
35
40
<1 1-5
6-10
11-15
16-2
0 21
-25 26
-30 31
-40 41
-60
61 or
more
Refuse
d
Average number of cigarettes smoked per day
Percentage
MaleFemale
0
2
4
6
8
10
12
14
16
18
20
15-24 25-34 35-54 55+Age group (years)
Percentage
MaleFemale
Tobacco Facts May 2001 9
Prevalence of cigar smoking
• In 2000, the overall prevalence of cigar smoking was 1.0 percent (95% CI, 0.8–1.2%). For males, 1.9 percent (1.4–2.3) were cigar smokers compared to 0.2 percent (0.1–0.3) of females reported smoking cigars.
• During the four years since 1997, no trend is apparent in the prevalence of cigar smoking (see Table 2).4
Table 2: Prevalence of cigar smoking, 1997–2000
Year Prevalence
1997 1.0 (0.7 – 1.2)
1998 1.0 (0.7 – 1.2)
1999 0.9 (0.7 – 1.1)
2000 1.0 (0.8 – 1.2) Source: ACNielsen (NZ) Ltd
Notes: 1. Data is not age standardised. 2. The annual estimate is the average of the pooled year’s data. 3. The 95 percent confidence intervals are presented in parentheses.
4 This contrasts with information from ‘annual tobacco returns’ later in this report, which indicates increasing amounts of cigar tobacco sold to retailers during this time period. It could be that a similar number of cigar smokers now consume a greater number of cigars per day.
Tobacco Facts May 2001 10
FOURTH FORM STUDENT SURVEY
Fourth-form students (14–15 year olds) have been surveyed in November of 1992, 1997, 1998, 1999 and 2000 (Scragg and Laugesen 2000). The results of the 2000 survey are expected to be published in 2001. Table 3: Prevalence of fourth form student daily smoking (percent) 1992 1997 1998 1999 Boys 11 13 12 14 Girls 12 16 16 15 Table 4: Prevalence of fourth form student monthly or more smoking (percent) 1992 1997 1998 1999 Boys 20 23 23 24 Girls 25 32 32 30
Tobacco Facts May 2001 11
TOBACCO PRODUCTS RELEASED
Information about the amount of manufactured cigarettes and loose tobacco released for consumption is provided by Statistics New Zealand.5 This information is obtained from External Trade Statistics and New Zealand Customs Service who clear tobacco products on which duty has been paid. For imported tobacco, excise is usually paid when products are brought into New Zealand. There is a lag between tobacco products being cleared and their eventual consumption by smokers. Following payment of excise and inclusion as ‘tobacco products released’ data, these products may be stored prior to sale to retailers. Prior to an increase in tax on tobacco products, there is often an increase in the amount of tobacco products cleared with a decrease following the tax increase. (There is an annual inflation-related adjustment in tax on tobacco products on 1 December.) There was a larger than usual peak in products released during November 2000. The tobacco products data are an independent indicator of tobacco consumption by smokers, not reliant on smokers’ self-reporting of how much they smoked. Figure 6: Number of cigarette equivalents* per adult aged 15 years and over,
released for consumption, 1970–2000
Source: Statistics New Zealand For tabulated data and notes, see Appendix 3 * One cigarette equivalent equals one manufactured cigarette or one gram of loose tobacco.
5 The monthly data includes imports of manufactured cigarettes and loose tobacco not for further manufacture less any re-exports. Also included are locally manufactured cigarettes and tobacco products at the time of payment of excise.
Cigarette equivalents* per adult
0
500
1000
1500
2000
2500
3000
3500
1970 1975 1980 1985 1990 1995 2000Year
Tobacco Facts May 2001 12
Trends in cigarette consumption
• In 2000, there was a 2 percent increase in the average number of cigarette equivalents per adult released compared to 1999.6 However, the main trend is one of decreasing tobacco equivalents released per adult. During the last 10 years, the average number of cigarette equivalents consumed per adult decreased by more than 30 percent.
• The amount of tobacco consumed is influenced both by the prevalence of smoking and the number of cigarettes consumed per smoker. The 30 percent decrease in tobacco consumed per adult during the last ten years is likely to be due mainly to a decrease in the number of cigarettes consumed per smoker.
• People under-estimate the number of cigarettes they smoke per day. Data derived from ‘tobacco products released’ data in 2000 suggests each adult smoked an average of approximately 15 cigarettes per day. The ACNielsen (NZ) Ltd survey data suggests that each adult smoker smoked about 12 cigarettes per day.
Effect of tax increases
• In May 2000, there was an approximately 20 percent price increase in tobacco products. (An approximately 14 percent tax increase, one dollar per pack of 20 cigarettes, which was accompanied by tobacco company price increases at this time). This change was associated with an 18 percent decrease in total tobacco consumption.7 Consumption of loose tobacco increased by 1 percent while manufactured cigarette consumption decreased 23 percent.
• In May 1998, there was a 50 cents (GST exclusive) increase in the excise on a packet of 20 cigarettes (with similar increases for other tobacco products). This change was associated with a 6 percent decrease in total tobacco consumption.8
• In December 1995, there was a 38 percent increase solely in the excise on loose tobacco (while the excise on manufactured cigarettes was not changed at that time). This change (which equalised the excise on loose tobacco and manufactured cigarettes) was associated with almost no change in total tobacco consumption. However, consumption of loose tobacco decreased 17 percent, while consumption of manufactured cigarettes increased 5 percent.9
6 This increase very likely reflects an increase in stocks of cigarettes, rather than increased consumption. The 2000 high value can be explained by the larger than usual peak in tobacco products released in November (prior to the December adjustment to the tobacco excise for inflation). 7 These figures relate to the 9 months after the change, compared with the same period before the change (they exclude the month before, during and after the tax increase as these often have atypical amounts of tobacco products released). That is, the comparison is between July 1999 to March 2000 and July 2000 to March 2001. 8 Consumption of loose tobacco increased by 2 percent while manufactured cigarette consumption decreased 8 percent. These figures relate to the 9 months after the change compared with a similar period before the change (excluding the month before, during and after the change). 9 These figures relate to the 9 months after the change compared with the same months before the change (excluding the month before, during and after the change).
Tobacco Facts May 2001 13
ANNUAL TOBACCO RETURNS
Importers and manufacturers of tobacco are required by the Smoke-free Environments Act 1990 to annually supply information to the Director-General of Health regarding tobacco products sold to retailers during the previous year. This information includes numbers of manufactured cigarettes sold, as well as weight of roll-your-own cigarette tobacco, cigar tobacco and pipe tobacco sold to retailers. The Smoke-free Environments Act 1990 further requires manufacturers and importers to report the quantity of tar and nicotine per cigarette, for products sold during the previous year. This information is not reported here, but can be found in Tobacco Statistics 2000, a Cancer Society of NZ publication (Laugesen 2000). Tobacco Statistics 2000 also includes ACNielsen (NZ) Ltd survey data, Statistics New Zealand tobacco data, information on the price of tobacco and other tobacco related information.
Compared to Statistics New Zealand’s ‘tobacco products released’ data, the annual tobacco returns reflect data closer in time to the products’ eventual consumption. Statistics New Zealand data includes tobacco products at the stage of entry into New Zealand, while annual tobacco returns relate to the stage of sale to retailers. Warehousing of products can occur between these two stages.
• For 1997–99, the annual total cigarette tobacco products quantities provided by annual tobacco returns and ‘tobacco products released’ data are similar (3% or less difference).
• Annual tobacco returns for 1997–99 provide numbers of manufactured cigarettes that are higher and weights of loose tobacco that are lower than Statistics New Zealand data for a similar period. This difference appears to be due to warehousing of products prior to sale to retailers. This implies that during this three-year period, warehoused stock of manufactured cigarettes have decreased and stocks of loose tobacco have increased.10
• During 1997–99, the consumption of cigars increased while that of pipe tobacco decreased, as indicated by the weight of these products sold by importers and manufacturers to retailers (see Table 5).
Source: Ministry of Health: Report on the tobacco manufacturers’ returns for 1999 to the Ministry of Health, 2000 prepared by Dr M Laugesen. Note:
1. Tobacco weight includes additives and moisture.
10 Note that cigarettes resulting from the New Zealand production of manufacture cigarettes from loose tobacco are similarly captured in both ‘tobacco products released’ data and annual tobacco returns.
Tobacco Facts May 2001 14
THE NATIONAL TOBACCO QUITLINE SERVICE
The national freephone Quitline (0800 778 778) has been in operation since mid-1998. Callers to the Quitline can request a pack of quit smoking materials, and talk to a Quit Advisor for support and advice. Since November 2000, callers to the Quitline have been assessed for their suitability for nicotine replacement therapy (NRT). Those assessed as suitable, are sent an exchange card which can be swapped for patches or gum at a participating pharmacy ($10 for a four week supply). Smokers using the patches or gum are also offered follow up support and advice. The availability of subsidized nicotine patches and gum through the Quitline was associated with a marked increase in calls to the Quitline. In November and December 2000, there were approximately 71,000 and 22,000 calls respectively. This compares with approximately 4,000 calls per month prior to the introduction of NRT. About half of the incoming calls are from new callers wanting to quit smoking. They receive an information kit, can speak with a Quit Advisor and be provided with access to subsidised nicotine patches or gum. The remaining incoming calls are from repeat callers, general enquiries and hang-ups. The Quit Advisors also provide ongoing support in the form of ‘callbacks’. Approximately 80 percent of callers who speak with an advisor request and receive ‘callbacks’. For 2 July to 30 September 2000, 27 percent of captured callers were Mäori of whom 70 percent were female.
Tobacco Facts May 2001 15
HEALTH EFFECTS OF TOBACCO SMOKING
Risks for the individual smoker
• It is beneficial to stop smoking at any age. The earlier smoking is stopped, the greater the health gain (Doll et al 1994).
• Smoking is the underlying cause of many diseases, including some cancers, respiratory diseases and cardiovascular diseases.
• The average years of expected life lost because of continuing smoking (the difference in median survival between continuing smokers and non-smokers) is about 7.5 years (Doll et al 1994; Prescott et al 1998).
• Continuing smokers have a mortality rate twice that of non-smokers (Doll et al 1994). Approximately half of all continuing smokers die prematurely from smoking (Doll et al 1994; WHO 1997).
• Peto et al (1994) estimate that in New Zealand, the approximately 50 percent of smokers who die prematurely from their smoking, die on average 14 years earlier than non-smokers.
Effects on children
• Maternal smoking is a preventable risk factor for children dying of sudden infant death syndrome (SIDS). In recent years, 46 percent of SIDS deaths in Mäori, 24 percent of deaths in Pacific peoples, and 24 percent of deaths in European/Other were attributable to smoking (Ministry of Health 1999a).
• Environmental tobacco smoke increases the risk of croup, pneumonia, bronchitis and bronchiolitis by 60 percent in the first 18 months of life, increases the risk of asthma by 50 percent, and is a cause of glue ear (NHMRC Working Party 1995).
Effects of secondhand cigarette smoke
• ‘There are about 388 deaths caused by secondhand cigarette smoke in New Zealand each year. This is equal to an additional 8 [percent] over and above deaths due to direct smoking, or about three quarters of the number of people killed each year on the roads in New Zealand in recent years (509 deaths in 1999)’ (Woodward and Laugesen 2000).11
• Exposure to second hand cigarette smoke increases the risk of heart disease and stroke (Bonita et al 1999), lung cancer and SIDS.
11 A report regarding deaths in New Zealand attributable to second hand cigarette smoke is available as an online publication on the Ministry of Health’s website (http://www.moh.govt.nz).
Tobacco Facts May 2001 16
Preventable future deaths
• Using different methods, the number of total deaths due to smoking is estimated as lying between approximately 4,300 (Ministry of Health 1999a) and approximately 4,700 (using 1996 data and the method published by Peto et al in 1994).
• It is estimated that in New Zealand many deaths due to various diseases could be prevented if smoking was eliminated, including:
− 68 percent of female deaths and 82 percent of male deaths due to lung cancer
− 65 percent of female deaths and 79 percent of male deaths due to chronic obstructive respiratory disease
− 11 percent of female deaths and 18 percent of male deaths due to heart disease
− 8 percent of female deaths and 15 percent of male deaths due to strokes (Ministry of Health 1999a).
• For Mäori, a high percentage of mortality could be prevented if smoking was eliminated. Each year, 21 percent of deaths in female Mäori are attributable to smoking and 22 percent of male Mäori deaths (Ministry of Health 1999a).
• For Pacific peoples, 8 percent of deaths in females and 19 percent in males could be avoided if smoking was eliminated. For European/Other ethnic groups, the preventable mortality attributable to smoking is 10 percent of deaths in females and 19 percent in males (Ministry of Health 1999a).
Tobacco Facts May 2001 17
REFERENCES
Bonita R, Duncan J, et al. 1999. Passive smoking as well as active smoking increases the risk of acute stroke. Tob Control 8: 156-60.
Borman B, Wilson N, Maling C. 1999. Socio-demographic characteristics of New Zealand smokers: results from the 1996 census. NZ Med J 112: 460–3.
Doll R, Peto R, et al. 1994. Mortality in relation to smoking: 40 years' observations on male British doctors. Br Med J 309: 901–11.
Iribarren C, Tekawa I, et al. 1999. Effect of cigar smoking on the risk of cardiovascular disease, chronic obstructive pulmonary disease, and cancer in men. N Engl J Med 340: 1773-80.
Laugesen M. 2000. Tobacco Statistics 2000. Wellington: Cancer Society of NZ Inc.
Lopez AD, Collishaw NE, et al. 1994. A descriptive model of the cigarette epidemic in developed countries. Tob Control 3: 242–7.
Ministry of Health. 1999a. Our Health, Our Future: Hauora Pakari, Koiora Roa: The Health of New Zealanders 1999. Wellington: Ministry of Health.
Ministry of Health. 1999b. Taking the Pulse: the 1996/97 New Zealand Health Survey 1999. Wellington: Ministry of Health.
NHMRC Working Party. 1995. The Health Effects of Passive Smoking. Canberra: National Health and Medical Research Council Draft Report.
Peto R, Lopez A. 1994. Mortality from Smoking in Developed Countries 1950–2000: Indirect estimates from national vital statistics. New York: Oxford University Press.
Prescott E, Osler M, et al. 1998. Life expectancy in Danish women and men related to smoking habits: smoking may affect women more. J Epidemiol Community Health 52: 131–2.
Scragg R, Laugesen M. Cigarette smoking by 4th form students in 1999 declining in girls from 1997 peak but unchanged in boys. NZ Public Health Rep (in press)
WHO. 1997. Tobacco or Health: A Global Status Report. Geneva: World Health Organization.
Wilson N, Borman B. 1998. Spatial analysis of smoking in New Zealand as a tool for targeting tobacco control interventions. Wellington: Health Funding Authority.
Woodward A, Laugesen M. 2000. Deaths in New Zealand attributable to second hand cigarette smoke. http://www.moh.govt.nz/moh.nsf/7004be0c19a98f8a4c25692e007bf833/f52d604cfdcb49364c256973007c4028/$FILE/2handsmoke.doc.rtf
Tobacco Facts May 2001 18
APPENDIX 1: SURVEY METHOD
ACNielsen (NZ) Ltd conducted approximately 11,000 face-to-face interviews during 2000, with different consumers interviewed each quarter. Those interviewed are provided with a showcard that itemises: ready-made cigarettes, roll-your-own tobacco, cigars/cigarillos, pipe or none of these. They are asked: ‘Which of these products, if any, do you ever smoke?’ People who ever smoke ready-made cigarettes are then asked: ‘On average how many ready-made cigarettes do you smoke on an average day?’ and those who indicate they ever smoke roll-your-own cigarettes are then asked: ‘On average, how many roll-your-own cigarettes do you smoke on an average day?’ Cigarette smokers are defined as those who ever smoke any ready-made cigarettes or roll-your-own tobacco cigarettes. In 2000, the interviews were completed in 48.6 percent of the occupied dwellings approached. (Contact was made in 85.1% of the total number of occupied dwellings approached. Interviews were completed in 57.1% of occupied dwellings where contact was made.) The data obtained from the survey is weighted to reflect the age, sex and household size characteristics of the 1996 Census population. Weighted values are used in the analysis of this report.
Tobacco Facts May 2001 19
APPENDIX 2: SURVEY DATA, 1983–2000
Table 1: Prevalence of cigarette smoking, 1976–2000
Source: 1976 and 1981 Census of Population and Dwellings, Department of Statistics 1983–99 ACNielsen (NZ) Ltd Notes: 1. Data is not age standardised. 2. From July 1989 to March 1996, the youngest age group reported was 16–24 years.
Adjustment for the expected proportion of smokers aged 15–24 years from those aged 16–24 years has been made.
3. Annual ACNielsen (NZ) Ltd estimates have been calculated from the average of the quarterly results until 1999. The 2000 result is based on the year’s pooled data’s average prevalence.
4. From April 1996 to June 1998 the youngest age group reported was 18–24 years. Adjustment for the expected proportion of smokers aged 15–24 years from those aged 18–24 years has been made.
5. Smoking prevalence figures include the smoking of both manufactured and roll-your-own cigarettes.
6. The classification of ethnicity information changed from 1997 onwards. Therefore ethnic-specific data before and after 1997 may not be comparable.
Tobacco Facts May 2001 20
Table 2: Prevalence of cigarette smoking, 2000 Smoking (‘ever smoke’) Daily smoking Males 15–24 years 27.8 (24.3–31.4) 26.1 (22.4–29.8) 25–34 years 35.1 (31.4–36.9) 32.1 (28.6–35.6) 35–54 years 27.1 (24.6–28.4) 25.3 (22.7–27.9) 55+ years 11.9 (10.2–12.8) 11.2 (9.6–12.9) Total Males 25.1 (23.7–26.6) 23.4 (21.9–24.9) Mäori Males 45.3 (39.7–50.8) 43.8 (38.4–49.1) Pacific Males 40.5 (32.1–48.9) 36.0 (27.7–44.4) European/Other Males 22.0 (20.5–23.5) 20.5 (19.0–21.9) Females 15–24 years 31.0 (27.6–34.3) 27.8 (24.6–31.0) 25–34 years 36.8 (33.9–38.3) 34.8 (31.9–37.8) 35–54 years 25.5 (23.5–26.5) 24.4 (22.4–26.4) 55+ years 12.7 (11.2–13.5) 12.4 (10.9–13.9) Total Females 25.3 (24.1–26.5) 23.9 (22.6–25.1) Mäori Females 52.5 (48.2–56.8) 50.2 (45.8–54.6) Pacific Females 28.5 (22.7–34.3) 27.6 (21.8–33.4) European/Other Females 21.7 (20.5–23.0) 20.3 (19.1–21.5) Both Sexes 15–24 years 29.5 (26.9–32.1) 27.0 (24.5–29.5) 25–34 years 36.0 (33.6–38.3) 33.5 (31.2–35.8) 35–54 years 26.2 (24.6–27.9) 24.9 (23.2–26.5) 55+ years 12.4 (11.2–13.5) 11.9 (10.7–13.0) Mäori 49.3 (45.8–52.8) 47.4 (43.9–50.9) Pacific peoples 33.9 (28.4–39.5) 31.4 (25.9–36.9) European/Other ethnic group 21.9 (20.9–22.9) 20.4 (19.4–21.3) Total Population (15+ years) 25.2 (24.2–26.3) 23.7 (22.6–24.7)
Table 3: Youth prevalence of cigarette smoking by gender, 2000 Male Female Total 15-19 years 25.0 (20.2–29.8) 25.8 (21.3–30.2) 25.4 (22.0–28.7) 20-24 years 30.8 (25.3–36.2) 36.1 (31.1–41.0) 33.6 (29.8–37.3)
Table 4: Youth prevalence of cigarette smoking by ethnicity, 2000 Mäori European/Other Pacific peoples 15-19 years 43.6 (34.5–52.8) 21.1 (17.5–24.7) 30.0 (16.7–43.3) 20-24 years 48.3 (39.7–56.9) 28.7 (24.7–32.6) 49.2 (34.5–63.9)
Table 5: Prevalence of cigarette smoking by year of age, 2000 and 1998-2000
(both genders, all ethnicities combined) 2000 1998-2000 data pooled
Notes: 1. Data is not age standardised. 2. The annual estimates are the average prevalences from the pooled year’s data. 3. The 95 percent confidence intervals are presented in parentheses.
Tobacco Facts May 2001 21
Figure 1: Prevalence cigarette smoking (indirectly age standardised) by
household income and gender, 2000
Source: ACNielsen (NZ) Ltd
Figure 2: Prevalence of cigarette smoking (indirectly age standardised) by labour
force status, 2000
Source: ACNielsen (NZ) Ltd
Notes: 1. The male home maker data is uncertain, as only 20 smoking male home makers were interviewed.
Percentage
0
5
10
15
20
25
30
35
40
< $20,0
00
$20,0
00-$2
9,999
$30,0
00-$3
9,999
$40,0
00-$5
9,999
$60,0
00-$7
9,999
$80,0
00-$9
9,999
$100
,000-$
119,9
99
>$120
,000
Household income
MaleFemale
Percentage
0
5
10
15
20
25
30
35
40
45
50
student home maker white collar retired blue collar beneficiaryLabour force status
MaleFemale
Tobacco Facts May 2001 22
Map 1: Prevalence of male cigarette smoking (indirectly standardised) by DHB region, 1998-2000
Source: ACNielsen (NZ) Ltd Notes: 1. The matching from TLAs to DHB regions is approximate only. 2. Prevalence was calculated by multiplying crude New Zealand gender specific rate (male 26%,
female 25%) by the indirectly age standardised DHB region rate ratio. 3. Darkly shaded and lighted shaded areas represent indirectly age standardised cigarette smoking
prevalence which are statistically significantly different from the male or female New Zealand rate. For example, although there were more smokers surveyed than expected in the Wairarapa region, the number of people interviewed was not large enough to be sure that this finding was statistically significant.
Tobacco Facts May 2001 23
Map 2: Prevalence of female cigarette smoking (indirectly standardised) by DHB region, 1998-2000
Source: ACNielsen (NZ) Ltd Notes: 1. The matching from TLAs to DHB regions is approximate only. 2. Prevalence was calculated by multiplying crude New Zealand gender specific rate (male 26%,
female 25%) by the indirectly age standardised DHB region rate ratio. 3. Darkly shaded and lighted shaded areas represent indirectly age standardised cigarette smoking
prevalence which are statistically significantly different from the male or female New Zealand rate. For example, although there were more smokers surveyed than expected in the Wairarapa region, the number of people interviewed was not large enough to be sure that this finding was statistically significant.
Tobacco Facts May 2001 24
APPENDIX 3: TOBACCO PRODUCTS RELEASED, 1970–2000
Table 6: Tobacco products released for consumption in New Zealand, 1970–2000
Tobacco products released Number of cigarette equivalents** released per adult aged 15+ years
Source: Statistics New Zealand * One tonne equals 1000 kg ** One cigarette equivalent equals one manufactured cigarette or one gram of loose tobacco Notes: 1. Assuming that one cigarette equals one gram of loose tobacco, one million manufactured
cigarettes equal one tonne of loose tobacco. 2. Cigarette equivalents per adult for 1991−2000 are calculated using resident population
estimates and projections obtained from Statistics New Zealand in 2000. These estimates and projections include New Zealand residents temporarily overseas and are adjusted for census undercount. Projections are based on assumptions of medium fertility, mortality and migration.
3. Calculations of cigarette equivalents are based on excise data on manufactured cigarettes and loose tobacco released for sale. Loose tobacco is mainly cigarette tobacco but includes a small amount of pipe tobacco. Cigars are not included.
4. The 1995 tobacco products released figures presented here, and from 1996 onwards the number of cigarettes smoked per adult aged 15+ years, differ from those of Tobacco Facts 1999. This is due to updated estimates from Statistics New Zealand for both tobacco consumption and denominator population data.