32
INVESTORS’ GUIDE 2003 INVESTORS’ GUIDE 2003

INVESTORS’ GUIDE 2003INVESTORS’ GUIDE 2003

Tokyo Gas Co., Ltd. is based in metropolitan Tokyo and the Kanto region, where demand for energy is growing strongly. AsJapan’s largest gas company, Tokyo Gas serves approximately 9.2 million customers in a service area covering 3,155 km2. Progress in energy industry deregulation and expanding gas demand in metropolitan Tokyo are creating businessopportunities. With the aim of generating growth, the Tokyo Gas Group implemented a new medium-term management plan,Frontier 2007, in April 2003. Under this plan, Tokyo Gas will work to meet the expectations of its customers andshareholders and increase corporate value as an “Energy Frontier Corporate Group” that achieves sustained growth throughbusinesses that supply energy and energy-related value-added products and services, centered on natural gas.
東京ガスは、需要規模が大きく成長性の高い首都圏・関東地域を事業基盤とし、約920万件の顧客と、3,155km2に及ぶ供給エリアを誇る日本最大の都市ガス事業者です。エネルギー業界における規制緩和の
進展や首都圏でのガス需要の拡大をビジネスチャンスと捉え、東京ガスグループの新たな成長を目指し、本
年4月からグループ中期経営計画「フロンティア2007」をスタートしています。この計画の実行により、天然ガスを中心にしたエネルギーおよびエネルギー関連事業を通じて成長し続ける「エネルギーフロンティア企業
グループ」として企業価値の増大を図り、お客さま・株主の皆さまの期待にこたえられるよう努力しています。
Note 1: Although unaudited, all financial information in this investors’ guide is based on certified financial statements.Note 2: Statements made in this investors’ guide with respect to Tokyo Gas’s plans, strategies, and beliefs, as well as all other
statements that are not expressions of fact, are based on management’s assumptions and opinions.注1:記載の財務数値は、有価証券報告書を基準としておりますが、監査法人等の監査を受けているものではありません。注2:本誌に記載されている東京ガスの現在の計画、見通し、戦略、その他の歴史的事実でないものは、現在入手可能な情報から
得られた東京ガスの経営者の判断に基づいております。実際の業績は、さまざまな重要な要素により、これら業績通しとは大きく異なる結果となりうることをご承知おきください。
Gunma群 馬
Tochigi栃 木
Saitama埼 玉
Kanagawa神奈川
Minamiashigara南足柄
Kumagaya熊谷
Kumagaya–Sano Transmission Pipeline (2004)熊谷ー佐野幹線(2004)
Chuo Transmission Pipeline (2009)中央幹線(2009)
Tochigi Line (2006)栃木ライン(2006)
Hitachi日立
Gas Pipeline Total Length 49,431km (March 31, 2003) 導菅総延長49,431km(2003年3月末)
Ibaraki茨 城
Chiba千 葉
Sodegaura LNG Terminal袖ケ浦工場
Tokyo Bay 東京湾
Tokyo東 京
Ohgishima LNG Terminal扇島工場
Negishi LNG Terminal根岸工場
本社Head Office
Sano佐野
Moka真岡
Utsunomiya宇都宮
Tokyo Gas Service Area東京ガスの供給エリアContents 目 次
Financial Highlights 財務ハイライト ............................................................................................. 1Global Natural Gas Market 世界の天然ガス市場.......................................................................... 2Feedstock Data 原料関連データ................................................................................................... 3Gas Demand Data ガス需要データ............................................................................................... 4–9Capital Expenditures, Depreciation and Amortization, Number of Employees and Others設備投資、減価償却費、従業員数その他....................................................................................... 10–11R&D Data 研究開発関連データ.................................................................................................... 12Financial Data 財務データ
Segment Information セグメント情報..................................................................................... 13Profitability and Growth 収益性/成長性................................................................................ 14–15Efficiency and Soundness 効率性/安全性............................................................................ 16–17Performance Indicators 投資指標 ........................................................................................... 18–19
Financial Statements and Others 財務諸表その他Ten-Year Consolidated Balance Sheets 連結貸借対照表....................................................... 20–21Ten-Year Consolidated Statements of Income 連結損益計算書............................................. 22Three-Year Consolidated Statements of Cash Flows 連結キャッシュ・フロー計算書............ 23Bank Loans, Debts and Bonds 借入金内訳............................................................................. 24Consolidated Subsidiaries 連結子会社.................................................................................... 25Ten-Year Nonconsolidated Balance Sheets 単独貸借対照表................................................. 26–27Ten-Year Nonconsolidated Statements of Income 単独損益計算書....................................... 28
Corporate Data / Stockholder Information 会社概要/株式情報.................................................... 29
DownloadThe raw data for graphs or tables that showthis mark can be downloaded from the TokyoGas Web page.このマークのあるグラフ又は表のデータは弊社ホームページよりダウンロードできます。
(http://www.tokyo-gas.co.jp)
Profile プロフィール

(¥ millions/百万円)
Fiscal years ended March 31 各3月31日終了した1年間 1999 2000 2001 2002 2003
� Consolidated 連 結Net Sales 売上高 997,766 992,255 1,086,770 1,097,589 1,127,633Operating Income 営業利益 72,302 69,233 103,659 110,607 123,294Ordinary Income 経常利益 42,515 43,720 66,875 80,626 91,955Net Income 当期利益 17,764 26,698 27,595 51,911 59,201Gross Cash Flow グロス・キャッシュ・フロー 160,773 167,004 177,969 197,475 200,228Free Cash Flow フリー・キャッシュ・フロー 9,647 42,029 66,572 92,178 88,240Earnings before Interest, Taxes, Depreciation and Amortization EBITDA 215,311 209,539 254,033 256,171 264,321Return on Equity (%) 株主資本利益率(ROE%) 4.23 5.90 5.32 9.30 10.35Return on Assets (%) 総資本利益率(ROA%) 1.04 1.52 1.53 2.97 3.50
� Nonconsolidated 単 独Net Sales 売上高 870,838 869,939 965,619 974,566 992,236Operating Income 営業利益 57,193 51,296 85,790 92,299 100,108Ordinary Income 経常利益 36,405 34,929 58,542 72,249 79,680Net Income 当期利益 16,915 22,395 27,400 48,451 53,633Gross Cash Flow グロス・キャッシュ・フロー 135,986 139,150 154,524 167,957 168,270Free Cash Flow フリー・キャッシュ・フロー 1,677 26,059 53,839 75,402 74,500Earnings before Interest, Taxes, Depreciation and Amortization EBITDA 176,264 168,051 212,914 211,805 214,745Return on Equity (%) 株主資本利益率(ROE%) 4.34 5.37 5.76 9.45 10.26Return on Assets (%) 総資本利益率(ROA%) 1.20 1.55 1.84 3.34 3.84
� Gross Cash Flow = Net Income + Depreciation and Amortization グロス・キャッシュ・フロー=当期利益+長期前払費用償却費+減価償却費� Free Cash Flow = (Net Income + Depreciation and Amortization) – Capital Expenditures フリー・キャッシュ・フロー=(当期利益+長期前払費用償却費+減価償却費)-設備投資額� EBITDA = Operating Income + Depreciation and Amortization EBITDA=営業利益+長期前払費用償却費+減価償却費
0
500
1,000
1,500
’99 ’00 ’01 ’02 ’03
Net Income 当期利益(¥ billions/十億円)
0
20
40
60
’99 ’00 ’01 ’02 ’03
Free Cash Flow フリー・キャッシュ・フロー(¥ billions/十億円)
0
20
40
60
80
100
’99 ’00 ’01 ’02 ’03
Return on Equity 株主資本利益率(%)
0
2
4
6
8
10
12
’99 ’00 ’01 ’02 ’03
1
Consolidated 連 結 Nonconsolidated 単 独
Net Sales 売上高(¥ billions/十億円)
Financial Highlights 財務ハイライト

Share of Natural Gas in Total Primary Energy Supply (2002) 一次エネルギー供給における天然ガスの割合(2002)
Japan 日本
Hydro 水力�4.0%
Nuclear 原子力�14.0%
Coal 石炭�20.7
Natural Gas 天然ガス�13.7%
Oil 石油�47.6%
U.S.A. アメリカ
Hydro 水力�2.5%
Nuclear 原子力�8.1%
Coal 石炭�24.2%
Natural Gas 天然ガス�26.2%
Oil 石油�39.0%
Europe 欧州
Hydro 水力�4.7%
Nuclear 原子力�13.7%
Coal 石炭�14.8%
Natural Gas 天然ガス�23.6%
Oil 石油�43.2%
Natural Gas Trade (2002) 天然ガス貿易(2002)
Middle East – East Asia中東-東アジア�282
Southeast Asia, West Australia – East Asia東南アジア 西豪州-東アジア�739
Alaska – Japanアラスカ-日本�17
Intra – Southeast Asia東南アジア域内�80
Russia – Europeロシア-欧州�1,282
North Sea – Europe北海-欧州�790
Intra – Europe欧州域内�476
North Africa – Europe北アフリカ-欧州�561
Nigeria – Europeナイジェリア-欧州�76 Middle East – North America
中東-北米�11
Middle East – Europe中東-欧州�41
Canada – U.S.A.カナダ-米国�1,028
Trinidad – North Americaトリニダード-北米�4.9
Africa – North Americaアフリカ-北米�10
Trinidad – Europeトリニダード-欧州�5
Intra – South America南米域内�98
2
100 million m3億m3 Worldwide世界 Asia Pacificアジア太平洋
� Pipeline 4,313.5 (74.2%) 79.6 (7.1%)� LNG 1,499.9 (25.8%) 1,038.0 (92.9%)Total 合計 5,813.4 (100.0%) 1,117.6 (100.0%)
(100 million m3/億m3)
(Source: BP Statistical Review of World Energy June 2003/出典)
(Source: BP Statistical Review of World Energy June 2003/出典)
Global Natural Gas Market 世界の天然ガス市場

Abu Dhabi アブダビ
Algeria アルジェリア
Qatar カタール
Australia オーストラリア
Malaysia マレーシア
Indonesia インドネシア
Brunei ブルネイ
Alaska アラスカ
(1,000 tons/千トン)
’73 ’74 ’78 ’76 ’77 ’78 ’79 ’80 ’81 ’82 ’83 ’84 ’85 ’86 ’87 ’88 ’89 ’90 ’91 ’92 ’93 ’94 ’95 ’96 ’97 ’98 ’99 ’00 ’01 ’02 ’03’72’71’700
1,000
2,000
3,000
4,000
5,000
6,000
7,000
8,000
LNG imports started from 1969LNG受入開始(1969年より)
LNG Imports LNG 受入量 (1,000 tons/千トン)At March 31 各3月31日時点 1996 1997 1998 1999 2000 2001 2002 2003
Alaska アラスカ 306 328 289 289 285 288 289 322Brunei ブルネイ 1,133 1,141 1,072 1,085 1,021 980 1,200 1,237Indonesia インドネシア 618 730 896 787 727 782 839 837Malaysia マレーシア 2,778 3,110 2,990 3,163 3,130 3,308 3,403 3,415Algeria アルジェリア — — — — — — — —Australia オーストラリア 649 690 757 705 668 780 952 1,339Qatar カタール — — — 120 361 361 300 360Abu Dhabi アブダビ — — — — — — — —
Total 合 計 5,484 5,999 6,004 6,149 6,193 6,500 6,983 7,510
LNG Project LNG プロジェクト概要Import volume per year Inception of Contract Haul
Project name (10,000 tons) import Contract term type distance (km)プロジェクト名 年間輸入量(万トン) 輸入開始年月 契約期間 契約形態 輸送距離
Alaska 32.4 11/1969(15+5)years +15 years(~3/2004) Ex-Ship 6,000アラスカ 1969年11月 (15+5)年+15年(~2004年3月)Brunei 124.0 12/1972 20 years + 20 years(~3/2013) Ex-Ship 4,400ブルネイ 1972年12月 20年+20年(~2013年3月)Malaysia I 260.0 2/1983 20 years +15 years(~3/2018) Ex-Ship, FOB 4,600マレーシア I 1983年2月 20年+15年(~2018年3月)NWS 79.0 8/1989 20 years(~3/2009) Ex-Ship 6,800西豪州 1989年8月 20年(~2009年3月)Indonesia 92.0 1/1994 20 years(~12/2013) FOB 4,600インドネシア 1994年1月 20年(~2013年12月)Malaysia II 80.0 6/1995 20 years(~3/2015) Ex-Ship 4,600マレーシア II 1995年6月 20年(~2015年3月)Qatar 35.0 1/1997 25 years(~12/2021) Ex-Ship 12,000カタール 1997年1月 25年(~2021年12月)
96/3 97/3 98/3 99/3 00/3 01/3 02/3 03/3
(¥/ton 円/トン) (US$/barrel ドル/バレル)
LNG Prices (Trade statistics)LNG (通関統計値)
Crude Oil Prices (Trade statistics)原油(通関統計値)
0
5,000
10,000
15,000
20,000
25,000
30,000
35,000
0
5
10
15
20
25
30
35
3LNG Imports LNG 受入量
LNG Project 新規LNGプロジェクト概要Import volume per year Inception of Haul distance
Project name (10,000 tons) import Contract term Contract type (km)プロジェクト名 年間輸入量(万トン) 輸入開始年月 契約期間 契約形態 輸送距離
NWS Expansion 107.3 7/2004 FOB 6,800西豪州拡張 2004年7月 25年間(~2029年)Malaysia III 34.0 1/2004 Ex-Ship, FOB 4,400マレーシア III 2004年4月 17年間(~2023年)Bayu-Undan (Darwin) 100.0 1/2006 FOB 5,700バユ・ウンダン(ダーウィン) 2006年1月 17年間(~2023年)Sakhalin II 110.0 4/2007 FOB 1,800サハリン II 2007年4月 24年間(~2031年)
Feedstock Data 原料関連データ
Download

Residential 家庭用�60.6%
Commercial 商業用�19.0
Industrial 工業用�12.7%
Other その他�5.9%
Wholesale 卸供給�1.8%
Residential 家庭用�31.1%
Commercial 商業用�16.6%
Industrial 工業用�34.4%
Other その他�7.3%
Wholesale 卸供給�10.6%
Gas Sales Volume (Results and Forecasts) ガス販売量(実績と見通し)(Million m3/百万m3, 46.047MJ/m3)
0
2,500
5,000
7,500
10,000
12,500
’82 ’83 ’84 ’85 ’86 ’87 ’88 ’89 ’90 ’91 ’92 ’93 ’94 ’95 ’96 ’97 ’98 ’99 ’00 ’01 ’02 ’03 ’04 ’05 ’06 ’07 ’08
Estimated 計画値�
�� Residential 家庭用�
�� Commercial 商業用�
�� Industrial 工業用�
�� Other その他�
�� Wholesale 卸供給�
Gas Sales Breakdown by Sector(As of March 1982)
ガス販売量内訳(1982/3)
Gas Sales Breakdown by Sector (As of March 2003)
ガス販売量内訳(2003/3)
(Million m3/百万m3, 46.047MJ/m3)
At March 31 各3月31日時点 1994 1995 1996 1997 1998 1999 2000 2001 2002 2003 2004 2005 2006 2007 2008
Gas Sales Volume ガス販売量
Residential 家庭用 2,937 2,779 2,933 2,946 2,903 2,953 2,994 3,120 3,073 3,254 3,250 3,299 3,341 3,379 3,417
Commercial 商業用 1,135 1,225 1,298 1,338 1,387 1,454 1,517 1,593 1,593 1,737 1,780 1,821 1,851 1,887 1,922
Industrial 工業用 1,975 2,084 2,263 2,368 2,438 2,386 2,431 2,538 2,912 3,599 3,657 4,041 4,247 4,569 4,720
Other その他 381 438 469 484 517 565 627 687 691 767 924 948 987 1,073 1,108
Wholesale 卸供給 502 564 661 717 750 800 849 933 951 1,107 1,102 1,162 1,218 1,282 1,319
Total 合 計 6,930 7,090 7,624 7,853 7,995 8,158 8,418 8,872 9,219 10,464 10,713 11,271 11,644 12,190 12,486
※ Other : Public and Medical その他:公用及び医療用※ Megajoules (MJ) are used as the unit consumption, calculated on the basis of 46.047MJ per cubic meter. 熱量の単位として、メガジュール(MJ)を用いており、次ページ以降も含め1m3=46.047MJで換算します。
4
Total Sales (3,270 million m3)販売合計 3,270百万m3
Total Sales (10,464 million m3)10,464百万m3
Gas Demand Data (Sales Volume) ガス需要データ(販売量)
Download

(Million m3/百万m3)
At March 31 各3月31日時点 1994 1995 1996 1997 1998 1999 2000 2001 2002 2003 2004 2005 2006 2007 2008
Large-Volume Gas Demand 大口需要動向
Large-Volume Gas Sales 販売量 — 6 1,436 2,164 2,255 2,244 2,318 2,687 3,148 3,964 4.169 4,499 4,698 5,057 5,206
Percent of Total Gas Sales 占有率 — 0.1% 18.8% 27.6% 28.2% 27.5% 27.5% 30.3% 34.1% 37.9% 38.9% 39.9% 40.3% 41.5% 41.7%
At March 31 各3月31日時点 1994 1995 1996 1997 1998 1999 2000 2001 2002 2003 2004 2005 2006 2007 2008
Power Generation Gas Demand 発電用途向け動向
Sales of Gas for Power Generation 販売量 769 916 1,018 1,101 1,167 1,230 1,259 1,336 1,784 2,497 2,597 2,861 3,023 3,199 3.263
Percent of Total Gas Sales 占有率 11.1% 12.9% 13.4% 14.0% 14.6% 15.1% 15.0% 15.1% 19.4% 23.9% 24.2% 25.4% 26.0% 26.2% 26.1%
※ Large-volume supply (annual consumption of 2 million cubic meters or more) was deregulated in March 1995. In November 1999, this was expanded to include consumption of 1 million cubic meters or more per year.大口供給(年間ガス消費量200万m3以上)は1995年3月より自由化されました。さらに1999年11月より年間ガス消費量が100万m3以上の需要家に対象が拡大されました。
※ Estimates for the years ending March 31, 2004 and after are based on the current standard (consumption of 1 million cubic meters or more per year).なお、2004年3月期以降の見通しは、現行の基準(年間ガス消費量100万m3以上)に基づいて想定したものです。
’94 ’95 ’96 ’97 ’98 ’99 ’00 ’01 ’02 ’03 ’04 ’05 ’06 ’07 ’080
2,500
5,000
7,500
10,000
12,500
Estimated 計画値�
Large-Volume Gas Sales (Deregulated)大口向け販売量(自由化対象)�
Smaller-Volume Gas Sales (Regulated)大口向け以外の販売量(規制分野)�
��
�� �
Sales for Power Generation in Total Gas Sales全販売量に占める発電用途向け販売量(Million m3/百万m3)
’94 ’95 ’96 ’97 ’98 ’99 ’00 ’01 ’02 ’03 ’04 ’05 ’06 ’07 ’080
2,500
5,000
7,500
10,000
12,500
Estimated 計画値�
Sales of Gas for Power Generation発電用途向け販売量�
Sales of Gas for Uses other than Power Generation発電用途向け以外の販売量�
�� �
�� �
5
Sales to Large-Volume Consumers in Total Gas Sales全販売量に占める大口需要家向け販売量(Million m3/百万m3)
Download

6
(Thousands/千件)
At March 31 各3月31日時点 1994 1995 1996 1997 1998 1999 2000 2001 2002 2003 2004 2005 2006 2007 2008
Gas Customers 需要家件数
Residential 家庭用 7,229 7,380 7,540 7,686 7,841 7,975 8,112 8,273 8,445 8,637 — — — — —
Commercial 商業用 512 512 515 518 516 511 505 500 497 502 — — — — —
Industrial 工業用 25 25 25 25 25 25 25 25 25 25 — — — — —
Other その他 63 63 66 68 69 72 73 75 77 80 — — — — —
Total 合 計 7,829 7,981 8,146 8,297 8,451 8,583 8,715 8,872 9,044 9,244 9,397 9,550 9,692 9,831 9,965
Large-Volume Gas Demand 大口需要動向 (Number of customers/件)
Customers 期末件数 — 9 228 235 249 245 318 476 493 531 — — — — —
※ Large-volume supply (annual consumption of 2 million cubic meters or more) was deregulated in March 1995. In November 1999, this was expanded to include consumption of 1 million cubic meters or more per year.大口供給(年間ガス消費量200万m3以上)は1995年3月より自由化されました。さらに1999年11月より年間ガス消費量が100万m3以上の需要家に対象が拡大されました。
Customers 需要家件数(Thousands/千件)
’94 ’95 ’96 ’97 ’98 ’98 ’00 ’01 ’02 ’03 ’04 ’05 ’06 ’07 ’080
6,000
7,000
8,000
9,000
10,000
Estimated 計画値�
Large-Volume Customers 大口需要家件数(Number of customers/件)
0
100
200
300
400
500
600
’95 ’96 ’97 ’98 ’99 ’00 ’01 ’02 ’03
Gas Demand Data (Customers) ガス需要データ(需要家件数)
Download

7
(Million m3/百万m3)
At March 31 各3月31日時点 1994 1995 1996 1997 1998 1999 2000 2001 2002 2003 Composition構成比
Commercial Use 商業用Company/Office 会社・事務所 297 381 425 416 416 427 444 467 464 494 28.4%Wholesale/Retail Sale 卸売・小売 157 68 70 73 69 67 68 71 65 73 4.2%Department Store/Large-Scale Commercial Facility百貨店・大規模商用施設 88 75 77 83 102 118 125 141 143 296 17.0%Restaurant 料理飲食 370 385 392 415 413 422 432 445 412 461 26.5%Lodge/Hotel 旅館・ホテル 112 124 136 142 143 153 165 169 159 173 10.0%Beauty Salon 理美容 22 21 22 23 22 23 23 24 22 27 1.6%Amusement Place 娯楽場 10 33 35 38 46 52 55 58 49 56 3.2%Laundry クリーニング 24 24 25 27 27 28 28 29 28 31 1.8%Other その他 55 114 116 121 149 164 177 189 251 126 7.3%Total 合計 1,135 1,225 1,298 1,338 1,387 1,454 1,517 1,593 1,593 1,737 100.0%
Industrial Use 工業用Steel 鉄 鋼 102 143 165 173 156 136 139 155 188 169 4.7%Nonferrous Metal 非鉄金属 28 29 32 37 31 29 28 31 30 31 0.9%Machinery Metal 機械金属 355 363 372 354 368 370 360 386 387 426 11.8%Ceramics 窯 業 81 83 90 94 100 93 87 95 106 118 3.3%Chemicals 化 学 321 342 363 387 455 466 502 524 512 585 16.2%Food 食 品 362 364 400 421 426 431 455 468 476 508 14.1%Textiles 繊 維 16 16 16 17 14 11 10 11 11 10 0.3%Printing 製 紙 229 249 301 308 305 293 301 305 293 310 8.6%Power Generation 発 電 249 290 305 302 282 278 245 259 617 1,240 34.5%Other その他 232 205 219 275 301 279 304 304 292 202 5.6%Total 合 計 1,975 2,084 2,263 2,368 2,438 2,386 2,431 2,538 2,912 3,599 100.0%
’94
Other その他
Laundry クリーニング
Amusement Place 娯楽場
Beauty Salon 理美容
Lodge/Hotel 旅館・ホテル
Restaurant 料理飲食
Department Store/Large-Scale Commercial Facility 百貨店・大規模商用施設
Wholesale/Retail Sale 卸売・小売
Company/Office 会社・事務所
0
400
800
1,200
1,600
2,000
’95 ’96 ’97 ’98 ’99 ’00 ’01 ’02 ’03
Other その他
Power Generation 発電
Printing 製紙
Textiles 繊維
Food 食品
Chemicals 化学�
Ceramics 窯業
Machinery Metal 機械金属�
Nonferrous Metal 非鉄金属�
Steel 鉄鋼
0
800
1,600
2,400
3,200
4,000
’94 ’95 ’96 ’97 ’98 ’99 ’00 ’01 ’02 ’03
Gas Sales Breakdown (Commercial Use) 業種別ガス販売量(商業用)(Million m3/百万m3)
Gas Sales Breakdown (Industrial Use) 業種別ガス販売量(工業用)(Million m3/百万m3)
Gas Demand Data (Gas Sales Breakdown) ガス需要データ(業種別販売量)
Download

8
At March 31 各3月31日時点 1994 1995 1996 1997 1998 1999 2000 2001 2002 2003 2004 2005 2006 2007 2008
Cogeneration Equipment Capacity(Thousands of kW)
コージェネレーション・ストック量(千kW)Industrial Use 産業用 278 297 368 442 466 510 521 568 598 650 687 792 904 969 1,016
Commercial Use 民生用 63 77 89 106 128 144 161 193 208 244 271 291 308 321 334
At March 31 各3月31日時点 1994 1995 1996 1997 1998 1999 2000 2001 2002 2003 2004 2005 2006 2007 2008
Gas Sales Volume for Cogeneration(Million m3)
コージェネレーション用ガス販売量(百万m3)
Industrial Use 産業用 463 558 633 704 770 822 869 903 959 998 1,033 1,167 1,312 1,383 1,426
Commercial Use 民生用 57 69 80 95 115 130 145 174 195 220 256 244 261 274 287
At March 31 各3月31日時点 1994 1995 1996 1997 1998 1999 2000 2001 2002 2003 2004 2005 2006 2007 2008
Cogeneration System Customers(Number of customers)
コージェネレーション販売件数
Industrial Use 産業用 85 91 106 116 123 133 139 150 166 168 215 277 323 349 377
Commercial Use 民生用 119 137 155 171 187 207 239 282 328 394 546 660 779 901 1,033
�� Industrial Use 産業用��� Commercial Use 民生用�
Estimated 計画値�
’08’07’06’05’04’03’02’01’00’99’98’97’96’95’94
1,200
1,000
800
600
400
200
0
Cogeneration Equipment Capacityコージェネレーション・ストック量(Thousands of kW/千kW)
�� Industrial Use 産業用��� Commercial Use 民生用�
Estimated 計画値�
’08’07’06’05’04’03’02’01’00’99’98’97’96’95’940
300
600
900
1,200
1,500
Gas Sales Volume for Cogenerationコージェネレーション用ガス販売量(Million m3/百万m3)
�� Industrial Use 産業用��� Commercial Use 民生用�
Estimated 計画値�
’08’07’06’05’04’03’02’01’00’99’98’97’96’95’940
200
400
600
800
1,000
1,200
Cogeneration System Customersコージェネレーション販売件数(Number of customers/件)
Automobile/Transportation自動車・輸送�
Food 食品�
Other その他�
Pulp and Paper紙・パルプ�
Pharmaceutical/Chemicals製薬・化学�Electrical Equipment
電気機器�
Water andSewerage上下水道・焼却場�
Hospital/MedicalServices病院・医療�
Office 事務所�
District Heating & Cooling地域冷暖房�
Commercial Use 民生用ストック量�
Industrial Use 産業用ストック量�
Shop 店鋪�Building Complex複合ビル�
School 学校�
Assembly/Exhibition集会・展示場�
Hotel ホテル�
Other その他�
20.4%15.8%
9.6%
8.7%
4.4%16.2%
24.9%
19.1%
16.0%
12.6%
14.3%
12.1%
5.4%
3.0%
14.5%
3.0%
Cogeneration System Breakdown, by Use(As of March 2003)コージェネレーションの用途別内訳 (2003/3)
Gas Demand Data (Cogeneration/Air-Conditioning) ガス需要データ(コージェネレーション・空調)
Download

9
At March 31 各3月31日時点 1994 1995 1996 1997 1998 1999 2000 2001 2002 2003 2004 2005 2006 2007 2008
Gas Air-Conditioning System Capacity(Thousands of kW)
ガス空調のストック量(千kW)Absorption type 吸収式 1,642 1,801 1,941 2,090 2,193 2,275 2,405 2,506 2,570 2,718 2,797 2,905 3,007 3,107 3,193Gas engine heat pump GHP 191 232 276 325 373 435 499 576 636 739 786 857 925 992 1,049
At March 31 各3月31日時点 1994 1995 1996 1997 1998 1999 2000 2001 2002 2003 2004 2005 2006 2007 2008
Gas Air-Conditioning System Sales Volume(Million m3)
ガス空調用販売量(百万m3)Absorption type 吸収式 460 504 543 585 614 637 674 702 720 761 783 813 842 870 894Gas engine heat pump GHP 54 65 77 91 104 122 140 161 178 207 220 240 259 278 294
At March 31 各3月31日時点 1994 1995 1996 1997 1998 1999 2000 2001 2002 2003 2004 2005 2006 2007 2008
Gas Air-Conditioning System Customers(Number of customers)
ガス空調販売件数Absorption type 吸収式 6,813 7,219 7,596 7,922 8,224 8,498 8,762 8,945 9,052 9,202 9,705 10,025 10,328 10,625 10,885Gas engine heat pump GHP 12,936 15,967 21,721 25,813 32,323 34,683 36,988 38,923 40,434 42,158 43,241 44,330 45,366 46,290 47,132
※ Stock volume is calculated into COP3.5 electric air-conditioners based on cooling installation capacity (equipment capacity) monitored by the company.ストック量は、当社で管理している冷房設備能力ベース(設備容量)をCOP3.5の電気空調機に換算したものです。
�� Absorption type 吸収式��� Gas engine heat pump ガスヒーポン�
Estimated 計画値�
’08’07’06’05’04’03’02’01’00’99’98’97’96’95’940
1,000
2,000
3,000
4,000
5,000
Gas Air-Conditioning System Capacityガス空調のストック量(Thousands of kW/千kW)
0
200
400
600
800
1,000
�� Absorption type 吸収式��� Gas engine heat pump ガスヒーポン�
Estimated 計画値�
’08’07’06’05’04’03’02’01’00’99’98’97’96’95’94
Gas Air-Conditioning System Sales Volumeガス空調用販売量(Million m3/百万m3)
0
15,000
30,000
45,000
60,000
�� Absorption type 吸収式��� Gas engine heat pump ガスヒーポン�
Estimated 計画値�
’08’07’06’05’04’03’02’01’00’99’98’97’96’95’94
Gas Air-Conditioning Systems Customersガス空調販売件数(Number of customers/件)
Regulated region�規制領域�
10020
1,000 10,000 100,000 1,000,000 10,000,000
m3/yearm3/年�
40
60
80
100
120
140
Non-regulated region�非規制領域�
Commercial商業用�
Residential家庭用�
Industrial工場用�
Large-Volume大口�
Average Gas Rates Imageガス料金標準イメージ(¥/m3 円/m3)
Download

10
(¥ millions/百万円)
Fiscal years ended March 31 3月31日に終了した1年間 1994 1995 1996 1997 1998 1999 2000 2001 2002 2003
� Consolidated 連 結
Investment Cash Flow 投資キャッシュ・フロー — — — — — △8,117 15,331 38,977 40,268 29,039
Capital Expenditures 設備投資 — — — — — 151,126 124,975 111,397 105,296 111,988
Depreciation and Amortization 減価償却費 — — — — — 143,009 140,306 150,374 145,564 141,027
Number of Employees 従業員数(人) — — 18,183 17,873 17,475 17,204 16,685 16,307 15,973 15,673
� Nonconsolidated 単 独
Investment Cash Flow 投資キャッシュ・フロー △56,909 △57,248 △56,045 △39,250 △46,251 △15,238 3,664 26,439 26,951 20,867
Capital Expenditures 設備投資 161,203 157,997 161,994 147,464 147,105 134,309 113,091 100,685 92,555 93,770
Depreciation and Amortization 減価償却費 104,294 100,749 105,949 108,214 100,854 119,071 116,755 127,124 119,506 114,637
Number of Employees 従業員数(人) — — 13,893 13,578 13,224 12,933 12,661 12,339 11,967 11,338
� Investment Cash Flow = Depreciation and Amortization – Capital Expenditures 投資キャッシュ・フロー=減価償却費-設備投資減価償却費には長期前払費用償却費を含んでおります。
※ “Employees” refers to permanent full-time staff and does not include part-time workers. 従業員数は常勤の就業人員数を記載しており、出向者および臨時従業員を含みません。※ The Company began disclosing the above consolidated figures in the fiscal year ended March 31, 2000. Where possible, consolidated figures for the previous fiscal years have also been calculated.上記データの連結開示は2000 年3月期より行っており、1999年3月期以前のデータは可能な範囲で掲載しております。
’03’02’01’00’99’98’97’96’95’94-60
-40
-20
0
20
40
Investment Cash Flow投資キャッシュ・フロー(¥ billions/十億円)
’03’02’01’00’99’98’97’96’95’940
60
120
180
Depreciation and Amortization減価償却費(¥ billions/十億円)
0
70
140
210
’03’02’01’00’99’98’97’96’95’94
Capital Expenditures設備投資額(¥ billions/十億円)
0
5
10
15
20
’96 ’97 ’98 ’99 ’00 ’01 ’02 ’03
Number of Employees従業員数(Thousands/千人)
Consolidated 連 結 Nonconsolidated 単 独
Capital Expenditures, Depreciation and Amortization, Number of Employees and Others 設備投資、減価償却費、従業員数その他
Download

11
Fiscal years ended March 31 3月31日に終了した1年間 (¥ millions/百万円)
1994 1995 1996 1997 1998 1999 2000 2001 2002 2003 2004 2005 2006 2007 2008
Capital Expenditures Breakdown (Nonconsolidated)設備投資の内訳(単独)
Production Facilities 製造設備 50,236 51,344 63,163 45,789 41,976 27,894 15,699 10,175 8,037 7,640 5,510 4,511 5,049 5,086 4,896
Distribution Facilities 供給設備 87,343 85,358 82,038 86,200 80,855 81,559 80,914 77,428 70,644 71,659 70,174 65,156 63,705 58,254 56,184
Service and Maintenance Facilities 業務設備 18,448 18,734 14,755 12,430 13,031 15,703 10,387 10,553 11,669 13,561 19,135 18,114 12,854 12,803 11,956
Incidental Facilities 付帯事業設備 5,174 2,560 2,036 3,044 11,242 9,152 6,091 2,529 2,203 909 703 345 324 222 137
Total 設備投資額合計 161,203 157,997 161,994 147,464 147,105 134,309 113,091 100,685 92,555 93,770 95,523 88,126 81,932 76,365 73,173
At March 31 3月31日時点 1994 1995 1996 1997 1998 1999 2000 2001 2002 2003
Gas Production Capacity (1,000m3/day) 製造能力(千m3/日) 38,961 42,260 45,553 48,846 50,543 56,073 56,073 60,952 60,316 60,316
Gas Pipeline Total Length (km) 導管総延長(km) 43,755 44,315 44,904 45,568 46,117 46,704 47,269 47,908 48,646 49,431
※ Gas Production Capacity = Gas Vaporization Capacity製造能力=常用ガス発生設備能力
’94 ’95 ’96 ’97 ’98 ’99 ’00 ’01 ’02 ’03 ’04 ’05 ’06 ’07 ’080
40,000
80,000
120,000
160,000
200,000�� Production Facilities 製造設備��� Distribution Facilities 供給設備��� Service and Maintenance Facilities 業務設備��� Incidental Facilities 付帯事業設備�
Estimated 計画値�
Capital Expenditures Breakdown (Nonconsolidated)設備投資の内訳(単独)(¥ millions/百万円)
’940
15,500
31,000
46,500
62,000
’95 ’96 ’97 ’98 ’99 ’00 ’01 ’02 ’03
Gas Production Capacity製造能力(1,000m3/day 千m3/日)
’94 ’95 ’96 ’97 ’98 ’99 ’00 ’01 ’02 ’030
42,000
44,000
46,000
48,000
50,000
Gas Pipeline Total Length導管総延長(km)
Download
12
(¥ millions/百万円)
At March 31 各3月31日時点 1994 1995 1996 1997 1998 1999 2000 2001 2002 2003
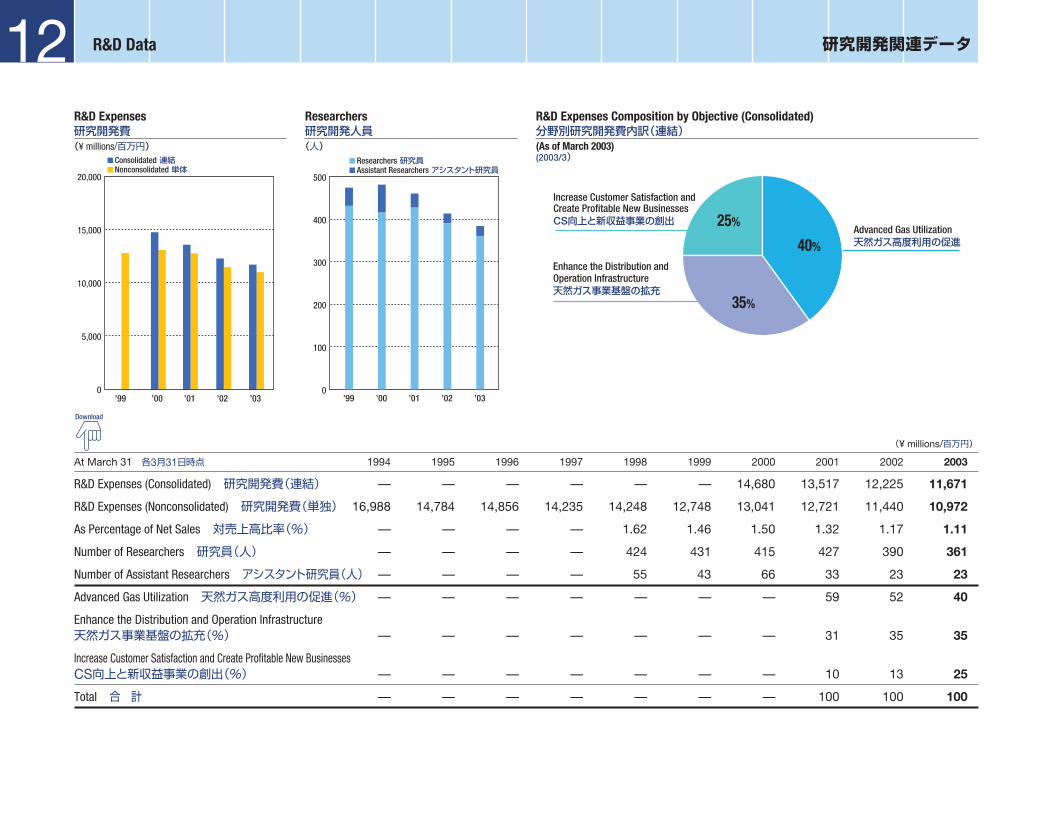
R&D Expenses (Consolidated) 研究開発費(連結) — — — — — — 14,680 13,517 12,225 11,671
R&D Expenses (Nonconsolidated) 研究開発費(単独) 16,988 14,784 14,856 14,235 14,248 12,748 13,041 12,721 11,440 10,972
As Percentage of Net Sales 対売上高比率(%) — — — — 1.62 1.46 1.50 1.32 1.17 1.11
Number of Researchers 研究員(人) — — — — 424 431 415 427 390 361
Number of Assistant Researchers アシスタント研究員(人) — — — — 55 43 66 33 23 23
Advanced Gas Utilization 天然ガス高度利用の促進(%) — — — — — — — 59 52 40
Enhance the Distribution and Operation Infrastructure天然ガス事業基盤の拡充(%) — — — — — — — 31 35 35
Increase Customer Satisfaction and Create Profitable New BusinessesCS向上と新収益事業の創出(%) — — — — — — — 10 13 25
Total 合 計 — — — — — — — 100 100 100
0
5,000
10,000
15,000
20,000
� Consolidated 連結�� Nonconsolidated 単体�
’99 ’00 ’01 ’02 ’03
R&D Expenses研究開発費(¥ millions/百万円)
0
100
200
300
400
500
’99 ’00 ’01 ’02 ’03
� Researchers 研究員�� Assistant Researchers アシスタント研究員�
Researchers研究開発人員(人)
Enhance the Distribution andOperation Infrastructure�天然ガス事業基盤の拡充�
Advanced Gas Utilization�天然ガス高度利用の促進�40%
35%
25%
Increase Customer Satisfaction andCreate Profitable New Businesses�CS向上と新収益事業の創出�
R&D Expenses Composition by Objective (Consolidated)分野別研究開発費内訳(連結)(As of March 2003)(2003/3)
R&D Data 研究開発関連データ
Download

13
(¥ millions/百万円)
Fiscal years ended March 31 3月31日に終了した1年間 1999 2000 2001 2002 2003
CONSOLIDATED 連 結
Gas Net Sales 売上高 674,996 672,069 740,731 750,438 792,453ガス部門 Operating Income 営業利益 156,098 141,383 149,946 149,209 160,223
Gas Appliances Net Sales 売上高 133,925 127,916 146,516 149,203 142,635ガス器具部門 Operating Income 営業利益 △699 2,777 6,627 7,243 7,841Related Construction Net Sales 売上高 68,817 68,651 71,907 71,337 70,568受注工事部門 Operating Income 営業利益 582 1,951 3,955 3,649 4,174
Real Estate Rental Net Sales 売上高 37,616 37,841 37,601 37,551 36,346建物賃貸部門 Operating Income 営業利益 8,789 8,254 8,085 6,091 7,623
Other Net Sales 売上高 155,044 158,819 159,577 156,011 158,326その他 Operating Income 営業利益 9,023 11,496 10,127 10,799 9,626
Total Net Sales 売上高 1,070,400 1,065,299 1,156,333 1,164,541 1,200,330合 計 Operating Income 営業利益 173,794 165,864 178,742 176,992 189,489
Elimination or corporate Net Sales 売上高 △72,633 △73,044 △69,563 △66,952 △72,696消去又は全社 Operating Income 営業利益 △101,491 △96,630 △75,083 △66,384 △66,195
’99 ’00 ’01 ’02 ’030
200
400
600
800
� Net Sales 売上高�� Operating Income 営業利益�
Gas ガ ス(¥ billions/十億円)
’99 ’00 ’01 ’02 ’030
60
120
180
� Net Sales 売上高�� Operating Income 営業利益�
Gas Appliances ガス器具(¥ billions/十億円)
’99 ’00 ’01 ’02 ’030
30
60
90
� Net Sales 売上高�� Operating Income 営業利益�
Related Construction 受注工事(¥ billions/十億円)
’99 ’00 ’01 ’02 ’030
20
40
60
� Net Sales 売上高�� Operating Income 営業利益�
Real Estate Rental 建物賃貸(¥ billions/十億円)
Financial Data (Segment Information) 財務データ(セグメント情報)
Download

14
(¥ millions/百万円)
Fiscal years ended March 31 3月31日に終了した1年間 1994 1995 1996 1997 1998 1999 2000 2001 2002 2003
� CONSOLIDATED 連 結
Net Sales 売上高 909,673 915,862 958,662 988,077 1,009,154 997,766 992,255 1,086,770 1,097,589 1,127,633
Operating Income 営業利益 59,262 60,105 67,108 62,163 76,484 72,302 69,233 103,659 110,607 123,294
Ordinary Income 経常利益 40,466 30,368 37,556 33,023 36,471 42,515 43,720 66,875 80,626 91,955
Net Income 当期利益 16,173 11,071 16,761 15,432 17,240 17,764 26,698 27,595 51,911 59,201
� NONCONSOLIDATED 単 独
Net Sales 売上高 825,992 800,675 831,739 862,592 880,428 870,838 869,939 965,619 974,566 992,236
Operating Income 営業利益 47,083 44,897 50,869 45,404 60,558 57,193 51,296 85,790 92,299 100,108
Ordinary Income 経常利益 36,486 29,556 34,841 28,390 30,185 36,405 34,929 58,542 72,249 79,680
Net Income 当期利益 14,260 10,473 16,015 15,255 15,017 16,915 22,395 27,400 48,451 53,633
0
400
800
1,200
’03’02’01’00’99’98’97’96’95’94
Net Sales 売上高(¥ billions/十億円)
0
50
100
150
’03’02’01’00’99’98’97’96’95’94
Operating Income 営業利益(¥ billions/十億円)
0
20
40
60
80
100
’03’02’01’00’99’98’97’96’95’94
Ordinary Income 経常利益(¥ billions/十億円)
0
20
40
60
’03’02’01’00’99’98’97’96’95’94
Net Income 当期利益(¥ billions/十億円)
Financial Data (Profitability and Growth) 財務データ(収益性/成長性)
Download

15
(¥ millions/百万円)
Fiscal years ended March 31 3月31日に終了した1年間 1994 1995 1996 1997 1998 1999 2000 2001 2002 2003
� CONSOLIDATED 連 結
Gross Cash Flow グロス・キャッシュ・フロー — — — — — 160,773 167,004 177,969 197,475 200,228
Operating Income Ratio (%) 営業利益率(%) 6.51 6.56 7.00 6.29 7.58 7.25 6.98 9.54 10.08 10.93
Ordinary Income Ratio (%) 経常利益率(%) 4.45 3.32 3.92 3.34 3.61 4.26 4.41 6.15 7.35 8.15
Return on Sales (%) 当期利益率(%) 1.78 1.21 1.75 1.56 1.71 1.78 2.69 2.54 4.73 5.25
� NONCONSOLIDATED 単 独
Gross Cash Flow グロス・キャッシュ・フロー 118,554 111,222 121,964 123,469 115,871 135,986 139,150 154,524 167,957 168,270
Operating Income Ratio (%) 営業利益率(%) 5.70 5.61 6.12 5.26 6.88 6.57 5.90 8.88 9.47 10.09
Ordinary Income Ratio (%) 経常利益率(%) 4.42 3.69 4.19 3.29 3.43 4.18 4.02 6.06 7.41 8.03
Return on Sales (%) 当期利益率(%) 1.73 1.31 1.93 1.77 1.71 1.94 2.57 2.84 4.97 5.41
� Gross Cash Flow = Net Income + Depreciation and Amortization グロス・キャッシュ・フロー=当期利益+長期前払費用償却費+減価償却費※ Cash flows on a consolidated basis were not reported prior to the fiscal year ended March 31, 1999. 連結分のグロス・キャッシュ・フローについては99年3月期末より算出を行っております。
0
50
100
150
200
’03’02’01’00’99’98’97’96’95’94
Gross Cash Flow グロス・キャッシュ・フロー(¥ billions/十億円)
0
4
8
12
’03’02’01’00’99’98’97’96’95’94
Operating Income Ratio 営業利益率(%)
0
3
6
9
’03’02’01’00’99’98’97’96’95’94
Ordinary Income Ratio 経常利益率(%)
0
2
4
6
’03’02’01’00’99’98’97’96’95’94
Return on Sales 当期利益率(%)
Download
16
(¥ millions/百万円)
At March 31 各3月31日時点 1994 1995 1996 1997 1998 1999 2000 2001 2002 2003
� CONSOLIDATED 連 結
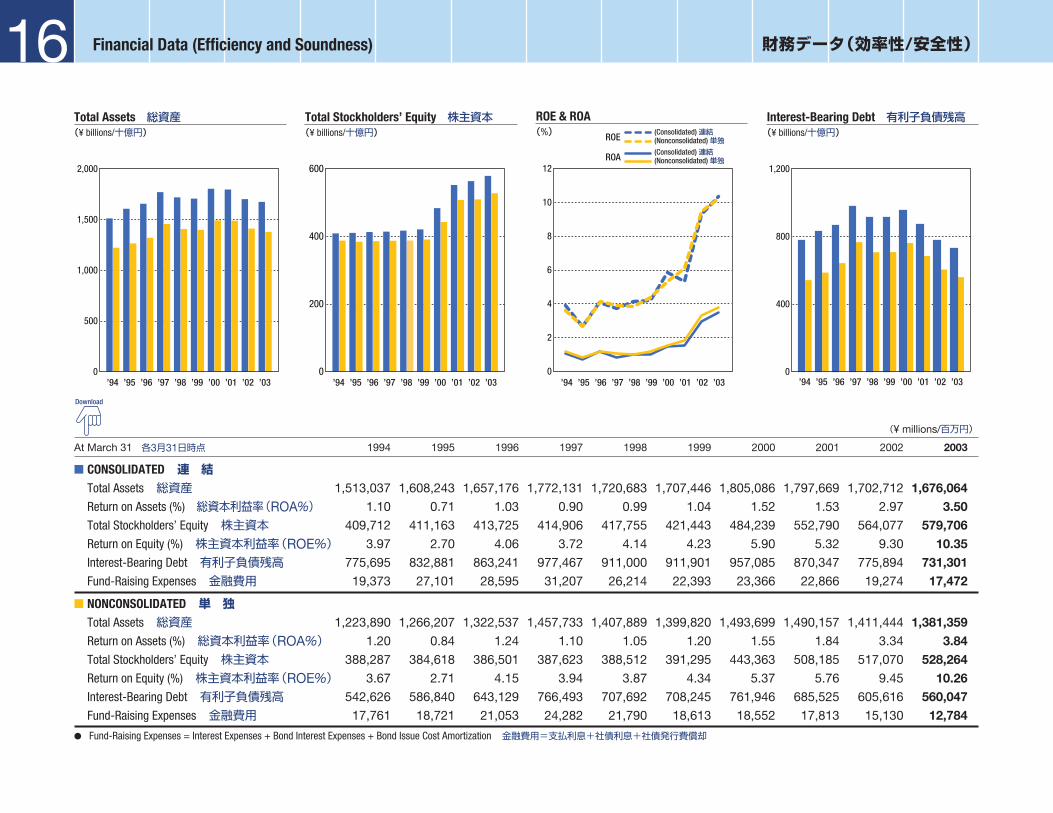
Total Assets 総資産 1,513,037 1,608,243 1,657,176 1,772,131 1,720,683 1,707,446 1,805,086 1,797,669 1,702,712 1,676,064Return on Assets (%) 総資本利益率(ROA%) 1.10 0.71 1.03 0.90 0.99 1.04 1.52 1.53 2.97 3.50Total Stockholders’ Equity 株主資本 409,712 411,163 413,725 414,906 417,755 421,443 484,239 552,790 564,077 579,706Return on Equity (%) 株主資本利益率(ROE%) 3.97 2.70 4.06 3.72 4.14 4.23 5.90 5.32 9.30 10.35Interest-Bearing Debt 有利子負債残高 775,695 832,881 863,241 977,467 911,000 911,901 957,085 870,347 775,894 731,301Fund-Raising Expenses 金融費用 19,373 27,101 28,595 31,207 26,214 22,393 23,366 22,866 19,274 17,472
� NONCONSOLIDATED 単 独
Total Assets 総資産 1,223,890 1,266,207 1,322,537 1,457,733 1,407,889 1,399,820 1,493,699 1,490,157 1,411,444 1,381,359Return on Assets (%) 総資本利益率(ROA%) 1.20 0.84 1.24 1.10 1.05 1.20 1.55 1.84 3.34 3.84Total Stockholders’ Equity 株主資本 388,287 384,618 386,501 387,623 388,512 391,295 443,363 508,185 517,070 528,264Return on Equity (%) 株主資本利益率(ROE%) 3.67 2.71 4.15 3.94 3.87 4.34 5.37 5.76 9.45 10.26Interest-Bearing Debt 有利子負債残高 542,626 586,840 643,129 766,493 707,692 708,245 761,946 685,525 605,616 560,047Fund-Raising Expenses 金融費用 17,761 18,721 21,053 24,282 21,790 18,613 18,552 17,813 15,130 12,784
� Fund-Raising Expenses = Interest Expenses + Bond Interest Expenses + Bond Issue Cost Amortization 金融費用=支払利息+社債利息+社債発行費償却
0
500
1,000
1,500
2,000
’03’02’01’00’99’98’97’96’95’94
Total Assets 総資産(¥ billions/十億円)
0
200
400
600
’03’02’01’00’99’98’97’96’95’94
Total Stockholders’ Equity 株主資本(¥ billions/十億円)
0
2
4
6
8
10
12
’03’02’01’00’99’98’97’96’95’94
ROE(Consolidated) 連結�(Nonconsolidated) 単独�
ROA(Consolidated) 連結�(Nonconsolidated) 単独�
ROE & ROA(%)
0
400
800
1,200
’03’02’01’00’99’98’97’96’95’94
Interest-Bearing Debt 有利子負債残高(¥ billions/十億円)
Financial Data (Efficiency and Soundness) 財務データ(効率性/安全性)
Download

17
At March 31 各3月31日時点 1994 1995 1996 1997 1998 1999 2000 2001 2002 2003
� CONSOLIDATED 連 結Total Assets Turnover (times) 総資本回転率(回) 0.62 0.59 0.59 0.58 0.58 0.58 0.56 0.60 0.63 0.67Equity Ratio (%) 株主資本比率(%) 27.08 25.57 24.97 23.41 24.28 24.68 26.83 30.75 33.13 34.59Current Ratio (%) 流動比率(%) 96.67 76.94 71.69 107.39 68.47 82.53 99.80 76.38 84.57 77.64Debt-Equity Ratio (times) デット・エクイティ・レシオ(倍) 1.89 2.03 2.09 2.36 2.18 2.16 1.98 1.57 1.38 1.26Interest Coverage Ratio (times) インタレスト・カバレッジ・レシオ(倍)3.19 2.31 2.41 2.05 2.98 3.29 3.02 4.59 5.79 7.12Interest Payment Ratio (%) 負債利子率(%) 2.47 3.34 3.28 3.11 2.78 2.46 2.50 2.50 2.34 2.32
� NONCONSOLIDATED 単 独Total Assets Turnover (times) 総資本回転率(回) 0.69 0.64 0.64 0.62 0.61 0.62 0.60 0.65 0.67 0.71Equity Ratio (%) 株主資本比率(%) 31.73 30.38 29.22 26.59 27.60 27.95 29.68 34.10 36.63 38.24Current Ratio (%) 流動比率(%) 97.09 80.49 88.47 137.83 78.03 99.88 115.19 79.72 93.91 81.00Debt-Equity Ratio (times) デット・エクイティ・レシオ(倍) 1.40 1.53 1.66 1.98 1.82 1.81 1.72 1.35 1.17 1.06Interest Coverage Ratio (times) インタレスト・カバレッジ・レシオ(倍)2.86 2.53 2.52 1.96 2.89 3.18 2.87 4.94 6.24 8.01Interest Payment Ratio (%) 負債利子率(%) 3.24 3.28 3.30 3.07 2.95 2.60 2.49 2.45 2.34 2.18
� Total Assets Turnover = Net Sales / Average Total Assets 総資本回転率=売上高÷総資本(期中平均)� Equity Ratio = Stockholders’ Equity (year-end) / Total Assets (year-end) x 100 株主資本比率=株主資本(期末)÷総資本(期末)×100� Current Ratio = Current Assets (year-end) / Current Liabilities (year- end) x 100 流動比率=流動資産(期末)÷流動負債(期末)×100� Debt-Equity Ratio = Interest-Bearing Debt (year-end) / Stockholders’ Equity (year-end) デット・エクイティ・レシオ=有利子負債(期末)÷株主資本(期末)� Interest Coverage Ratio = (Operating Income + Interest Income + Dividend Income) / Finance Expenses インタレスト・カバレッジ・レシオ=(営業利益+受取利息+受取配当金)÷金融費用� Interest Payment Ratio = (Interest Expenses + Bond Interest Expenses) / Interest-Bearing Debt (average) x 100 負債利子率=(支払利息+社債利息)÷有利子負債(期中平均)× 100
0.0
0.3
0.6
0.9
’03’02’01’00’99’98’97’96’95’94
Total Assets Turnover 総資本回転率(Times/回)
0
15
30
45
’03’02’01’00’99’98’97’96’95’94
Equity Ratio 株主資本比率(%)
0
50
100
150
’03’02’01’00’99’98’97’96’95’94
Current Ratio 流動比率(%)
0
2
4
6
8
10
’03’02’01’00’99’98’97’96’95’94
Interest Coverage Ratio インタレスト・カバレッジ・レシオ(Times/倍)
Download

18
(Yen/円)
At March 31 各3月31日時点 1994 1995 1996 1997 1998 1999 2000 2001 2002 2003
� CONSOLIDATED 連 結
Earnings per Share 一株当たり当期利益(EPS) 5.76 3.94 5.97 5.49 6.14 6.32 9.50 9.82 18.47 21.18
Book Value per Share 一株当たり株主資本(BPS) 145.81 146.32 147.23 147.65 148.67 149.98 172.33 196.72 200.75 208.65
Cash Flow per Share 一株当たりキャッシュ・フロー(CFPS) — — — — — 57.21 59.43 63.33 70.27 71.73
� NONCONSOLIDATED 単 独
Earnings per Share 一株当たり当期利益(EPS) 5.07 3.73 5.70 5.43 5.34 6.02 7.97 9.75 17.24 19.19
Book Value per Share 一株当たり株主資本(BPS) 138.18 136.88 137.55 137.94 138.26 139.25 157.78 180.85 184.02 189.23
Cash Flow per Share 一株当たりキャッシュ・フロー(CFPS) 42.19 39.58 43.40 43.94 41.24 48.39 49.52 54.99 59.77 60.28
Cash Dividends Paid (¥ millions) 年間配当総額(百万円) 14,050 14,050 14,050 14,050 14,050 14,050 14,050 16,860 16,859 16,672
Dividends on Equity (%) 株主資本配当率(%) 3.62 3.64 3.64 3.63 3.62 3.60 3.37 3.54 3.29 3.19
Payout Ratio (%) 配当性向(%) 98.53 134.15 87.73 92.10 93.56 83.06 62.74 61.53 34.80 31.30
� Dividends on Equity = Annual Cash Dividend / Stockholders’ Equity (average) x 100 株主資本配当率=年間配当金÷株主資本(期中平均)×100� Cash Flow per Share = (Net Income + Depreciation and Amortization) / Numbers of Issued Shares (average) 一株当たりキャッシュ・フロー=(当期利益+減価償却費+長期前払費用償却費)÷発行済株式総数(期中平均)
0
5
10
15
20
25
’03’02’01’00’99’98’97’96’95’94
Earnings per Share一株当たり当期利益(EPS)(¥/円)
0
70
140
210
’03’02’01’00’99’98’97’96’95’94
Book Value per Share一株当たり株主資本(BPS)(¥/円)
0
20
40
60
80
’03’02’01’00’99’98’97’96’95’94
Cash Flow per Share一株当たりキャッシュフロー(CFPS)(¥/円)
0
45
90
135
’03’02’01’00’99’98’97’96’95’94
Payout Ratio配当性向(%)
Financial Data (Performance Indicators) 財務データ(投資指標)
Download

19
At March 31 各3月31日時点 1994 1995 1996 1997 1998 1999 2000 2001 2002 2003
� CONSOLIDATED 連 結
Price Earnings Ratio (times) PER(倍) 89.48 96.20 64.38 56.45 47.92 45.72 23.26 34.83 17.21 17.37Price Book Value Ratio (times) PBR(倍) 3.53 2.59 2.61 2.10 1.98 1.93 1.28 1.74 1.58 1.76Price Cash Flow Ratio (times) PCFR(倍) — — — — — 5.05 3.72 5.40 4.53 5.13EV/EBITDA (times) EBITDA 倍率(倍) — — — — — 7.93 7.26 7.14 6.44 6.56
� NONCONSOLIDATED 単 独
Price Earnings Ratio (times) PER(倍) 101.48 101.69 67.38 57.10 55.01 48.01 27.73 35.07 18.44 19.18Price Book Value Ratio (times) PBR(倍) 3.73 2.77 2.79 2.25 2.13 2.08 1.40 1.89 1.73 1.94Price Cash Flow Ratio (times) PCFR(倍) 12.21 9.58 8.85 7.06 7.13 5.97 4.46 6.22 5.32 6.11EV/EBITDA (times) EBITDA 倍率(倍) 13.14 11.30 10.94 10.04 9.45 8.58 7.95 7.70 7.05 7.35Cash Dividend per Share (¥) 1株当たり配当金(円) 5.00 5.00 5.00 5.00 5.00 5.00 5.00 6.00 6.00 6.00
� PCFR = Stock Price (year-end) / CFPS� PCFR=期末株価÷CFPS� EV/EBITDA = (Market Capitalization + Interest-Bearing Debt + Minority Interest – Cash and Bank Deposits – Marketable Securities) / (Operating Income + Depreciation and Amortization)� EBITDA倍率=(株式時価総額+有利子負債残高+少数株主持分-現金預金-短期保有目的有価証券)÷(営業利益+長期前払費用償却費+減価償却費)
0
40
80
120
’03’02’01’00’99’98’97’96’95’94
Price Earnings Ratio PER(Times/倍)
0
2
4
6
’03’02’01’00’99’98’97’96’95’94
Price Book Value Ratio PBR(Times/倍)
0
6
12
18
’03’02’01’00’99’98’97’96’95’94
Price Cash Flow Ratio PCFR(Times/倍)
0
6
12
18
’03’02’01’00’99’98’97’96’95’94
EV/EBITDA EBITDA 倍率(Times/倍)
Download

20(¥ millions/百万円)
At March 31 各3月31日時点 1994 1995 1996 1997 1998 1999 2000 2001 2002 2003
ASSETS(資産の部)
Fixed assets 固定資産 1,264,228 1,362,605 1,416,859 1,435,380 1,465,828 1,461,970 1,491,020 1,517,353 1,450,814 1,411,513
Property, plant and equipment 有形固定資産 1,138,301 1,234,424 1,280,939 1,301,450 1,337,637 1,342,794 1,333,551 1,292,178 1,249,936 1,217,465
Production facilities 製造設備 142,415 128,694 148,233 144,462 127,330 314,046 286,946 285,889 262,026 244,058
Distribution facilities 供給設備 402,562 410,068 425,586 456,774 458,687 457,703 496,183 505,477 549,416 538,191
Service and maintenance facilities 業務設備 154,183 157,702 153,272 150,233 147,489 91,999 85,551 80,601 76,154 71,297
Other fixed assets その他有形固定資産 148,672 355,061 356,820 350,501 338,914 334,194 340,918 324,090 303,141 288,477
Construction in progress 建設仮勘定 290,469 182,899 197,028 199,480 265,217 144,852 123,953 96,121 59,199 75,442
Intangible assets 無形固定資産 2,954 3,236 3,432 3,902 3,861 4,171 19,819 19,251 19,196 20,609
Investments and other assets 投資等 122,972 124,945 132,487 130,027 124,330 115,004 137,648 205,923 181,681 173,438
Investment securities 投資有価証券 24,508 24,643 25,516 26,046 24,317 32,467 32,181 125,641 92,712 71,544
Investments in unconsolidated subsidiaries and affiliated companies非連結子会社及び関連会社投資 21,331 18,364 17,727 19,470 16,431 — — — — —
Long-term loans 長期貸付金 8,358 10,188 11,200 2,720 3,593 5,515 5,366 4,945 6,338 10,238
Long-term loans to unconsolidated subsidiaries and affiliated companies非連結子会社及び関連会社長期貸付金 2,097 1,035 1,000 1,400 1,050 — — — — —
Long-term period expenses 長期前払費用 57,187 61,432 68,340 71,636 69,481 — — — — —
Deferred income taxes 繰延税金資産 — — — — — — 41,559 19,359 30,083 44,306
Other investments and others その他投資ほか 10,587 10,427 9,876 9,892 10,679 78,507 59,922 57,122 54,207 49,591
Allowance for doubtful accounts 貸倒引当金 △1,096 △1,146 △1,173 △1,138 △1,223 △1,485 △1,381 △1,144 △1,660 △2,243
Current assets 流動資産 248,809 245,637 240,316 336,751 254,854 245,475 314,065 280,315 251,898 264,551
Cash and bank deposits 現金及び預金 21,130 16,618 20,403 108,136 17,895 16,927 57,926 21,509 23,040 35,672
Notes and accounts receivable 受取手形及び売掛金 84,119 102,651 108,266 112,234 118,684 114,803 125,512 127,036 128,549 132,235
Marketable securities 有価証券 1,849 2,103 2,005 1,973 1,925 3,396 2,309 — — —
Inventories たな卸資産 17,405 26,595 25,097 32,119 29,975 27,687 27,059 27,419 28,758 21,125
Deferred income taxes 繰延税金資産 — — — — — — 7,559 8,260 10,049 11,480
Other current assets and others その他の流動資産ほか 125,415 98,700 85,973 83,801 88,018 84,162 95,202 97,188 62,431 65,484
Allowance for doubtful accounts 貸倒引当金 △1,109 △1,030 △1,428 △1,512 △1,643 △1,501 △1,504 △1,098 △932 △1,448
Total assets 資産合計 1,513,037 1,608,243 1,657,176 1,772,131 1,720,683 1,707,446 1,805,086 1,797,669 1,702,712 1,676,064
※ Some items in the accompanying financial statements have been summarized to preserve simplicity. Such changes are unaudited. 上記の財務諸表については、各勘定科目の要約に当たっての監査は受けておりません。
Ten-Year Consolidated Balance Sheets 連結貸借対象表(10年分)
Download

21(¥ millions/百万円)
At March 31 各3月31日時点 1994 1995 1996 1997 1998 1999 2000 2001 2002 2003
LIABILITIES(負債の部)
Non-current liabilities 固定負債 845,045 874,845 905,146 1,040,181 927,237 985,438 1,002,529 874,231 836,977 751,572
Straight bonds 社 債 133,495 163,495 210,628 240,628 158,943 198,943 258,943 248,843 253,233 257,633
Convertible bonds 転換社債 297,140 297,140 297,140 397,136 397,132 397,131 355,334 245,445 235,693 182,814
Long-term debt 長期借入金 291,345 263,887 235,408 240,909 208,728 224,678 229,357 214,040 191,960 157,875
Reserve for employee retirement allowances退職給与引当金 97,818 101,676 103,762 104,507 105,283 105,722 106,392 — — —
Reserve for employee retirement benefits退職給付引当金 — — — — — — — 134,215 125,554 120,896
Other non-current liabilities and othersその他固定負債ほか 25,247 48,647 58,208 57,001 57,151 58,964 52,503 31,688 30,537 32,354
Current liabilities 流動負債 257,369 319,261 335,205 313,590 372,220 297,444 314,697 366,990 297,861 340,746
Non-current liabilities due within one year1年以内期限到来の固定負債 22,707 42,553 81,007 22,939 96,887 — 71,959 122,032 40,443 91,239
Notes and accounts payable 支払手形及び買掛金 23,735 33,143 38,287 45,284 52,930 54,002 39,284 43,285 38,055 37,676
Bank loans 短期借入金 30,152 61,578 32,901 69,598 41,248 52,693 41,641 39,921 42,709 41,900
Income taxes payable 未払法人税等 17,084 20,712 21,300 16,296 18,172 24,624 19,885 27,721 33,663 41,221
Other current liabilities and others その他流動負債ほか 163,691 161,275 161,710 159,473 162,983 166,125 141,928 134,031 142,991 128,710
Total liabilities 負債合計 1,103,325 1,197,080 1,243,450 1,357,225 1,302,928 1,282,883 1,317,227 1,241,222 1,134,838 1,092,319
Minority interest 少数株主持分 909 2,972 3,098 3,453 3,471 3,120 3,619 3,656 3,796 4.039
Stockholders’ equity(資本の部)
Common stock 資本金 141,812 141,812 141,812 141,814 141,816 141,817 141,817 141,817 141,843 141,844
Capital surplus 資本剰余金 2,034 2,034 2,034 2,036 2,038 2,038 2,038 2,038 2,064 2,065
Legal reserve 利益準備金 30,172 31,744 33,203 34,658 36,117 — — — — —
Retained earnings and others 利益剰余金ほか 235,694 235,574 236,680 236,400 237,788 277,590 340,387 353,796 387,430 429,657
Net unrealized gain on securities 評価差額金 — — — — — — — 55,139 32,835 17,002
Treasury stock 自己株式 △8 △1 △4 △2 △4 △2 △3 △2 △95 △10,862
Total stockholders’ equity 資本合計 409,712 411,163 413,725 414,906 417,755 421,443 484,239 552,790 564,077 579,706
Total liabilities, minority interests and stockholders’ equity負債、少数株主持分及び資本合計 1,513,037 1,608,243 1,657,176 1,772,131 1,720,683 1,707,446 1,805,086 1,797,669 1,702,712 1,676,064
※ Due to the revision of regulations for consolidated financial statements, “Capital reserve” is presented as “Capital surplus” and “Consolidated retained earnings” is presented as “Retained earnings” beginning in the year ended March 31, 2003連結財務諸表法の改正により、2003年3月期から「資本準備金」は「資本剰余金」、「連結剰余金」は「利益剰余金」として表示しております。
Download

22(¥ millions/百万円)
Fiscal years ended March 31 3月31日に終了した1年間 1994 1995 1996 1997 1998 1999 2000 2001 2002 2003
Net sales 売上高 909,673 915,862 958,662 988,077 1,009,154 997,766 992,255 1,086,770 1,097,589 1,127,633
Cost of sales 売上原価 437,514 433,918 461,964 498,548 490,693 477,283 483,813 561,006 561,988 571,929
Gross profit 売上総利益 472,158 481,943 496,697 489,528 518,461 520,483 508,441 525,764 535,600 555,704
Selling, general and administrative expenses供給販売費及び一般管理費 412,895 421,838 429,589 427,365 441,977 448,181 439,208 422,105 424,992 432,409
Selling expenses 供給販売費 325,362 329,836 340,596 339,500 352,269 350,068 344,675 348,624 353,977 359,999
General and administrative expenses 一般管理費 87,532 92,001 88,991 87,863 89,706 98,111 94,532 73,480 71,015 72,409
Operating income 営業利益 59,262 60,105 67,108 62,163 76,484 72,302 69,233 103,659 110,607 123,294
Non-operating income 営業外収益 8,625 7,513 9,170 14,041 6,860 7,877 10,202 8,372 7,605 7,441
Interest income 受取利息 1,049 1,285 578 542 261 182 210 205 187 239
Dividend income 受取配当金 1,576 1,271 1,291 1,308 1,279 1,182 1,072 1,190 833 849
Equity in net income of an affiliated company持分法による投資利益 — — — — — — 392 348 310 220
Exchange gains 為替差益 — — — — — 1,381 2,636 — — —
Miscellaneous revenue and others 雑収入ほか 6,000 4,957 7,301 12,191 5,320 5,129 5,890 6,629 6,275 6,133
Non-operating expenses 営業外費用 27,422 37,249 38,722 43,182 46,873 37,664 35,716 45,156 37,586 38,780
Interest expenses 支払利息 7,086 13,962 13,095 12,197 8,977 22,393 23,366 22,866 19,274 17,472
Bond interest expenses 社債利息 11,141 12,940 14,726 16,401 17,237 — — — — —
Bond issue cost amortization 社債発行費償却 1,146 199 774 2,609 — — — — — —
Adjustments of charges for construction of distribution facilities他受工事精算差額 5,250 7,226 6,978 6,742 7,266 8,546 7,837 6,271 6,827 4,648
Miscellaneous expenditure and others 雑支出ほか 2,799 2,922 3,149 5,233 13,393 6,724 4,512 16,019 11,485 16,660
Ordinary income 経常利益 40,466 30,368 37,556 33,023 36,471 42,515 43,720 66,875 80,626 91,955
Extraordinary income 特別利益 151 2,582 2,588 873 924 750 514 163 4,200 8,699
Extraordinary expenses 特別損失 150 92 670 1,295 1,134 2,302 496 21,953 1,965 4,771
Income before income taxes 税金等調整前当期純利益 40,466 32,858 39,473 32,601 36,260 40,964 43,738 45,084 82,861 95,882
Income taxes 法人税等 24,234 21,568 22,524 17,095 18,940 23,498 16,064 25,436 31,507 43,621
Income taxes-deferred 法人税等調整額 — — — — — — 713 △8,026 △741 △7,244
Minority interest in net income and loss of consolidated subsidiaries少数株主損益 59 218 187 73 78 △298 261 80 184 304
Net income 当期純利益 16,173 11,071 16,761 15,432 17,240 17,764 26,698 27,595 51,911 59,201
※ Some items in the accompanying financial statements have been summarized to preserve simplicity. Such changes are unaudited. 上記の財務諸表については、各勘定科目の要約に当たっての監査は受けておりません。
Ten-Year Consolidated Statements of Income 連結損益計算書(10年分)
Download

23(¥ millions/百万円)
Fiscal years ended March 31 3月31日に終了した1年間 2001 2002 2003
1. Cash flows from operating activities: 営業活動によるキャッシュ・フローIncome before income taxes and minority interest in net income of consolidated subsidiaries 税金等調整前当期純利益 45,084 82,861 95,882Depreciation 減価償却費 146,419 141,646 137,299Amortization of long-term prepayments 長期前払費用償却費 3,955 3,917 3,727Loss on disposals of property, plant and equipment 有形固定資産除却損 3,348 3,576 2,481Loss on bond redemption 社債償還損 3,368 4,618 6,327Increase (Decrease) in employees’ severance and retirement benefits 退職給付引当金の増加および(減少) 6,462 △8,661 △4,658Interest and dividend income 受取利息および配当金 △1,395 △1,020 △1,088Interest expense 支払利息 22,866 19,274 17,472Increase in notes and accounts receivable 売上債権の増加 △149 △217 △6,777Decrease (Increase) in inventories たな卸資産の減少(増加) △359 △1,339 7,633Decrease in notes and accounts payable 仕入債務の減少 △1,673 △3,674 △1,784Increase (Decrease) in consumption taxes payable 未払消費税等の増加(減少) △4,561 2,748 —Other その他 4,106 △8,243 10,426
Subtotal 小 計 227,471 235,486 266,940Cash received for interest and dividends 受取利息および配当金の入金 1,465 1,089 1,166Cash paid for interest 支払利息の支払 △23,232 △19,325 △18,069Cash paid for income taxes 法人税等の支払 △18,191 △25,574 △36,504Net cash provided by operating activities 営業活動によるキャッシュ・フロー 187,512 191,675 213,532
2. Cash flows from investing activities: 投資活動によるキャッシュ・フローPurchases of marketable and investment securities 有価証券および投資有価証券の購入 △4,580 △3,711 △7,297Purchases of property, plant and equipment 有形固定資産の取得による支出 △103,609 △104,883 △98,148Purchases of intangible fixed assets 無形固定資産の取得による支出 △7,599 △7,791 △9,014Expenditure of long-term prepayment 長期前払費用の支出 △1,499 △1,006 △1,799Proceeds from sale of tangible and intangible fixed assets 固定資産の売却による収入 926 2,527 6,888Other その他 515 3,044 △773
Net cash used in investing activities 投資活動によるキャッシュ・フロー △115,846 △111,820 △110,1433. Cash flows from financing activities: 財務活動によるキャッシュ・フロー
Increase (Decrease) in short-term bank loans 短期借入金の純増(減)額 △1,720 2,788 △809Increase (Decrease) in commercial paper コマーシャル・ペーパーの純増(減)額 — 12,000 △12,000Proceeds from long-term debt 社債および長期借入金による収入 59,359 45,485 37,340Repayments of long-term debt 社債および長期借入金の償還・返済 △147,968 △159,069 △75,449Cash dividends paid 配当金の支払額 △14,097 △18,236 △16,777Cash dividends paid to minority shareholders 少数株主への配当金の支払額 △49 △50 △53Purchase of treasury stock and other 自己株式の取得による支出等 — △94 △10,769
Cash provided by (used in) financing activities 財務活動によるキャッシュ・フロー △104,426 △117,176 △78,5174. Effect of exchange rate changes on cash and cash equivalents 現金および現金同等物に係る換算差額 7 6 △25. Net increase (decrease) in cash and cash equivalents 現金および現金同等物の純増(減)額 △32,752 △37,314 24,8696. Increase due to addition of consolidated subsidiaries 連結会社の増加に伴う現金および現金同等物の増加額 — — —7. Cash and cash equivalents at beginning of year 現金および現金同等物の期首残高 97,327 64,575 27,2608. Cash and cash equivalents at end of year 現金および現金同等物の期末残高 64,575 27,260 52,129
※ Some items in the accompanying financial statements have been summarized to preserve simplicity. Such changes are unaudited. 上記の財務諸表については、各勘定科目の要約に当たっての監査は受けておりません。
Three-Year Consolidated Statements of Cash Flows 連結キャッシュ・フロー計算書(3年分)
Download

24Company Straight bonds Interest rate Amount (¥ millions)会社名 普通社債 利 率 金額(百万円)
Tokyo Gas Domestic unsecured notes due 2014 5.1% 10,000東京ガス(株) 国内無担保普通社債(償還期限:2014年)Tokyo Gas Domestic unsecured notes due 2015 4.1% 9,500東京ガス(株) 国内無担保普通社債(償還期限:2015年)Tokyo Gas Domestic unsecured notes due 2016 4.0% 29,000東京ガス(株) 国内無担保普通社債(償還期限:2016年)Tokyo Gas Domestic unsecured notes due 2018 2.625% 40,000東京ガス(株) 国内無担保普通社債(償還期限:2018年)Tokyo Gas Domestic unsecured notes due 2009 1.68% 30,000東京ガス(株) 国内無担保普通社債(償還期限:2009年)Tokyo Gas Domestic unsecured notes due 2009 1.73% 30,000東京ガス(株) 国内無担保普通社債(償還期限:2009年)Tokyo Gas Domestic unsecured notes due 2010 2.01% 20,000東京ガス(株) 国内無担保普通社債(償還期限:2010年)TG Credit Service Co., Ltd. Domestic unsecured notes due 2004 1.03% 3,000ティージー・クレジットサービス(株) 国内無担保普通社債(償還期限:2004年)TG Credit Service Co., Ltd. Domestic unsecured notes due 2009 1.18% 4,000ティージー・クレジットサービス(株) 国内無担保普通社債(償還期限:2009年)Tokyo Gas Domestic unsecured notes due 2011 1.39% 30,000東京ガス(株) 国内無担保普通社債(償還期限:2011年)Tokyo Gas Domestic unsecured notes due 2012 1.35% 20,000東京ガス(株) 国内無担保普通社債(償還期限:2012年)ENERGY ADVANCE Co., Ltd. Domestic unsecured notes due 2015 4.1% 13,800エネルギーアドバンス(株) 国内無担保普通社債(償還期限:2015年)Tokyo Gas DM bearer bonds due 2005 7.0% 18,333東京ガス(株) ドイツマルク建普通社債(償還期限:2005年)Total 合 計 — 257,633
Bonds 社債明細Domestic unsecured convertible bonds Conversion prices (¥) Interest rate Amount (¥ millions)国内無担保転換社債 転換価格(円) 利 率 金額(百万円)
1st issue due 2003 1,267.90 1.5% 51,439第1回償還期限:2003年
3rd issue due 2005 1,105.70 1.5% 82,877第3回償還期限:2005年
5th issue due 2009 339 1.2% 49,969第5回償還期限:2009年
6th issue due 2007 339 1.1% 49,968第6回償還期限:2007年
Total 合 計 — — 234,253
Average interest rate Amount (¥ millions)平均利率 金額(百万円)
Long-term debt due after one year 1年超返済予定長期借入金 2.6% 157,875Long-term debt due within one year 1年以内返済予定長期借入金 2.4% 39,639Short-term bank loans 短期借入金 0.3% 41,900Total 合計 239,414
Loans and Debts 借入金明細
Amount (¥ millions) 金額(百万円)
At March 31, 2004 2004年3月期 132,978At March 31, 2005 2005年3月期 106,757At March 31, 2006 2006年3月期 45,730At March 31, 2007 2007年3月期 69,033At March 31, 2008 and thereafter 2008年3月期以降 376,802Total 合計 731,300
The annual maturities of long-term debt at March 31, 20032003年3月31日現在における社債および長期借入金の年度ごとの返済予定金額
Bank Loans, Debts and Bonds 借入金内訳
25Fiscal years ended March 31 3月31日に終了した1年間 (¥ millions/百万円)Company Business 2001 2002 2003 Common Stock Equity Interest (%)会社名 主な事業内容 資本金 当社グループ持株比率(%)
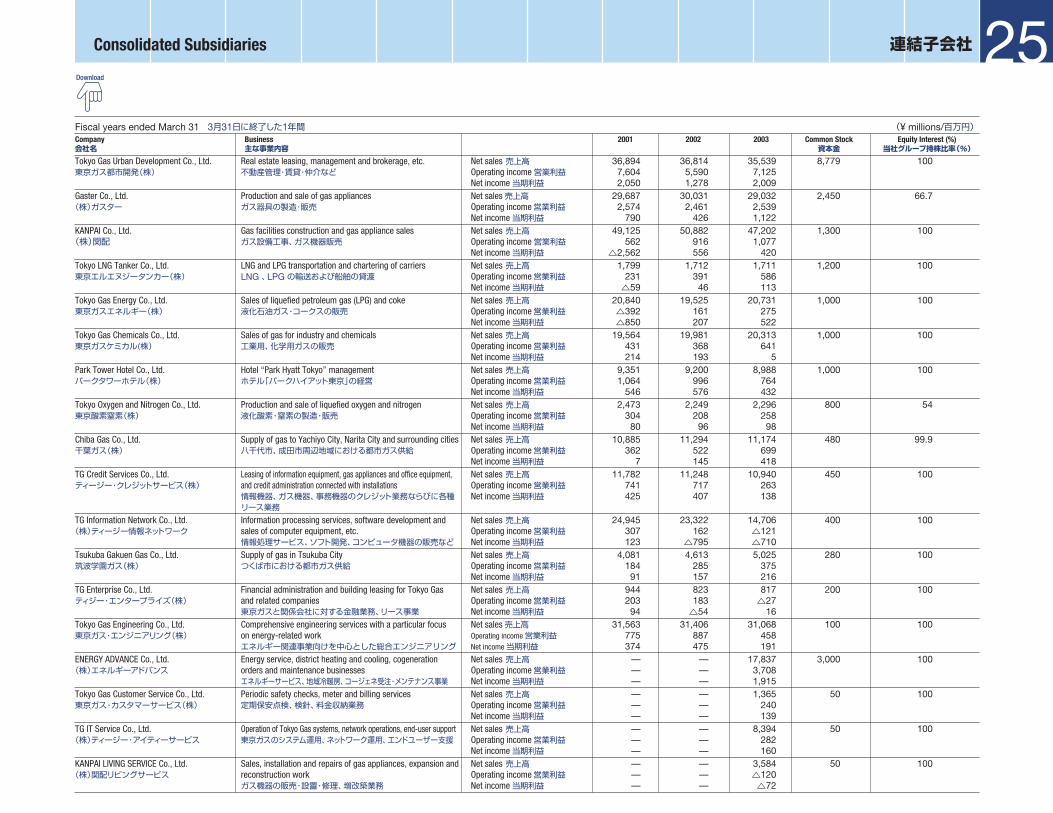
Tokyo Gas Urban Development Co., Ltd. Real estate leasing, management and brokerage, etc. Net sales 売上高 36,894 36,814 35,539 8,779 100東京ガス都市開発(株) 不動産管理・賃貸・仲介など Operating income 営業利益 7,604 5,590 7,125
Net income 当期利益 2,050 1,278 2,009Gaster Co., Ltd. Production and sale of gas appliances Net sales 売上高 29,687 30,031 29,032 2,450 66.7(株)ガスター ガス器具の製造・販売 Operating income営業利益 2,574 2,461 2,539
Net income 当期利益 790 426 1,122KANPAI Co., Ltd. Gas facilities construction and gas appliance sales Net sales 売上高 49,125 50,882 47,202 1,300 100(株)関配 ガス設備工事、ガス機器販売 Operating income 営業利益 562 916 1,077
Net income 当期利益 △2,562 556 420Tokyo LNG Tanker Co., Ltd. LNG and LPG transportation and chartering of carriers Net sales 売上高 1,799 1,712 1,711 1,200 100東京エルエヌジータンカー(株) LNG 、LPG の輸送および船舶の貸渡 Operating income営業利益 231 391 586
Net income 当期利益 △59 46 113Tokyo Gas Energy Co., Ltd. Sales of liquefied petroleum gas (LPG) and coke Net sales 売上高 20,840 19,525 20,731 1,000 100東京ガスエネルギー(株) 液化石油ガス・コークスの販売 Operating income営業利益 △392 161 275
Net income 当期利益 △850 207 522Tokyo Gas Chemicals Co., Ltd. Sales of gas for industry and chemicals Net sales 売上高 19,564 19,981 20,313 1,000 100東京ガスケミカル(株) 工業用、化学用ガスの販売 Operating income営業利益 431 368 641
Net income 当期利益 214 193 5Park Tower Hotel Co., Ltd. Hotel “Park Hyatt Tokyo” management Net sales 売上高 9,351 9,200 8,988 1,000 100パークタワーホテル(株) ホテル「パークハイアット東京」の経営 Operating income営業利益 1,064 996 764
Net income 当期利益 546 576 432Tokyo Oxygen and Nitrogen Co., Ltd. Production and sale of liquefied oxygen and nitrogen Net sales 売上高 2,473 2,249 2,296 800 54東京酸素窒素(株) 液化酸素・窒素の製造・販売 Operating income営業利益 304 208 258
Net income 当期利益 80 96 98Chiba Gas Co., Ltd. Supply of gas to Yachiyo City, Narita City and surrounding cities Net sales 売上高 10,885 11,294 11,174 480 99.9千葉ガス(株) 八千代市、成田市周辺地域における都市ガス供給 Operating income営業利益 362 522 699
Net income 当期利益 7 145 418TG Credit Services Co., Ltd. Leasing of information equipment, gas appliances and office equipment, Net sales 売上高 11,782 11,248 10,940 450 100ティージー・クレジットサービス(株) and credit administration connected with installations Operating income営業利益 741 717 263
情報機器、ガス機器、事務機器のクレジット業務ならびに各種 Net income 当期利益 425 407 138リース業務
TG Information Network Co., Ltd. Information processing services, software development and Net sales 売上高 24,945 23,322 14,706 400 100(株)ティージー情報ネットワーク sales of computer equipment, etc. Operating income営業利益 307 162 △121
情報処理サービス、ソフト開発、コンピュータ機器の販売など Net income 当期利益 123 △795 △710Tsukuba Gakuen Gas Co., Ltd. Supply of gas in Tsukuba City Net sales 売上高 4,081 4,613 5,025 280 100筑波学園ガス(株) つくば市における都市ガス供給 Operating income営業利益 184 285 375
Net income 当期利益 91 157 216TG Enterprise Co., Ltd. Financial administration and building leasing for Tokyo Gas Net sales 売上高 944 823 817 200 100ティジー・エンタープライズ(株) and related companies Operating income営業利益 203 183 △27
東京ガスと関係会社に対する金融業務、リース事業 Net income 当期利益 94 △54 16Tokyo Gas Engineering Co., Ltd. Comprehensive engineering services with a particular focus Net sales 売上高 31,563 31,406 31,068 100 100東京ガス・エンジニアリング(株) on energy-related work Operating income 営業利益 775 887 458
エネルギー関連事業向けを中心とした総合エンジニアリング Net income 当期利益 374 475 191ENERGY ADVANCE Co., Ltd. Energy service, district heating and cooling, cogeneration Net sales 売上高 — — 17,837 3,000 100(株)エネルギーアドバンス orders and maintenance businesses Operating income営業利益 — — 3,708
エネルギーサービス、地域冷暖房、コージェネ受注・メンテナンス事業 Net income 当期利益 — — 1,915Tokyo Gas Customer Service Co., Ltd. Periodic safety checks, meter and billing services Net sales 売上高 — — 1,365 50 100東京ガス・カスタマーサービス(株) 定期保安点検、検針、料金収納業務 Operating income営業利益 — — 240
Net income 当期利益 — — 139TG IT Service Co., Ltd. Operation of Tokyo Gas systems, network operations, end-user support Net sales 売上高 — — 8,394 50 100(株)ティージー・アイティーサービス 東京ガスのシステム運用、ネットワーク運用、エンドユーザー支援 Operating income営業利益 — — 282
Net income 当期利益 — — 160KANPAI LIVING SERVICE Co., Ltd. Sales, installation and repairs of gas appliances, expansion and Net sales 売上高 — — 3,584 50 100(株)関配リビングサービス reconstruction work Operating income営業利益 — — △120
ガス機器の販売・設置・修理、増改築業務 Net income 当期利益 — — △72
Consolidated Subsidiaries 連結子会社
Download

26(¥ millions/百万円)
At March 31 各3月31日時点 1994 1995 1996 1997 1998 1999 2000 2001 2002 2003
ASSETS(資産の部)
Fixed assets 固定資産 1,029,355 1,095,950 1,154,468 1,179,969 1,221,148 1,224,801 1,250,442 1,276,594 1,224,869 1,184,773
Property, plant and equipment 有形固定資産 842,399 897,654 946,050 977,167 1,023,164 1,036,476 1,029,954 1,001,844 974,169 910,530
Production facilities 製造設備 142,928 129,210 148,673 144,851 127,776 314,553 287,383 286,236 262,343 244,370
Distribution facilities 供給設備 395,610 405,088 419,727 450,061 451,248 450,812 489,415 498,295 542,492 532,098
Service and maintenance facilities 業務設備 153,040 156,097 151,678 148,613 145,400 89,292 82,930 78,049 73,889 69,044
Other fixed assets and others その他有形固定資産ほか 41,937 41,745 37,575 34,646 35,141 37,736 48,536 44,891 41,056 5,041
Construction in progress 建設仮勘定 108,884 165,514 188,397 198,996 263,599 144,083 121,690 94,373 54,389 59,977
Intangible assets 無形固定資産 1,807 1,803 1,842 1,686 1,624 1,906 16,598 15,651 15,238 16,138
Investments and other assets 投資等 185,147 196,492 206,575 201,115 196,359 186,418 203,889 259,098 235,462 258,103
Investment securities 投資有価証券 23,598 23,505 24,178 24,746 23,108 19,917 19,622 102,252 67,393 45,720
Investments in affiliated companies 関係会社投資 91,076 97,958 100,343 99,412 96,876 90,767 88,547 86,754 87,013 112,133
Long-term period expenses 長期前払費用 55,561 57,970 64,421 67,777 65,894 64,842 48,813 46,387 43,517 37,166
Deferred income taxes 繰延税金資産 — — — — — — 36,751 12,439 23,202 37,299
Other investments and others その他投資ほか 16,003 18,158 18,732 10,221 11,589 12,110 11,311 12,313 15,473 27,152
Allowance for doubtful accounts 貸倒引当金 △1,091 △1,099 △1,099 △1,041 △1,108 △1,218 △1,155 △1,047 △1,136 △1,367
Current assets 流動資産 194,534 170,257 168,068 277,763 186,740 175,018 243,257 213,562 186,575 196,585
Cash and bank deposits 現金及び預金 8,857 6,358 6,663 95,966 7,832 7,813 46,990 6,117 7,039 14,901
Notes and accounts receivable 受取手形及び売掛金 67,046 74,733 77,346 82,843 82,420 78,885 84,560 94,108 96,776 102,635
Marketable securities 未収入金 13,031 11,372 9,574 11,183 12,846 11,563 9,409 10,710 13,705 7,334
Inventories たな卸資産 16,755 21,312 20,475 27,903 24,752 22,988 22,064 22,103 23,812 15,391
Short-term loans to affiliated companies 関係会社短期貸付金 14,000 14,000 14,000 20,000 20,000 20,000 30,000 39,000 — —
Deferred income taxes 繰延税金資産 — — — — — — 6,454 6,924 8,080 9,099
Other current assets and others その他の流動資産ほか 75,712 43,194 40,754 40,691 39,685 34,512 44,709 35,486 37,824 48,034
Allowance for doubtful accounts 貸倒引当金 △867 △712 △744 △823 △795 △743 △929 △886 △661 △809
Total assets 資産合計 1,223,890 1,266,207 1,322,537 1,457,733 1,407,889 1,399,820 1,493,699 1,490,157 1,411,444 1,381,359
※ Some items in the accompanying financial statements have been summarized to preserve simplicity. Such changes are unaudited. 上記の財務諸表については、各勘定科目の要約に当たっての監査は受けておりません。
Ten-Year Nonconsolidated Balance Sheets 単独貸借対照表(10年分)
Download

27(¥ millions/百万円)
At March 31 各3月31日時点 1994 1995 1996 1997 1998 1999 2000 2001 2002 2003
LIABILITIES(負債の部)
Non-current liabilities 固定負債 635,234 670,073 746,059 868,590 780,054 833,288 839,158 714,068 695,703 610,408
Straight bonds 社 債 132,295 162,295 210,628 240,628 158,143 198,143 258,143 241,043 246,233 236,833
Convertible bonds 転換社債 297,140 297,140 297,140 397,136 397,132 397,131 355,334 245,445 235,693 182,814
Long-term debt 長期借入金 89,982 89,057 111,499 102,302 95,732 103,643 96,139 94,388 88,394 65,998
Reserve for employee retirement allowances退職給与引当金 96,396 99,327 101,247 101,848 102,544 102,500 102,451 — — —
Reserve for employee retirement benefits退職給付引当金 — — — — — — — 124,891 116,554 112,020
Other non-current liabilities and othersその他固定負債ほか 19,421 22,254 25,545 26,676 26,503 31,871 27,091 8,301 8,829 12,743
Current liabilities 流動負債 200,368 211,516 189,976 201,519 239,322 175,236 211,177 267,903 198,670 242,686
Non-current liabilities due within one year
1年以内期限到来の固定負債 10,938 23,577 9,119 12,465 56,251 8,797 51,999 104,288 22,884 74,432
Accounts payable 買掛金 16,806 15,658 18,151 27,829 30,830 33,024 18,397 18,275 18,208 19,821
Bank loans 短期借入金 12,434 14,934 14,934 15,151 532 601 403 431 466 —
Other payables 未払金 41,453 43,619 40,049 45,242 49,204 33,064 45,022 36,502 33,069 35,124
Accrued expenses 未払費用 44,353 39,585 40,390 42,039 41,629 41,068 39,777 43,566 41,216 39,332
Income taxes payable 未払法人税等 15,524 18,744 19,326 13,396 15,130 22,093 17,080 24,648 31,372 36,257
Other current liabilities and others その他流動負債ほか 58,860 55,399 47,467 45,397 45,746 36,589 38,499 40,193 51,455 37,720
Total liabilities 負債合計 835,603 881,589 936,035 1,070,109 1,019,376 1,008,524 1,050,336 981,971 894,373 853,094
Stockholders’ equity(資本の部)
Common stock 資本金 141,812 141,812 141,812 141,814 141,816 141,817 141,817 141,817 141,843 141,844
Capital surplus 資本剰余金 2,034 2,034 2,034 2,036 2,038 2,038 2,038 2,038 2,064 2,065
Retained earnings 利益剰余金 — — — — — — — — — 379,668
Legal reserve 利益準備金 29,619 31,033 32,447 33,861 35,274 35,454 35,454 35,454 35,454 35,454
Other retained earnings その他剰余金 214,821 209,737 210,207 209,911 209,382 211,985 264,052 277,320 307,428 344,214
Net unrealized gain on securities 評価差額金 — — — — — — — 51,554 30,375 15,548
Treasury stock 自己株式 — — — — — — — — △95 △10,862
Total stockholders’ equity 資本合計 388,287 384,618 386,501 387,623 388,512 391,295 443,363 508,185 517,070 528,264
Total liabilities and stockholders’ equity 負債・資本合計 1,223,890 1,266,207 1,322,537 1,457,733 1,407,889 1,399,820 1,493,699 1,490,157 1,411,444 1,381,359
※ Due to the revision of regulations for financial statements, “Capital reserve” is presented as “Capital surplus” beginning in the year ended March 31, 2003. “Legal reserve” and “Other retained earnings” are presented as components of “Retained earnings.”財務諸表法の改正により、2003年3月期から「資本準備金」は「資本剰余金」として表示しております。また、「利益準備金」「その他剰余金」は「利益剰余金」の内訳科目として表示しております。
Download

28(¥ millions/百万円)
Fiscal years ended March 31 3月31日に終了した1年間 1994 1995 1996 1997 1998 1999 2000 2001 2002 2003
Net sales 総売上高 825,992 800,675 831,739 862,592 880,428 870,838 869,939 965,619 974,566 992,236Gas sales ガス売上高 615,234 594,423 625,116 655,579 680,615 668,770 665,834 734,119 743,347 785,079Miscellaneous revenue 営業雑収益 182,916 175,528 175,269 175,266 164,649 166,875 168,680 193,951 194,681 186,270Incidental revenue 附帯事業収益 27,841 30,724 31,353 31,746 35,162 35,192 35,424 37,548 36,536 20,887
Costs 費 用 778,909 755,778 780,870 817,186 819,867 813,645 818,643 879,829 882,267 892,128Cost of sales 売上原価 172,986 154,192 172,619 209,854 208,173 194,238 207,393 263,368 264,651 288,896Selling expenses 供給販売費 307,890 304,872 315,369 314,050 323,318 319,932 317,696 321,441 325,989 331,437General and administrative expenses 一般管理費 90,848 94,868 91,536 91,262 92,795 101,795 98,372 77,231 74,222 75,256Miscellaneous expenses 営業雑費用 179,903 173,307 173,715 174,417 165,521 168,034 164,826 185,639 186,363 176,891Incidental expenses 附帯事業費用 27,280 28,536 27,628 27,603 30,060 29,644 30,352 32,147 31,040 19,646
Operating income 営業利益 47,083 44,897 50,869 45,404 60,558 57,193 51,296 85,790 92,299 100,108Non-operating income 営業外収益 15,818 13,593 15,470 19,640 11,901 12,529 14,317 12,363 12,188 12,552
Interest income 受取利息 1,941 986 710 702 683 452 352 438 422 576Dividend income 受取配当金 1,710 1,564 1,554 1,571 1,655 1,616 1,528 1,816 1,709 1,709Exchange gains 為替差益 — — — — — 1,381 2,636 — — —Rental income 賃貸料収入 6,087 6,477 6,326 5,775 5,011 4,821 4,770 4,662 4,729 4,718Miscellaneous revenue and others 雑収入ほか 6,080 4,566 6,880 11,592 4,552 4,259 5,031 5,447 5,328 5,548
Non-operating expenses 営業外費用 26,415 28,934 31,499 36,654 42,274 33,317 30,685 39,611 32,238 32,980Interest expenses 支払利息 5,522 5,633 5,578 5,272 4,554 4,286 3,885 3,353 3,032 2,666Bond interest expenses 社債利息 11,093 12,889 14,701 16,401 17,236 14,094 14,390 14,368 11,963 10,022Bond issue cost amortization 社債発行費償却 1,146 199 774 2,609 — 233 277 92 135 96Adjustments of charges for construction of distribution facilities他受工事精算差額 5,250 7,226 6,978 6,742 7,266 8,546 8,009 6,536 6,960 4,805Miscellaneous expenses and others 雑支出ほか 3,404 2,987 3,468 5,630 13,218 6,158 4,124 15,262 10,148 15,391Ordinary income 経常利益 36,486 29,556 34,841 28,390 30,185 36,405 34,929 58,542 72,249 79,680Extraordinary income 特別利益 151 2 2,015 2,050 922 577 512 163 4,200 8,655Extraordinary expenses 特別損失 150 2 661 1,534 924 578 496 15,798 665 4,477Income before income taxes 税引前当期純利益 36,487 29,556 36,195 28,906 30,183 36,405 34,945 42,907 75,784 83,857
Income taxes 法人税等 22,227 19,083 20,180 13,651 15,166 19,490 11,950 20,930 27,230 37,140Income taxes deferred 法人税等調整額 — — — — — — 600 △5,423 102 △6,915
Net income 当期純利益 14,260 10,473 16,015 15,255 15,017 16,915 22,395 27,400 48,451 53,633Retained earnings brought forward 前期繰越利益 17,854 16,161 11,242 11,688 10,981 10,374 12,106 21,507 31,973 33,839Adjustments of occurred income taxes and others過年度税効果調整額等 — — — — — — 46,619 — — —Interim dividends 中間配当額 7,024 7,024 7,024 7,024 7,024 7,025 7,025 7,024 8,430 8,338Retained reserves 利益準備金積立額 702 702 702 702 702 — — — — —
Unappropriated retained earnings 当期未処分利益 24,387 18,908 19,530 19,216 18,281 20,264 74,095 41,883 71,995 79,141
※ Some items in the accompanying financial statements have been summarized to preserve simplicity. Such changes are unaudited. 上記の財務諸表については、各勘定科目の要約に当たっての監査は受けておりません。
Ten-Year Nonconsolidated Statements of Income 単独損益計算書(10年分)
Download

29Corporate name: Tokyo Gas Co., Ltd.社名:東京ガス株式会社
Head office: 5-20 Kaigan 1-chome, Minato-ku, Tokyo 105-8527, JapanTEL: +81-3-5400-3888 FAX: +81-3-3437-2668本社住所:東京都港区海岸1-5-20TEL: 03-5400-3888 FAX: 03-3437-2668
Date of establishment: October 1, 1885設立年月日:1885 年10月1日
Common stock (as of March 31, 2003): ¥141,844 million資本金:141,844,398,888円(2003年3月31日)
Authorized number of shares: 6,500,000,000会社が発行する株式の総数:6,500,000,000株
Number of shares outstanding (as of March 31, 2003): 2,810,171,295発行済株式総数:2,810,171,295株(2003年3月31日)
Number of stockholders (as of March 31, 2003): 190,019株主数:190,019人(2003年3月31日)
Securities traded: Tokyo, Osaka and Nagoya stock exchanges上場証券取引所:東京、大阪、名古屋
Independent auditors: Asahi & Co.独立監査人:朝日監査法人
Transfer agent: Japan Securities Agents, Ltd. 2-4 NihonbashiKayabacho 1-chome, Chuo-ku, Tokyo 103-8202, Japan株式名義書換代理人:日本証券代行株式会社東京都中央区日本橋茅場町一丁目2番4号
Further information: IR Section, General Administration Dept.TEL: +81-3-5400-3888 FAX: +81-3-3437-2668E-mail: [email protected] page address: URL: http://www.tokyo-gas.co.jpホームページ・アドレス:(URL:http://www.tokyo-gas.co.jp)お問い合わせ先:東京ガス(株)総務部IRグループTEL: 03-5400-3888 FAX: 03-3437-2668E-mail: [email protected]
Overseas Offices海外事務所
New York Representative OfficeThe Chrysler Building, 405 Lexington Avenue, 33rd Floor, New York,NY 10174, U.S.A.TEL: +1-646-865-0557 FAX: +1-646-865-0592ニューヨーク事務所
Paris Representative Office102, Avenue des Champs-Elysees, 75008 Paris, FranceTEL: +33-1-45-62-00-59 FAX: +33-1-42-25-96-85パリ事務所
Asia Pacific Representative OfficeLevel 30, Menara Shahzan Insas No. 30 Jalan Sultan Ismail, 50250 Kuala Lumpur, MalaysiaTEL: +60-3-2144-2928 FAX: +60-3-2144-2930アジアパシフィック地域事務所
Stock breakdown by percentage of total shares 所有者別単位持株比率� Financial institutions 金融機関�� Foreign companies, etc. 外国法人等�� Individuals and others 個人その他� � Domestic companies, etc. その他法人等�
0
20
40
60
80
100(%)
94/3 95/3 96/3 97/3 98/3 99/3 00/3 01/3 02/3 03/3
14.37% 14.01% 13.62% 13.01% 12.48% 11.96% 12.72% 11.30% 10.98% 11.86%
23.29% 23.60% 23.90% 24.64% 24.49% 24.67% 29.67% 25.64% 24.92% 23.52%
5.61% 4.57% 6.78% 6.85% 8.26%
56.73% 57.82% 55.70% 55.50% 54.77%
7.64%
55.73%
12.59%
45.02%
14.60% 18.42% 21.57%
48.46% 45.68% 43.05%
Stock price range, stock volume, and TOPIX 株価チャート
(Point/ポイント)(¥/円)
(Thousands of shares/千株)
94/1 2 3 4 5 6 7 8 9 10 11 12 95/1 2 3 4 5 6 7 8 9 10 11 12 96/1 2 3 4 5 6 7 8 9 10 11 12 97/1 2 3 4 5 6 7 8 9 10 11 12 98/1 2 3 4 5 6 7 8 9 10 11 12 99/1 2 3 4 5 6 7 8 9 10 11 12 00/1 2 3 4 5 6 7 8 9 10 11 12 01/1 2 3 4 5 6 7 8 9 10 11 12 02/1 2 3 4 5 6 7 8 9 10 11 12 03/1 2 3 4 5 60
100
200
300
400
500
600
1,000
1,500
2,000
0
80,000
160,000
240,000� Tokyo Gas stock price range (Left scale) 東京ガス株価(左目盛り)� Tokyo Gas stock volume (Lower right scale) 東京ガス出来高(右下目盛り)� TOPIX Index (Upper right scale) 東証株価指数(右上目盛り)
Corporate Data / Stockholder Information 会社概要/株式情報

5-20 Kaigan 1-chome, Minato-ku, Tokyo 105-8527, Japan〒 105-8527 東京都港区海岸1-5-20TEL: 03-5400-3888 FAX: 03-3437-2668
Printed in Japan on recycled paper.


![arXiv:1710.02968v1 [cond-mat.quant-gas] 9 Oct 2017 · 1Department of Physics, The University of Tokyo, Tokyo 113-0033, Japan 2School of Physics and Astronomy, Monash University, Victoria](https://static.documents.pub/doc/80x56/5ed4ebc0dc1b671d5705d359/arxiv171002968v1-cond-matquant-gas-9-oct-2017-1department-of-physics-the-university.jpg)


