56
2007 Annual Report
| Date post: | 27-Jul-2015 |
| Category: |
Economy & Finance |
| Upload: | finance50 |
| View: | 371 times |
| Download: | 0 times |
2007 Annual Report

The Vaquero at Windgate Ranch
Scottsdale, Arizona
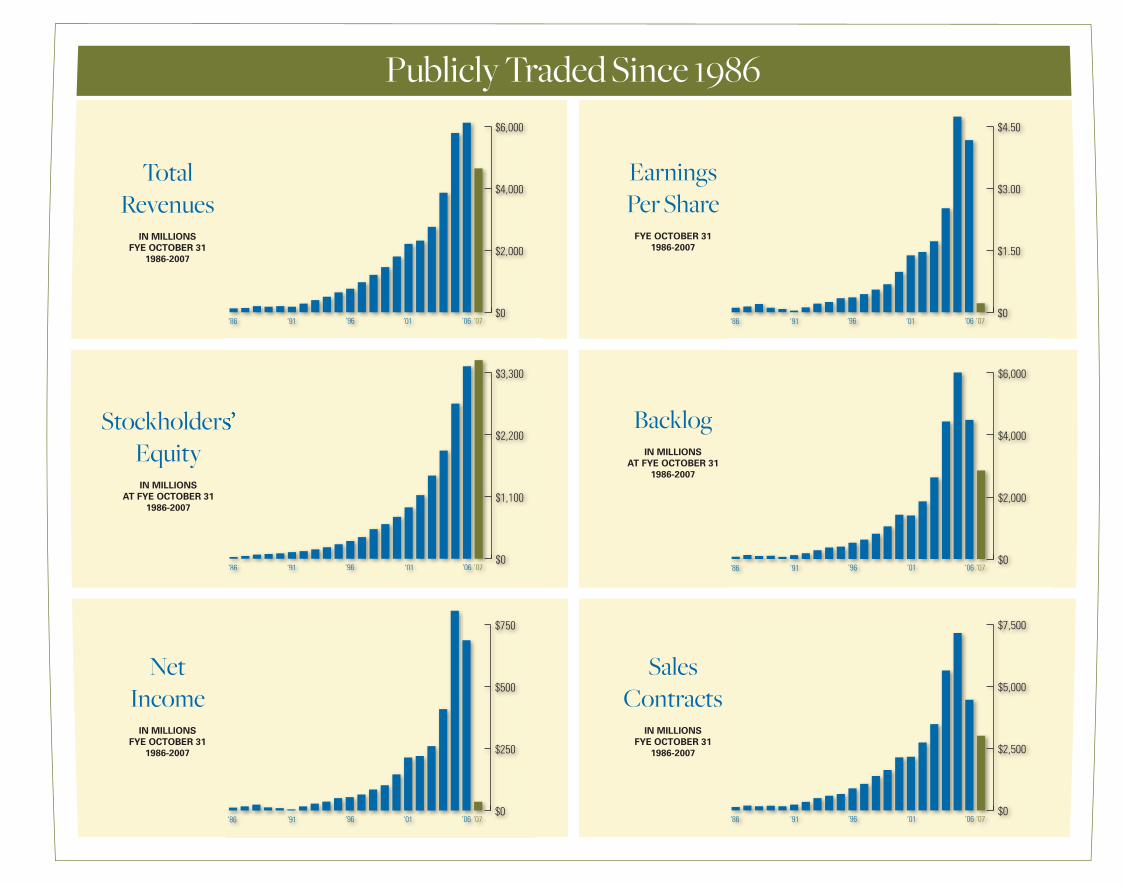
NetIncome
IN MILLIONSFYE OCTOBER 31
1986-2007
BacklogIN MILLIONS
AT FYE OCTOBER 311986-2007
TotalRevenues
IN MILLIONSFYE OCTOBER 31
1986-2007
EarningsPer Share
FYE OCTOBER 311986-2007
Stockholders’EquityIN MILLIONS
AT FYE OCTOBER 311986-2007
SalesContracts
IN MILLIONSFYE OCTOBER 31
1986-2007
‘86 ‘91 ‘96 ‘01 ‘06 ‘07$0
$2,000
$4,000
$6,000
‘86 ‘91 ‘96 ‘01 ‘06 ‘07$0
$1.50
$3.00
$4.50
‘86 ‘91 ‘96 ‘01 ‘06 ‘07$0
$250
$500
$750
‘86 ‘91 ‘96 ‘01 ‘06 ‘07$0
$2,500
$5,000
$7,500
‘86 ‘91 ‘96 ‘01 ‘06 ‘07$0
$2,000
$4,000
$6,000
Stockholders’
‘86 ‘91 ‘96 ‘01 ‘06 ‘07$0
$1,100
$2,200
$3,300
Publicly Traded Since 1986
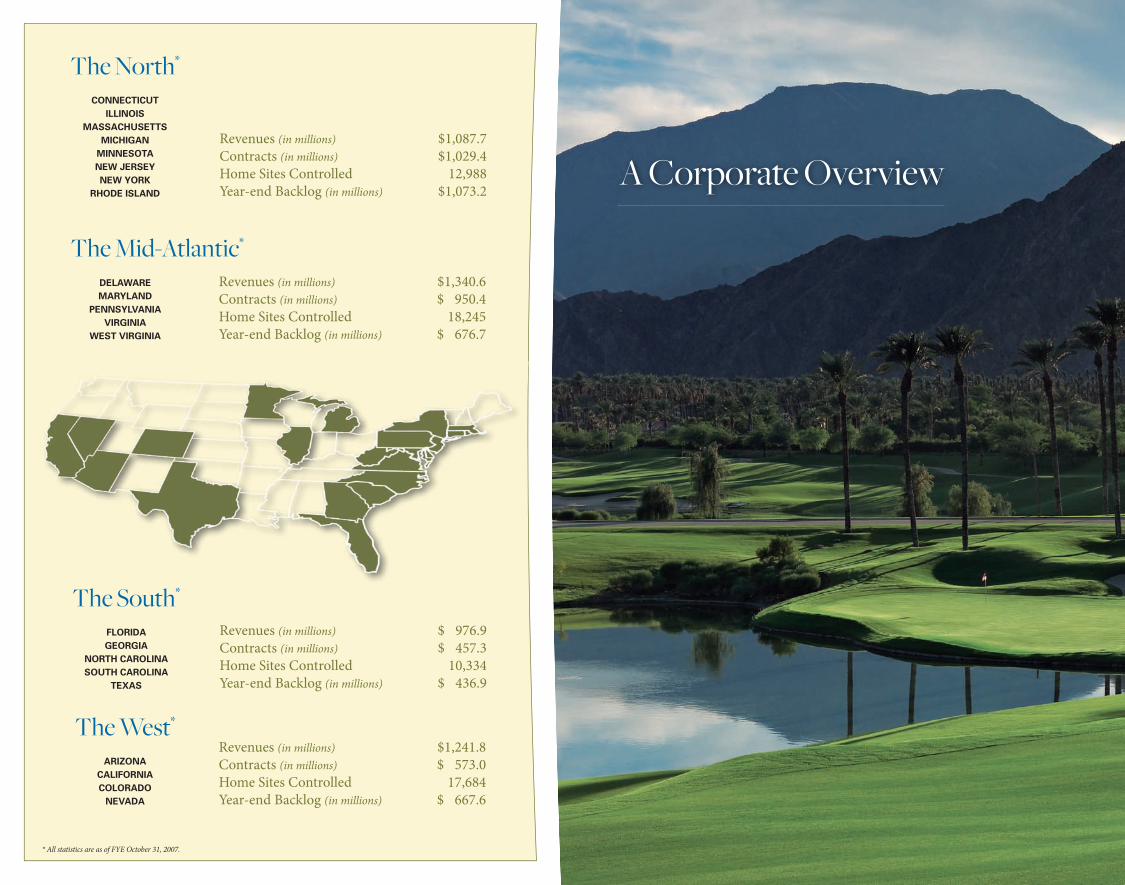
The West*
ARIZONACALIFORNIACOLORADO
NEVADA
Revenues (in millions) $1,241.8Contracts (in millions) $ 573.0Home Sites Controlled 17,684Year-end Backlog (in millions) $ 667.6
The South* FLORIDAGEORGIA
NORTH CAROLINASOUTH CAROLINA
TEXAS
Revenues (in millions) $ 976.9Contracts (in millions) $ 457.3Home Sites Controlled 10,334Year-end Backlog (in millions) $ 436.9
The North*
CONNECTICUTILLINOIS
MASSACHUSETTSMICHIGAN
MINNESOTANEW JERSEYNEW YORK
RHODE ISLAND
Revenues (in millions) $1,087.7Contracts (in millions) $1,029.4Home Sites Controlled 12,988Year-end Backlog (in millions) $1,073.2
DELAWAREMARYLAND
PENNSYLVANIAVIRGINIA
WEST VIRGINIA
The Mid-Atlantic*
Revenues (in millions) $1,340.6Contracts (in millions) $ 950.4Home Sites Controlled 18,245Year-end Backlog (in millions) $ 676.7
* All statistics are as of FYE October 31, 2007.
A Corporate Overview
Toll Brothers 2007 Annual Report 3
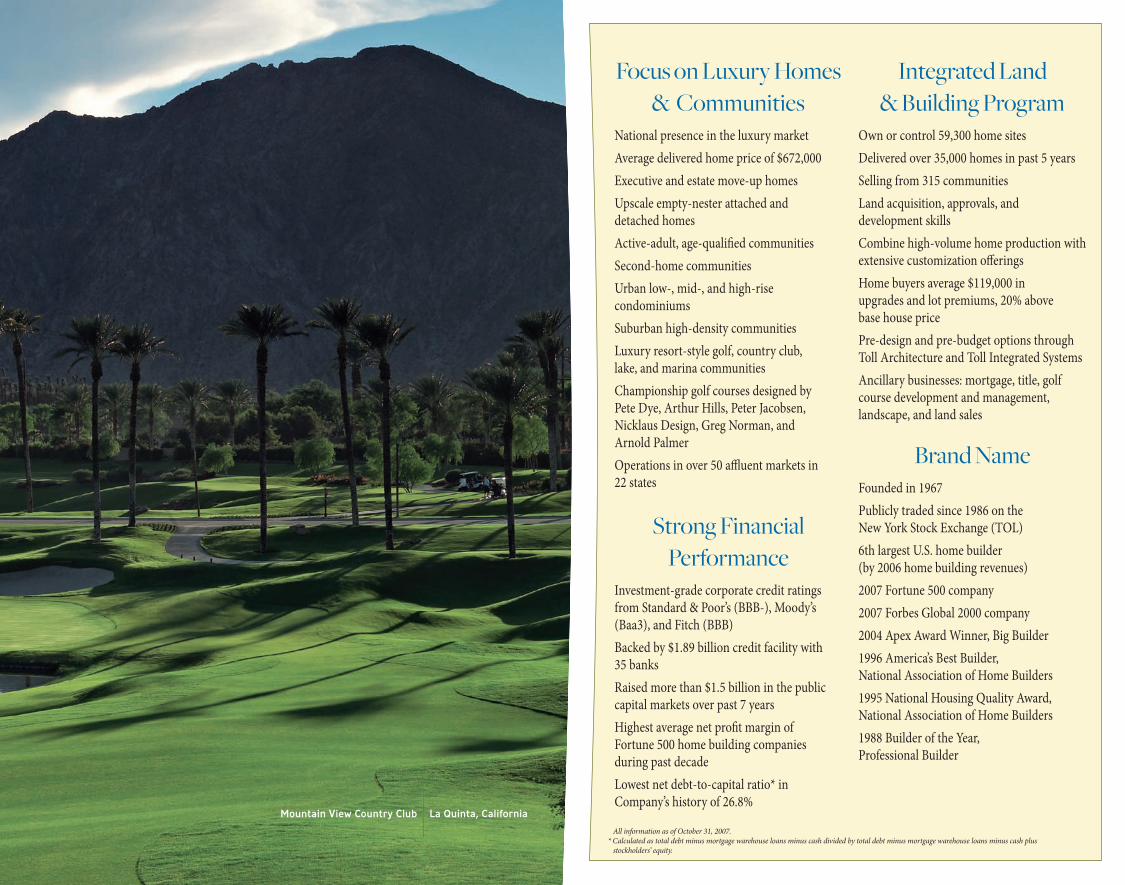
Mountain View Country Club
La Quinta, California
Focus on Luxury Homes & Communities
National presence in the luxury marketAverage delivered home price of $672,000Executive and estate move-up homesUpscale empty-nester attached and detached homesActive-adult, age-qualified communitiesSecond-home communities Urban low-, mid-, and high-rise condominiumsSuburban high-density communitiesLuxury resort-style golf, country club, lake, and marina communitiesChampionship golf courses designed by Pete Dye, Arthur Hills, Peter Jacobsen, Nicklaus Design, Greg Norman, and Arnold Palmer Operations in over 50 affluent markets in 22 states
Strong Financial Performance
Investment-grade corporate credit ratings from Standard & Poor’s (BBB-), Moody’s (Baa3), and Fitch (BBB) Backed by $1.89 billion credit facility with 35 banksRaised more than $1.5 billion in the public capital markets over past 7 yearsHighest average net profit margin of Fortune 500 home building companies during past decadeLowest net debt-to-capital ratio* in Company’s history of 26.8%
Integrated Land & Building Program
Own or control 59,300 home sitesDelivered over 35,000 homes in past 5 yearsSelling from 315 communitiesLand acquisition, approvals, and development skillsCombine high-volume home production with extensive customization offeringsHome buyers average $119,000 in upgrades and lot premiums, 20% above base house price Pre-design and pre-budget options through Toll Architecture and Toll Integrated SystemsAncillary businesses: mortgage, title, golf course development and management, landscape, and land sales
Brand NameFounded in 1967Publicly traded since 1986 on the New York Stock Exchange (TOL)6th largest U.S. home builder (by 2006 home building revenues)2007 Fortune 500 company2007 Forbes Global 2000 company2004 Apex Award Winner, Big Builder1996 America’s Best Builder, National Association of Home Builders1995 National Housing Quality Award, National Association of Home Builders 1988 Builder of the Year, Professional Builder
All information as of October 31, 2007. * Calculated as total debt minus mortgage warehouse loans minus cash divided by total debt minus mortgage warehouse loans minus cash plus stockholders’ equity.
By many measures, fi scal 2007 was perhaps the most challenging of the 40 years that Toll Brothers has been in business. Although 1974 was tough, those diffi cult times lasted only one year. Confronted with a severe housing downturn, our team still produced FY 2007 revenues of $4.6 billion and net income of $35.7 million, which, although down signifi cantly from FY 2006, was our 22nd consecutive year of profi tability. At FYE 2007, stockholders’ equity grew to $3.53 billion, and our net debt-to-capital ratio* stood at 26.8%, its lowest level ever.
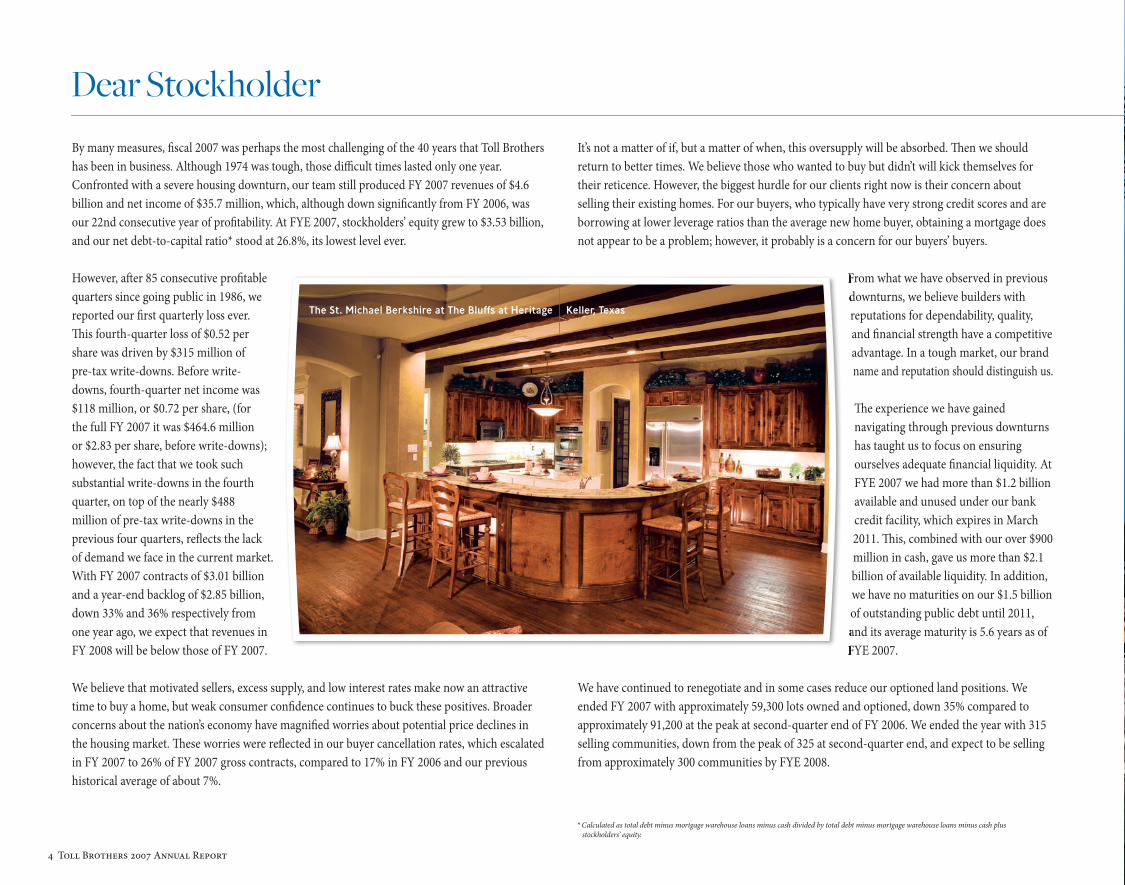
However, aft er 85 consecutive profi table quarters since going public in 1986, we reported our fi rst quarterly loss ever. Th is fourth-quarter loss of $0.52 per share was driven by $315 million of pre-tax write-downs. Before write-downs, fourth-quarter net income was $118 million, or $0.72 per share, (for the full FY 2007 it was $464.6 million or $2.83 per share, before write-downs); however, the fact that we took such substantial write-downs in the fourth quarter, on top of the nearly $488 million of pre-tax write-downs in the previous four quarters, refl ects the lack of demand we face in the current market. With FY 2007 contracts of $3.01 billion and a year-end backlog of $2.85 billion, down 33% and 36% respectively from one year ago, we expect that revenues in FY 2008 will be below those of FY 2007.
We believe that motivated sellers, excess supply, and low interest rates make now an attractive time to buy a home, but weak consumer confi dence continues to buck these positives. Broader concerns about the nation’s economy have magnifi ed worries about potential price declines in the housing market. Th ese worries were refl ected in our buyer cancellation rates, which escalated in FY 2007 to 26% of FY 2007 gross contracts, compared to 17% in FY 2006 and our previous historical average of about 7%.
It’s not a matter of if, but a matter of when, this oversupply will be absorbed. Th en we should return to better times. We believe those who wanted to buy but didn’t will kick themselves for their reticence. However, the biggest hurdle for our clients right now is their concern about selling their existing homes. For our buyers, who typically have very strong credit scores and are borrowing at lower leverage ratios than the average new home buyer, obtaining a mortgage does not appear to be a problem; however, it probably is a concern for our buyers’ buyers.
From what we have observed in previous downturns, we believe builders with reputations for dependability, quality, and fi nancial strength have a competitive advantage. In a tough market, our brand name and reputation should distinguish us.
Th e experience we have gained navigating through previous downturns has taught us to focus on ensuring ourselves adequate fi nancial liquidity. At FYE 2007 we had more than $1.2 billion available and unused under our bank credit facility, which expires in March 2011. Th is, combined with our over $900 million in cash, gave us more than $2.1 billion of available liquidity. In addition, we have no maturities on our $1.5 billion of outstanding public debt until 2011, and its average maturity is 5.6 years as of FYE 2007.
We have continued to renegotiate and in some cases reduce our optioned land positions. We ended FY 2007 with approximately 59,300 lots owned and optioned, down 35% compared to approximately 91,200 at the peak at second-quarter end of FY 2006. We ended the year with 315 selling communities, down from the peak of 325 at second-quarter end, and expect to be selling from approximately 300 communities by FYE 2008.
4 Toll Brothers 2007 Annual Report
Dear Stockholder
From what we have observed in previous downturns, we believe builders with
and its average maturity is 5.6 years as of FYE 2007.
The St. Michael Berkshire at The Bluffs at Heritage
Keller, Texas
* Calculated as total debt minus mortgage warehouse loans minus cash divided by total debt minus mortgage warehouse loans minus cash plus stockholders’ equity.

Toll Brothers 2007 Annual Report 5
The Villa Milano at Jupiter Country Club
Jupiter, Florida

5th Street Lofts
Long Island City, New York
6 Toll Brothers 2007 Annual Report
Artist rendering.

We also have streamlined our staffing operation to better match our reduced production. Unfortunately, we’ve had experience at this, having worked through the major downturns that began in 1974, 1980, and 1988. Even so, we have maintained active deal teams in most of our regions that are working hard to identify opportunities that may arise from dislocations in the market.
While we remain attuned to the need to proceed cautiously and prudently given the difficulty of predicting the end of the current downturn, we do recall the opportunities that emerged from the downturn of the early 1990s and intend to be well-positioned in anticipation of the eventual recovery.
This downturn may be our toughest test yet, but we believe our great team is up to the challenge. We still believe the demographics exist to support the housing market. Pent-up demand should be building. Immigration is at record levels and large amounts of wealth have been created. With interest rates still quite low and very few new home sites moving through the approval process, as soon as the fear of dropping home prices dissipates, we may witness a faster and stronger recovery than anticipated.
We wish to thank our stockholders, suppliers, and contractors for their support; our customers for their trust; and our co-workers for their enthusiasm, perseverance, and dedication to making our Company the best in the industry.
The Seville Classic at Sonterra at Somersett
Reno, Nevada
Toll Brothers 2007 Annual Report 7From left to right
Zvi Barzilay, Robert I. Toll, Bruce E. Toll
RobeRt I. tollChairman of the Board and
Chief Executive Officer
bRuce e. tollVice Chairman of the Board
ZvI baRZIlayPresident and
Chief Operating OfficerDecember 6, 2007
The Waverly at Hampton Pointe
Near Hilton Head, South Carolina
8 Toll Brothers 2007 Annual Report
The Current Housing Crisis and How We Got Here1993–2003: A PERIOD OF SUSTAINED PROSPERITY The U.S. housing industry emerged in the early 1990s from a several-year downturn, which had gradually rolled across the nation, impacting local and regional markets at different times and for different reasons. Once buyers started to regain confidence, the new home market began to operate in relatively typical fashion: From 1993 through 2003, demand exceeded supply in most of our markets as approval constraints constricted the pipeline of buildable home sites. This imbalance favored home builders and, on average, home prices rose a few percentage points above inflation each year.
There were hiccups along the way — the Russian, Mexican, and Asian financial crises; the Long-Term Credit debacle; and the Nasdaq and tech meltdowns of 2000. There were also periods when mortgage rates rose — in 1995, 1997, and 2000 — in part due to Federal Reserve policy shifts. But generally the housing market proved buoyant and Toll Brothers continued to succeed despite these hiccups. Favorable demographics, low interest rates, and a reasonably robust economy all contributed to what became an unusually long period, by historical standards, of sustained prosperity for our industry.
2004: SPECULATION AND LIQUIDITY ACCELERATE HOME PRICES In 2004, starting in a few markets, such as Las Vegas, then spreading across the country, home prices began to rise at a more rapid pace. In hindsight, this price acceleration turned out to have been driven,
in significant part, by investors and speculators. The easy access to capital brought on by securitization and a new generation of mortgage products enabled speculators and investors to acquire multiple homes with minimal equity and allowed many marginally qualified buyers to secure mortgages and buy homes that they were ultimately unable to afford. As many home builders increased their production to meet the demand spurred on by these new mortgage products, home prices rose rapidly in many markets, pricing out of the market some on tight budgets for whom affordability was a concern.
The transformation of the home mortgage market through securitization that was trumpeted as a buffer against the type of liquidity crunch that had caused several previous downturns turned out to be a major contributor to our industry’s problems. The Internet might have contributed to this process as speculators could more easily educate themselves on how to secure mortgages, identify and evaluate properties, and research local market trends.
THE MARKET TURNS DOWNIn the late summer and fall of 2005, there was a modest deceleration in the growth rate of demand. Additionally, in the aftermath of Hurricane Katrina, gas prices rose to $3.00/gallon and consumer confidence dropped precipitously.
When the music stopped, many territories were overwhelmed with excess home inventories as speculators bailed out, taking with them a
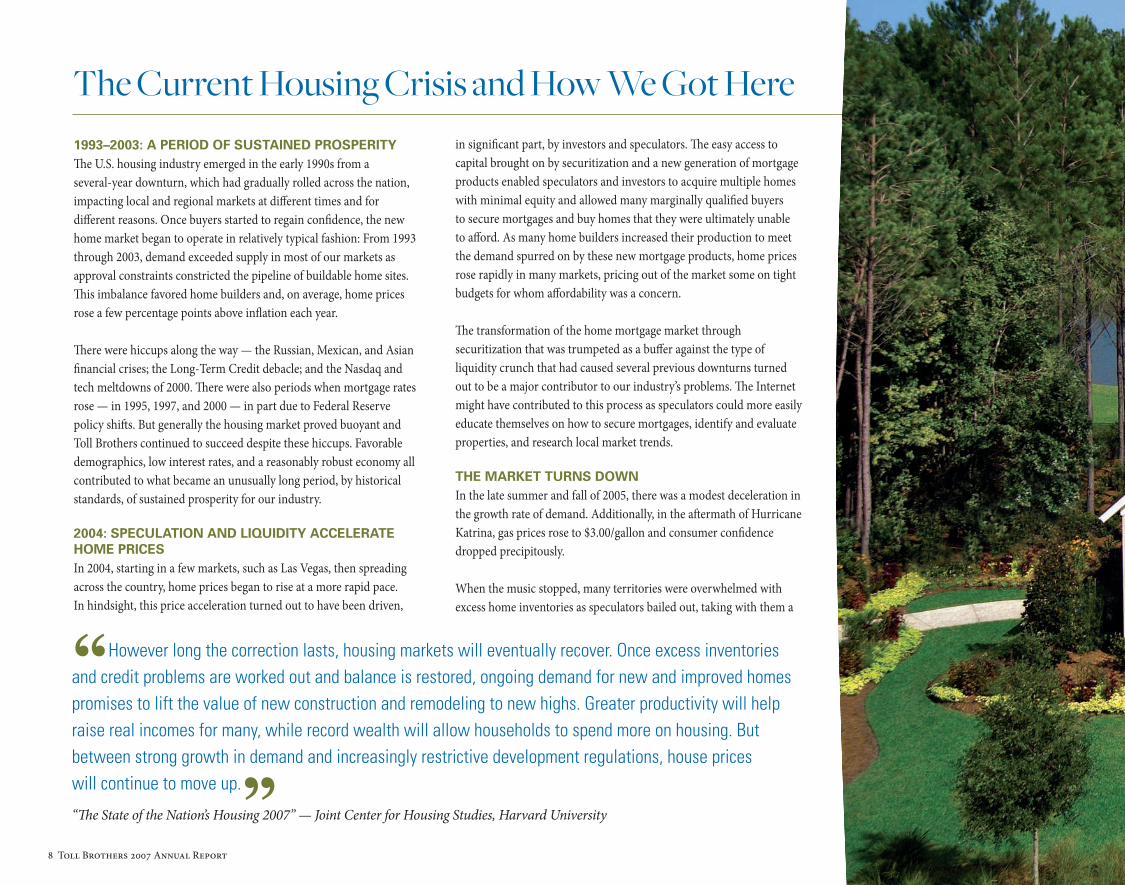
“However long the correction lasts, housing markets will eventually recover. Once excess inventories and credit problems are worked out and balance is restored, ongoing demand for new and improved homes promises to lift the value of new construction and remodeling to new highs. Greater productivity will help raise real incomes for many, while record wealth will allow households to spend more on housing. But between strong growth in demand and increasingly restrictive development regulations, house prices will continue to move up.”“The State of the Nation’s Housing 2007” — Joint Center for Housing Studies, Harvard University

The Waverly at Hampton Pointe
Near Hilton Head, South Carolina
Toll Brothers 2007 Annual Report 9

The Edgebrook Federal at Old Hopewell Estates
Wappingers Falls, New York
10 Toll Brothers 2007 Annual Report

Toll Brothers 2007 Annual Report 11
signifi cant portion of demand, and builders were left with many homes, both those they had built without an identifi ed customer and those they had completed but had little chance of selling aft er buyers cancelled their contracts.
We believed that a national geographic presence would provide some diversifi cation of risk to insulate us from the type of local market crashes or regional declines that had characterized previous industry downswings. Th is strategy grew from our experience during the downturn of the early 1990s, when our geographic concentration in the corridor from Boston to Baltimore left us vulnerable to the Northeast’s economic woes. However, the national scope of this downturn and the rapidity with which it swept across the nation suggest that there was greater correlation among regional housing markets than we had previously believed. Even so, we have observed that some builders with higher geographic concentrations in the most distressed markets are suff ering more than those with a broader base of operations.
In late 2005, given the general health of the economy as refl ected in low interest and unemployment rates, as well as positive demographics, many thought the downturn would be short-lived. However, the market continued to take a step down as we, for the fi rst time ever, and virtually every other builder to a greater extent, experienced a dramatic increase in cancellations from buyers who should have been showing up at the closing table: In our third quarter of 2006, our cancellation rate rose above 11% for the fi rst time in our history, and it has remained at very elevated levels since then.
A LIQUIDITY CRUNCH In January 2006, it appeared that consumer confi dence was starting to fi rm until a wave of subprime fears in late February 2007 took the momentum away. Th e fi nancial markets began to develop jitters as word spread that subprime loan foreclosures might soon bring hundreds of thousands of additional homes onto the market. Th is fear culminated in a fi nancial crisis as the capital markets choked on what was perceived to be underpriced risk in the form of subprime mortgage securities that sat in global bond portfolios. Th is liquidity crisis brought on tightened credit standards that knocked some buyers at the lower-priced end of the spectrum off the home ownership ladder and instigated a credit crunch that constricted the secondary mortgage securities market as many investors lost confi dence in their ability to evaluate and price risk into these type of loans, and therefore stopped buying them on the secondary market.
WHERE WE ARE NOWAs a result of these events, currently there is an oversupply of unsold housing inventory in many markets. Th is excess supply has been slow to clear because customers remain concerned about selling their existing homes or committing to purchase today in fear that prices will be lower tomorrow. Th e challenge for builders and the economy in general is to reverse that loss of confi dence among potential home buyers. Once buyers regain confi dence, we believe they will move off the sidelines and into the housing market, absorbing the excess supply and leading the housing market into recovery.
The Malvern Classic at Byers Station
Chester Springs, Pennsylvania
12 Toll Brothers 2007 Annual Report
Responding to the Downturn — Preparing for the Upturn
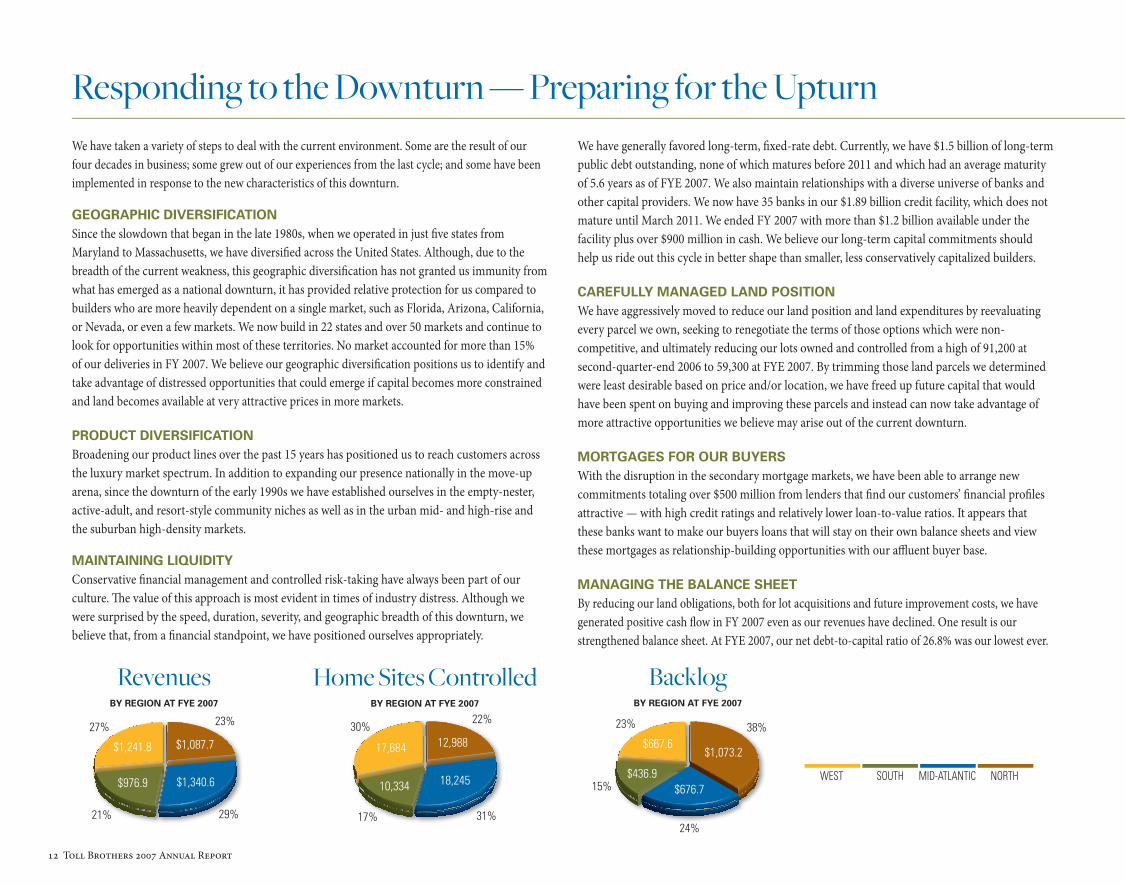
$1,087.7
$1,340.6
$1,241.8
$976.9
RevenuesBY REGION AT FYE 2007
BacklogBY REGION AT FYE 2007
$1,073.2
$676.7
$667.6
$436.9
Home Sites ControlledBY REGION AT FYE 2007
12,988
18,24510,334
17,684
WEST SOUTH MID-ATLANTIC NORTH
27%
21%
23%
29%
30%
17%
22%
31%
23%
15%
24%
38%
We have taken a variety of steps to deal with the current environment. Some are the result of our four decades in business; some grew out of our experiences from the last cycle; and some have been implemented in response to the new characteristics of this downturn.
GEOGRAPHIC DIVERSIFICATION Since the slowdown that began in the late 1980s, when we operated in just fi ve states from Maryland to Massachusetts, we have diversifi ed across the United States. Although, due to the breadth of the current weakness, this geographic diversifi cation has not granted us immunity from what has emerged as a national downturn, it has provided relative protection for us compared to builders who are more heavily dependent on a single market, such as Florida, Arizona, California, or Nevada, or even a few markets. We now build in 22 states and over 50 markets and continue to look for opportunities within most of these territories. No market accounted for more than 15% of our deliveries in FY 2007. We believe our geographic diversifi cation positions us to identify and take advantage of distressed opportunities that could emerge if capital becomes more constrained and land becomes available at very attractive prices in more markets.
PRODUCT DIVERSIFICATION Broadening our product lines over the past 15 years has positioned us to reach customers across the luxury market spectrum. In addition to expanding our presence nationally in the move-up arena, since the downturn of the early 1990s we have established ourselves in the empty-nester, active-adult, and resort-style community niches as well as in the urban mid- and high-rise and the suburban high-density markets.
MAINTAINING LIQUIDITYConservative fi nancial management and controlled risk-taking have always been part of our culture. Th e value of this approach is most evident in times of industry distress. Although we were surprised by the speed, duration, severity, and geographic breadth of this downturn, we believe that, from a fi nancial standpoint, we have positioned ourselves appropriately.
We have generally favored long-term, fi xed-rate debt. Currently, we have $1.5 billion of long-term public debt outstanding, none of which matures before 2011 and which had an average maturity of 5.6 years as of FYE 2007. We also maintain relationships with a diverse universe of banks and other capital providers. We now have 35 banks in our $1.89 billion credit facility, which does not mature until March 2011. We ended FY 2007 with more than $1.2 billion available under the facility plus over $900 million in cash. We believe our long-term capital commitments should help us ride out this cycle in better shape than smaller, less conservatively capitalized builders.
CAREFULLY MANAGED LAND POSITIONWe have aggressively moved to reduce our land position and land expenditures by reevaluating every parcel we own, seeking to renegotiate the terms of those options which were non-competitive, and ultimately reducing our lots owned and controlled from a high of 91,200 at second-quarter-end 2006 to 59,300 at FYE 2007. By trimming those land parcels we determined were least desirable based on price and/or location, we have freed up future capital that would have been spent on buying and improving these parcels and instead can now take advantage of more attractive opportunities we believe may arise out of the current downturn.
MORTGAGES FOR OUR BUYERSWith the disruption in the secondary mortgage markets, we have been able to arrange new commitments totaling over $500 million from lenders that fi nd our customers’ fi nancial profi les attractive — with high credit ratings and relatively lower loan-to-value ratios. It appears that these banks want to make our buyers loans that will stay on their own balance sheets and view these mortgages as relationship-building opportunities with our affl uent buyer base.
MANAGING THE BALANCE SHEETBy reducing our land obligations, both for lot acquisitions and future improvement costs, we have generated positive cash fl ow in FY 2007 even as our revenues have declined. One result is our strengthened balance sheet. At FYE 2007, our net debt-to-capital ratio of 26.8% was our lowest ever.

The Hampton Georgian at Marvin Creek
Near Charlotte, North Carolina
Toll Brothers 2007 Annual Report 13

The Clubhouse and Pool at Windgate Ranch
Scottsdale, Arizona
14 Toll Brothers 2007 Annual Report
Toll Brothers 2007 Annual Report 15
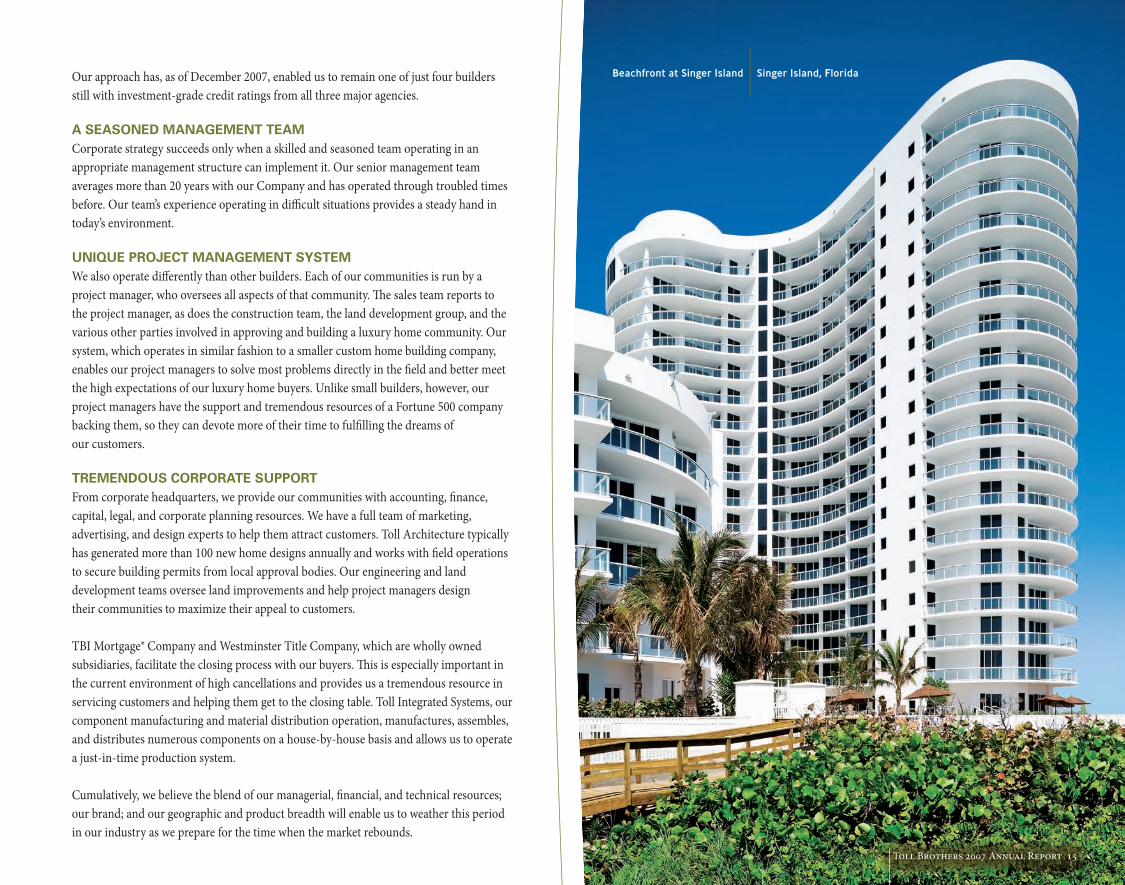
Beachfront at Singer Island
Singer Island, FloridaOur approach has, as of December 2007, enabled us to remain one of just four builders still with investment-grade credit ratings from all three major agencies.
A SEASONED MANAGEMENT TEAMCorporate strategy succeeds only when a skilled and seasoned team operating in an appropriate management structure can implement it. Our senior management team averages more than 20 years with our Company and has operated through troubled times before. Our team’s experience operating in diffi cult situations provides a steady hand in today’s environment.
UNIQUE PROJECT MANAGEMENT SYSTEMWe also operate diff erently than other builders. Each of our communities is run by a project manager, who oversees all aspects of that community. Th e sales team reports to the project manager, as does the construction team, the land development group, and the various other parties involved in approving and building a luxury home community. Our system, which operates in similar fashion to a smaller custom home building company, enables our project managers to solve most problems directly in the fi eld and better meet the high expectations of our luxury home buyers. Unlike small builders, however, our project managers have the support and tremendous resources of a Fortune 500 company backing them, so they can devote more of their time to fulfi lling the dreams of our customers.
TREMENDOUS CORPORATE SUPPORTFrom corporate headquarters, we provide our communities with accounting, fi nance, capital, legal, and corporate planning resources. We have a full team of marketing, advertising, and design experts to help them attract customers. Toll Architecture typically has generated more than 100 new home designs annually and works with fi eld operations to secure building permits from local approval bodies. Our engineering and land development teams oversee land improvements and help project managers design their communities to maximize their appeal to customers.
TBI Mortgage® Company and Westminster Title Company, which are wholly owned subsidiaries, facilitate the closing process with our buyers. Th is is especially important in the current environment of high cancellations and provides us a tremendous resource in servicing customers and helping them get to the closing table. Toll Integrated Systems, our component manufacturing and material distribution operation, manufactures, assembles, and distributes numerous components on a house-by-house basis and allows us to operate a just-in-time production system.
Cumulatively, we believe the blend of our managerial, fi nancial, and technical resources; our brand; and our geographic and product breadth will enable us to weather this period in our industry as we prepare for the time when the market rebounds.

16 Toll Brothers 2007 Annual Report
We have managed through four previous downturns in the housing market and believe that our industry will emerge from this one stronger and better than ever. We also expect that there may be fewer players in the game. Some smaller builders who are our primary competitors in the luxury home market may succumb to tighter lending restrictions on their project loans as well as to rising costs imposed by increased requirements for land approvals and housing permits.
Over the next decade, the demographics appear positive for our industry and the luxury home market in particular. Th e number of households earning $100,000 or more in 2006 constant dollars has grown from 5.1 million in 1976 to 10.6 million in 1986 to 14.9 million in 1996 and to 22.6 million in 2006. As a percentage of total U.S. households, that is an increase from 6.9% to 19.1% in the past 30 years.
It is expected that U.S. households will continue to grow in number. According to Harvard University’s Joint Center for Housing Studies, household formations for the period from 2005 to 2015 are projected to average 1.46 million per year compared to 1.26 million per year for the period from 1995 to 2005. Th is growth, combined with expectations of demand for second homes, plus the need to replace old or obsolete housing stock, suggests that, notwithstanding current industry conditions, demand for new homes (for sale and rental) will top 19.5 million in the decade from 2005 to 2014, compared to 16.2 million in the previous 10 years. Because our industry has produced at that level only twice in the last 20 years, it is very possible that, as an industry, we will not be able to meet that demand over a sustained period.
Our broad geographic presence and our diverse product off erings provide us with the ability to serve a wide variety of luxury buyers within many specifi c geographies by reaching out to affl uent households across the demographic and age spectrum. Our buyers can live in high-rise towers with views of the New York City skyline or in Florida overlooking the Atlantic Ocean. Th ey can look out on the 18th hole of an Arnold Palmer-designed golf course in a resort community in many parts of the country. Th ey can enjoy highly amenitized active-adult or empty-nester communities with fi tness and recreational facilities that complement their new and exciting lifestyles. Or they can become the owner of the move-up home that provides their growing family with the space, design, and close-knit community that represent their American dream.
As we wrestle with a challenging present, we are preparing for the future. We have been through this before and are already positioning ourselves to fl ourish when the market recovers.
Looking Forward“The demographic underpinnings of long-run housing demand remain solid. Net household growth should climb from an average 1.26 million annual pace in 1995–2005 to 1.46 million in 2005–2015. Continued immigration, together with the large number of second-generation
Americans and children of the baby boomers coming of age in the next decade, will reinforce demand for rental units and starter homes. For their part, the baby boomers will be especially active in the luxury and second-home markets.”“Th e State of the Nation’s Housing 2007” — Joint Center for Housing Studies, Harvard University
The Mayfair Federal at Corona View by Toll Brothers
Corona, California
The Lamar Chateau at The Summit at Castle Pines
Castle Rock, Colorado

Toll Brothers 2007 Annual Report 17
The Amano Provincial at The Estates at Tradition Port St. Lucie, Florida
The Lamar Chateau at The Summit at Castle Pines
Castle Rock, Colorado
The Carmel Federal at Hawthorn Woods Country Club
Hawthorn Woods, Illinois

18 Toll Brothers 2007 Annual Report
The Greenbrier Collection at Brier Creek Country Club®
Raleigh, North CarolinaNorthside Piers
Williamsburg, New York
Urban Mid- and High-Rise Empty-Nester
The Malvern Williamsburg at Patuxent Chase
Ellicott City, Maryland
Move-Up
Artist rendering.

Toll Brothers 2007 Annual Report 19
The Siena at Sorrento at Dublin Ranch
Dublin, California
Suburban High-Density
The Regency at Monroe Community Clubhouse
Monroe Township, New Jersey
Active-Adult
The Arnold Palmer Signature Golf Course at Frenchman’s Reserve
Palm Beach Gardens, Florida
Resort-Style

20 Toll Brothers 2007 Annual Report
The Hudson Tea Building
Hoboken, New Jersey

21 Toll Brothers 2007 Annual Report
Toll Brothers’ 22-Year Financial Summary 22
Management’s Discussion and Analysis 24
Management’s Annual Report on Internal Control Over Financial Reporting 34
Reports of Independent Registered Public Accounting Firm 34
Consolidated Statements of Income 35
Consolidated Balance Sheets 36
Consolidated Statements of Changes in Stockholders’ Equity 36
Consolidated Statements of Cash Flows 37
Notes to Consolidated Financial Statements 38
Summary Consolidated Quarterly Financial Data 51
Corporate Officers 52
Corporate Information 53
Financials Table of Contents
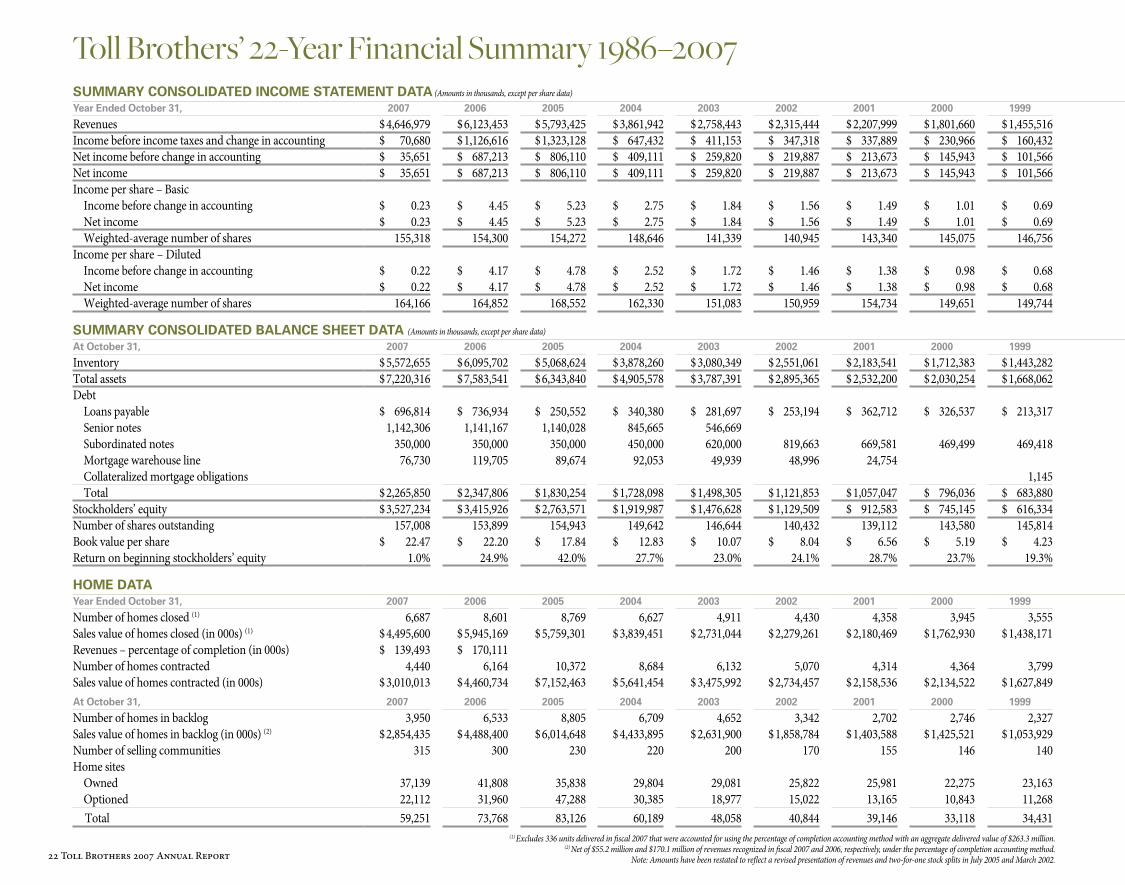
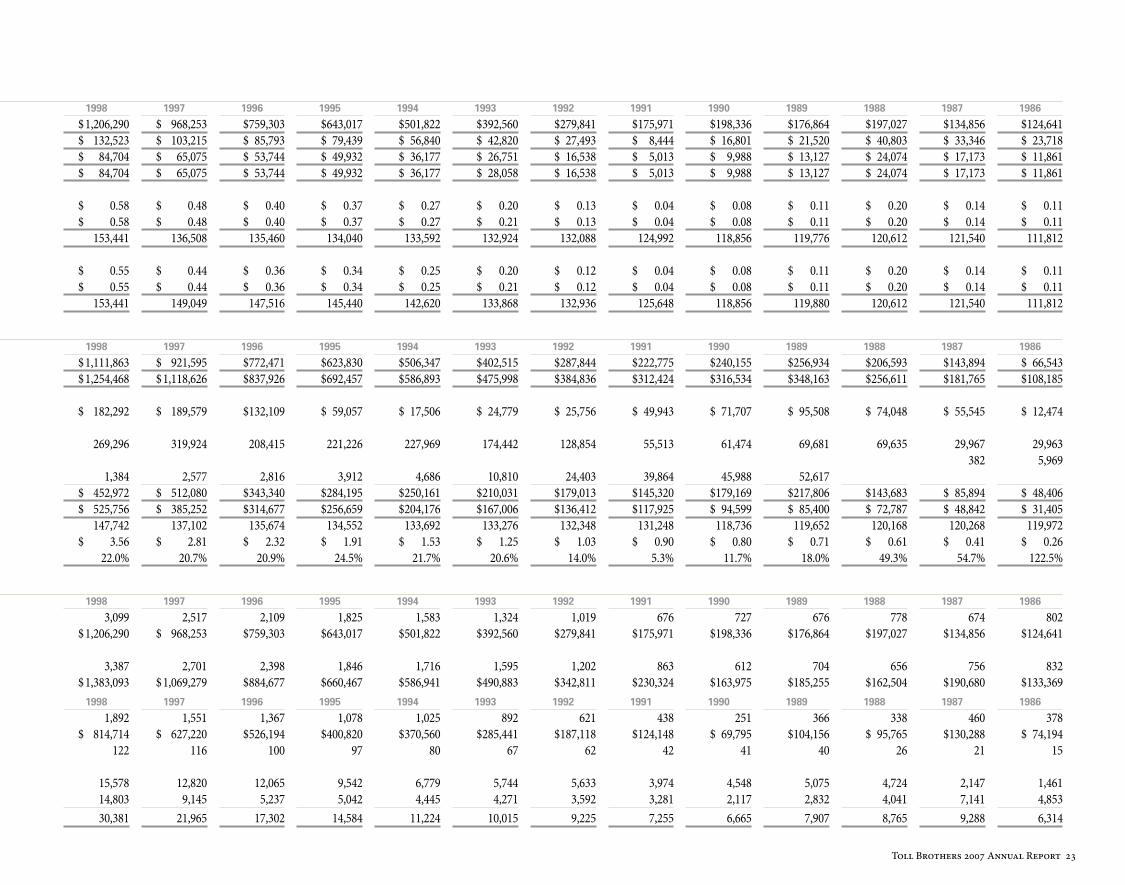
Toll Brothers’ 22-Year Financial Summary 1986–2007
(1) Excludes 336 units delivered in fiscal 2007 that were accounted for using the percentage of completion accounting method with an aggregate delivered value of $263.3 million. (2) Net of $55.2 million and $170.1 million of revenues recognized in fiscal 2007 and 2006, respectively, under the percentage of completion accounting method.
Note: Amounts have been restated to reflect a revised presentation of revenues and two-for-one stock splits in July 2005 and March 2002.
SuMMARY CONSOlIDATED INCOME STATEMENT DATA (Amounts in thousands, except per share data)
Year Ended October 31, 2007 2006 2005 2004 2003 2002 2001 2000 1999 1998 1997 1996 1995 1994 1993 1992 1991 1990 1989 1988 1987 1986
Revenues $ 4,646,979 $ 6,123,453 $ 5,793,425 $ 3,861,942 $ 2,758,443 $ 2,315,444 $ 2,207,999 $ 1,801,660 $ 1,455,516 $ 1,206,290 $ 968,253 $ 759,303 $ 643,017 $ 501,822 $ 392,560 $ 279,841 $ 175,971 $ 198,336 $ 176,864 $ 197,027 $ 134,856 $ 124,641Income before income taxes and change in accounting $ 70,680 $ 1,126,616 $ 1,323,128 $ 647,432 $ 411,153 $ 347,318 $ 337,889 $ 230,966 $ 160,432 $ 132,523 $ 103,215 $ 85,793 $ 79,439 $ 56,840 $ 42,820 $ 27,493 $ 8,444 $ 16,801 $ 21,520 $ 40,803 $ 33,346 $ 23,718Net income before change in accounting $ 35,651 $ 687,213 $ 806,110 $ 409,111 $ 259,820 $ 219,887 $ 213,673 $ 145,943 $ 101,566 $ 84,704 $ 65,075 $ 53,744 $ 49,932 $ 36,177 $ 26,751 $ 16,538 $ 5,013 $ 9,988 $ 13,127 $ 24,074 $ 17,173 $ 11,861Net income $ 35,651 $ 687,213 $ 806,110 $ 409,111 $ 259,820 $ 219,887 $ 213,673 $ 145,943 $ 101,566 $ 84,704 $ 65,075 $ 53,744 $ 49,932 $ 36,177 $ 28,058 $ 16,538 $ 5,013 $ 9,988 $ 13,127 $ 24,074 $ 17,173 $ 11,861Income per share – Basic
Income before change in accounting $ 0.23 $ 4.45 $ 5.23 $ 2.75 $ 1.84 $ 1.56 $ 1.49 $ 1.01 $ 0.69 $ 0.58 $ 0.48 $ 0.40 $ 0.37 $ 0.27 $ 0.20 $ 0.13 $ 0.04 $ 0.08 $ 0.11 $ 0.20 $ 0.14 $ 0.11Net income $ 0.23 $ 4.45 $ 5.23 $ 2.75 $ 1.84 $ 1.56 $ 1.49 $ 1.01 $ 0.69 $ 0.58 $ 0.48 $ 0.40 $ 0.37 $ 0.27 $ 0.21 $ 0.13 $ 0.04 $ 0.08 $ 0.11 $ 0.20 $ 0.14 $ 0.11Weighted-average number of shares 155,318 154,300 154,272 148,646 141,339 140,945 143,340 145,075 146,756 153,441 136,508 135,460 134,040 133,592 132,924 132,088 124,992 118,856 119,776 120,612 121,540 111,812
Income per share – DilutedIncome before change in accounting $ 0.22 $ 4.17 $ 4.78 $ 2.52 $ 1.72 $ 1.46 $ 1.38 $ 0.98 $ 0.68 $ 0.55 $ 0.44 $ 0.36 $ 0.34 $ 0.25 $ 0.20 $ 0.12 $ 0.04 $ 0.08 $ 0.11 $ 0.20 $ 0.14 $ 0.11Net income $ 0.22 $ 4.17 $ 4.78 $ 2.52 $ 1.72 $ 1.46 $ 1.38 $ 0.98 $ 0.68 $ 0.55 $ 0.44 $ 0.36 $ 0.34 $ 0.25 $ 0.21 $ 0.12 $ 0.04 $ 0.08 $ 0.11 $ 0.20 $ 0.14 $ 0.11Weighted-average number of shares 164,166 164,852 168,552 162,330 151,083 150,959 154,734 149,651 149,744 153,441 149,049 147,516 145,440 142,620 133,868 132,936 125,648 118,856 119,880 120,612 121,540 111,812
SuMMARY CONSOlIDATED BAlANCE ShEET DATA (Amounts in thousands, except per share data)
At October 31, 2007 2006 2005 2004 2003 2002 2001 2000 1999 1998 1997 1996 1995 1994 1993 1992 1991 1990 1989 1988 1987 1986
Inventory $ 5,572,655 $ 6,095,702 $ 5,068,624 $ 3,878,260 $ 3,080,349 $ 2,551,061 $ 2,183,541 $ 1,712,383 $ 1,443,282 $ 1,111,863 $ 921,595 $ 772,471 $ 623,830 $ 506,347 $ 402,515 $ 287,844 $ 222,775 $ 240,155 $ 256,934 $ 206,593 $ 143,894 $ 66,543Total assets $ 7,220,316 $ 7,583,541 $ 6,343,840 $ 4,905,578 $ 3,787,391 $ 2,895,365 $ 2,532,200 $ 2,030,254 $ 1,668,062 $ 1,254,468 $ 1,118,626 $ 837,926 $ 692,457 $ 586,893 $ 475,998 $ 384,836 $ 312,424 $ 316,534 $ 348,163 $ 256,611 $ 181,765 $ 108,185Debt
Loans payable $ 696,814 $ 736,934 $ 250,552 $ 340,380 $ 281,697 $ 253,194 $ 362,712 $ 326,537 $ 213,317 $ 182,292 $ 189,579 $ 132,109 $ 59,057 $ 17,506 $ 24,779 $ 25,756 $ 49,943 $ 71,707 $ 95,508 $ 74,048 $ 55,545 $ 12,474Senior notes 1,142,306 1,141,167 1,140,028 845,665 546,669Subordinated notes 350,000 350,000 350,000 450,000 620,000 819,663 669,581 469,499 469,418 269,296 319,924 208,415 221,226 227,969 174,442 128,854 55,513 61,474 69,681 69,635 29,967 29,963Mortgage warehouse line 76,730 119,705 89,674 92,053 49,939 48,996 24,754 382 5,969Collateralized mortgage obligations 1,145 1,384 2,577 2,816 3,912 4,686 10,810 24,403 39,864 45,988 52,617Total $ 2,265,850 $ 2,347,806 $ 1,830,254 $ 1,728,098 $ 1,498,305 $ 1,121,853 $ 1,057,047 $ 796,036 $ 683,880 $ 452,972 $ 512,080 $ 343,340 $ 284,195 $ 250,161 $ 210,031 $ 179,013 $ 145,320 $ 179,169 $ 217,806 $ 143,683 $ 85,894 $ 48,406
Stockholders’ equity $ 3,527,234 $ 3,415,926 $ 2,763,571 $ 1,919,987 $ 1,476,628 $ 1,129,509 $ 912,583 $ 745,145 $ 616,334 $ 525,756 $ 385,252 $ 314,677 $ 256,659 $ 204,176 $ 167,006 $ 136,412 $ 117,925 $ 94,599 $ 85,400 $ 72,787 $ 48,842 $ 31,405Number of shares outstanding 157,008 153,899 154,943 149,642 146,644 140,432 139,112 143,580 145,814 147,742 137,102 135,674 134,552 133,692 133,276 132,348 131,248 118,736 119,652 120,168 120,268 119,972Book value per share $ 22.47 $ 22.20 $ 17.84 $ 12.83 $ 10.07 $ 8.04 $ 6.56 $ 5.19 $ 4.23 $ 3.56 $ 2.81 $ 2.32 $ 1.91 $ 1.53 $ 1.25 $ 1.03 $ 0.90 $ 0.80 $ 0.71 $ 0.61 $ 0.41 $ 0.26Return on beginning stockholders’ equity 1.0% 24.9% 42.0% 27.7% 23.0% 24.1% 28.7% 23.7% 19.3% 22.0% 20.7% 20.9% 24.5% 21.7% 20.6% 14.0% 5.3% 11.7% 18.0% 49.3% 54.7% 122.5%
hOME DATAYear Ended October 31, 2007 2006 2005 2004 2003 2002 2001 2000 1999 1998 1997 1996 1995 1994 1993 1992 1991 1990 1989 1988 1987 1986
Number of homes closed (1) 6,687 8,601 8,769 6,627 4,911 4,430 4,358 3,945 3,555 3,099 2,517 2,109 1,825 1,583 1,324 1,019 676 727 676 778 674 802Sales value of homes closed (in 000s) (1) $ 4,495,600 $ 5,945,169 $ 5,759,301 $ 3,839,451 $ 2,731,044 $ 2,279,261 $ 2,180,469 $ 1,762,930 $ 1,438,171 $ 1,206,290 $ 968,253 $ 759,303 $ 643,017 $ 501,822 $ 392,560 $ 279,841 $ 175,971 $ 198,336 $ 176,864 $ 197,027 $ 134,856 $ 124,641Revenues – percentage of completion (in 000s) $ 139,493 $ 170,111Number of homes contracted 4,440 6,164 10,372 8,684 6,132 5,070 4,314 4,364 3,799 3,387 2,701 2,398 1,846 1,716 1,595 1,202 863 612 704 656 756 832Sales value of homes contracted (in 000s) $ 3,010,013 $ 4,460,734 $ 7,152,463 $ 5,641,454 $ 3,475,992 $ 2,734,457 $ 2,158,536 $ 2,134,522 $ 1,627,849 $ 1,383,093 $ 1,069,279 $ 884,677 $ 660,467 $ 586,941 $ 490,883 $ 342,811 $ 230,324 $ 163,975 $ 185,255 $ 162,504 $ 190,680 $ 133,369At October 31, 2007 2006 2005 2004 2003 2002 2001 2000 1999 1998 1997 1996 1995 1994 1993 1992 1991 1990 1989 1988 1987 1986
Number of homes in backlog 3,950 6,533 8,805 6,709 4,652 3,342 2,702 2,746 2,327 1,892 1,551 1,367 1,078 1,025 892 621 438 251 366 338 460 378Sales value of homes in backlog (in 000s) (2) $ 2,854,435 $ 4,488,400 $ 6,014,648 $ 4,433,895 $ 2,631,900 $ 1,858,784 $ 1,403,588 $ 1,425,521 $ 1,053,929 $ 814,714 $ 627,220 $ 526,194 $ 400,820 $ 370,560 $ 285,441 $ 187,118 $ 124,148 $ 69,795 $ 104,156 $ 95,765 $ 130,288 $ 74,194Number of selling communities 315 300 230 220 200 170 155 146 140 122 116 100 97 80 67 62 42 41 40 26 21 15Home sites
Owned 37,139 41,808 35,838 29,804 29,081 25,822 25,981 22,275 23,163 15,578 12,820 12,065 9,542 6,779 5,744 5,633 3,974 4,548 5,075 4,724 2,147 1,461Optioned 22,112 31,960 47,288 30,385 18,977 15,022 13,165 10,843 11,268 14,803 9,145 5,237 5,042 4,445 4,271 3,592 3,281 2,117 2,832 4,041 7,141 4,853Total 59,251 73,768 83,126 60,189 48,058 40,844 39,146 33,118 34,431 30,381 21,965 17,302 14,584 11,224 10,015 9,225 7,255 6,665 7,907 8,765 9,288 6,314
22 Toll Brothers 2007 Annual Report
SuMMARY CONSOlIDATED INCOME STATEMENT DATA (Amounts in thousands, except per share data)
Year Ended October 31, 2007 2006 2005 2004 2003 2002 2001 2000 1999 1998 1997 1996 1995 1994 1993 1992 1991 1990 1989 1988 1987 1986
Revenues $ 4,646,979 $ 6,123,453 $ 5,793,425 $ 3,861,942 $ 2,758,443 $ 2,315,444 $ 2,207,999 $ 1,801,660 $ 1,455,516 $ 1,206,290 $ 968,253 $ 759,303 $ 643,017 $ 501,822 $ 392,560 $ 279,841 $ 175,971 $ 198,336 $ 176,864 $ 197,027 $ 134,856 $ 124,641Income before income taxes and change in accounting $ 70,680 $ 1,126,616 $ 1,323,128 $ 647,432 $ 411,153 $ 347,318 $ 337,889 $ 230,966 $ 160,432 $ 132,523 $ 103,215 $ 85,793 $ 79,439 $ 56,840 $ 42,820 $ 27,493 $ 8,444 $ 16,801 $ 21,520 $ 40,803 $ 33,346 $ 23,718Net income before change in accounting $ 35,651 $ 687,213 $ 806,110 $ 409,111 $ 259,820 $ 219,887 $ 213,673 $ 145,943 $ 101,566 $ 84,704 $ 65,075 $ 53,744 $ 49,932 $ 36,177 $ 26,751 $ 16,538 $ 5,013 $ 9,988 $ 13,127 $ 24,074 $ 17,173 $ 11,861Net income $ 35,651 $ 687,213 $ 806,110 $ 409,111 $ 259,820 $ 219,887 $ 213,673 $ 145,943 $ 101,566 $ 84,704 $ 65,075 $ 53,744 $ 49,932 $ 36,177 $ 28,058 $ 16,538 $ 5,013 $ 9,988 $ 13,127 $ 24,074 $ 17,173 $ 11,861Income per share – Basic
Income before change in accounting $ 0.23 $ 4.45 $ 5.23 $ 2.75 $ 1.84 $ 1.56 $ 1.49 $ 1.01 $ 0.69 $ 0.58 $ 0.48 $ 0.40 $ 0.37 $ 0.27 $ 0.20 $ 0.13 $ 0.04 $ 0.08 $ 0.11 $ 0.20 $ 0.14 $ 0.11Net income $ 0.23 $ 4.45 $ 5.23 $ 2.75 $ 1.84 $ 1.56 $ 1.49 $ 1.01 $ 0.69 $ 0.58 $ 0.48 $ 0.40 $ 0.37 $ 0.27 $ 0.21 $ 0.13 $ 0.04 $ 0.08 $ 0.11 $ 0.20 $ 0.14 $ 0.11Weighted-average number of shares 155,318 154,300 154,272 148,646 141,339 140,945 143,340 145,075 146,756 153,441 136,508 135,460 134,040 133,592 132,924 132,088 124,992 118,856 119,776 120,612 121,540 111,812
Income per share – DilutedIncome before change in accounting $ 0.22 $ 4.17 $ 4.78 $ 2.52 $ 1.72 $ 1.46 $ 1.38 $ 0.98 $ 0.68 $ 0.55 $ 0.44 $ 0.36 $ 0.34 $ 0.25 $ 0.20 $ 0.12 $ 0.04 $ 0.08 $ 0.11 $ 0.20 $ 0.14 $ 0.11Net income $ 0.22 $ 4.17 $ 4.78 $ 2.52 $ 1.72 $ 1.46 $ 1.38 $ 0.98 $ 0.68 $ 0.55 $ 0.44 $ 0.36 $ 0.34 $ 0.25 $ 0.21 $ 0.12 $ 0.04 $ 0.08 $ 0.11 $ 0.20 $ 0.14 $ 0.11Weighted-average number of shares 164,166 164,852 168,552 162,330 151,083 150,959 154,734 149,651 149,744 153,441 149,049 147,516 145,440 142,620 133,868 132,936 125,648 118,856 119,880 120,612 121,540 111,812
SuMMARY CONSOlIDATED BAlANCE ShEET DATA (Amounts in thousands, except per share data)
At October 31, 2007 2006 2005 2004 2003 2002 2001 2000 1999 1998 1997 1996 1995 1994 1993 1992 1991 1990 1989 1988 1987 1986
Inventory $ 5,572,655 $ 6,095,702 $ 5,068,624 $ 3,878,260 $ 3,080,349 $ 2,551,061 $ 2,183,541 $ 1,712,383 $ 1,443,282 $ 1,111,863 $ 921,595 $ 772,471 $ 623,830 $ 506,347 $ 402,515 $ 287,844 $ 222,775 $ 240,155 $ 256,934 $ 206,593 $ 143,894 $ 66,543Total assets $ 7,220,316 $ 7,583,541 $ 6,343,840 $ 4,905,578 $ 3,787,391 $ 2,895,365 $ 2,532,200 $ 2,030,254 $ 1,668,062 $ 1,254,468 $ 1,118,626 $ 837,926 $ 692,457 $ 586,893 $ 475,998 $ 384,836 $ 312,424 $ 316,534 $ 348,163 $ 256,611 $ 181,765 $ 108,185Debt
Loans payable $ 696,814 $ 736,934 $ 250,552 $ 340,380 $ 281,697 $ 253,194 $ 362,712 $ 326,537 $ 213,317 $ 182,292 $ 189,579 $ 132,109 $ 59,057 $ 17,506 $ 24,779 $ 25,756 $ 49,943 $ 71,707 $ 95,508 $ 74,048 $ 55,545 $ 12,474Senior notes 1,142,306 1,141,167 1,140,028 845,665 546,669Subordinated notes 350,000 350,000 350,000 450,000 620,000 819,663 669,581 469,499 469,418 269,296 319,924 208,415 221,226 227,969 174,442 128,854 55,513 61,474 69,681 69,635 29,967 29,963Mortgage warehouse line 76,730 119,705 89,674 92,053 49,939 48,996 24,754 382 5,969Collateralized mortgage obligations 1,145 1,384 2,577 2,816 3,912 4,686 10,810 24,403 39,864 45,988 52,617Total $ 2,265,850 $ 2,347,806 $ 1,830,254 $ 1,728,098 $ 1,498,305 $ 1,121,853 $ 1,057,047 $ 796,036 $ 683,880 $ 452,972 $ 512,080 $ 343,340 $ 284,195 $ 250,161 $ 210,031 $ 179,013 $ 145,320 $ 179,169 $ 217,806 $ 143,683 $ 85,894 $ 48,406
Stockholders’ equity $ 3,527,234 $ 3,415,926 $ 2,763,571 $ 1,919,987 $ 1,476,628 $ 1,129,509 $ 912,583 $ 745,145 $ 616,334 $ 525,756 $ 385,252 $ 314,677 $ 256,659 $ 204,176 $ 167,006 $ 136,412 $ 117,925 $ 94,599 $ 85,400 $ 72,787 $ 48,842 $ 31,405Number of shares outstanding 157,008 153,899 154,943 149,642 146,644 140,432 139,112 143,580 145,814 147,742 137,102 135,674 134,552 133,692 133,276 132,348 131,248 118,736 119,652 120,168 120,268 119,972Book value per share $ 22.47 $ 22.20 $ 17.84 $ 12.83 $ 10.07 $ 8.04 $ 6.56 $ 5.19 $ 4.23 $ 3.56 $ 2.81 $ 2.32 $ 1.91 $ 1.53 $ 1.25 $ 1.03 $ 0.90 $ 0.80 $ 0.71 $ 0.61 $ 0.41 $ 0.26Return on beginning stockholders’ equity 1.0% 24.9% 42.0% 27.7% 23.0% 24.1% 28.7% 23.7% 19.3% 22.0% 20.7% 20.9% 24.5% 21.7% 20.6% 14.0% 5.3% 11.7% 18.0% 49.3% 54.7% 122.5%
hOME DATAYear Ended October 31, 2007 2006 2005 2004 2003 2002 2001 2000 1999 1998 1997 1996 1995 1994 1993 1992 1991 1990 1989 1988 1987 1986
Number of homes closed (1) 6,687 8,601 8,769 6,627 4,911 4,430 4,358 3,945 3,555 3,099 2,517 2,109 1,825 1,583 1,324 1,019 676 727 676 778 674 802Sales value of homes closed (in 000s) (1) $ 4,495,600 $ 5,945,169 $ 5,759,301 $ 3,839,451 $ 2,731,044 $ 2,279,261 $ 2,180,469 $ 1,762,930 $ 1,438,171 $ 1,206,290 $ 968,253 $ 759,303 $ 643,017 $ 501,822 $ 392,560 $ 279,841 $ 175,971 $ 198,336 $ 176,864 $ 197,027 $ 134,856 $ 124,641Revenues – percentage of completion (in 000s) $ 139,493 $ 170,111Number of homes contracted 4,440 6,164 10,372 8,684 6,132 5,070 4,314 4,364 3,799 3,387 2,701 2,398 1,846 1,716 1,595 1,202 863 612 704 656 756 832Sales value of homes contracted (in 000s) $ 3,010,013 $ 4,460,734 $ 7,152,463 $ 5,641,454 $ 3,475,992 $ 2,734,457 $ 2,158,536 $ 2,134,522 $ 1,627,849 $ 1,383,093 $ 1,069,279 $ 884,677 $ 660,467 $ 586,941 $ 490,883 $ 342,811 $ 230,324 $ 163,975 $ 185,255 $ 162,504 $ 190,680 $ 133,369At October 31, 2007 2006 2005 2004 2003 2002 2001 2000 1999 1998 1997 1996 1995 1994 1993 1992 1991 1990 1989 1988 1987 1986
Number of homes in backlog 3,950 6,533 8,805 6,709 4,652 3,342 2,702 2,746 2,327 1,892 1,551 1,367 1,078 1,025 892 621 438 251 366 338 460 378Sales value of homes in backlog (in 000s) (2) $ 2,854,435 $ 4,488,400 $ 6,014,648 $ 4,433,895 $ 2,631,900 $ 1,858,784 $ 1,403,588 $ 1,425,521 $ 1,053,929 $ 814,714 $ 627,220 $ 526,194 $ 400,820 $ 370,560 $ 285,441 $ 187,118 $ 124,148 $ 69,795 $ 104,156 $ 95,765 $ 130,288 $ 74,194Number of selling communities 315 300 230 220 200 170 155 146 140 122 116 100 97 80 67 62 42 41 40 26 21 15Home sites
Owned 37,139 41,808 35,838 29,804 29,081 25,822 25,981 22,275 23,163 15,578 12,820 12,065 9,542 6,779 5,744 5,633 3,974 4,548 5,075 4,724 2,147 1,461Optioned 22,112 31,960 47,288 30,385 18,977 15,022 13,165 10,843 11,268 14,803 9,145 5,237 5,042 4,445 4,271 3,592 3,281 2,117 2,832 4,041 7,141 4,853Total 59,251 73,768 83,126 60,189 48,058 40,844 39,146 33,118 34,431 30,381 21,965 17,302 14,584 11,224 10,015 9,225 7,255 6,665 7,907 8,765 9,288 6,314
Toll Brothers 2007 Annual Report 23
24 Toll Brothers 2007 Annual Report
RESulTS OF OPERATIONSOn December 6, 2007, we issued a press release and held a conference call to review the results of operations for our fiscal year ended October 31, 2007 and to discuss the current state of our business. The information contained in this report is the same information given in the press release and on the conference call on December 6, 2007, and we are not reconfirming or updating that information.
OVERVIEWIn fiscal 2007, we recognized $4.65 billion of revenues, as compared to $6.12 billion of revenues in fiscal 2006 and $5.79 billion in fiscal 2005. Net income in fiscal 2007 was $35.7 million, as compared to $687.2 million and $806.1 million in fiscal 2006 and fiscal 2005, respectively. We recognized $619.5 million of inventory impairment charges and write-offs in fiscal 2007, $152.0 million in fiscal 2006 and $5.1 million in fiscal 2005. In addition, we recognized $59.2 million of impairment charges on two of our investments in unconsolidated entities in our quarter ended October 31, 2007 and a $9.0 million goodwill impairment charge in our quarter ended January 31, 2007. In our quarter ended October 31, 2007, we recorded our first loss since becoming a public company in 1986. This loss was due to the continued deterioration of the market that resulted in inventory impairment charges and write-offs in our quarter ended October 31, 2007 of $255.6 million and the aforementioned $59.2 million of impairment charges related to two of our investments in unconsolidated entities. The impairment charges and write-offs recognized on inventory and investments in unconsolidated entities in the quarter were primarily located in our Arizona, California, Florida, Nevada, and Washington, D.C. markets.
Beginning in the fourth quarter of fiscal 2005 and continuing throughout fiscal 2006 and 2007 and into the first quarter of fiscal 2008, we experienced a slowdown in new contracts signed. The value of net new contracts signed in fiscal 2007 of $3.01 billion (4,440 homes) was a decline of 32.5% from the value of net new contracts signed in fiscal 2006 and a decline of 57.9% from the value of net new contracts signed in fiscal 2005. Our backlog of $2.85 billion at October 31, 2007 decreased 36.4% compared to our backlog of $4.49 billion at October 31, 2006 and decreased 52.5% compared to our backlog of $6.01 billion at October 31, 2005. Backlog includes (a) the value of homes under contract but not yet delivered to our home buyers which are accounted for using the completed contract method of accounting, and (b) the value of homes under contract but not yet delivered to our home buyers for which we use the percentage of completion accounting method less the amount of revenues we have recognized related to those homes.
We believe this slowdown is attributable to a decline in consumer confidence, an overall softening of demand for new homes, an oversupply of homes available for sale, the inability of some of our home buyers to sell their current home and the direct and indirect impact of the turmoil in the mortgage loan market. We attribute the reduction in demand to concerns on the part of prospective home buyers about the direction of home prices, due in part to the constant media attention with regard to the potential of mortgage foreclosures, many home builders’ advertising price reductions and increased sales incentives, and concerns by prospective home buyers about being able to sell their existing homes. In addition, we believe speculators and investors are no longer helping to fuel demand. We try to avoid selling homes to speculators, and we generally do not build detached homes without having a signed agreement of sale and receiving a substantial down payment from a buyer. Nonetheless, we have been impacted by an overall increase in the supply of homes available for sale in many markets, as speculators attempt to sell the homes they previously purchased or cancel contracts for homes under construction, and as those builders that as part of their business strategy were building homes in anticipation of capturing additional sales in a demand-driven market, attempt to reduce their inventories by lowering
prices and adding incentives. In addition, based on the high cancellation rates reported by us and by other builders, non-speculative buyer cancellations are also adding to the supply of homes in the marketplace. During fiscal 2007, 2006 and 2005, our customers signed gross contracts of 6,025, 7,470 and 10,869, respectively. They cancelled 1,585, 1,306 and 497 contracts during fiscal 2007, 2006 and 2005, respectively. Contract cancellations include contracts signed in the fiscal year reported as well as contracts signed in prior fiscal years. When we report contracts signed, the number and value of contracts signed is reported net of any cancellations occurring during the reporting period, whether signed in that reporting period or in a prior period. Only outstanding agreements of sale that have been signed by both the home buyer and us as of the end of the period on which we are reporting are included in backlog. Of the value of backlog reported on October 31, 2006, 2005 and 2004, home buyers subsequently cancelled approximately 19.9%, 19.2% and 16.5%, respectively.
Despite this slowdown, we believe our industry demographics remain strong due to the continuing regulation-induced constraints on lot supplies and the growing number of affluent households. We continue to seek a balance between our short-term goal of selling homes in a tough market and our long-term goal of maximizing the value of our communities. We believe that many of our communities are in locations that are difficult to replace and in markets where approvals are increasingly difficult to achieve. We believe that many of these communities have substantial embedded value that will be realizable in the future and that this value should not necessarily be sacrificed in the current soft market.
We are concerned about the dislocation in the secondary mortgage market. We maintain relationships with a widely diversified group of mortgage providers, most of which are among the largest and, we believe, most reliable in our industry. With few exceptions, the mortgage providers that provide our customers with mortgages continue to issue new commitments. Our buyers generally have been able to obtain adequate financing. Nevertheless, tightening credit standards will likely shrink the pool of potential home buyers. Mortgage market liquidity issues and higher borrowing rates may impede some of our home buyers from closing, while others may find it more difficult to sell their existing homes as their buyers face the problem of obtaining a mortgage. However, we believe that our buyers generally should be able to continue to secure mortgages, due to their typically lower loan-to-value ratios and attractive credit profiles compared to the average American home buyer. Although we cannot predict the short- and long-term liquidity of the loan markets, we caution that, with the uncertainties in the mortgage markets right now, the pace of home sales could slow further until the credit markets settle down.
In the current challenging environment, we believe our access to reliable capital and our strong balance sheet give us an important competitive advantage. Based on our experience during prior downturns in the housing market, we have learned that unexpected opportunities may arise in difficult times for those that are well-prepared. We believe that our solid financial base, our broad geographic presence, our diversified product lines and our national brand name all position us well for such opportunities now and in the future. At October 31, 2007, we had $900.3 million of cash and cash equivalents and approximately $1.22 billion available under our bank revolving credit facility which extends to March 17, 2011. We believe we have the resources available to fund these opportunities.
Notwithstanding the current market conditions, we believe geographic and product diversification, access to lower-cost capital, and strong demographics have in the past and will in the future, as market conditions improve, benefit those builders that can control land and persevere through the increasingly difficult regulatory approval process. We believe that this evolution in our industry favors the large publicly traded home building companies with the capital and expertise to control home sites and gain market share. We believe that as home builders reduce the number of home sites being taken through the approval process and the process continues to become more difficult, and as the political pressure
Management’s Discussion and Analysis
Toll Brothers 2007 Annual Report 25
from no-growth proponents continues to increase, our expertise in taking land through the approval process and our already approved land positions will allow us to grow in the years to come, as market conditions improve.
Because of the length of time that it takes to obtain the necessary approvals on a property, complete the land improvements on it, and deliver a home after a home buyer signs an agreement of sale, we are subject to many risks. We attempt to reduce certain risks by controlling land for future development through options whenever possible, thus allowing us to obtain the necessary governmental approvals before acquiring title to the land; generally commencing construction of a detached home only after executing an agreement of sale and receiving a substantial down payment from a buyer; and using subcontractors to perform home construction and land development work on a fixed-price basis. In response to current market conditions, we have been reevaluating and renegotiating many of our optioned land positions. As a result, we have reduced our land position from a high of approximately 91,200 at April 30, 2006 to approximately 59,300 lots at October 31, 2007.
In the ordinary course of doing business, we must make estimates and judgments that affect decisions on how we operate and on the reported amounts of assets, liabilities, revenues and expenses. These estimates include, but are not limited to, those related to the recognition of income and expenses; impairment of assets; estimates of future improvement and amenity costs; capitalization of costs to inventory; provisions for litigation, insurance and warranty costs; and income taxes. We base our estimates on historical experience and on various other assumptions that are believed to be reasonable under the circumstances. On an ongoing basis, we evaluate and adjust our estimates based on the information currently available. Actual results may differ from these estimates and assumptions or conditions.
At October 31, 2007, we were selling from 315 communities compared to 300 communities at October 31, 2006. We expect to be selling from approximately 300 communities at October 31, 2008.
Given the current business climate that we are operating in and the numerous uncertainties related to sales paces, sales prices, mortgage markets, cancellations, market direction and the potential for and size of future impairments, it is difficult to provide guidance for fiscal 2008. Subject to our caveats and risks reported elsewhere and the preceding caveats, we currently estimate that we will deliver between 3,900 and 5,100 homes in fiscal 2008 at an average home price of between $630,000 and $650,000 per home. We believe that, as a result of continuing incentives and slower sales per community, our cost of revenues as a percentage of revenues, before taking into account write-downs, will be higher in fiscal 2008 than in fiscal 2007. Additionally, based on fiscal 2008’s lower projected revenues, our selling, general and administrative expenses (“SG&A”), which we expect to be lower in absolute amounts in fiscal 2008 than in fiscal 2007, will likely be higher as a percentage of revenues. The foregoing estimates are identical to those given in our press release and conference call on December 6, 2007 and we are not reconfirming or updating those estimates herein.
CRITICAl ACCOuNTING POlICIESWe believe the following critical accounting policies reflect the more significant judgments and estimates used in the preparation of our consolidated financial statements.
Inventory
Inventory is stated at the lower of cost or fair value in accordance with Statement of Financial Accounting Standards (“SFAS”) No. 144, “Accounting for the Impairment or Disposal of Long-Lived Assets” (“SFAS 144”). In addition to direct land acquisition, land development and home construction costs, costs include interest, real estate taxes and direct overhead related to development and construction, which are capitalized to inventories during the period beginning with the commencement of development and ending with the completion of construction. Once a parcel of land has been approved for development, it generally takes four to five years to fully develop, sell and deliver all the homes in one
of our typical communities. Longer or shorter time periods are possible depending on the number of home sites in a community and the sales and delivery pace of the homes in a community. Our master planned communities, consisting of several smaller communities, may take up to ten years or more to complete. Because of the downturn in our business, the aforementioned estimated community lives may be significantly longer. Because our inventory is considered a long-lived asset under U.S. generally accepted accounting principles, we are required, under SFAS 144, to regularly review the carrying value of each of our communities and write down the value of those communities for which we believe the values are not recoverable.
Current Communities: When the profitability of a current community deteriorates, the sales pace declines significantly or some other factor indicates a possible impairment in the recoverability of the asset, the asset is reviewed for impairment by comparing the estimated future undiscounted cash flow for the community to its carrying value. If the estimated future undiscounted cash flow is less than the community’s carrying value, the carrying value is written down to its estimated fair value. Fair value is primarily determined by discounting the estimated future cash flow of each community. The impairment is charged to cost of revenues in the period the impairment is determined. In estimating the cash flow of a community, we use various estimates such as (a) the expected sales pace in a community based upon general economic conditions that will have a short-term or long-term impact on the market in which the community is located and competition within the market, including the number of homes/home sites available and pricing and incentives being offered in other communities owned by us or by other builders; (b) the expected sales prices and sales incentives to be offered in a community; (c) costs expended to date and expected to be incurred in the future, including, but not limited to, land and land development costs, home construction costs, interest costs and overhead costs; (d) alternative product offerings that may be offered in a community that will have an impact on sales pace, sales price, building cost or the number of homes that can be built on a particular site; and (e) alternative uses for the property such as the possibility of a sale of the entire community to another builder or the sale of individual home sites.
Future Communities: We evaluate all land held for future communities or future sections of current communities, whether owned or under contract, to determine whether or not we expect to proceed with the development of the land as originally contemplated. This evaluation encompasses the same types of estimates used for current communities described above as well as an evaluation of the regulatory environment in which the land is located and the estimated probability of obtaining the necessary approvals, the estimated time and cost it will take to obtain the approvals and the possible concessions that will be required to be given in order to obtain them. Concessions may include cash payments to fund improvement to public places such as parks and streets, dedication of a portion of the property for use by the public or as open space or a reduction in the density or size of the homes to be built. Based upon this review, we decide (a) as to land under contract to be purchased, whether the contract will likely be terminated or renegotiated, and (b) as to land we own, whether the land will likely be developed as contemplated or in an alternative manner, or should be sold. We then further determine whether costs that have been capitalized to the community are recoverable or should be written off. The write-off is charged to cost of revenues in the period that the need for the write-off is determined.
The estimates used in the determination of the estimated cash flows and fair value of a community are based on factors known to us at the time such estimates are made and our expectations of future operations and economic conditions. Should the estimates or expectations used in determining estimated fair value deteriorate in the future, we may be required to recognize additional write-downs/write-offs related to current and future communities.
Variable Interest Entities: We have a significant number of land purchase contracts, sometimes referred to herein as “land purchase contracts,” “purchase agreements,” “options” or “option agreements,” and several investments in unconsolidated entities which we evaluate in accordance with the Financial Accounting Standards Board (“FASB”) Interpretation No. 46 “Consolidation of Variable Interest Entities,
26 Toll Brothers 2007 Annual Report
an interpretation of ARB No. 51,” as amended by FIN 46R (“FIN 46”). Pursuant to FIN 46, an enterprise that absorbs a majority of the expected losses or receives a majority of the expected residual returns of a variable interest entity (“VIE”) is considered to be the primary beneficiary and must consolidate the VIE. A VIE is an entity with insufficient equity investment or in which the equity investors lack some of the characteristics of a controlling financial interest. For land purchase contracts with sellers meeting the definition of a VIE, we perform a review to determine which party is the primary beneficiary of the VIE. This review requires substantial judgment and estimation. These judgments and estimates involve assigning probabilities to various estimated cash flow possibilities relative to the entity’s expected profits and losses and the cash flows associated with changes in the fair value of the land under contract. At October 31, 2007, we determined that we were the primary beneficiary of two VIEs related to land purchase contracts and recorded inventory of $22.9 million and accrued expenses of $18.7 million.
revenue and Cost reCognItIon
Home Sales – Completed Contract Method: The construction time of our homes is generally less than one year, although some may take more than one year to complete. Revenues and cost of revenues from these home sales are recorded at the time each home is delivered and title and possession are transferred to the buyer. Closing normally occurs shortly after construction is substantially completed. In addition, we have several high-rise/mid-rise projects which do not qualify for percentage of completion accounting in accordance SFAS No. 66, “Accounting for Sales of Real Estate” (“SFAS 66”), which are included in this category of revenues and costs.
Land, land development, home construction and related costs, both incurred and estimated to be incurred in the future, are amortized to the cost of homes closed based upon the total number of homes to be constructed in each community. Any changes resulting from a change in the estimated number of homes to be constructed or in the estimated costs subsequent to the commencement of delivery of homes are allocated to the remaining undelivered homes in the community. Home construction and related costs are charged to the cost of homes closed under the specific identification method. The estimated land, common area development and related costs of master planned communities, including the cost of golf courses, net of their estimated residual value, are allocated to individual communities within a master planned community on a relative sales value basis. Any changes resulting from a change in the estimated number of homes to be constructed or in the estimated costs are allocated to the remaining home sites in each of the communities of the master planned community.
Home Sales – Percentage of Completion Method: We are developing several high-rise/mid-rise projects that will take substantially more than one year to complete. Under the provisions of SFAS 66, revenues and costs for these projects are recognized using the percentage of completion method of accounting when construction is beyond the preliminary stage, the buyer is committed to the extent of being unable to require a refund except for nondelivery of the unit, sufficient units in the project have been sold to ensure that the property will not be converted to rental property, the sales proceeds are collectible and the aggregate sales proceeds and the total cost of the project can be reasonably estimated. Revenues and costs of individual projects are recognized on the individual project’s aggregate value of units for which the home buyers have signed binding agreements of sale, less an allowance for cancellations, and are based on the percentage of total estimated construction costs that have been incurred. Total estimated revenues and construction costs are reviewed periodically, and any change is applied to current and future periods.
Land Sales: Land sales revenues and cost of revenues are recorded at the time that title and possession of the property have been transferred to the buyer. We recognize the pro rata share of land sales revenues and cost of land sales revenues to entities in which we have a 50% or less interest based upon the ownership percentage attributable to the non-Company investors. Any profit not recognized in a transaction reduces our investment in the entity or is recorded as an accrued liability on our consolidated balance sheet.
OFF-BAlANCE ShEET ARRANGEMENTSWe have investments in and advances to several joint ventures and to Toll Brothers Realty Trust Group (“Trust”) and Toll Brothers Realty Trust Group II (“Trust II”). At October 31, 2007, we had investments in and advances to these entities of $183.2 million, were committed to invest or advance an additional $355.5 million in the aggregate to these entities if needed and had guaranteed approximately $140.3 million of these entities’ indebtedness and/or loan commitments. See Notes 3 and 13 of the “Notes to Consolidated Financial Statements”, “Investments in and Advances to Unconsolidated Entities” and “Related Party Transactions” for more information regarding these entities. Our investments in these entities are accounted for using the equity method.
RESulTS OF OPERATIONS The following table compares certain income statement items related to our operations ($ amounts in millions):
2007 2006 2005
$ % $ % $ %
Revenues:Completed contract $4,495.6 $5,945.2 $5,759.3 Percentage of completion 139.5 170.1 Land sales 11.9 8.2 34.1
4,647.0 6,123.5 5,793.4
Costs of revenues:Completed contract 3,905.9 86.9 4,263.2 71.7 3,902.7 67.8Percentage of completion 109.0 78.1 132.3 77.8Land sales 8.1 67.9 7.0 85.6 24.4 71.6Interest 102.4 2.2 122.0 2.0 125.3 2.2
4,125.4 88.8 4,524.5 73.9 4,052.4 69.9Selling, general and
administrative 516.7 11.1 573.4 9.4 482.8 8.3Goodwill impairment 9.0 (Loss) income from operations (4.1) 1,025.6 1,258.2 (Loss) earnings from
unconsolidated entities (40.4) 48.4 27.7 Interest and other 115.1 52.7 41.2 Expenses related to early
retirement of debt (4.1)Income before income taxes 70.7 1,126.6 1,323.1 Income taxes 35.0 439.4 517.0 Net income $ 35.7 $ 687.2 $ 806.1
Note: Percentages for cost of revenues for completed contract, percentage of completion and land sales are based on the corresponding item under revenues. Percentages for interest expense and selling, general and administrative expenses are based on total revenues. Amounts may not add due to rounding.
Toll Brothers 2007 Annual Report 27
FISCAl 2007 COMPARED TO FISCAl 2006Unless otherwise stated, contracts signed represents a number or amount equal to the gross number or amount of contracts signed during the relevant period, less the number or amount of contracts cancelled during the relevant period, which includes contracts that were signed during the relevant period and contracts signed in prior periods.
revenues and Costs – Completed ContraCt
Revenues for fiscal 2007 were lower than those of fiscal 2006 by approximately $1.45 billion, or 24.4%. The decrease was attributable to a 22.3% decrease in the number of homes delivered and a 2.7% decrease in the average price of the homes delivered. The decrease in the number of homes delivered was primarily due to the lower backlog of homes at October 31, 2006 as compared to October 31, 2005, which was primarily the result of a 40.6% decrease in the number of contracts signed in fiscal 2006 versus fiscal 2005, and a decline of 27.6% in the number of contracts signed in fiscal 2007 as compared to fiscal 2006. The decrease in the average price of the homes delivered was due primarily to the increased sales incentives given to buyers on the homes delivered in fiscal 2007 as compared to fiscal 2006 offset in part by a slight change in the mix of homes delivered to higher priced homes.
The value of contracts signed in fiscal 2007 was $2.99 billion (4,413 homes). This represented a 32.2% decrease compared to the value of contracts signed in fiscal 2006 of $4.40 billion (6,099 homes). The decrease was attributable to a 27.6% decrease in the number of contracts signed in fiscal 2007 as compared to fiscal 2006, and a 6.3% decrease in the average value of each contract signed in fiscal 2007 as compared to fiscal 2006. We believe the decrease in the number of contracts signed is attributable to the increased number of cancellations, a decline in consumer confidence, an overall softening of demand for new homes and an oversupply of homes available for sale. The value of contracts cancelled in fiscal 2007 (including those signed in fiscal 2007 and those signed in prior periods but not cancelled until fiscal 2007) as a percentage of the gross value of contracts signed in fiscal 2007 was 27.9%, as compared to 17.8% in fiscal 2006.
We believe this slowdown is attributable to a decline in consumer confidence, an overall softening of demand for new homes, an oversupply of homes available for sale, the inability of some of our home buyers to sell their current home and the direct and indirect impact of the turmoil in the mortgage loan market. We attribute the reduction in demand to concerns on the part of prospective home buyers about the direction of home prices, due in part to the constant media attention with regard to the potential of mortgage foreclosures, many home builders’ advertising price reductions and increased sales incentives, and concerns by prospective home buyers about being able to sell their existing homes. In addition, we believe speculators and investors are no longer helping to fuel demand. We try to avoid selling homes to speculators, and we generally do not build detached homes without having a signed agreement of sale and receiving a substantial down payment from a buyer. Nonetheless, we have been impacted by an overall increase in the supply of homes available for sale in many markets, as speculators attempt to sell the homes they previously purchased or cancel contracts for homes under construction, and as those builders that as part of their business strategy were building homes in anticipation of capturing additional sales in a demand-driven market, attempt to reduce their inventories by lowering prices and adding incentives. In addition, based on the high cancellation rates reported by us and by other builders, non-speculative buyer cancellations are also adding to the supply of homes in the marketplace. The decline in the average sales price of new sales contracts signed was due primarily to a shift in the number of contracts signed to less expensive areas and/or smaller homes and the effect of increased sales incentives in fiscal 2007 as compared to fiscal 2006.
At October 31, 2007, our backlog of homes under contract accounted for under the completed contract method of accounting was $2.82 billion (3,867 homes), 34.8% lower than the $4.33 billion (6,141 homes) in backlog at October 31, 2006. The decrease in backlog at October 31, 2007 compared to
the backlog at October 31, 2006 is primarily attributable to a lower backlog at October 31, 2006 as compared to the backlog at October 31, 2005, and the decrease in the value and number of contracts signed in fiscal 2007 as compared to fiscal 2006, offset in part by the lower number of deliveries in fiscal 2007 as compared to fiscal 2006.
Home costs as a percentage of revenue were 86.9% in fiscal 2007 as compared to 71.7% in fiscal 2006. The increase in the fiscal 2007 percentage was primarily the result of the higher amount of inventory impairment charges recognized, increased sales incentives given to home buyers on the homes delivered and higher overhead costs per home delivered. In fiscal 2007 and 2006, we recognized inventory impairment charges of $619.5 million and $152.0 million, respectively. Fiscal 2007 cost of revenues as a percentage of revenues increased by approximately 2.6% due to the increased sales incentives and by 1% due to higher overhead costs per home.
revenues and Costs – perCentage of CompletIon
We are developing several projects for which we are recognizing revenues and costs using the percentage of completion method of accounting. Revenues and costs of individual projects are recognized on the individual project’s aggregate value of units for which home buyers have signed binding agreements of sale and are based on the percentage of total estimated construction costs that have been incurred. Total estimated revenues and construction costs are reviewed periodically, and any change is applied to current and future periods. In fiscal 2007 and 2006, we recognized $139.5 million and $170.1 million of revenues, respectively, and $109.0 million and $132.3 million of costs, respectively, on these projects. In fiscal 2007, cost of revenues as a percentage of revenues recognized of 78.1% was slightly higher than the fiscal 2006 percentage of 77.8%. The increase was due primarily to cost increases and a change in the mix of revenues recognized in fiscal 2007 to more costly projects. In fiscal 2007, we delivered $263.3 million (336 homes) in projects for which we are using the percentage of completion method of accounting.
At October 31, 2007, our backlog of homes in communities that we account for using the percentage of completion method of accounting was $30.2 million (net of $55.2 million of revenue recognized) compared to $154.3 million at October 31, 2006 (net of $170.1 million of revenue recognized). The decline in the backlog at October 31, 2007 is primarily the result of the recognition of revenues and a decline in contracts signed. We expect that this decline will continue as we recognize revenues in the two remaining projects where we use percentage of completion accounting, and as we sell out of these projects without replacing them with new ones that qualify under the accounting rules for the application of the percentage of completion accounting method. See “New Accounting Pronouncements” in Note 1 of our “Notes to Consolidated Financial Statements” for further information.
revenues and Costs – land sales
We are developing several communities in which we expect to sell a portion of the land to other builders or entities. The amount and profitability of land sales will vary from year to year depending upon the sale and delivery of the specific land parcels. In fiscal 2007 and 2006, land sales revenues were $11.9 million and $8.2 million, respectively, and the cost of land sales revenues was approximately 67.9% and 85.6% of land sales revenues, respectively.
Interest expense
In our communities accounted for using the completed contract method of accounting, we determine interest expense on a specific lot-by-lot basis, and for land sales we determine interest expense on a parcel-by-parcel basis. As a percentage of total revenues, interest expense varies depending on many factors, including the period of time that we owned the land, the length of time that the homes delivered during the period were under construction, and the interest rates and the amount of debt carried by us in proportion to the amount of our inventory during those periods.
28 Toll Brothers 2007 Annual Report
For projects using the percentage of completion method of accounting, interest expense is determined based on the total estimated interest for the project and the percentage of total estimated construction costs that have been incurred to date. Any change in the estimated interest expense for the project is applied to current and future periods.
Interest expense as a percentage of revenues was 2.2% in fiscal 2007, as compared to 2.0% in fiscal 2006.
sellIng, general and admInIstratIve expenses
SG&A spending decreased by $56.7 million, or 10% in fiscal 2007, as compared to fiscal 2006. The reduction in spending was due primarily to cost reductions, offset in part by the expenses resulting from the increased number of communities from which we were operating during fiscal 2007 as compared to fiscal 2006. At October 31, 2007, we had 315 selling communities, a 5% increase over the 300 selling communities we had at October 31, 2006.
goodwIll ImpaIrment
During the three-month period ended January 31, 2007, due to the continued decline of the Detroit market, we re-evaluated the carrying value of goodwill associated with a 1999 acquisition. We estimated the fair value of our assets in this market, including goodwill. Fair value was determined based on the discounted future cash flow expected to be generated in this market. Based upon this evaluation and our expectation that this market would not recover for a number of years, we determined that the related goodwill was impaired. We recognized a $9.0 million impairment charge in the three-month period ended January 31, 2007. After recognizing this charge, we did not have any goodwill remaining from this acquisition.
(loss) earnIngs from unConsolIdated entItIes
We are a participant in several joint ventures and in the Trust and Trust II. We recognize our proportionate share of the earnings from these entities. Many of our joint ventures are land development projects or high-rise/mid-rise construction projects and do not generate revenues and earnings for a number of years during the development of the property. Once development is complete, the joint ventures will generally, over a relatively short period of time, generate revenues and earnings until all the assets of the entities are sold. Because there is not a steady flow of revenues and earnings from these entities, the earnings recognized from these entities will vary significantly from period to period. In fiscal 2007, we recognized $40.4 million of losses from unconsolidated entities as compared to $48.4 million of earnings in fiscal 2006. The fiscal 2007 loss was attributable to $59.2 million of impairment charges on two of our investments in unconsolidated entities in our quarter ended October 31, 2007.
Interest and other InCome
In fiscal 2007, we recognized $115.1 million of interest and other income as compared to $52.7 million in fiscal 2006. The $62.5 million increase in fiscal 2007 was primarily the result of the recognition into income of $36.5 million of retained customer deposits in fiscal 2007 as compared to $15.4 million in fiscal 2006, a $14.8 million gain realized from the sale of our security business, a $9.9 million gain realized from the sale of our cable TV and broadband Internet business, and an $8.8 million increase in interest income in fiscal 2007 as compared to 2006.
InCome Before InCome taxes
Income before taxes in fiscal 2007 was $70.7 million, a decrease of 93.7% from the $1.13 billion earned in fiscal 2006.
InCome taxes
Income taxes were provided at an effective rate of 49.6% in fiscal 2007 as compared to 39.0% in fiscal 2006. The increase in the effective tax rate in fiscal 2007 as compared to fiscal 2006 was due primarily to lower pretax income reported in fiscal 2007 as compared to fiscal 2006 and the greater impact of individual components of the provision for income taxes on the overall rate in fiscal 2007 as compared
to the fiscal 2006 rate. The effective state income tax rate for fiscal 2007 was 21.4% as compared to 7.0% in fiscal 2006. The increase in the state tax rate was the result of the allocation of our income and losses to the various taxing jurisdictions in which we operate and the tax rates in those jurisdictions. In addition, in fiscal 2007, we reported higher tax-free income, an increase in our estimated interest provided on anticipated tax assessments and a lower amount of expiring state tax provisions as compared to fiscal 2006. We also recognized $8.7 million and $10.3 million of manufacturing and other tax credits in fiscal 2007 and fiscal 2006, respectively. As a percentage of income before taxes, the 2007 credits were significantly higher then the fiscal 2006 percentage. See Note 7 to the “Notes to Consolidated Financial Statements”, “Income Taxes,” for additional information regarding the change in the income tax rates and the impact on the financial statements.
geographIC segments
We operate in four geographic segments around the United States: the North, consisting of Connecticut, Illinois, Massachusetts, Michigan, Minnesota, New Jersey, New York, Ohio and Rhode Island; the Mid-Atlantic, consisting of Delaware, Maryland, Pennsylvania, Virginia and West Virginia; the South, consisting of Florida, Georgia, North Carolina, South Carolina, and Texas; and the West, consisting of Arizona, California, Colorado and Nevada. We stopped selling homes in Ohio in fiscal 2005 and delivered our last home in that state in fiscal 2006. The operations in Ohio were immaterial to the North segment. We acquired and opened for sale our first communities in Georgia in fiscal 2007.
The following table summarizes by geographic segments total revenues and income (loss) before income taxes for each of the years ended October 31, 2007 and 2006 ($ amounts in millions):
RevenuesIncome (loss) before
income taxes
2007 units 2006 units 2007 2006 2007 2006
North (a) 1,467 1,983 $1,087.7 $1,444.2 $ 51.2 $ 281.9 Mid-Atlantic (b) 2,137 2,697 1,340.6 1,777.9 206.4 491.8South (c) 1,631 2,017 976.9 1,192.4 (20.4) 161.8 West 1,452 1,904 1,241.8 1,709.0 (87.9) 338.5 Corporate and other (78.6) (147.4)
Total 6,687 8,601 $4,647.0 $6,123.5 $ 70.7 $ 1,126.6
(a) Includes percentage of completion revenues of $91.0 million and $110.3 million in fiscal 2007 and 2006, respectively, and land sales revenues of $3.5 million and $0.4 million in fiscal 2007 and 2006, respectively.
(b) Includes land sales revenues of $2.3 million and $0.2 million in fiscal 2007 and 2006, respectively.(c) Includes percentage of completion revenues of $48.5 million and $59.8 million in fiscal 2007 and
2006, respectively, and land sales revenues of $6.1 million and $7.4 million in fiscal 2007 and 2006, respectively.
North
Revenues in fiscal 2007 were lower than those for fiscal 2006 by $356.5 million, or 25%. The decrease in revenues was attributable to a 26% decrease in the number of homes delivered and a reduction in percentage of completion revenues of $19.3 million, offset, in part, by a 1% increase in the average price of the homes delivered. Approximately 75% of the decrease in revenues related to the New Jersey suburban markets, where the number of homes delivered decreased 37% and the average price of the homes delivered decreased 6%. The decrease in the number of homes delivered in fiscal 2007 as compared to fiscal 2006 was primarily due to the lower backlog of homes at October 31, 2006 as compared to October 31, 2005, which was the result of a 27% decrease in the number of new contracts signed in fiscal 2006 over fiscal 2005, and the increased cancellation rates by home buyers in fiscal 2007 as compared to the rates in fiscal 2006.
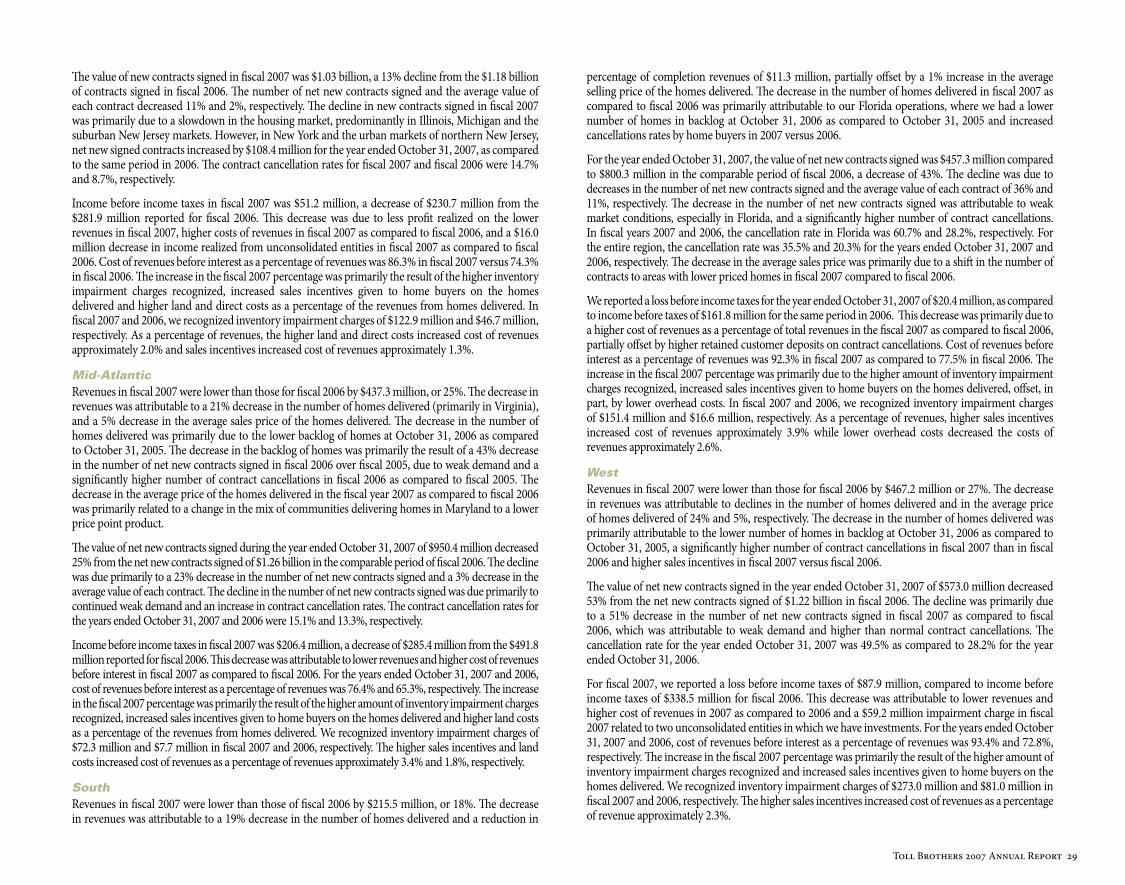
Toll Brothers 2007 Annual Report 29
The value of new contracts signed in fiscal 2007 was $1.03 billion, a 13% decline from the $1.18 billion of contracts signed in fiscal 2006. The number of net new contracts signed and the average value of each contract decreased 11% and 2%, respectively. The decline in new contracts signed in fiscal 2007 was primarily due to a slowdown in the housing market, predominantly in Illinois, Michigan and the suburban New Jersey markets. However, in New York and the urban markets of northern New Jersey, net new signed contracts increased by $108.4 million for the year ended October 31, 2007, as compared to the same period in 2006. The contract cancellation rates for fiscal 2007 and fiscal 2006 were 14.7% and 8.7%, respectively.
Income before income taxes in fiscal 2007 was $51.2 million, a decrease of $230.7 million from the $281.9 million reported for fiscal 2006. This decrease was due to less profit realized on the lower revenues in fiscal 2007, higher costs of revenues in fiscal 2007 as compared to fiscal 2006, and a $16.0 million decrease in income realized from unconsolidated entities in fiscal 2007 as compared to fiscal 2006. Cost of revenues before interest as a percentage of revenues was 86.3% in fiscal 2007 versus 74.3% in fiscal 2006. The increase in the fiscal 2007 percentage was primarily the result of the higher inventory impairment charges recognized, increased sales incentives given to home buyers on the homes delivered and higher land and direct costs as a percentage of the revenues from homes delivered. In fiscal 2007 and 2006, we recognized inventory impairment charges of $122.9 million and $46.7 million, respectively. As a percentage of revenues, the higher land and direct costs increased cost of revenues approximately 2.0% and sales incentives increased cost of revenues approximately 1.3%.
Mid-AtlanticRevenues in fiscal 2007 were lower than those for fiscal 2006 by $437.3 million, or 25%. The decrease in revenues was attributable to a 21% decrease in the number of homes delivered (primarily in Virginia), and a 5% decrease in the average sales price of the homes delivered. The decrease in the number of homes delivered was primarily due to the lower backlog of homes at October 31, 2006 as compared to October 31, 2005. The decrease in the backlog of homes was primarily the result of a 43% decrease in the number of net new contracts signed in fiscal 2006 over fiscal 2005, due to weak demand and a significantly higher number of contract cancellations in fiscal 2006 as compared to fiscal 2005. The decrease in the average price of the homes delivered in the fiscal year 2007 as compared to fiscal 2006 was primarily related to a change in the mix of communities delivering homes in Maryland to a lower price point product.
The value of net new contracts signed during the year ended October 31, 2007 of $950.4 million decreased 25% from the net new contracts signed of $1.26 billion in the comparable period of fiscal 2006. The decline was due primarily to a 23% decrease in the number of net new contracts signed and a 3% decrease in the average value of each contract. The decline in the number of net new contracts signed was due primarily to continued weak demand and an increase in contract cancellation rates. The contract cancellation rates for the years ended October 31, 2007 and 2006 were 15.1% and 13.3%, respectively.
Income before income taxes in fiscal 2007 was $206.4 million, a decrease of $285.4 million from the $491.8 million reported for fiscal 2006. This decrease was attributable to lower revenues and higher cost of revenues before interest in fiscal 2007 as compared to fiscal 2006. For the years ended October 31, 2007 and 2006, cost of revenues before interest as a percentage of revenues was 76.4% and 65.3%, respectively. The increase in the fiscal 2007 percentage was primarily the result of the higher amount of inventory impairment charges recognized, increased sales incentives given to home buyers on the homes delivered and higher land costs as a percentage of the revenues from homes delivered. We recognized inventory impairment charges of $72.3 million and $7.7 million in fiscal 2007 and 2006, respectively. The higher sales incentives and land costs increased cost of revenues as a percentage of revenues approximately 3.4% and 1.8%, respectively.
SouthRevenues in fiscal 2007 were lower than those of fiscal 2006 by $215.5 million, or 18%. The decrease in revenues was attributable to a 19% decrease in the number of homes delivered and a reduction in
percentage of completion revenues of $11.3 million, partially offset by a 1% increase in the average selling price of the homes delivered. The decrease in the number of homes delivered in fiscal 2007 as compared to fiscal 2006 was primarily attributable to our Florida operations, where we had a lower number of homes in backlog at October 31, 2006 as compared to October 31, 2005 and increased cancellations rates by home buyers in 2007 versus 2006.
For the year ended October 31, 2007, the value of net new contracts signed was $457.3 million compared to $800.3 million in the comparable period of fiscal 2006, a decrease of 43%. The decline was due to decreases in the number of net new contracts signed and the average value of each contract of 36% and 11%, respectively. The decrease in the number of net new contracts signed was attributable to weak market conditions, especially in Florida, and a significantly higher number of contract cancellations. In fiscal years 2007 and 2006, the cancellation rate in Florida was 60.7% and 28.2%, respectively. For the entire region, the cancellation rate was 35.5% and 20.3% for the years ended October 31, 2007 and 2006, respectively. The decrease in the average sales price was primarily due to a shift in the number of contracts to areas with lower priced homes in fiscal 2007 compared to fiscal 2006.
We reported a loss before income taxes for the year ended October 31, 2007 of $20.4 million, as compared to income before taxes of $161.8 million for the same period in 2006. This decrease was primarily due to a higher cost of revenues as a percentage of total revenues in the fiscal 2007 as compared to fiscal 2006, partially offset by higher retained customer deposits on contract cancellations. Cost of revenues before interest as a percentage of revenues was 92.3% in fiscal 2007 as compared to 77.5% in fiscal 2006. The increase in the fiscal 2007 percentage was primarily due to the higher amount of inventory impairment charges recognized, increased sales incentives given to home buyers on the homes delivered, offset, in part, by lower overhead costs. In fiscal 2007 and 2006, we recognized inventory impairment charges of $151.4 million and $16.6 million, respectively. As a percentage of revenues, higher sales incentives increased cost of revenues approximately 3.9% while lower overhead costs decreased the costs of revenues approximately 2.6%.
WestRevenues in fiscal 2007 were lower than those for fiscal 2006 by $467.2 million or 27%. The decrease in revenues was attributable to declines in the number of homes delivered and in the average price of homes delivered of 24% and 5%, respectively. The decrease in the number of homes delivered was primarily attributable to the lower number of homes in backlog at October 31, 2006 as compared to October 31, 2005, a significantly higher number of contract cancellations in fiscal 2007 than in fiscal 2006 and higher sales incentives in fiscal 2007 versus fiscal 2006.
The value of net new contracts signed in the year ended October 31, 2007 of $573.0 million decreased 53% from the net new contracts signed of $1.22 billion in fiscal 2006. The decline was primarily due to a 51% decrease in the number of net new contracts signed in fiscal 2007 as compared to fiscal 2006, which was attributable to weak demand and higher than normal contract cancellations. The cancellation rate for the year ended October 31, 2007 was 49.5% as compared to 28.2% for the year ended October 31, 2006.
For fiscal 2007, we reported a loss before income taxes of $87.9 million, compared to income before income taxes of $338.5 million for fiscal 2006. This decrease was attributable to lower revenues and higher cost of revenues in 2007 as compared to 2006 and a $59.2 million impairment charge in fiscal 2007 related to two unconsolidated entities in which we have investments. For the years ended October 31, 2007 and 2006, cost of revenues before interest as a percentage of revenues was 93.4% and 72.8%, respectively. The increase in the fiscal 2007 percentage was primarily the result of the higher amount of inventory impairment charges recognized and increased sales incentives given to home buyers on the homes delivered. We recognized inventory impairment charges of $273.0 million and $81.0 million in fiscal 2007 and 2006, respectively. The higher sales incentives increased cost of revenues as a percentage of revenue approximately 2.3%.
30 Toll Brothers 2007 Annual Report
OtherOther loss before income taxes for fiscal 2007 was $78.6 million, a decrease of $68.8 million from the $147.4 million loss before income taxes reported for fiscal 2006. This decline was primarily the result of lower general and administrative costs attributable to lower compensation expenses, a $14.8 million gain realized from the sale of our security business, a $9.9 million gain realized from the sale of our cable TV and broadband internet business, and higher interest income.
FISCAl 2006 COMPARED TO FISCAl 2005
home sales revenues and Costs – Completed ContraCt
Home sales revenues for fiscal 2006 were higher than those for fiscal 2005 by approximately $185.9 million, or 3%. The increase in revenues was attributable to a 5% increase in the average price of the homes delivered offset in part by a 2% decrease in the number of homes delivered. The increase in the average price of the homes delivered in fiscal 2006 was the result of higher selling prices of homes in backlog at October 31, 2005 compared to the homes in backlog at October 31, 2004 and the delivery in fiscal 2006 of fewer attached homes and age-qualified homes, which had lower average selling prices, as compared to 2005. The decrease in the number of homes delivered was primarily due to the slowdown in new contracts signed in the fourth quarter of fiscal 2005 and the first quarter of fiscal 2006 and a significant number of cancellations of contracts for homes scheduled to be delivered during fiscal 2006 from our backlog at October 31, 2005.
The value of new sales contracts signed was $4.15 billion (5,812 homes) in fiscal 2006, a 41% decrease compared to the value of contracts signed in fiscal 2005 of $7.05 billion (10,213 homes). This decrease was primarily attributable to a 43% decrease in the number of new contracts signed despite having a significantly higher number of communities open for sale in fiscal 2006 compared to fiscal 2005. At October 31, 2006 and 2005, we had 300 and 230 selling communities, respectively. The decrease in the value of new sales contracts signed was partly offset by a 5% increase in the average value of each contract.
We believe this slowdown was attributable to a decline in consumer confidence, an overall softening of demand for new homes and an oversupply of homes available for sale. We attribute the reduction in demand to concerns on the part of prospective home buyers about the direction of home prices, due in part to many home builders advertising price reductions and increased sales incentives, and concerns by the prospective home buyer about being able to sell their existing homes. In addition, we believe speculators and investors are no longer helping to fuel demand. We try to avoid selling homes to speculators, and we generally do not build detached homes without having a signed agreement of sale. Nonetheless, we have been impacted by an overall increase in the supply of homes available for sale in many markets as speculators attempt to sell the homes they previously purchased or cancel contracts for homes under construction, and as builders, who, as part of their business strategy, were building homes in anticipation of capturing additional sales in a demand-driven market attempt to reduce their inventories by lowering prices and adding incentives. In addition, based on the high cancellation rates reported by us and by other builders, non-speculative buyer cancellations are also adding to the supply of homes in the marketplace.
At October 31, 2006, our backlog of traditional homes under contract was $4.05 billion (5,801 homes), 31% lower than the $5.84 billion (8,590 homes) backlog at October 31, 2005. The decrease in backlog at October 31, 2006 compared to the backlog at October 31, 2005 was primarily attributable to the decrease in the value of new contracts signed in fiscal 2006 as compared to fiscal 2005 and to the $185.9 million more of deliveries in fiscal 2006 as compared to fiscal 2005, offset, in part, by a higher backlog at October 31, 2005 as compared to the backlog at October 31, 2004.
Cost of revenues before interest expense as a percentage of home sales revenue was higher in fiscal 2006 as compared to fiscal 2005. The increase was primarily the result of higher inventory write-offs, the cost of land and construction increasing faster than selling prices, higher sales incentives given on the homes delivered
in fiscal 2006 as compared to those delivered in fiscal 2005 and higher overhead costs. We recognized $152.0 million of write-downs and/or write-offs of costs related to current and future communities in fiscal 2006 as compared to $5.1 million in fiscal 2005. The fiscal 2006 write-offs were attributable primarily to the write-off of deposits and predevelopment costs attributable to a number of land purchase contracts that we decided not to go forward with (primarily in California and Florida) and the write-down of the carrying cost of several active communities (primarily in California and Michigan.)
home sales revenues and Costs – perCentage of CompletIon
We are developing several projects for which we are recognizing revenues and costs using the percentage of completion method of accounting. Revenues and costs of individual projects are recognized on the individual project’s aggregate value of units for which home buyers have signed binding agreements of sale and are based on the percentage of total estimated construction costs that have been incurred. Total estimated revenues and construction costs are reviewed periodically and any change is applied to current and future periods. We began recognizing revenue and costs using percentage of completion accounting on several projects in fiscal 2006. In fiscal 2006, we recognized $170.1 million of revenues and $132.3 million of costs before interest expense on these projects. At October 31, 2006, our backlog of homes in communities that we account for using the percentage of completion method of accounting was $154.3 million (net of $170.1 million of revenue recognized) compared to $152.5 million at October 31, 2005.
land sales revenues and Costs
We are developing several communities in which we expect to sell a portion of the land to other builders or entities. The amount and profitability of land sales will vary from period to period depending upon the timing of the sale and delivery of the specific land parcels. Land sales revenues were $8.2 million in fiscal 2006 as compared to $34.1 million in fiscal 2005. Cost of land sales revenues before interest expense was approximately $7.0 million in fiscal 2006 as compared to $24.4 million in fiscal 2005.
Interest expense
We determine interest expense on a specific lot-by-lot basis for our traditional home building operations and on a parcel-by-parcel basis for land sales. As a percentage of total revenues, interest expense varies depending on many factors, including the period of time that we owned the land, the length of time that the homes delivered during the period were under construction, and the interest rates and the amount of debt carried by us in proportion to the amount of our inventory during those periods. Interest expense for projects using the percentage of completion method of revenue recognition is determined based on the total estimated interest for the project and the percentage of total estimated construction costs that have been incurred to date. As a percentage of total revenues, interest was 2.0% in fiscal 2006 as compared to 2.2% in fiscal 2005.
sellIng, general and admInIstratIve expenses
SG&A spending increased by $90.6 million, or 19%, in fiscal 2006 as compared to fiscal 2005. The increased spending was principally due to the costs associated with the increase in the number of selling communities that we had during fiscal 2006 as compared to fiscal 2005 and the expensing of stock option awards pursuant to SFAS No. 123 (revised 2004), “Share-Based Payment” in fiscal 2006 of $26.8 million, which expense we did not have in fiscal 2005.
InCome from operatIons
Income from operations decreased $232.7 million in fiscal 2006 compared to fiscal 2005. As a percentage of total revenues, income from operations was 16.7% in fiscal 2006 as compared to 21.7% in fiscal 2005.
earnIngs from unConsolIdated entItIes
We are a participant in several joint ventures with unrelated parties and in the Trust and Trust II. We recognize our proportionate share of the earnings from these entities. See Note 3 of “Notes to the Consolidated Financial Statements”, “Investments in and Advances to Unconsolidated Entities”
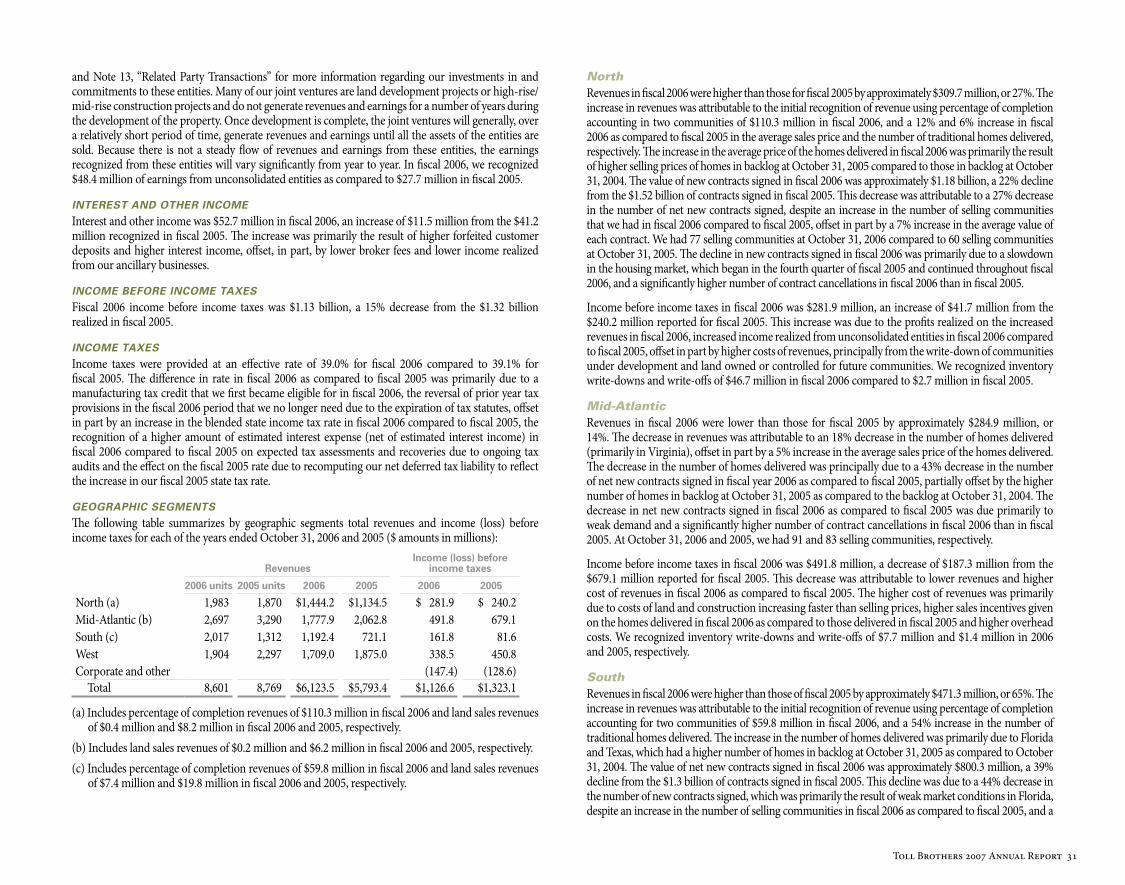
Toll Brothers 2007 Annual Report 31
and Note 13, “Related Party Transactions” for more information regarding our investments in and commitments to these entities. Many of our joint ventures are land development projects or high-rise/mid-rise construction projects and do not generate revenues and earnings for a number of years during the development of the property. Once development is complete, the joint ventures will generally, over a relatively short period of time, generate revenues and earnings until all the assets of the entities are sold. Because there is not a steady flow of revenues and earnings from these entities, the earnings recognized from these entities will vary significantly from year to year. In fiscal 2006, we recognized $48.4 million of earnings from unconsolidated entities as compared to $27.7 million in fiscal 2005.
Interest and other InCome
Interest and other income was $52.7 million in fiscal 2006, an increase of $11.5 million from the $41.2 million recognized in fiscal 2005. The increase was primarily the result of higher forfeited customer deposits and higher interest income, offset, in part, by lower broker fees and lower income realized from our ancillary businesses.
InCome Before InCome taxes
Fiscal 2006 income before income taxes was $1.13 billion, a 15% decrease from the $1.32 billion realized in fiscal 2005.
InCome taxes
Income taxes were provided at an effective rate of 39.0% for fiscal 2006 compared to 39.1% for fiscal 2005. The difference in rate in fiscal 2006 as compared to fiscal 2005 was primarily due to a manufacturing tax credit that we first became eligible for in fiscal 2006, the reversal of prior year tax provisions in the fiscal 2006 period that we no longer need due to the expiration of tax statutes, offset in part by an increase in the blended state income tax rate in fiscal 2006 compared to fiscal 2005, the recognition of a higher amount of estimated interest expense (net of estimated interest income) in fiscal 2006 compared to fiscal 2005 on expected tax assessments and recoveries due to ongoing tax audits and the effect on the fiscal 2005 rate due to recomputing our net deferred tax liability to reflect the increase in our fiscal 2005 state tax rate.
geographIC segments
The following table summarizes by geographic segments total revenues and income (loss) before income taxes for each of the years ended October 31, 2006 and 2005 ($ amounts in millions):
RevenuesIncome (loss) before
income taxes
2006 units 2005 units 2006 2005 2006 2005
North (a) 1,983 1,870 $1,444.2 $1,134.5 $ 281.9 $ 240.2 Mid-Atlantic (b) 2,697 3,290 1,777.9 2,062.8 491.8 679.1South (c) 2,017 1,312 1,192.4 721.1 161.8 81.6 West 1,904 2,297 1,709.0 1,875.0 338.5 450.8 Corporate and other (147.4) (128.6)
Total 8,601 8,769 $6,123.5 $5,793.4 $1,126.6 $1,323.1
(a) Includes percentage of completion revenues of $110.3 million in fiscal 2006 and land sales revenues of $0.4 million and $8.2 million in fiscal 2006 and 2005, respectively.
(b) Includes land sales revenues of $0.2 million and $6.2 million in fiscal 2006 and 2005, respectively.(c) Includes percentage of completion revenues of $59.8 million in fiscal 2006 and land sales revenues
of $7.4 million and $19.8 million in fiscal 2006 and 2005, respectively.
North Revenues in fiscal 2006 were higher than those for fiscal 2005 by approximately $309.7 million, or 27%. The increase in revenues was attributable to the initial recognition of revenue using percentage of completion accounting in two communities of $110.3 million in fiscal 2006, and a 12% and 6% increase in fiscal 2006 as compared to fiscal 2005 in the average sales price and the number of traditional homes delivered, respectively. The increase in the average price of the homes delivered in fiscal 2006 was primarily the result of higher selling prices of homes in backlog at October 31, 2005 compared to those in backlog at October 31, 2004. The value of new contracts signed in fiscal 2006 was approximately $1.18 billion, a 22% decline from the $1.52 billion of contracts signed in fiscal 2005. This decrease was attributable to a 27% decrease in the number of net new contracts signed, despite an increase in the number of selling communities that we had in fiscal 2006 compared to fiscal 2005, offset in part by a 7% increase in the average value of each contract. We had 77 selling communities at October 31, 2006 compared to 60 selling communities at October 31, 2005. The decline in new contracts signed in fiscal 2006 was primarily due to a slowdown in the housing market, which began in the fourth quarter of fiscal 2005 and continued throughout fiscal 2006, and a significantly higher number of contract cancellations in fiscal 2006 than in fiscal 2005.
Income before income taxes in fiscal 2006 was $281.9 million, an increase of $41.7 million from the $240.2 million reported for fiscal 2005. This increase was due to the profits realized on the increased revenues in fiscal 2006, increased income realized from unconsolidated entities in fiscal 2006 compared to fiscal 2005, offset in part by higher costs of revenues, principally from the write-down of communities under development and land owned or controlled for future communities. We recognized inventory write-downs and write-offs of $46.7 million in fiscal 2006 compared to $2.7 million in fiscal 2005.
Mid-AtlanticRevenues in fiscal 2006 were lower than those for fiscal 2005 by approximately $284.9 million, or 14%. The decrease in revenues was attributable to an 18% decrease in the number of homes delivered (primarily in Virginia), offset in part by a 5% increase in the average sales price of the homes delivered. The decrease in the number of homes delivered was principally due to a 43% decrease in the number of net new contracts signed in fiscal year 2006 as compared to fiscal 2005, partially offset by the higher number of homes in backlog at October 31, 2005 as compared to the backlog at October 31, 2004. The decrease in net new contracts signed in fiscal 2006 as compared to fiscal 2005 was due primarily to weak demand and a significantly higher number of contract cancellations in fiscal 2006 than in fiscal 2005. At October 31, 2006 and 2005, we had 91 and 83 selling communities, respectively.
Income before income taxes in fiscal 2006 was $491.8 million, a decrease of $187.3 million from the $679.1 million reported for fiscal 2005. This decrease was attributable to lower revenues and higher cost of revenues in fiscal 2006 as compared to fiscal 2005. The higher cost of revenues was primarily due to costs of land and construction increasing faster than selling prices, higher sales incentives given on the homes delivered in fiscal 2006 as compared to those delivered in fiscal 2005 and higher overhead costs. We recognized inventory write-downs and write-offs of $7.7 million and $1.4 million in 2006 and 2005, respectively.
SouthRevenues in fiscal 2006 were higher than those of fiscal 2005 by approximately $471.3 million, or 65%. The increase in revenues was attributable to the initial recognition of revenue using percentage of completion accounting for two communities of $59.8 million in fiscal 2006, and a 54% increase in the number of traditional homes delivered. The increase in the number of homes delivered was primarily due to Florida and Texas, which had a higher number of homes in backlog at October 31, 2005 as compared to October 31, 2004. The value of net new contracts signed in fiscal 2006 was approximately $800.3 million, a 39% decline from the $1.3 billion of contracts signed in fiscal 2005. This decline was due to a 44% decrease in the number of new contracts signed, which was primarily the result of weak market conditions in Florida, despite an increase in the number of selling communities in fiscal 2006 as compared to fiscal 2005, and a
32 Toll Brothers 2007 Annual Report
significantly higher number of contract cancellations in fiscal 2006 than in fiscal 2005, partially offset by a 10% increase in the average selling price of new signed contracts. At October 31, 2006, we had 70 selling communities compared to 49 selling communities at October 31, 2005.
Income before income taxes in fiscal 2006 was $161.8 million, an increase of $80.2 million from fiscal 2005 income before income taxes of $81.6 million. This increase was due to the profits realized on the increased revenues in fiscal 2006, selling, general and administrative costs decreasing as a percentage of revenues as the result of efficiencies gained from the increase in the number of homes delivered and lower cost of revenues as a percentage of total revenues. The lower cost of revenues percentage was principally due to selling prices increasing faster than costs of land and construction, offset in part by higher inventory write-downs and write-offs. We recognized inventory write-downs and write-offs of $16.6 million in fiscal 2006 compared to $0.7 million in fiscal 2005.
WestRevenues in fiscal 2006 were lower than those of fiscal 2005 by approximately $166.0 million, or 9%. The decrease in revenues was attributable to a 17% decrease in the number of homes delivered, offset by a 10% increase in the average sales price. The decrease in the number of homes delivered was primarily due to California which had a lower number of homes in backlog at October 31, 2005 as compared to October 31, 2004, and a significantly higher number of contract cancellations in fiscal 2006 than in fiscal 2005, offset in part by an increase in the number of homes closed in the other states in the geographic segment which had a higher number of homes in backlog at October 31, 2005 as compared to October 31, 2004. At October 31, 2006 and 2005, we had 62 and 38 selling communities, respectively. The increase in the average sales price of the homes delivered in fiscal 2006 was the result of higher selling prices of homes in backlog at October 31, 2005 compared to the homes in backlog at October 31, 2004, and the delivery of fewer lower-priced homes. The value of net new contracts signed in fiscal 2006, approximately $1.2 billion, decreased 41% from fiscal 2005 new contracts signed of approximately $2.1 billion. The decline was due primarily to weak demand and higher than normal contract cancellations in fiscal 2006, offset in part by the higher number of selling communities.
Income before income taxes in fiscal 2006 was $338.5 million, a decrease of $112.3 million from fiscal 2005 income before income taxes of $450.8 million. This decrease was due to the decrease in revenues in fiscal 2006, the higher cost of revenues as a percentage of total revenues (principally related to the write-downs and write-offs of communities under development and land owned or controlled for future communities and higher costs related to the inefficiencies related to the slowdown in construction) and higher selling, general and administrative costs, partially offset by increased income realized from unconsolidated entities in fiscal 2006 compared to fiscal 2005. We recognized inventory write-downs and write-offs of $81.0 million in fiscal 2006 compared to $0.1 million in fiscal 2005.
CAPITAl RESOuRCES AND lIQuIDITY Funding for our business has been provided principally by cash flow from operating activities, unsecured bank borrowings and the public debt and equity markets. We have used our cash flow from operating activities, bank borrowings and the proceeds of public debt and equity offerings to acquire additional land for new communities, fund additional expenditures for land development, fund construction costs needed to meet the requirements of our backlog and the increasing number of communities in which we were offering homes for sale, invest in unconsolidated entities, repurchase our stock, and repay debt.
In fiscal 2007, we generated approximately $267.8 million of cash including $330.5 million of cash flow from operating activities. Cash flow from operating activities in fiscal 2007 was generated primarily from net income, the commencement of deliveries of units accounted for using the percentage of completion method of accounting and the decrease in home sites owned during the period from 41,800 lots at
October 31, 2006 to 37,100 at October 31, 2007, offset, in part, by our spending for inventory as we continued to improve land that we owned, continued construction spending in existing communities and the opening of additional high density communities and the funding of the cost of the increased number of speculative units that we had in our inventory as a result of contract cancellations.
At October 31, 2007, the aggregate purchase price of land parcels under option and purchase agreements was approximately $2.33 billion (including $1.21 billion of land to be acquired from joint ventures in which we have invested). Of the $2.33 billion of land purchase commitments, we had paid or deposited $130.5 million and had invested in or guaranteed loans on behalf of the aforementioned joint ventures of $196.2 million. The purchases of these land parcels are scheduled over the next several years.
In general, cash flow from operating activities assumes that, as each home is delivered, we will purchase a home site to replace it. Because we own several years’ supply of home sites, we do not need to buy home sites immediately to replace the ones delivered. In addition, we generally do not begin construction of our single-family detached homes until we have a signed contract with the home buyer, although in fiscal 2006 and 2007, due to an extremely high cancellation rate of customer contracts and the increase in the number of attached-home communities that we were operating from, the number of speculative homes in our inventory increased significantly. In fiscal 2007, the value of net new contracts signed decreased 32.5% versus fiscal 2006. In fiscal 2006, the value of net new contracts signed with home buyers decreased by 37.6% from fiscal 2005. Should our business continue to decline significantly, we believe that our inventory levels would continue to decrease, as we complete and deliver the homes under construction but do not commence construction of as many new homes, complete the improvements on the land we already own and sell and deliver the speculative homes that are currently in inventory, resulting in an increase in our cash flow from operations. In addition, we might continue to delay or curtail our acquisition of additional land, as we did in fiscal 2007 and the second half of fiscal 2006, which would further reduce our inventory levels and cash needs. We decreased our home sites owned and controlled at October 31, 2007 by approximately 20% from the October 31, 2006 level and by 35% from the April 30, 2006 level, the high point of lots owned and controlled, in response to the deterioration of the housing market.
During the past several years, we have had a significant amount of cash invested in either short-term cash equivalents or short-term interest-bearing marketable securities. In addition, we have made a number of investments in unconsolidated entities related to the acquisition and development of land for future home sites or in entities that are constructing or converting apartment buildings into luxury condominiums. Our investment activities related to marketable securities and investments in and distributions of investments from unconsolidated entities are contained in the Consolidated Statements of Cash Flows in the section “Cash flow from investing activities.”
We have a $1.89 billion credit facility consisting of a $1.56 billion unsecured revolving credit facility and a $331.7 million term loan facility (collectively, the “Credit Facility”) with 35 banks, which extends to March 2011. At October 31, 2007, interest was payable on borrowings under the revolving credit facility at 0.475% (subject to adjustment based upon our corporate debt rating and leverage ratios) above the Eurodollar rate or at other specified variable rates as selected by us from time to time. At October 31, 2007, we had no outstanding borrowings against the revolving credit facility but had letters of credit of approximately $339.0 million outstanding under it. Under the term loan facility, interest is payable at 0.50% (subject to adjustment based upon our corporate debt rating and leverage ratios) above the Eurodollar rate or at other specified variable rates as selected by us from time to time. At October 31, 2007, interest was payable on the term loan at 5.53%.
We believe that we will be able to continue to fund our operations and meet our contractual obligations through a combination of existing cash resources and our existing sources of credit.
Toll Brothers 2007 Annual Report 33
CONTRACTuAl OBlIGATIONS The following table summarizes our estimated contractual payment obligations at October 31, 2007 (amounts in millions):
2008 2009 - 2010 2011 - 2012 Thereafter Total
Senior and senior subordinated notes (a) $ 94.7 $ 189.4 $ 505.7 $1,284.9 $2,074.7
Loans payable (a) 136.0 235.2 415.5 13.9 800.6Mortgage company
warehouse loan (a) 78.9 78.9Operating lease obligations 18.8 27.2 12.9 22.6 81.5Purchase obligations (b) 760.1 802.2 271.3 778.5 2,612.1Retirement plans (c) 6.8 5.7 8.4 32.7 53.6Other 0.7 1.4 1.4 0.7 4.2
$1,096.0 $1,261.1 $1,215.2 $2,133.3 $5,705.6
(a) Amounts include estimated annual interest payments until maturity of the debt. Of the amounts indicated, $1.5 billion of the senior and senior subordinated notes, $696.8 million of loans payable, and $76.7 million of the mortgage company warehouse loan were recorded on the October 31, 2007 Consolidated Balance Sheet.
(b) Amounts represent our expected acquisition of land under options or purchase agreements and the estimated remaining amount of the contractual obligation for land development agreements secured by letters of credit and surety bonds.
(c) Amounts represent our obligations under our 401(k), deferred compensation and supplemental executive retirement plans. Of the total amount indicated, $33.6 million has been recorded on the October 31, 2007 Consolidated Balance Sheet.
INFlATIONThe long-term impact of inflation on us is manifested in increased costs for land, land development, construction and overhead, as well as in increased sales prices. We generally contract for land significantly before development and sales efforts begin. Accordingly, to the extent land acquisition costs are fixed, increases or decreases in the sales prices of homes may affect our profits. Because the sales price of each of our homes is fixed at the time a buyer enters into a contract to acquire a home, and because we generally contract to sell our detached homes before we begin construction, any inflation of costs in excess of those anticipated may result in lower gross margins. We generally attempt to minimize that effect by entering into fixed-price contracts with our subcontractors and material suppliers for specified periods of time, which generally do not exceed one year.
In general, housing demand is adversely affected by increases in interest rates and housing costs. Interest rates, the length of time that land remains in inventory and the proportion of inventory that is financed affect our interest costs. If we are unable to raise sales prices enough to compensate for higher costs, or if mortgage interest rates increase significantly, affecting our prospective buyers’ ability to adequately finance home purchases, our revenues, gross margins and net income would be adversely affected. Increases in sales prices, whether the result of inflation or demand, may affect the ability of prospective buyers to afford new homes.
QuANTITATIVE AND QuAlITATIVE DISClOSuRES ABOuT MARKET RISKWe are exposed to market risk primarily due to fluctuations in interest rates. We utilize both fixed-rate and variable-rate debt. For fixed-rate debt, changes in interest rates generally affect the fair market value of the debt instrument, but not our earnings or cash flow. Conversely, for variable-rate debt, changes in interest rates generally do not affect the fair market value of the debt instrument but do affect our earnings and cash flow. We do not have the obligation to prepay fixed-rate debt prior to maturity, and, as a result, interest rate risk and changes in fair market value should not have a significant impact on such debt until we are required to refinance such debt.
At October 31, 2007, our debt obligations, principal cash flows by scheduled maturity, weighted-average interest rates, and estimated fair value were as follows ($ amounts in thousands):
Fixed-Rate Debt Variable-Rate Debt (a)(b)
Fiscal Year of Maturity Amount
Weighted-Average
Interest Rate Amount
Weighted-Average
Interest Rate
2008 $ 72,113 6.72% $104,876 6.76%2009 26,483 7.17% 135,802 5.45%2010 18,273 6.43% 150 3.48%2011 270,335 7.91% 331,817 5.53%2012 150,000 8.25%Thereafter 1,150,850 5.72% 12,845 3.48%Discount (7,694)Total $1,680,360 6.37% $585,490 5.69%Fair value at
October 31, 2007 $1,610,711 $585,490
(a) We have a $1.89 billion credit facility consisting of a $1.56 billion unsecured revolving credit facility and a $331.7 million term loan facility (collectively, the “Credit Facility”) with 35 banks, which extends to March 17, 2011. At October 31, 2007, interest was payable on borrowings under the revolving credit facility at 0.475% (subject to adjustment based upon our corporate debt rating and leverage ratios) above the Eurodollar rate or at other specified variable rates as selected by us from time to time. At October 31, 2007, we had no outstanding borrowings against the revolving credit facility, but had letters of credit of approximately $339.0 million outstanding under it. Under the term loan facility, interest is payable at 0.50% (subject to adjustment based upon our corporate debt rating and leverage ratios) above the Eurodollar rate or at other specified variable rates as selected by us from time to time. At October 31, 2007, interest was payable on the $331.7 million term loan at 5.53%.
(b) At October 31, 2007, our mortgage subsidiary had a $150 million line of credit with four banks to fund mortgage originations. The line is due within 90 days of demand by the banks and bears interest at the banks’ overnight rate plus an agreed-upon margin. At October 31, 2007, the subsidiary had $76.7 million outstanding under the line at an average interest rate of 5.73%. Borrowings under this line are included in the fiscal 2008 maturities. In November 2007, the bank line was reduced to $125 million and three banks.
Based upon the amount of variable-rate debt outstanding at October 31, 2007, and holding the variable-rate debt balance constant, each 1% increase in interest rates would increase the interest incurred by us by approximately $5.9 million per year.
34 Toll Brothers 2007 Annual Report
MANAGEMENT’S ANNuAl REPORT ON INTERNAl CONTROl OVER FINANCIAl REPORTINGOur management is responsible for establishing and maintaining adequate internal control over financial reporting, as such term is defined in the Securities Exchange Act Rule 13a-15(f). Internal control over financial reporting is a process designed to provide reasonable assurance regarding the reliability of financial reporting and the preparation of financial statements for external purposes in accordance with generally accepted accounting principles. Internal control over financial reporting includes those policies and procedures that: (i) pertain to the maintenance of records that in reasonable detail accurately and fairly reflect the transactions and dispositions of the assets of the company; (ii) provide reasonable assurance that transactions are recorded as necessary to permit preparation of financial statements in accordance with generally accepted accounting principles, and that receipts and expenditures of the company are being made only in accordance with authorizations of management and directors of the company; and (iii) provide reasonable assurance regarding prevention or timely detection of unauthorized acquisition, use, or disposition of the company’s assets that could have a material effect on the financial statements. Because of its inherent limitations, internal control over financial reporting may not prevent or detect misstatements. Also, projections of any evaluation of effectiveness to future periods are subject to the risk that controls may become inadequate because of changes in conditions, or that the degree of compliance with the policies or procedures may deteriorate.
Under the supervision and with the participation of our management, including our principal executive officer and our principal financial officer, we conducted an evaluation of the effectiveness of our internal control over financial reporting based on the framework in Internal Control – Integrated Framework issued by the Committee of Sponsoring Organizations of the Treadway Commission. Based on this evaluation under the framework in Internal Control – Integrated Framework, our management concluded that our internal control over financial reporting was effective as of October 31, 2007.
Toll Brothers, Inc. ’s independent registered public accounting firm, Ernst & Young LLP, has issued an attestation report, which is included herein, on the effectiveness of Toll Brothers, Inc. ’s internal control over financial reporting.
REPORT OF INDEPENDENT REGISTERED PuBlIC ACCOuNTING FIRM ThE BOARD OF DIRECTORS AND STOCKhOlDERS OF TOll BROThERS, INC.We have audited Toll Brothers, Inc. ’s internal control over financial reporting as of October 31, 2007, based on criteria established in Internal Control – Integrated Framework issued by the Committee of Sponsoring Organizations of the Treadway Commission (the COSO criteria). Toll Brothers, Inc. ’s management is responsible for maintaining effective internal control over financial reporting, and for its assessment of the effectiveness of internal control over financial reporting included in the accompanying Management’s Annual Report on Internal Control Over Financial Reporting. Our responsibility is to express an opinion on the Company’s internal control over financial reporting based on our audit.
We conducted our audit in accordance with the standards of the Public Company Accounting Oversight Board (United States). Those standards require that we plan and perform the audit to obtain reasonable assurance about whether effective internal control over financial reporting was maintained in all material respects. Our audit included obtaining an understanding of internal control over financial reporting, assessing the risk that a material weakness exists, testing and evaluating the design and operating effectiveness of internal control based on the assessed risk, and performing such other procedures as we considered necessary in the circumstances. We believe that our audit provides a reasonable basis for our opinion.
A company’s internal control over financial reporting is a process designed to provide reasonable assurance regarding the reliability of financial reporting and the preparation of financial statements for external purposes in accordance with generally accepted accounting principles. A company’s internal control over financial reporting includes those policies and procedures that (1) pertain to the maintenance of records that, in reasonable detail, accurately and fairly reflect the transactions and dispositions of the assets of the company; (2) provide reasonable assurance that transactions are recorded as necessary to permit preparation of financial statements in accordance with generally accepted accounting principles, and that receipts and expenditures of the company are being made only in accordance with authorizations of management and directors of the company; and (3) provide reasonable assurance regarding prevention or timely detection of unauthorized acquisition, use, or disposition of the company’s assets that could have a material effect on the financial statements.
Because of its inherent limitations, internal control over financial reporting may not prevent or detect misstatements. Also, projections of any evaluation of effectiveness to future periods are subject to the risk that controls may become inadequate because of changes in conditions, or that the degree of compliance with the policies or procedures may deteriorate.
In our opinion, Toll Brothers, Inc. maintained, in all material respects, effective internal control over financial reporting as of October 31, 2007, based on the COSO criteria.
We also have audited, in accordance with the standards of the Public Company Accounting Oversight Board (United States), the consolidated balance sheets of Toll Brothers, Inc. and subsidiaries as of October 31, 2007 and 2006, and the related consolidated statements of income, changes in stockholders’ equity, and cash flows for each of the three years in the period ended October 31, 2007 of Toll Brothers, Inc. and subsidiaries and our report dated December 20, 2007 expressed an unqualified opinion thereon.
Ernst & Young LLP Philadelphia, Pennsylvania December 20, 2007
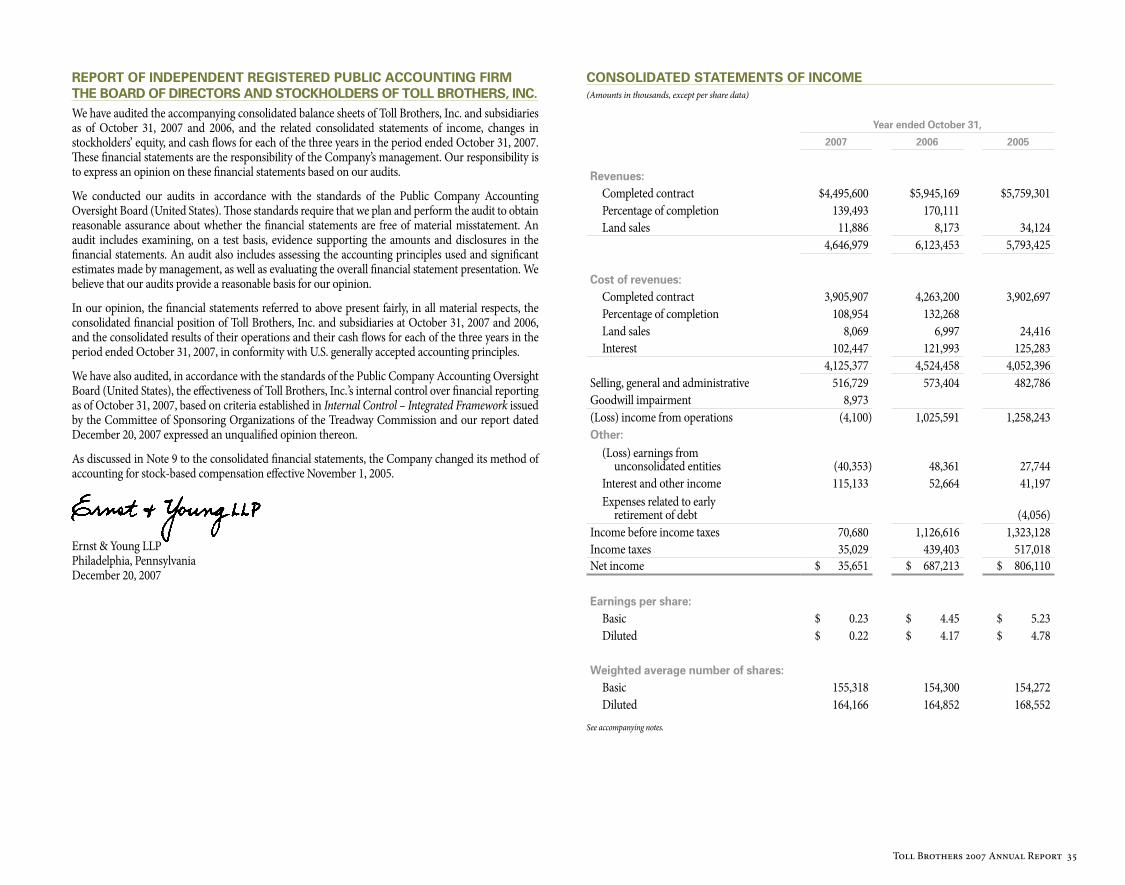
Toll Brothers 2007 Annual Report 35
REPORT OF INDEPENDENT REGISTERED PuBlIC ACCOuNTING FIRM ThE BOARD OF DIRECTORS AND STOCKhOlDERS OF TOll BROThERS, INC.We have audited the accompanying consolidated balance sheets of Toll Brothers, Inc. and subsidiaries as of October 31, 2007 and 2006, and the related consolidated statements of income, changes in stockholders’ equity, and cash flows for each of the three years in the period ended October 31, 2007. These financial statements are the responsibility of the Company’s management. Our responsibility is to express an opinion on these financial statements based on our audits.
We conducted our audits in accordance with the standards of the Public Company Accounting Oversight Board (United States). Those standards require that we plan and perform the audit to obtain reasonable assurance about whether the financial statements are free of material misstatement. An audit includes examining, on a test basis, evidence supporting the amounts and disclosures in the financial statements. An audit also includes assessing the accounting principles used and significant estimates made by management, as well as evaluating the overall financial statement presentation. We believe that our audits provide a reasonable basis for our opinion.
In our opinion, the financial statements referred to above present fairly, in all material respects, the consolidated financial position of Toll Brothers, Inc. and subsidiaries at October 31, 2007 and 2006, and the consolidated results of their operations and their cash flows for each of the three years in the period ended October 31, 2007, in conformity with U.S. generally accepted accounting principles.
We have also audited, in accordance with the standards of the Public Company Accounting Oversight Board (United States), the effectiveness of Toll Brothers, Inc. ’s internal control over financial reporting as of October 31, 2007, based on criteria established in Internal Control – Integrated Framework issued by the Committee of Sponsoring Organizations of the Treadway Commission and our report dated December 20, 2007 expressed an unqualified opinion thereon.
As discussed in Note 9 to the consolidated financial statements, the Company changed its method of accounting for stock-based compensation effective November 1, 2005.
Ernst & Young LLP Philadelphia, Pennsylvania December 20, 2007
CONSOlIDATED STATEMENTS OF INCOME (Amounts in thousands, except per share data)
Year ended October 31,
2007 2006 2005
Revenues:Completed contract $4,495,600 $5,945,169 $5,759,301 Percentage of completion 139,493 170,111 Land sales 11,886 8,173 34,124
4,646,979 6,123,453 5,793,425
Cost of revenues:Completed contract 3,905,907 4,263,200 3,902,697 Percentage of completion 108,954 132,268 Land sales 8,069 6,997 24,416 Interest 102,447 121,993 125,283
4,125,377 4,524,458 4,052,396 Selling, general and administrative 516,729 573,404 482,786 Goodwill impairment 8,973 (Loss) income from operations (4,100) 1,025,591 1,258,243 Other:
(Loss) earnings from unconsolidated entities (40,353) 48,361 27,744
Interest and other income 115,133 52,664 41,197 Expenses related to early
retirement of debt (4,056)Income before income taxes 70,680 1,126,616 1,323,128 Income taxes 35,029 439,403 517,018 Net income $ 35,651 $ 687,213 $ 806,110
Earnings per share:Basic $ 0.23 $ 4.45 $ 5.23 Diluted $ 0.22 $ 4.17 $ 4.78
Weighted average number of shares:Basic 155,318 154,300 154,272 Diluted 164,166 164,852 168,552
See accompanying notes.
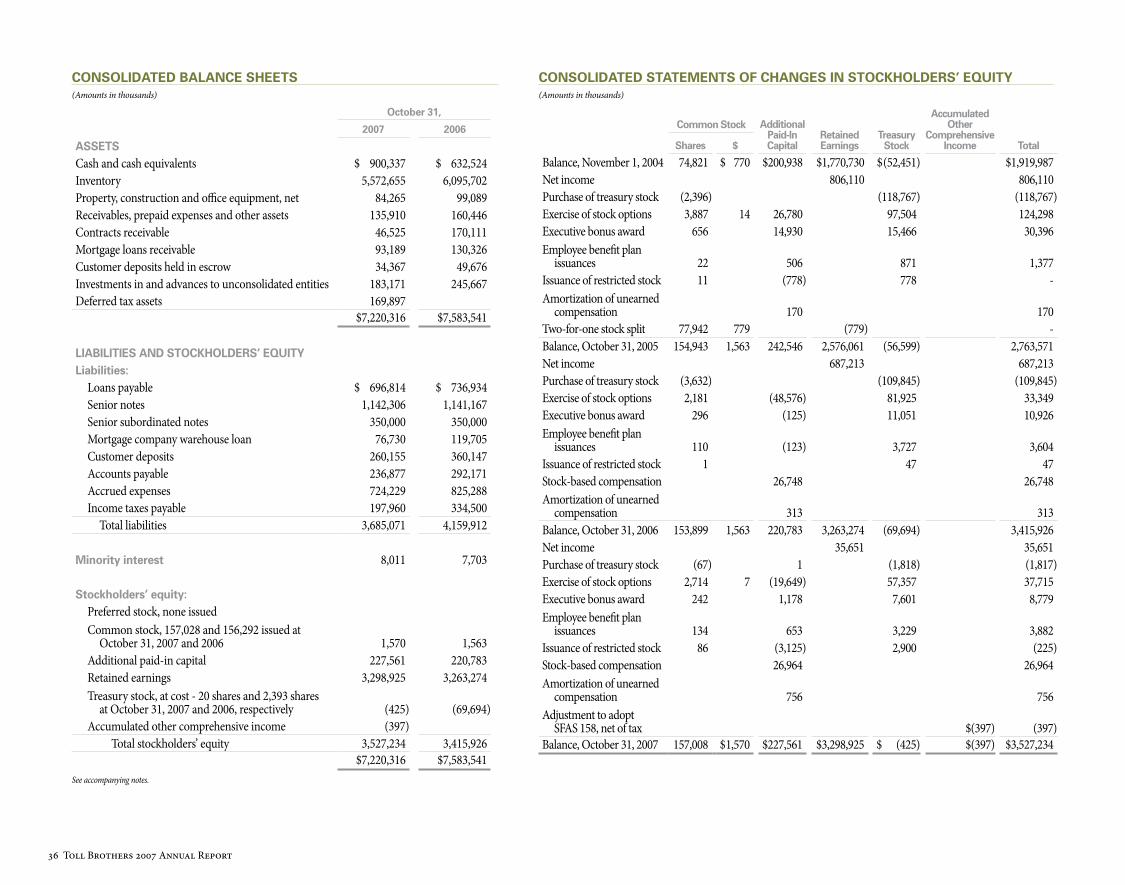
36 Toll Brothers 2007 Annual Report
CONSOlIDATED BAlANCE ShEETS (Amounts in thousands)
October 31,
2007 2006
ASSETSCash and cash equivalents $ 900,337 $ 632,524 Inventory 5,572,655 6,095,702 Property, construction and office equipment, net 84,265 99,089 Receivables, prepaid expenses and other assets 135,910 160,446 Contracts receivable 46,525 170,111 Mortgage loans receivable 93,189 130,326 Customer deposits held in escrow 34,367 49,676Investments in and advances to unconsolidated entities 183,171 245,667 Deferred tax assets 169,897
$7,220,316 $7,583,541
lIABIlITIES AND STOCKhOlDERS’ EQuITYliabilities:
Loans payable $ 696,814 $ 736,934 Senior notes 1,142,306 1,141,167 Senior subordinated notes 350,000 350,000 Mortgage company warehouse loan 76,730 119,705 Customer deposits 260,155 360,147 Accounts payable 236,877 292,171 Accrued expenses 724,229 825,288 Income taxes payable 197,960 334,500
Total liabilities 3,685,071 4,159,912
Minority interest 8,011 7,703
Stockholders’ equity:Preferred stock, none issuedCommon stock, 157,028 and 156,292 issued at
October 31, 2007 and 2006 1,570 1,563 Additional paid-in capital 227,561 220,783 Retained earnings 3,298,925 3,263,274 Treasury stock, at cost - 20 shares and 2,393 shares
at October 31, 2007 and 2006, respectively (425) (69,694)Accumulated other comprehensive income (397)
Total stockholders’ equity 3,527,234 3,415,926 $7,220,316 $7,583,541
See accompanying notes.
CONSOlIDATED STATEMENTS OF ChANGES IN STOCKhOlDERS’ EQuITY(Amounts in thousands)
Common Stock AdditionalPaid-InCapital
RetainedEarnings
TreasuryStock
AccumulatedOther
ComprehensiveIncome TotalShares $
Balance, November 1, 2004 74,821 $ 770 $200,938 $1,770,730 $ (52,451) $1,919,987Net income 806,110 806,110 Purchase of treasury stock (2,396) (118,767) (118,767)Exercise of stock options 3,887 14 26,780 97,504 124,298 Executive bonus award 656 14,930 15,466 30,396 Employee benefit plan
issuances 22 506 871 1,377Issuance of restricted stock 11 (778) 778 -Amortization of unearned
compensation 170 170 Two-for-one stock split 77,942 779 (779) -Balance, October 31, 2005 154,943 1,563 242,546 2,576,061 (56,599) 2,763,571 Net income 687,213 687,213Purchase of treasury stock (3,632) (109,845) (109,845)Exercise of stock options 2,181 (48,576) 81,925 33,349 Executive bonus award 296 (125) 11,051 10,926 Employee benefit plan
issuances 110 (123) 3,727 3,604Issuance of restricted stock 1 47 47 Stock-based compensation 26,748 26,748 Amortization of unearned
compensation 313 313 Balance, October 31, 2006 153,899 1,563 220,783 3,263,274 (69,694) 3,415,926Net income 35,651 35,651Purchase of treasury stock (67) 1 (1,818) (1,817)Exercise of stock options 2,714 7 (19,649) 57,357 37,715Executive bonus award 242 1,178 7,601 8,779Employee benefit plan
issuances 134 653 3,229 3,882Issuance of restricted stock 86 (3,125) 2,900 (225)Stock-based compensation 26,964 26,964Amortization of unearned
compensation 756 756Adjustment to adopt
SFAS 158, net of tax $(397) (397)Balance, October 31, 2007 157,008 $ 1,570 $227,561 $3,298,925 $ (425) $(397) $3,527,234
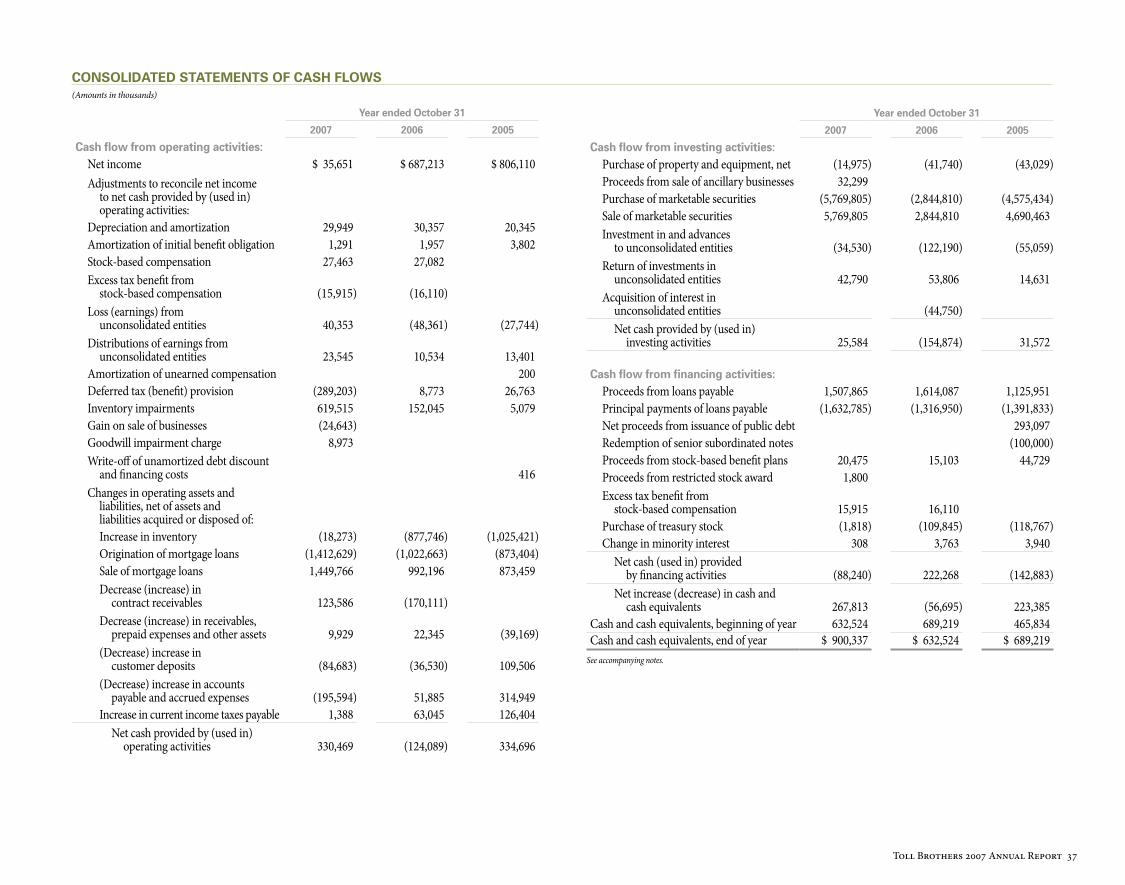
Toll Brothers 2007 Annual Report 37
CONSOlIDATED STATEMENTS OF CASh FlOWS(Amounts in thousands)
Year ended October 31
2007 2006 2005
Cash flow from operating activities:Net income $ 35,651 $ 687,213 $ 806,110 Adjustments to reconcile net income
to net cash provided by (used in) operating activities:
Depreciation and amortization 29,949 30,357 20,345 Amortization of initial benefit obligation 1,291 1,957 3,802 Stock-based compensation 27,463 27,082 Excess tax benefit from
stock-based compensation (15,915) (16,110)Loss (earnings) from
unconsolidated entities 40,353 (48,361) (27,744)Distributions of earnings from
unconsolidated entities 23,545 10,534 13,401 Amortization of unearned compensation 200 Deferred tax (benefit) provision (289,203) 8,773 26,763 Inventory impairments 619,515 152,045 5,079 Gain on sale of businesses (24,643)Goodwill impairment charge 8,973 Write-off of unamortized debt discount
and financing costs 416 Changes in operating assets and
liabilities, net of assets and liabilities acquired or disposed of:Increase in inventory (18,273) (877,746) (1,025,421)Origination of mortgage loans (1,412,629) (1,022,663) (873,404)Sale of mortgage loans 1,449,766 992,196 873,459 Decrease (increase) in
contract receivables 123,586 (170,111)Decrease (increase) in receivables,
prepaid expenses and other assets 9,929 22,345 (39,169)(Decrease) increase in
customer deposits (84,683) (36,530) 109,506 (Decrease) increase in accounts
payable and accrued expenses (195,594) 51,885 314,949 Increase in current income taxes payable 1,388 63,045 126,404
Net cash provided by (used in) operating activities 330,469 (124,089) 334,696
Year ended October 31
2007 2006 2005
Cash flow from investing activities:Purchase of property and equipment, net (14,975) (41,740) (43,029)Proceeds from sale of ancillary businesses 32,299 Purchase of marketable securities (5,769,805) (2,844,810) (4,575,434)Sale of marketable securities 5,769,805 2,844,810 4,690,463 Investment in and advances
to unconsolidated entities (34,530) (122,190) (55,059)Return of investments in
unconsolidated entities 42,790 53,806 14,631 Acquisition of interest in
unconsolidated entities (44,750)Net cash provided by (used in)
investing activities 25,584 (154,874) 31,572
Cash flow from financing activities:Proceeds from loans payable 1,507,865 1,614,087 1,125,951 Principal payments of loans payable (1,632,785) (1,316,950) (1,391,833)Net proceeds from issuance of public debt 293,097 Redemption of senior subordinated notes (100,000)Proceeds from stock-based benefit plans 20,475 15,103 44,729 Proceeds from restricted stock award 1,800 Excess tax benefit from
stock-based compensation 15,915 16,110 Purchase of treasury stock (1,818) (109,845) (118,767)Change in minority interest 308 3,763 3,940
Net cash (used in) provided by financing activities (88,240) 222,268 (142,883)
Net increase (decrease) in cash and cash equivalents 267,813 (56,695) 223,385
Cash and cash equivalents, beginning of year 632,524 689,219 465,834 Cash and cash equivalents, end of year $ 900,337 $ 632,524 $ 689,219
See accompanying notes.
38 Toll Brothers 2007 Annual Report
Notes to Consolidated Financial Statements
1. SIGNIFICANT ACCOuNTING POlICIES
BasIs of presentatIon
The accompanying consolidated financial statements include the accounts of Toll Brothers, Inc. (the “Company”), a Delaware corporation, and its majority-owned subsidiaries. All significant intercompany accounts and transactions have been eliminated. Investments in 50% or less owned partnerships and affiliates are accounted for using the equity method unless it is determined that the Company has effective control of the entity, in which case the entity would be consolidated.
use of estImates
The preparation of financial statements in conformity with U.S. generally accepted accounting principles requires management to make estimates and assumptions that affect the amounts reported in the financial statements and accompanying notes. Actual results could differ from those estimates.
revenue and Cost reCognItIon
Completed Contract Method: The construction time of the Company’s homes is generally less than one year although some may take more than one year to complete. Revenues and cost of revenues from these home sales are recorded at the time each home is delivered and title and possession are transferred to the buyer. Closing normally occurs shortly after construction is substantially completed. In addition, the Company has several high-rise/mid-rise projects which do not qualify for percentage of completion accounting in accordance with Financial Accounting Standards (“SFAS”) No. 66, “Accounting for Sales of Real Estate” (“SFAS 66”), which are included in this category of revenues and costs.
Land, land development and other common costs, both incurred and estimated to be incurred in the future, are amortized to the cost of homes closed based upon the total number of homes to be constructed in each community. Any changes resulting from a change in the estimated number of homes to be constructed or in the estimated costs subsequent to the commencement of delivery of homes are allocated to the remaining undelivered homes in the community. Home construction and related costs are charged to the cost of homes closed under the specific identification method. The estimated land, common area development and related costs of master planned communities, including the cost of golf courses, net of their estimated residual value, are allocated to individual communities within a master planned community on a relative sales value basis. Any changes resulting from a change in the estimated number of homes to be constructed or in the estimated costs are allocated to the remaining home sites in each of the communities of the master planned community.
Percentage of Completion Method: The Company is developing several high-rise/mid-rise projects that may take substantially more than one year to complete. Under the provisions of SFAS 66, revenues and costs are recognized using the percentage of completion method of accounting when construction is beyond the preliminary stage, the buyer is committed to the extent of being unable to require a refund except for non-delivery of the unit, sufficient units in the project have been sold to ensure that the property will not be converted to rental property, the sales proceeds are collectible and the aggregate sales proceeds and the total cost of the project can be reasonably estimated. Revenues and costs of individual projects are recognized on the individual project’s aggregate value of units for which the home buyers have signed binding agreements of sale, less an allowance for cancellations, and are based on the percentage of total estimated construction costs that have been incurred. Total estimated revenues and construction costs are reviewed periodically, and any change is applied to current and future periods.
Land Sales: Land sales revenues and cost of revenues are recorded at the time that title and possession of the property have been transferred to the buyer. The Company recognizes the pro rata share of land sales revenues and cost of land sales revenues to entities in which it has a 50% or less interest based upon the ownership percentage attributable to the non-Company investors. Any profit not recognized in a transaction reduces the Company’s investment in the entity or is recorded as an accrued liability on its consolidated balance sheet.
Cash and Cash equIvalents
Liquid investments or investments with original maturities of three months or less are classified as cash equivalents. The carrying value of these investments approximates their fair value.
Inventory
Inventory is stated at the lower of cost or fair value in accordance with SFAS No. 144, “Accounting for the Impairment or Disposal of Long-Lived Assets” (“SFAS 144”). In addition to direct land acquisition, land development and home construction costs, costs include interest, real estate taxes and direct overhead related to development and construction, which are capitalized to inventories during the period beginning with the commencement of development and ending with the completion of construction. Once a parcel of land has been approved for development, it generally takes four to five years to fully develop, sell and deliver all the homes in one of the Company’s typical communities. Longer or shorter time periods are possible depending on the number of home sites in a community and the sales and delivery pace of the homes in a community. The Company’s master planned communities, consisting of several smaller communities, may take up to ten years or more to complete. Because of the downturn in the Company’s business, the aforementioned estimated community lives may be significantly longer. Because the Company’s inventory is considered a long-lived asset under U.S. generally accepted accounting principles, the Company is required, under SFAS 144, to regularly review the carrying value of each of its communities and write down the value of those communities for which it believes the values are not recoverable.
Current Communities: When the profitability of a current community deteriorates, the sales pace declines significantly or some other factor indicates a possible impairment in the recoverability of the asset, the asset is reviewed for impairment by comparing the estimated future undiscounted cash flow for the community to its carrying value. If the estimated future undiscounted cash flow is less than the community’s carrying value, the carrying value is written down to its estimated fair value. Fair value is primarily determined by discounting the estimated future cash flow of each community. The impairment is charged to cost of revenues in the period the impairment is determined. In estimating the cash flow of a community, the Company uses various estimates such as (a) the expected sales pace in a community based upon general economic conditions that will have a short-term or long-term impact on the market in which the community is located and competition within the market, including the number of homes/home sites available and pricing and incentives being offered in other communities owned by it or by other builders; (b) the expected sales prices and sales incentives to be offered in a community; (c) costs expended to date and expected to be incurred in the future, including, but not limited to, land and land development costs, home construction costs, interest costs and overhead costs; (d) alternative product offerings that may be offered in a community that will have an impact on sales pace, sales price, building cost or on the number of homes that can be built on a particular site; and (e) alternative uses for the property such as the possibility of a sale of the entire community to another builder or the sale of individual home sites.
Toll Brothers 2007 Annual Report 39
Future Communities: The Company evaluates all land held for future communities or future sections of current communities, whether owned or under contract, to determine whether or not it expects to proceed with the development of the land as originally contemplated. This evaluation encompasses the same types of estimates used for current communities described above as well as an evaluation of the regulatory environment in which the land is located and the estimated probability of obtaining the necessary approvals, the estimated time and cost it will take to obtain the approvals and the possible concessions that will be required to be given in order to obtain them. Concessions may include cash payments to fund improvement to public places such as parks and streets, dedication of a portion of the property for use by the public or as open space or a reduction in the density or size of the homes to be built. Based upon this review, the Company decides (a) as to land under contract to be purchased, whether the contract will likely be terminated or renegotiated, and (b) as to land the Company owns, whether the land will likely be developed as contemplated or in an alternative manner, or should be sold. The Company then further determines whether costs that have been capitalized to the community are recoverable or should be written off. The write-off is charged to cost of revenues in the period that the need for the write-off is determined.
The estimates used in the determination of the estimated cash flows and fair value of a community are based on factors known to the Company at the time such estimates are made and the Company’s expectations of future operations and economic conditions. Should the estimates or expectations used in determining estimated fair value deteriorate in the future, the Company may be required to recognize additional impairment charges or write-offs related to current and future communities.
Variable Interest Entities: The Company has a significant number of land purchase contracts, sometimes referred to herein as “land purchase agreements,” “purchase agreements,” “options” or “option agreements,” and several investments in unconsolidated entities which it evaluates in accordance with the Financial Accounting Standards Board (“FASB”) Interpretation No. 46 “Consolidation of Variable Interest Entities, an interpretation of ARB No. 51,” as amended by FIN 46R (“FIN 46”). Pursuant to FIN 46, an enterprise that absorbs a majority of the expected losses or receives a majority of the expected residual returns of a variable interest entity (“VIE”) is considered to be the primary beneficiary and must consolidate the VIE. A VIE is an entity with insufficient equity investment or in which the equity investors lack some of the characteristics of a controlling financial interest. For land purchase contracts with sellers meeting the definition of a VIE, the Company performs a review to determine which party is the primary beneficiary of the VIE. This review requires substantial judgment and estimation. These judgments and estimates involve assigning probabilities to various estimated cash flow possibilities relative to the entity’s expected profits and losses and the cash flows associated with changes in the fair value of the land under contract.
property, ConstruCtIon and offICe equIpment
Property, construction and office equipment are recorded at cost and are stated net of accumulated depreciation of $116.6 million and $97.8 million at October 31, 2007 and 2006, respectively. Depreciation is recorded using the straight-line method over the estimated useful lives of the assets.
Investments In and advanCes to unConsolIdated entItIes
The Company is a party to several joint ventures with independent third parties to develop and sell land that was owned by its joint venture partners. The Company recognizes its proportionate share of the earnings from the sale of home sites to other builders. The Company does not recognize earnings from the home sites it purchases from these ventures, but reduces its cost basis in the home sites by its share of the earnings from those home sites.
The Company is also a party to several other joint ventures, effectively owns one-third of the Toll Brothers Realty Trust Group (“Trust”) and owns 50% of Toll Brothers Realty Trust Group II (“Trust II”).
The Company recognizes its proportionate share of the earnings of these entities.
mortgage loans reCeIvaBle
Mortgage loans, classified as held for sale, include the value of mortgage loans funded to borrowers plus the deferral of expenses directly associated with the loans less any points collected at closing. The carrying value of these loans approximates their fair value.
goodwIll and other IntangIBle assets
Intangible assets, including goodwill, that are not subject to amortization are tested for impairment and possible write-down.
At October 31, 2007 and 2006, the Company had $3.2 million and $12.2 million of goodwill, respectively.
treasury stoCk
Treasury stock is recorded at cost. Issuance of treasury stock is accounted for on a first-in, first-out basis. Differences between the cost of treasury stock and the re-issuance proceeds are charged to additional paid-in capital.
advertIsIng Costs
The Company expenses advertising costs as incurred. Advertising costs were $36.3 million, $36.0 million and $24.0 million for the years ended October 31, 2007, 2006 and 2005, respectively.
warranty Costs
The Company provides all of its home buyers with a limited warranty as to workmanship and mechanical equipment. The Company also provides many of its home buyers with a limited ten-year warranty as to structural integrity. The Company accrues for expected warranty costs at the time each home is closed and title and possession have been transferred to the buyer. Costs are accrued based upon historical experience.
InsuranCe Costs
The Company accrues for the expected costs associated with the deductibles and self-insured amounts under its various insurance policies.
InCome taxes
The Company accounts for income taxes in accordance with SFAS No. 109, “Accounting for Income Taxes”, (“SFAS 109”). Deferred tax assets and liabilities are recorded based on temporary differences between the amounts reported for financial reporting purposes and the amounts deductible for income tax purposes. SFAS 109 also requires that the Company provide for valuation allowances for any deferred tax assets that it believes are not recoverable. Provisions for federal and state income taxes are calculated on reported pretax earnings based on current tax law and also include, in the applicable period, the cumulative effect of any changes in tax rates from those used previously in determining deferred tax assets and liabilities. Such provisions differ from the amounts currently receivable or payable because certain items of income and expense are recognized for financial reporting purposes in different periods than for income tax purposes. Significant judgment is required in determining income tax provisions and evaluating tax positions. The Company establishes reserves for income taxes when, despite the belief that its tax positions are fully supportable, it believes that its positions may be challenged and disallowed by various tax authorities. The consolidated tax provision and related accruals include the impact of such reasonably estimable disallowances as deemed appropriate. To the extent that the probable tax outcome of these matters changes, such changes in estimates will impact the income tax provision in the period in which such determination is made.
40 Toll Brothers 2007 Annual Report
segment reportIng
SFAS No. 131, “Disclosures about Segments of an Enterprise and Related Information,” establishes standards for the manner in which public enterprises report information about operating segments. The Company has determined that its home building operations primarily involve four reportable geographic segments: North, Mid-Atlantic, South and West. The states comprising each geographic segment are as follows:
North: Connecticut, Illinois, Massachusetts, Michigan, Minnesota, New Jersey, New York, Ohio and Rhode Island
Mid-Atlantic: Delaware, Maryland, Pennsylvania, Virginia and West Virginia
South: Florida, Georgia, North Carolina, South Carolina and Texas
West: Arizona, California, Colorado and Nevada
The Company began operations in Georgia in the fourth quarter of fiscal 2007. The Company stopped selling homes in Ohio in fiscal 2005 and delivered its last home there in fiscal 2006. The operations in Ohio were immaterial to the North geographic segment.
aCquIsItIons
In June 2005, the Company acquired substantially all of the assets of the home building operations of the Central Florida Division of Landstar Homes (“Landstar”). Landstar designed, constructed, marketed and sold homes in the Orlando metropolitan area. Of the approximately $209.0 million (566 homes) of homes sold but not delivered at the acquisition date of Landstar, the Company delivered approximately $66.0 million (202 homes) of homes between the acquisition date and October 31, 2005. Under purchase accounting rules, the Company allocated a portion of the purchase price to the unrealized profit on these homes at the acquisition date. The Company did not recognize revenues on $21.3 million (73 homes) of home deliveries in the quarter ended July 31, 2005 but reduced the value of the acquired inventory by the $21.3 million. The acquisition had a minimal impact on the Company’s earnings in fiscal 2005.
In January 2004, the Company entered into a joint venture in which it had a 50% interest with an unrelated party to develop Maxwell Place, a luxury condominium community of approximately 800 units in Hoboken, New Jersey. In November 2005, the Company acquired its partner’s 50% equity ownership interest in this joint venture. As a result of the acquisition, the Company now owns 100% of the joint venture and the joint venture has been included as a consolidated subsidiary of the Company since the acquisition date. As of the acquisition date, the joint venture had open contracts of sale to deliver 165 units with a sales value of approximately $128.3 million. The Company’s investment in and subsequent purchase of the partner’s interest in the joint venture was not material to the financial position of the Company. The Company is recognizing revenue and costs related to a portion of this project using the percentage of completion method of accounting.
new aCCountIng pronounCements
On December 16, 2004, the FASB issued SFAS No. 123 (revised 2004), “Share-Based Payment” (“SFAS 123R”). In April 2005, the Securities and Exchange Commission (the “SEC”) adopted a rule permitting implementation of SFAS 123R at the beginning of the fiscal year commencing after June 15, 2005. Under the provisions of SFAS 123R, an entity is required to treat all stock-based compensation as a cost that is reflected in the financial statements. The Company was required to adopt SFAS 123R beginning in its fiscal quarter ended January 31, 2006. The Company adopted SFAS 123R using the modified prospective method whereby the Company recognized the expense only for periods beginning after
October 31, 2005. See Note 9, “Stock-Based Benefit Plans,” for information regarding expensing of stock options in fiscal 2007 and 2006 and for pro forma information regarding the Company’s expensing of stock options for fiscal 2005.
In June 2006, the FASB issued FASB Interpretation No. 48, “Accounting for Uncertainty in Income Taxes” (“FIN 48”). FIN 48 clarifies the accounting for uncertainty in income taxes recognized in accordance with SFAS 109 and prescribes a recognition threshold and measurement attributes for the financial statement recognition and measurement of a tax position taken or expected to be taken in a tax return. FIN 48 also provides guidance on de-recognition, classification, interest and penalties, accounting in interim periods, disclosure and transition. FIN 48 requires a company to recognize the financial statement effect of a tax position when it is more-likely-than-not (defined as a likelihood of more than 50 percent), based on the technical merits of the position, that the position will be sustained upon examination. A tax position that meets the more-likely-than-not recognition threshold is measured to determine the amount of benefit to be recognized in the financial statements based upon the largest amount of benefit that is greater than 50 percent likely of being realized upon ultimate settlement with a taxing authority that has full knowledge of all relevant information. If a tax position does not meet the more-likely-than-not recognition threshold, the benefit of that tax position is not recognized in the financial statements. FIN 48 will be effective for the Company’s fiscal year beginning November 1, 2007 with the cumulative effect of the change recorded as an adjustment to retained earnings. The Company is currently evaluating the effect the adoption of FIN 48 will have on its financial statements but does not expect it to have a material impact on its financial position.
In September 2006, the FASB issued SFAS No. 158, “Employers’ Accounting for Defined Benefit Pension and Other Postretirement Plans, an Amendment of FASB Statements No. 87, 88, 106, and 132(R)” (“SFAS 158”). SFAS 158 requires the Company to (a) recognize in its statement of financial position the overfunded or underfunded status of a defined benefit postretirement plan measured as the difference between the fair value of plan assets and the benefit obligation, (b) recognize as a component of other comprehensive income, net of tax, the actuarial gains and losses and the prior service costs and credits that arise during the period, (c) measure defined benefit plan assets and defined benefit plan obligations as of the date of the Company’s statement of financial position, and (d) disclose additional information about certain effects on net periodic benefit costs in the upcoming fiscal year that arise from the delayed recognition of the actuarial gains and losses and the prior service costs and credits. The Company adopted SFAS 158 effective October 31, 2007 related to its recognition of accumulated other comprehensive income, net of tax. The Company’s adoption of SFAS 158 did not have a material effect on its financial statements. The incremental effect of applying SFAS 158 on the individual line items of the consolidated balance sheet at October 31, 2007 was as follows (amounts in thousands):
Before application of SFAS 158 Adjustment
After application of SFAS 158
Receivables, prepaid expenses and other assets $ 138,410 $ (2,500) $ 135,910 Deferred tax assets $ 169,631 $ 266 $ 169,897 Total assets $ 7,222,550 $ (2,234) $ 7,220,316 Accrued expenses $ 726,066 $ (1,837) $ 724,229 Total liabilities $3,686,908 $ (1,837) $ 3,685,071 Accumulated other comprehensive income - $ (397) $ (397)Total stockholders’ equity $3,527,631 $ (397) $ 3,527,234 Total liabilities and stockholders’ equity $7,222,550 $ (2,234) $ 7,220,316

Toll Brothers 2007 Annual Report 41
In September 2006, the Emerging Issues Task Force (“EITF”) issued EITF Issue No. 06-8, “Applicability of the Assessment of a Buyer’s Continuing Investment under SFAS No. 66 for the Sale of Condominiums” (“EITF 06-8”). EITF 06-8 states that in assessing the collectibility of the sales price pursuant to paragraph 37(d) of SFAS 66, an entity should evaluate the adequacy of the buyer’s initial and continuing investment to conclude that the sales price is collectible. If an entity is unable to meet the criteria of paragraph 37, including an assessment of collectibility using the initial and continuing investment tests described in paragraphs 8-12 of SFAS 66, then the entity should apply the deposit method as described in paragraphs 65-67 of SFAS 66. EITF 06-8 is effective for the Company’s fiscal year beginning November 1, 2007. The application of the continuing investment criteria on the collectibility of the sales price will limit the Company’s ability to recognize revenues and costs using the percentage of completion accounting method. The change in criteria did not have an effect on any revenues or costs reported under percentage of completion accounting in fiscal 2006 and 2007.
In September 2006, the FASB issued SFAS No. 157, “Fair Value Measurements” (“SFAS 157”). SFAS 157 provides guidance for using fair value to measure assets and liabilities. The standard also responds to investors’ requests for expanded information about the extent to which a company measures assets and liabilities at fair value, the information used to measure fair value, and the effect of fair value measurements on earnings. SFAS 157 will be effective for the Company’s fiscal year beginning November 1, 2008. The Company is currently reviewing the effect SFAS 157 will have on its financial statements; however, it is not expected to have a material impact on the Company’s consolidated financial position, results of operations or cash flows.
In February 2007, the FASB issued SFAS No. 159, “The Fair Value Option for Financial Assets and Financial Liabilities, Including an Amendment of FASB Statement No. 115” (“SFAS 159”). SFAS 159 permits entities to choose to measure certain financial assets and liabilities at fair value. Unrealized gains and losses on items for which the fair value option has been elected will be reported in earnings. SFAS No. 159 will be effective for the Company’s fiscal year beginning November 1, 2009. The Company is currently evaluating the impact of the adoption of SFAS No. 159; however, it is not expected to have a material impact on the Company’s consolidated financial position, results of operations or cash flows.
stoCk splIt
On June 9, 2005, the Company’s Board of Directors declared a two-for-one split of the Company’s common stock in the form of a stock dividend to stockholders of record on June 21, 2005. The additional shares of stock were distributed as of the close of business on July 8, 2005. All share and per share information has been adjusted and restated to reflect this split.
reClassIfICatIon
Certain prior year amounts have been reclassified to conform to the fiscal 2007 presentation.
2. INVENTORYInventory at October 31, 2007 and 2006 consisted of the following (amounts in thousands):
2007 2006
Land and land development costs $1,749,652 $2,193,850 Construction in progress - completed contract 3,109,243 3,174,483 Construction in progress - percentage of completion 62,677 153,452 Sample homes and sales offices 357,322 244,097 Land deposits and costs of future development 274,799 315,041 Other 18,962 14,779
$5,572,655 $6,095,702
Construction in progress includes the cost of homes under construction, land and land development costs and the carrying cost of home sites that have been substantially improved.
The Company capitalizes certain interest costs to inventory during the development and construction period. Capitalized interest is charged to cost of revenues when the related inventory is delivered for traditional homes or when the related inventory is charged to cost of revenues under percentage of completion accounting. Interest incurred, capitalized and expensed for each of the three years ended October 31, 2007, 2006 and 2005, was as follows (amounts in thousands):
2007 2006 2005
Interest capitalized, beginning of year $ 181,465 $ 162,672 $ 173,442 Interest incurred 136,758 135,166 115,449 Capitalized interest in inventory acquired 6,100Interest expensed to cost of sales (102,447) (121,993) (125,283)Write-off against other (205) (480) (936)Interest capitalized, end of year $ 215,571 $ 181,465 $ 162,672
Inventory impairment charges are recognized against all inventory costs of a community, such as land, land improvements, cost of home construction and capitalized interest. The amounts included in the above table reflect the gross amount of capitalized interest before allocation of any impairment charges recognized.
Interest included in cost of revenues for each of the three years ended October 31, 2007, 2006 and 2005, was as follows (amounts in thousands):
2007 2006 2005
Completed contract $ 97,246 $116,405 $122,451 Percentage of completion 4,797 4,552 Land sales 404 1,036 2,832
$102,447 $121,993 $125,283
42 Toll Brothers 2007 Annual Report
The Company recognized inventory impairment charges and the expensing of costs that it believed not to be recoverable for each of the three years ended October 31, 2007, 2006 and 2005, was as follows (amounts in thousands):
2007 2006 2005
Land controlled for future communities $ 37,920 $ 90,925 $3,279Operating communities and land owned 581,596 61,120 1,800
Total $ 619,516 $ 152,045 $5,079
At the end of each fiscal quarter, the Company evaluates each of its operating communities to determine their estimated fair value and whether the estimated fair value exceeded their carrying costs. The table below provides, as of the date indicated, the number of operating communities in which the Company recognized impairment charges, the fair value of those communities, net of impairment charges and the amount of impairment charges recognized ($ amounts in thousands):
2007 2006
Number of communities
Fair value of communities,
net of impairment
chargesWrite- downs
Number of communities
Fair value of communities,
net of impairment
chargesWrite- downs
January 31, 18 $211,800 $ 82,962 - - -April 30, 24 $228,900 $116,150 5 $ 30,083 $ 10,700July 31, 28 $344,100 $139,628 1 $ 5,043 $ 2,800October 31, 54 $530,508 $242,856 14 $ 142,538 $ 47,620
$581,596 $ 61,120
At October 31, 2007, the Company evaluated its land purchase contracts to determine if any of the selling entities were VIEs and if they were, whether the Company was the primary beneficiary of any of them. The Company does not possess legal title to the land and its risk is generally limited to deposits paid to the seller. The creditors of the seller generally have no recourse against the Company. At October 31, 2007, the Company had determined that it was the primary beneficiary of two VIEs related to land purchase contracts and had recorded $22.9 million of inventory and $18.7 million of accrued expenses.
3. INVESTMENTS IN AND ADVANCES TO uNCONSOlIDATED ENTITIESThe Company has investments in and advances to several joint ventures with unrelated parties to develop land. Some of these joint ventures develop land for the sole use of the venture partners, including the Company, and others develop land for sale to the venture partners and to unrelated builders. The Company recognizes its share of earnings from the sale of home sites to other builders. The Company does not recognize earnings from home sites it purchases from the joint ventures, but instead reduces its cost basis in those home sites by its share of the earnings on the home sites. At October 31, 2007, the Company had approximately $100.1 million invested in or advanced to these joint ventures and was committed to contributing additional capital in an aggregate amount of approximately $218.9 million (net of the Company’s $121.7 million of loan guarantees related to two of the joint ventures’ loans) if required by the joint ventures. At October 31, 2007, three of the joint ventures had an aggregate of $1.22 billion of loan commitments, and had approximately $1.05 billion borrowed against the commitments, of which the Company guarantees of its pro-rata share of the borrowings were $98.6 million. The Company recognized impairment charges of $59.2 million against its investment in two of these entities because it did not believe that its investments were recoverable.
The Company has investments in and advances to two joint ventures with unrelated parties to develop luxury condominium projects, including for-sale residential units and commercial space. At October 31, 2007, the Company had investments in and advances to the joint ventures of $23.4 million, was committed to making up to $124.0 million of additional investments in and advances to the joint ventures if required by the joint ventures, and guaranteed $13.0 million of joint venture loans. At October 31, 2007, the joint ventures had an aggregate of $294.5 million of loan commitments, and had approximately $172.9 million borrowed against the commitments.
The Company has a 50% interest in a joint venture with an unrelated party to convert a 525-unit apartment complex, The Hudson Tea Buildings, located in Hoboken, New Jersey, into luxury condominium units. At October 31, 2007, the Company had investments in and advances to the joint venture of $50.6 million, and was committed to making up to $1.5 million of additional investments in and advances to the joint venture.
In fiscal 2005, the Company, together with the Pennsylvania State Employees Retirement System (“PASERS”), formed Trust II to be in a position to take advantage of commercial real estate opportunities. Trust II is owned 50% by the Company and 50% by PASERS. At October 31, 2007, the Company had an investment of $9.2 million in Trust II. In addition, the Company and PASERS each entered into subscription agreements that expire in September 2009, whereby each agreed to invest additional capital in an amount not to exceed $11.1 million if required by Trust II. Prior to the formation of Trust II, the Company used the Trust to invest in commercial real estate opportunities. See Note 13, “Related Party Transactions” for information about the Trust.
The Company’s investments in these entities are accounted for using the equity method.
4. GOODWIll IMPAIRMENTIn January 2007, due to the continued decline of the Detroit market, the Company re-evaluated the carrying value of goodwill that resulted from a 1999 acquisition in accordance with SFAS No. 142, “Goodwill and Other Intangible Assets”. The Company estimated the fair value of its assets in this market including goodwill. Fair value was determined based on the discounted future cash flow expected to be generated in this market. Based upon this evaluation and the Company’s expectation that this market would not recover for a number of years, the Company determined that the related goodwill was impaired. The Company recognized a $9.0 million impairment charge in fiscal 2007. After recognizing this charge, the Company did not have any goodwill remaining from this acquisition.
Toll Brothers 2007 Annual Report 43
5. lOANS PAYABlE, SENIOR NOTES, SENIOR SuBORDINATED NOTES AND MORTGAGE COMPANY WAREhOuSE lOAN
loans payaBle
Loans payable at October 31, 2007 and 2006 consisted of the following (amounts in thousands):
2007 2006
Term loan due March 2011 (a) $331,667 $300,000 Other (b) 365,147 436,934
$696,814 $736,934
(a) The Company has a $1.89 billion credit facility consisting of a $1.56 billion unsecured revolving credit facility and a $331.7 million term loan facility (collectively, the “Credit Facility”) with 35 banks, which extends to March 17, 2011. At October 31, 2007, interest was payable on borrowings under the revolving credit facility at 0.475% (subject to adjustment based upon the Company’s debt rating and leverage ratios) above the Eurodollar rate or at other specified variable rates as selected by the Company from time to time. At October 31, 2007, the Company had no outstanding borrowings against the revolving credit facility but had letters of credit of approximately $339.0 million outstanding under it, of which the Company had recorded $38.8 million as liabilities under land purchase agreements and investments in unconsolidated entities. Under the term loan facility, interest is payable at 0.50% (subject to adjustment based upon the Company’s debt rating and leverage ratios) above the Eurodollar rate or at other specified variable rates as selected by the Company from time to time. At October 31, 2007, interest was payable on the $331.7 million term loan at 5.53%. Under the terms of the Credit Facility, the Company is not permitted to allow its maximum leverage ratio (as defined in the agreement) to exceed 2.00 to 1.00 and was required to maintain a minimum tangible net worth (as defined in the agreement) of approximately $2.37 billion at October 31, 2007. At October 31, 2007, the Company’s leverage ratio was approximately .43 to 1.00, and its tangible net worth was approximately $3.49 billion. Based upon the minimum tangible net worth requirement, the Company’s ability to pay dividends and repurchase its common stock was limited to an aggregate amount of approximately $1.12 billion at October 31, 2007.
(b) The weighted average interest rate on these loans was 5.82% at October 31, 2007 and ranged from 3.48% to 10.0%. At October 31, 2007, $365.1 million of loans payable were secured by assets of approximately $475.9 million.
At October 31, 2007, the aggregate estimated fair value of the Company’s loans payable was approximately $701.4 million. The fair value of loans was estimated based upon the interest rates at October 31, 2007 that the Company believed were available to it for loans with similar terms and remaining maturities.
senIor notes
During fiscal 2005, the Company issued $300 million of 5.15% Senior Notes due 2015 and used the proceeds from the transaction to redeem its $100 million outstanding of 8% Senior Subordinated Notes due 2009 and, with additional available funds, to retire a $222.5 million bank term loan.
At October 31, 2007 and 2006, the Company’s senior notes consisted of the following (amounts in thousands):
2007 2006
6.875% Senior Notes due November 15, 2012 $ 300,000 $ 300,000 5.95% Senior Notes due September 15, 2013 250,000 250,000 4.95% Senior Notes due March 15, 2014 300,000 300,0005.15% Senior Notes due May 15, 2015 300,000 300,000Bond discount (7,694) (8,833)
$ 1,142,306 $ 1,141,167
The senior notes are the unsecured obligations of Toll Brothers Finance Corp., a 100%-owned subsidiary of the Company. The payment of principal and interest is fully and unconditionally guaranteed, jointly and severally, by the Company and substantially all of its home building subsidiaries (together with Toll Brothers Finance Corp., the “Senior Note Parties”). The senior notes rank equally in right of payment with all the Senior Note Parties’ existing and future unsecured senior indebtedness, including the Credit Facility. The senior notes are structurally subordinated to the prior claims of creditors, including trade creditors, of the subsidiaries of the Company that are not guarantors of the senior notes. The senior notes are redeemable in whole or in part at any time at the option of the Company, at prices that vary based upon the then-current rates of interest and the remaining original term of the notes.
At October 31, 2007, the aggregate fair value of the Company’s senior notes, based upon their indicated market prices, was approximately $1.07 billion.
senIor suBordInated notes
At October 31, 2007 and 2006, the Company’s senior subordinated notes consisted of the following (amounts in thousands):
2007 2006
8 1/4% Senior Subordinated Notes due February 1, 2011 $200,000 $200,000 8.25% Senior Subordinated Notes due December 1, 2011 150,000 150,000
$350,000 $350,000
The senior subordinated notes are the unsecured obligations of Toll Corp., a 100%-owned subsidiary of the Company; these obligations are guaranteed on a senior subordinated basis by the Company. All issues of senior subordinated notes are subordinated to all existing and future senior indebtedness of the Company and are structurally subordinated to the prior claims of creditors, including trade creditors, of the Company’s subsidiaries other than Toll Corp. The indentures governing these notes restrict certain payments by the Company, including cash dividends and repurchases of Company stock. The senior subordinated notes are redeemable in whole or in part at the option of the Company at various prices, on or after the fifth anniversary of each issue’s date of issuance.
At October 31, 2007, the aggregate fair value of the Company’s senior subordinated notes, based upon their indicated market prices, was approximately $348.2 million.
44 Toll Brothers 2007 Annual Report
mortgage Company warehouse loan
A subsidiary of the Company had a $150 million bank line of credit with four banks to fund home mortgage originations. The line of credit is due within 90 days of demand by the banks and bears interest at the banks’ overnight rate plus 0.95%. At October 31, 2007, the subsidiary had borrowed $76.7 million under the line of credit at an average interest rate of 5.73%. The line of credit is collateralized by all the assets of the subsidiary, which amounted to approximately $97.1 million at October 31, 2007. In November 2007, the bank line was reduced to $125 million and three banks.
The annual aggregate maturities of the Company’s loans and notes during each of the next five fiscal years are 2008 - $177.0 million; 2009 - $162.3 million; 2010 - $18.4 million; 2011 - $602.2 million; and 2012 - $150 million.
6. ACCRuED ExPENSESAccrued expenses at October 31, 2007 and 2006 consisted of the following (amounts in thousands):
2007 2006
Land, land development and construction $275,114 $376,114 Compensation and employee benefit 100,893 127,433 Insurance and litigation 144,349 130,244 Warranty 59,249 57,414 Interest 47,136 43,629 Other 97,488 90,454
$724,229 $825,288
The Company accrues expected warranty costs at the time each home is closed and title and possession have been transferred to the home buyer. Changes in the warranty accrual during fiscal 2007, 2006 and 2005 were as follows (amounts in thousands):
2007 2006 2005
Balance, beginning of year $57,414 $54,722 $42,133 Additions 28,719 36,405 41,771 Charges incurred (26,884) (33,713) (29,182)Balance, end of year $59,249 $57,414 $54,722
7. INCOME TAxESProvisions for federal and state income taxes are calculated on reported pretax earnings based on current tax law and also include, in the applicable period, the cumulative effect of any changes in tax rates from those used previously in determining deferred tax assets and liabilities. Such provisions differ from the amounts currently receivable or payable because certain items of income and expense are recognized for financial reporting purposes in different periods than for income tax purposes. Significant judgment is required in determining income tax provisions and evaluating tax positions. The Company establishes reserves for income taxes when, despite the belief that its tax positions are fully supportable, it believes that its positions may be challenged and disallowed by various tax authorities. The consolidated tax provision and related accruals include the impact of such reasonably estimable disallowances as deemed appropriate. To the extent that the probable tax outcome of these matters changes, such changes in estimates will impact the income tax provision in the period in which such determination is made.
The Company operates in 22 states and is subject to various state tax jurisdictions. The Company estimates its state tax liability based upon the individual taxing authorities’ regulations, estimates of income by taxing jurisdictions and the Company’s ability to utilize certain tax-saving strategies. Due primarily to a change in the Company’s estimate of the allocation of income or loss, as the case may be, among the various taxing jurisdictions and changes in tax regulations and their impact on the Company’s tax strategies, the Company’s estimated rate for state income taxes was 21.4% for fiscal 2007, 7.0% for fiscal 2006 and 6.3% for fiscal 2005.
A reconciliation of the Company’s effective tax rate from the federal statutory tax rate for the fiscal years ended October 31, 2007, 2006 and 2005 is as follows ($ amounts in thousands):
2007 2006 2005$ % $ % $ %
Federal statutory tax 24,738 35.0 394,316 35.0 463,095 35.0State taxes, net of federal benefit 9,854 13.9 50,895 4.5 54,268 4.1Accrued interest on
anticipated tax assessments 16,786 23.8 11,719 1.0Benefit from tax credits (8,700) (12.3) (10,315) (0.9)Non-taxable earnings (6,078) ( 8.6) (3,385) (0.3) (3,795) (0.3)Reversal of expiring
state taxes provisions (2,751) ( 3.9) (5,200) (0.4)FAS 109 adjustment 3,450 0.3Other 1,180 1.7 1,373 0.1
35,029 49.6 439,403 39.0 517,018 39.1
The provision for income taxes for each of the three years ended October 31, 2007, 2006 and 2005 was as follows (amounts in thousands):
2007 2006 2005
Federal $ 2,728 $361,543 $428,221 State 32,301 77,860 88,797
$ 35,029 $439,403 $517,018
Current $ 324,232 $430,630 $490,254 Deferred (289,203) 8,773 26,764
$ 35,029 $439,403 $517,018
The components of income taxes payable at October 31, 2007 and 2006 consisted of the following (amounts in thousands):
2007 2006
Current $197,960 $215,194 Deferred 119,306
$197,960 $334,500
Toll Brothers 2007 Annual Report 45
The components of net deferred tax assets and liabilities at October 31, 2007 and 2006 consisted of the following (amounts in thousands):
2007 2006
Deferred tax assets:Accrued expenses $ 38,144 $ 38,390 Impairment charges 250,395 24,920 Inventory valuation differences 12,468 10,193 Stock-based compensation expense 19,186 9,078 Other 11,248 9,082
Total 331,441 91,663Deferred tax liabilities:
Capitalized interest $ 62,128 $ 61,936 Deferred income 68,850 127,394 Depreciation 9,764 10,337 Deferred marketing 12,347 312 State taxes 8,455 (6,771)Other 17,761
Total 161,544 210,969Net deferred tax assets (liabilities) $ 169,897 $ (119,306)
At October 31, 2007 and 2006, no valuation allowance was recorded against the Company’s deferred tax assets as it considers them to be fully recoverable.
8. STOCKhOlDERS’ EQuITYThe Company’s authorized capital stock consists of 200 million shares of common stock, $.01 par value per share, and 1 million shares of preferred stock, $.01 par value per share. The Board of Directors is authorized to amend the Company’s Certificate of Incorporation to increase the number of authorized shares of common stock to 400 million shares and the number of shares of authorized preferred stock to 15 million shares. At October 31, 2007, the Company had 157.0 million shares of common stock issued and outstanding (net of 20 thousand shares of common stock held in treasury), 24.1 million shares of common stock reserved for outstanding stock options, 11.9 million shares of common stock reserved for future stock option and award issuances and 716 thousand shares of common stock reserved for issuance under the Company’s employee stock purchase plan. As of October 31, 2007, the Company had not issued any shares of preferred stock.
IssuanCe of Common stoCk
In fiscal 2007, the Company issued 33,512 shares of restricted common stock pursuant to its Stock Incentive Plan for Employees (2007) to an employee. The restricted stock award vests over an 18-month period. The Company is amortizing the fair market value of the award on the date of grant over the period of time that the award vests. At October 31, 2007, no shares under the award were vested.
In fiscal 2007, 2006 and 2005, the Company issued 1,000 shares, 1,000 shares and 22,000 shares, respectively, of restricted common stock pursuant to its Stock Incentive Plan (1998) to certain outside directors and in fiscal 2005 to certain outside directors and an employee. The Company is amortizing the fair market value of the awards on the date of grant over the period of time that each award vests. At October 31, 2007, 1,500 shares of these restricted stock awards outstanding were unvested.
In December 2006, Mr. Toll’s bonus payment pursuant to the Company’s Cash Bonus Plan was revised to provide that $3 million ($1.8 million of cash and $1.2 million of unrestricted stock valued as of the date of the payment of his fiscal 2006 bonus) be exchanged for shares of restricted stock on the date of the bonus payment. The number of shares of restricted stock was calculated by dividing $3 million by $31.06, the closing price of the Company’s common stock on the New York Stock Exchange (the “NYSE”) on January 5, 2007, the date on which Mr. Toll’s fiscal 2006 bonus award was paid. Mr. Toll received 96,586 shares of restricted stock. The restricted stock Mr. Toll received will vest over a two-year period unless Mr. Toll retires, dies or becomes disabled (as such terms are defined in the stock award document), at which time the shares will immediately vest.
stoCk repurChase program
In March 2003, the Company’s Board of Directors authorized the repurchase of up to 20 million shares of its common stock from time to time, in open market transactions or otherwise, for the purpose of providing shares for its various employee benefit plans. At October 31, 2007, the Company had approximately 12.0 million shares remaining under the repurchase authorization.
stoCkholder rIghts plan
Shares of the Company’s common stock outstanding are subject to stock purchase rights. The rights, which are exercisable only under certain conditions, entitle the holder, other than an acquiring person (and certain related parties of an acquiring person), as defined in the plan, to purchase common shares at prices specified in the rights agreement. Unless earlier redeemed, the rights will expire on July 11, 2017. The rights were not exercisable at October 31, 2007.
9. STOCK-BASED BENEFIT PlANS
stoCk-Based CompensatIon plans
Effective November 1, 2005, the Company adopted SFAS 123R and recognized compensation expense in its financial statements in fiscal 2007 and 2006. Prior to the adoption of SFAS 123R, the Company accounted for its stock option plans according to Accounting Principles Board Opinion No. 25, “Accounting for Stock Issued to Employees.” Accordingly, no compensation costs were recognized upon issuance or exercise of stock options for fiscal 2005.
SFAS No. 123, “Accounting for Stock-Based Compensation,” required the disclosure of the estimated fair value of employee option grants and their impact on net income using option pricing models that are designed to estimate the value of options that, unlike employee stock options, can be traded at any time and are transferable. In addition to restrictions on trading, employee stock options may include other restrictions such as vesting periods. Further, such models require the input of highly subjective assumptions, including the expected volatility of the stock price.
For the purposes of providing the pro forma disclosures, prior to November 1, 2004, the fair value of options granted was estimated using the Black-Scholes option pricing model for grants. To better value option grants as required by SFAS 123R, the Company developed a lattice model, which it believes better reflects the establishment of the fair value of option grants. The Company used a lattice model for the valuation for all option grants in fiscal 2007. For the fiscal 2006 and 2005 valuations, the Company used a lattice model for the valuation of non-executive officer option grants and the Black-Scholes option pricing model for the valuation of option grants to executive officers and members of the Board of Directors.
46 Toll Brothers 2007 Annual Report
The weighted-average assumptions and fair value used for stock option grants in each of the three years ended October 31, 2007, 2006 and 2005 were as follows:
2007 2006 2005
Expected volatility 36.32% - 38.22% 36.33% - 38.28% 27.00% - 33.46%Weighted-average volatility 37.16% 37.55% 31.31%Risk-free interest rate 4.57% - 4.61% 4.38% - 4.51% 3.13% - 4.2%Expected life (years) 3.69 - 8.12 4.11 - 9.07 2.80 - 9.07 Dividends none none noneWeighted-average fair value
per share of options granted $11.17 $15.30 $11.67
Expected volatilities are based on implied volatilities from traded options on the Company’s stock and the historical volatility of the Company’s stock. The expected life of options granted is derived from the historical exercise patterns and anticipated future patterns and represents the period of time that options granted are expected to be outstanding; the range given above results from certain groups of employees exhibiting different behavior. The risk-free rate for periods within the contractual life of the option is based on the U.S. Treasury yield curve in effect at the time of grant.
The fair value of stock option awards is recognized evenly over the vesting period of the options or over the period between the grant date and the time the option becomes non-forfeitable by the employee, whichever is shorter. Stock option expense is included in the Company’s selling, general and administrative expenses. In fiscal 2007 and 2006, the Company recognized $27.0 million and $26.8 million of expense, respectively, and an income tax benefit of $10.1 million and $9.1 million, respectively, related to option awards. The impact of the adoption of SFAS 123R on fiscal 2007 and 2006 diluted earnings per share was $0.10 and $0.11, respectively. At October 31, 2007, total compensation cost related to non-vested awards not yet recognized was approximately $22.4 million, unrecognized income tax benefits from non-vested awards was approximately $8.6 million and the weighted-average period over which the Company expects to recognize such compensation costs and tax benefit is 2.2 years.
Had the Company adopted SFAS 123R as of November 1, 2004, income before taxes, income taxes, net income and net income per share for fiscal 2005 would have been as follows (amounts in thousands, except per share amounts):
As ReportedSFAS 123R Adjustment Pro Forma
Income before income taxes $ 1,323,128 $(22,722) $ 1,300,406 Income taxes 517,018 (6,989) 510,029 Net income $ 806,110 $(15,733) $ 790,377 Income per share
Basic $5.23 $5.12 Diluted $4.78 $4.69
stoCk optIon plans
The Company has two active stock option plans, one for employees (including officers) and one for non-employee directors. The Company’s active stock option plans provide for the granting of incentive stock options (solely to employees) and non-qualified options with a term of up to ten years at a price not less than the market price of the stock at the date of grant. Options granted to employees generally vest over a four-year period, although certain grants vest over a longer or shorter period, and grants to non-employee directors generally vest over a two-year period.
The Company has three additional stock option plans for employees, officers and directors that provided for the granting of incentive stock options and non-qualified options which had outstanding stock option grants at October 31, 2007. No additional options may be granted under these plans. Stock options granted under these plans were made with a term of up to ten years at a price not less than the market price of the stock at the date of grant and generally vested over a four-year period for employees and a two-year period for non-employee directors.
Shares issued upon the exercise of a stock option are either from shares held in treasury or newly issued shares.
The following table summarizes stock option activity for the Company’s plans during each of the three years ended October 31, 2007, 2006 and 2005 (amounts in thousands, except per share amounts):
2007 2006 2005
Number of
Options
Weighted- Average Exercise
Price
Number of
Options
Weighted- Average Exercise
Price
Number of
Options
Weighted- Average Exercise
Price
Balance, beginning 25,178 $12.70 26,155 $11.04 30,490 $ 8.21 Granted 1,823 31.80 1,433 35.97 2,736 32.55 Exercised (2,717) 7.15 (2,185) 6.43 (6,769) 6.56 Cancelled (204) 32.36 (225) 28.72 (302) 20.79 Balance, ending 24,080 $14.60 25,178 $12.70 26,155 $11.04 Options exercisable, at
October 31, 19,743 $10.90 20,398 $ 9.02 19,627 $ 7.34 Options available for
grant at October 31, 11,946 8,462 6,161
The intrinsic value of options outstanding and exercisable is the difference between the fair market value of the Company’s common stock on the applicable date (“Measurement Value”) and the exercise price of those options that had an exercise price that was less than the Measurement Value. The intrinsic value of options exercised is the difference between the fair market value of the Company’s common stock on the date of exercise and the exercise price.
Information pertaining to the intrinsic value of options outstanding and exercisable at October 31, 2007, 2006 and 2005 is provided below (amounts in thousands):
2007 2006 2005
Intrinsic value of options outstanding $256,387 $408,186 $676,700 Intrinsic value of options exercisable $254,913 $405,764 $580,363
Toll Brothers 2007 Annual Report 47
Information pertaining to the intrinsic value of options exercised and the fair value of options which became vested in each of the three years ended October 31, 2007, 2006 and 2005 is provided below (amounts in thousands):
2007 2006 2005
Intrinsic value of options exercised $ 53,048 $ 56,133 $ 227,693 Fair value of options vested $ 7,710 $ 23,551 $ 20,365
Pursuant to the provisions of the Company’s stock option plans, participants are permitted to use the value of the Company’s common stock that they own to pay for the exercise of options. The Company received 4,172 shares with an average fair market value per share of $35.43 for the exercise of stock options in fiscal 2006 and 26,980 shares with an average fair market value per share of $36.91 for the exercise of stock options in fiscal 2005. No options were exercised using the value of stock held by participants in fiscal 2007.
The following table summarizes information about stock options outstanding and exercisable at October 31, 2007:
Range of Exercise Prices
Options Outstanding Options Exercisable
Number Outstanding
(in 000)
Weighted- Average
Remaining Contractual
life (in years)
Weighted- Average
Exercise Price
Number Exercisable
(in 000)
Weighted- Average
Exercise Price
$ 4.38 - $ 6.86 8,620 1.5 $ 5.14 8,620 $ 5.14 $ 6.87 - $ 9.66 2,610 2.9 9.44 2,610 9.44 $ 9.67 - $ 10.88 5,084 4.5 10.75 5,084 10.75 $ 10.89 - $ 20.14 2,241 6.1 20.14 1,710 20.14 $ 20.15 - $ 35.97 5,525 8.0 33.11 1,719 33.26
24,080 4.2 $14.60 19,743 $ 10.90
Bonus award shares
Under the terms of the Company’s Cash Bonus Plan covering Robert I. Toll, Mr. Toll is entitled to receive cash bonus awards based upon the pretax earnings and stockholders’ equity of the Company as defined by the plan.
In December 2004, Mr. Toll and the Board of Directors agreed that any bonus payable for each of the three fiscal years ended October 31, 2007, 2006 and 2005 would be calculated based upon the difference between the closing price of the Company’s common stock on the NYSE on the last trading day of the Company’s 2004 fiscal year, $23.18 as of October 29, 2004 (the “Award Conversion Price”), and the closing price of the Company’s common stock on the NYSE on the last day of the fiscal year for which the cash bonus is being calculated. The amount calculated under this revised stock award formula (the “Stock Award Formula”) is limited to price appreciation up to $13.90 per share and 2.9% of the Company’s pretax earnings, as defined by the plan (together, the “Award Caps”). The bonus award was payable 60% in cash and 40% in shares of the Company’s common stock based upon the closing price of the Company’s common stock on the NYSE on the last day of the fiscal year for which the cash bonus is being calculated. The stockholders approved the plan at the Company’s 2005 Annual Meeting.
Mr. Toll and the Executive Compensation Committee of the Board of Directors subsequently amended the Cash Bonus Plan to limit Mr. Toll’s bonus for fiscal 2005 to an amount equal to $27.3 million. Had Mr. Toll and the Executive Compensation Committee of the Board of Directors not amended Mr. Toll’s bonus program for fiscal 2005, Mr. Toll would have received $39.2 million. The Company recognized compensation expense in 2005 of $27.3 million for Mr. Toll’s bonus. The bonus was paid in the form of 296,099 shares of the Company’s common stock with a fair market value of $10.9 million (based on the $36.91 closing price of the Company’s common stock on the NYSE on October 31, 2005) and $16.4 million in cash. The Cash Bonus Plan was also amended for fiscal 2006 and fiscal 2007 to (a) eliminate the Stock Award Formula to the extent the Company’s common stock on the NYSE on the last trading day of the fiscal year for which the cash bonus is being calculated is less than or equal to $36.91 and greater than or equal to the Award Conversion Price, and (b) in addition to the Award Caps, further limit the amount of the bonus payable under the Cash Bonus Plan if the Company’s common stock on the NYSE on the last trading day of the fiscal year for which Mr. Toll’s cash bonus is being calculated is greater than $36.91.
Based upon the terms of the Company’s Cash Bonus Plan in place in fiscal 2006, Mr. Toll was entitled to a $21.5 million bonus for fiscal 2006. In December 2006, Mr. Toll and the Executive Compensation Committee of the Board of Directors amended the Cash Bonus Plan to limit Mr. Toll’s bonus for fiscal 2006 to an amount equal to $17.5 million, payable in 242,560 shares of the Company’s common stock with a fair market value of $7.0 million (based on the $28.91 closing price of the Company’s common stock on the NYSE on October 31, 2006) and $10.5 million in cash. Mr. Toll’s bonus payment was further revised to provide that $3.0 million ($1.8 million of cash and $1.2 million of stock valued as of the date of the bonus payment) be exchanged for restricted shares on the date of the bonus payment, which restricted shares will vest over a two-year period. The $4.0 million reduction in Mr. Toll’s 2006 bonus was recognized in the Company’s consolidated income statement in fiscal 2007.
Based upon the terms of the Company’s Cash Bonus Plan in place in fiscal 2007, Mr. Toll was not entitled to receive a bonus award for fiscal 2007.
On October 31, 2007, 2006 and 2005, the closing price of the Company’s common stock on the NYSE was $22.91, $28.91 and $36.91, respectively.
Under the Company’s deferred compensation plan, Mr. Toll can elect to defer receipt of his bonus until a future date. In prior years, Mr. Toll elected to defer receipt of some of his bonus award shares. In December 2006, 2005 and 2004, Mr. Toll received 471,100 shares of his 2002 bonus, 480,164 shares of his 2001 bonus and 471,100 shares of his 2002 bonus, respectively.
employee stoCk purChase plan
The Company’s employee stock purchase plan enables substantially all employees to purchase the Company’s Common Stock at 95% of the market price of the stock on specified offering dates without restriction or at 85% of the market price of the stock on specified offering dates subject to restrictions. The plan, which terminates in December 2017, provides that 1.2 million shares be reserved for purchase. At October 31, 2007, 715,967 shares were available for issuance.
The number of shares and the average price per share issued under this plan during each of the three fiscal years ended October 31, 2007, 2006 and 2005 were 44,606 shares and $22.00, 39,535 shares and $26.54, and 35,026 shares and $38.09, respectively. In fiscal 2007 and 2006, the Company recognized $148 thousand and $144 thousand of compensation expense related to this plan.
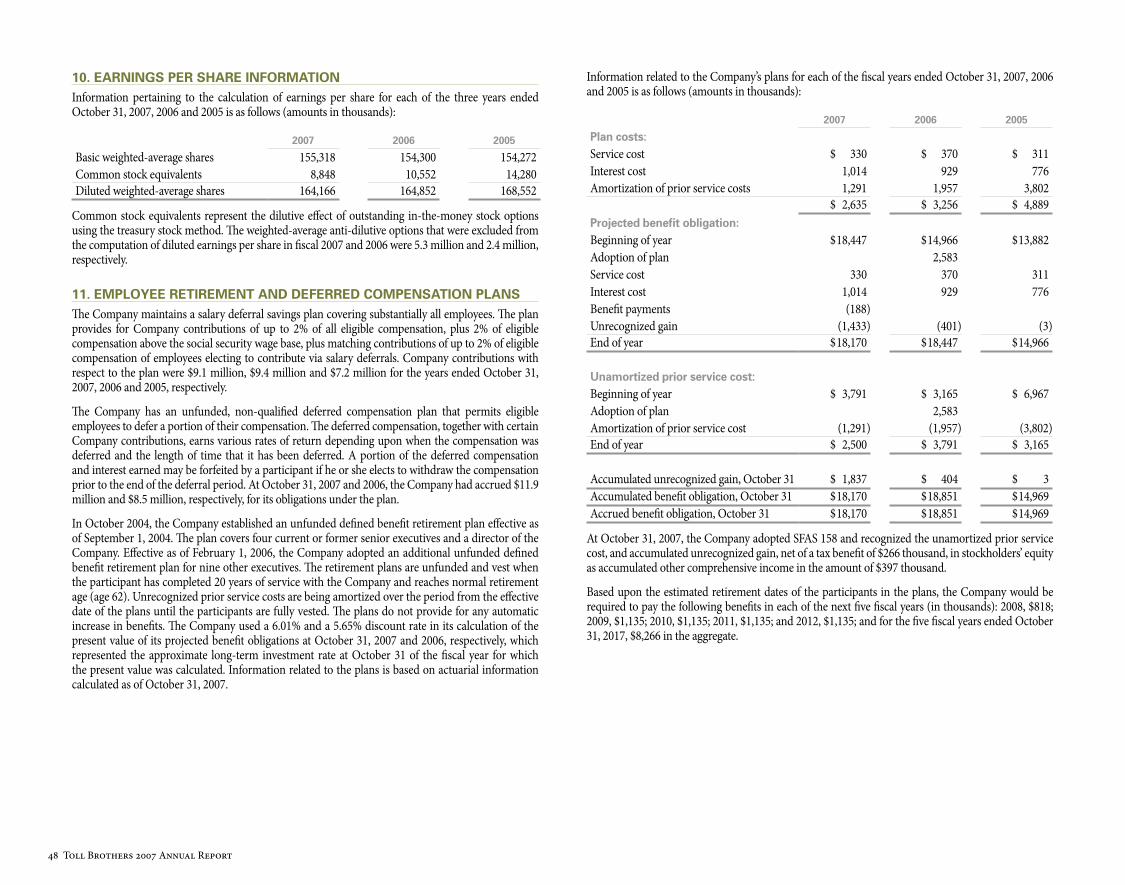
48 Toll Brothers 2007 Annual Report
10. EARNINGS PER ShARE INFORMATIONInformation pertaining to the calculation of earnings per share for each of the three years ended October 31, 2007, 2006 and 2005 is as follows (amounts in thousands):
2007 2006 2005
Basic weighted-average shares 155,318 154,300 154,272 Common stock equivalents 8,848 10,552 14,280 Diluted weighted-average shares 164,166 164,852 168,552
Common stock equivalents represent the dilutive effect of outstanding in-the-money stock options using the treasury stock method. The weighted-average anti-dilutive options that were excluded from the computation of diluted earnings per share in fiscal 2007 and 2006 were 5.3 million and 2.4 million, respectively.
11. EMPlOYEE RETIREMENT AND DEFERRED COMPENSATION PlANSThe Company maintains a salary deferral savings plan covering substantially all employees. The plan provides for Company contributions of up to 2% of all eligible compensation, plus 2% of eligible compensation above the social security wage base, plus matching contributions of up to 2% of eligible compensation of employees electing to contribute via salary deferrals. Company contributions with respect to the plan were $9.1 million, $9.4 million and $7.2 million for the years ended October 31, 2007, 2006 and 2005, respectively.
The Company has an unfunded, non-qualified deferred compensation plan that permits eligible employees to defer a portion of their compensation. The deferred compensation, together with certain Company contributions, earns various rates of return depending upon when the compensation was deferred and the length of time that it has been deferred. A portion of the deferred compensation and interest earned may be forfeited by a participant if he or she elects to withdraw the compensation prior to the end of the deferral period. At October 31, 2007 and 2006, the Company had accrued $11.9 million and $8.5 million, respectively, for its obligations under the plan.
In October 2004, the Company established an unfunded defined benefit retirement plan effective as of September 1, 2004. The plan covers four current or former senior executives and a director of the Company. Effective as of February 1, 2006, the Company adopted an additional unfunded defined benefit retirement plan for nine other executives. The retirement plans are unfunded and vest when the participant has completed 20 years of service with the Company and reaches normal retirement age (age 62). Unrecognized prior service costs are being amortized over the period from the effective date of the plans until the participants are fully vested. The plans do not provide for any automatic increase in benefits. The Company used a 6.01% and a 5.65% discount rate in its calculation of the present value of its projected benefit obligations at October 31, 2007 and 2006, respectively, which represented the approximate long-term investment rate at October 31 of the fiscal year for which the present value was calculated. Information related to the plans is based on actuarial information calculated as of October 31, 2007.
Information related to the Company’s plans for each of the fiscal years ended October 31, 2007, 2006 and 2005 is as follows (amounts in thousands):
2007 2006 2005
Plan costs:Service cost $ 330 $ 370 $ 311 Interest cost 1,014 929 776 Amortization of prior service costs 1,291 1,957 3,802
$ 2,635 $ 3,256 $ 4,889 Projected benefit obligation:Beginning of year $ 18,447 $ 14,966 $ 13,882 Adoption of plan 2,583 Service cost 330 370 311 Interest cost 1,014 929 776 Benefit payments (188)Unrecognized gain (1,433) (401) (3)End of year $ 18,170 $ 18,447 $ 14,966
unamortized prior service cost:Beginning of year $ 3,791 $ 3,165 $ 6,967 Adoption of plan 2,583 Amortization of prior service cost (1,291) (1,957) (3,802)End of year $ 2,500 $ 3,791 $ 3,165
Accumulated unrecognized gain, October 31 $ 1,837 $ 404 $ 3 Accumulated benefit obligation, October 31 $ 18,170 $ 18,851 $ 14,969 Accrued benefit obligation, October 31 $ 18,170 $ 18,851 $ 14,969
At October 31, 2007, the Company adopted SFAS 158 and recognized the unamortized prior service cost, and accumulated unrecognized gain, net of a tax benefit of $266 thousand, in stockholders’ equity as accumulated other comprehensive income in the amount of $397 thousand.
Based upon the estimated retirement dates of the participants in the plans, the Company would be required to pay the following benefits in each of the next five fiscal years (in thousands): 2008, $818; 2009, $1,135; 2010, $1,135; 2011, $1,135; and 2012, $1,135; and for the five fiscal years ended October 31, 2017, $8,266 in the aggregate.
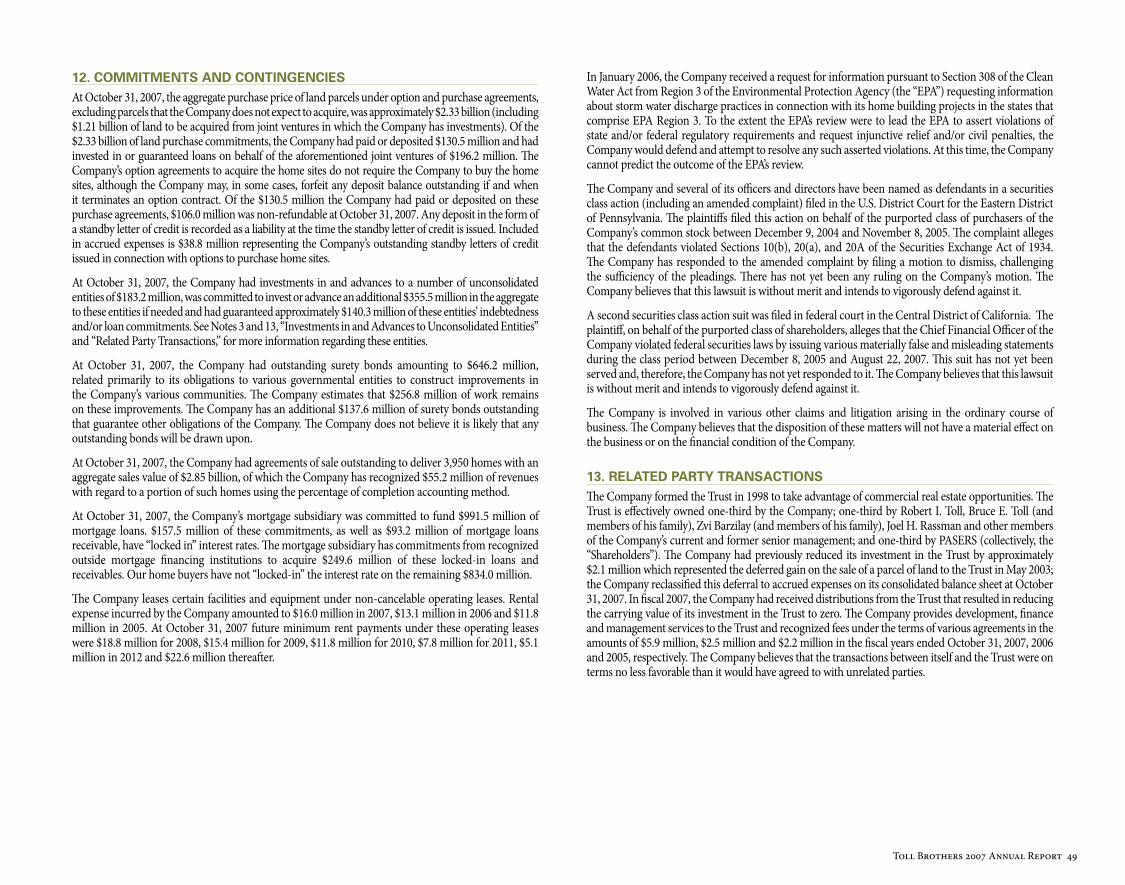
Toll Brothers 2007 Annual Report 49
12. COMMITMENTS AND CONTINGENCIESAt October 31, 2007, the aggregate purchase price of land parcels under option and purchase agreements, excluding parcels that the Company does not expect to acquire, was approximately $2.33 billion (including $1.21 billion of land to be acquired from joint ventures in which the Company has investments). Of the $2.33 billion of land purchase commitments, the Company had paid or deposited $130.5 million and had invested in or guaranteed loans on behalf of the aforementioned joint ventures of $196.2 million. The Company’s option agreements to acquire the home sites do not require the Company to buy the home sites, although the Company may, in some cases, forfeit any deposit balance outstanding if and when it terminates an option contract. Of the $130.5 million the Company had paid or deposited on these purchase agreements, $106.0 million was non-refundable at October 31, 2007. Any deposit in the form of a standby letter of credit is recorded as a liability at the time the standby letter of credit is issued. Included in accrued expenses is $38.8 million representing the Company’s outstanding standby letters of credit issued in connection with options to purchase home sites.
At October 31, 2007, the Company had investments in and advances to a number of unconsolidated entities of $183.2 million, was committed to invest or advance an additional $355.5 million in the aggregate to these entities if needed and had guaranteed approximately $140.3 million of these entities’ indebtedness and/or loan commitments. See Notes 3 and 13, “Investments in and Advances to Unconsolidated Entities” and “Related Party Transactions,” for more information regarding these entities.
At October 31, 2007, the Company had outstanding surety bonds amounting to $646.2 million, related primarily to its obligations to various governmental entities to construct improvements in the Company’s various communities. The Company estimates that $256.8 million of work remains on these improvements. The Company has an additional $137.6 million of surety bonds outstanding that guarantee other obligations of the Company. The Company does not believe it is likely that any outstanding bonds will be drawn upon.
At October 31, 2007, the Company had agreements of sale outstanding to deliver 3,950 homes with an aggregate sales value of $2.85 billion, of which the Company has recognized $55.2 million of revenues with regard to a portion of such homes using the percentage of completion accounting method.
At October 31, 2007, the Company’s mortgage subsidiary was committed to fund $991.5 million of mortgage loans. $157.5 million of these commitments, as well as $93.2 million of mortgage loans receivable, have “locked in” interest rates. The mortgage subsidiary has commitments from recognized outside mortgage financing institutions to acquire $249.6 million of these locked-in loans and receivables. Our home buyers have not “locked-in” the interest rate on the remaining $834.0 million.
The Company leases certain facilities and equipment under non-cancelable operating leases. Rental expense incurred by the Company amounted to $16.0 million in 2007, $13.1 million in 2006 and $11.8 million in 2005. At October 31, 2007 future minimum rent payments under these operating leases were $18.8 million for 2008, $15.4 million for 2009, $11.8 million for 2010, $7.8 million for 2011, $5.1 million in 2012 and $22.6 million thereafter.
In January 2006, the Company received a request for information pursuant to Section 308 of the Clean Water Act from Region 3 of the Environmental Protection Agency (the “EPA”) requesting information about storm water discharge practices in connection with its home building projects in the states that comprise EPA Region 3. To the extent the EPA’s review were to lead the EPA to assert violations of state and/or federal regulatory requirements and request injunctive relief and/or civil penalties, the Company would defend and attempt to resolve any such asserted violations. At this time, the Company cannot predict the outcome of the EPA’s review.
The Company and several of its officers and directors have been named as defendants in a securities class action (including an amended complaint) filed in the U.S. District Court for the Eastern District of Pennsylvania. The plaintiffs filed this action on behalf of the purported class of purchasers of the Company’s common stock between December 9, 2004 and November 8, 2005. The complaint alleges that the defendants violated Sections 10(b), 20(a), and 20A of the Securities Exchange Act of 1934. The Company has responded to the amended complaint by filing a motion to dismiss, challenging the sufficiency of the pleadings. There has not yet been any ruling on the Company’s motion. The Company believes that this lawsuit is without merit and intends to vigorously defend against it.
A second securities class action suit was filed in federal court in the Central District of California. The plaintiff, on behalf of the purported class of shareholders, alleges that the Chief Financial Officer of the Company violated federal securities laws by issuing various materially false and misleading statements during the class period between December 8, 2005 and August 22, 2007. This suit has not yet been served and, therefore, the Company has not yet responded to it. The Company believes that this lawsuit is without merit and intends to vigorously defend against it.
The Company is involved in various other claims and litigation arising in the ordinary course of business. The Company believes that the disposition of these matters will not have a material effect on the business or on the financial condition of the Company.
13. RElATED PARTY TRANSACTIONSThe Company formed the Trust in 1998 to take advantage of commercial real estate opportunities. The Trust is effectively owned one-third by the Company; one-third by Robert I. Toll, Bruce E. Toll (and members of his family), Zvi Barzilay (and members of his family), Joel H. Rassman and other members of the Company’s current and former senior management; and one-third by PASERS (collectively, the “Shareholders”). The Company had previously reduced its investment in the Trust by approximately $2.1 million which represented the deferred gain on the sale of a parcel of land to the Trust in May 2003; the Company reclassified this deferral to accrued expenses on its consolidated balance sheet at October 31, 2007. In fiscal 2007, the Company had received distributions from the Trust that resulted in reducing the carrying value of its investment in the Trust to zero. The Company provides development, finance and management services to the Trust and recognized fees under the terms of various agreements in the amounts of $5.9 million, $2.5 million and $2.2 million in the fiscal years ended October 31, 2007, 2006 and 2005, respectively. The Company believes that the transactions between itself and the Trust were on terms no less favorable than it would have agreed to with unrelated parties.
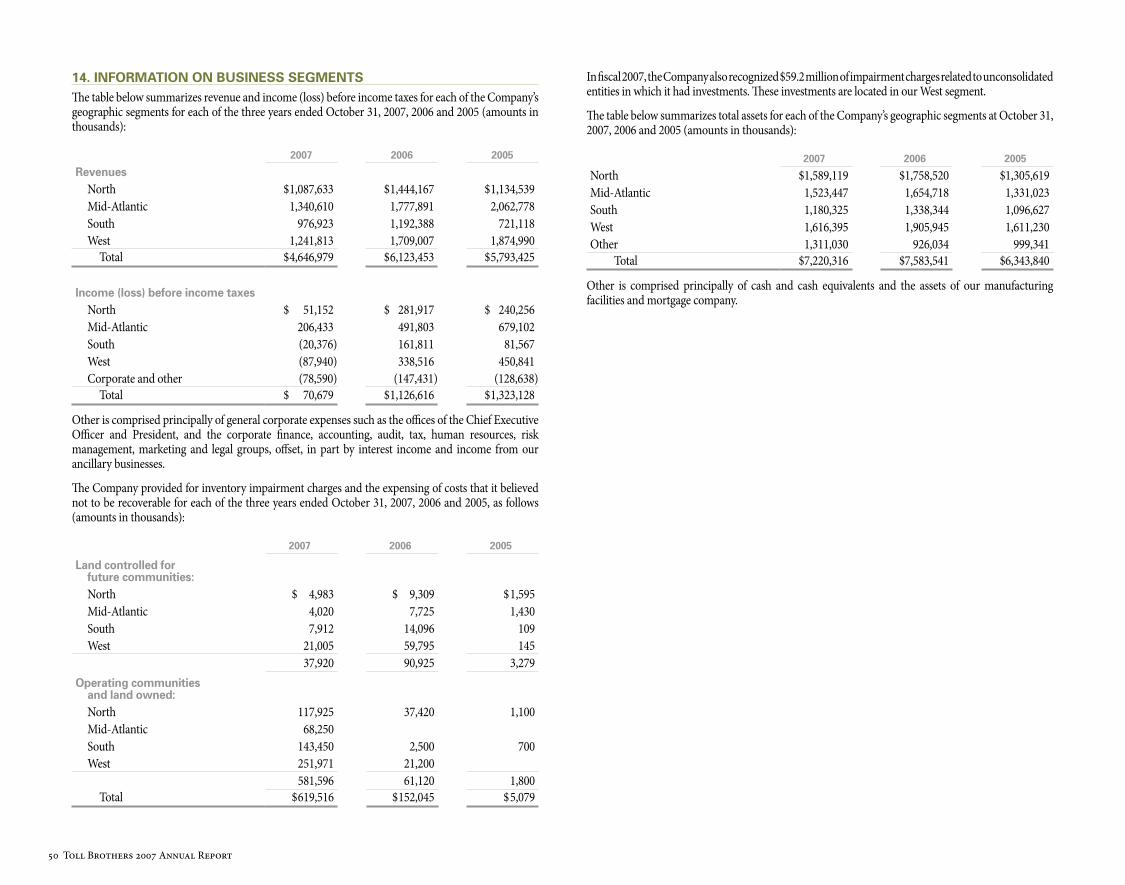
50 Toll Brothers 2007 Annual Report
14. INFORMATION ON BuSINESS SEGMENTSThe table below summarizes revenue and income (loss) before income taxes for each of the Company’s geographic segments for each of the three years ended October 31, 2007, 2006 and 2005 (amounts in thousands):
2007 2006 2005
RevenuesNorth $ 1,087,633 $ 1,444,167 $ 1,134,539 Mid-Atlantic 1,340,610 1,777,891 2,062,778 South 976,923 1,192,388 721,118 West 1,241,813 1,709,007 1,874,990
Total $ 4,646,979 $ 6,123,453 $ 5,793,425
Income (loss) before income taxesNorth $ 51,152 $ 281,917 $ 240,256 Mid-Atlantic 206,433 491,803 679,102 South (20,376) 161,811 81,567 West (87,940) 338,516 450,841 Corporate and other (78,590) (147,431) (128,638)
Total $ 70,679 $ 1,126,616 $ 1,323,128
Other is comprised principally of general corporate expenses such as the offices of the Chief Executive Officer and President, and the corporate finance, accounting, audit, tax, human resources, risk management, marketing and legal groups, offset, in part by interest income and income from our ancillary businesses.
The Company provided for inventory impairment charges and the expensing of costs that it believed not to be recoverable for each of the three years ended October 31, 2007, 2006 and 2005, as follows (amounts in thousands):
2007 2006 2005
land controlled for future communities: North $ 4,983 $ 9,309 $ 1,595 Mid-Atlantic 4,020 7,725 1,430 South 7,912 14,096 109 West 21,005 59,795 145
37,920 90,925 3,279 Operating communities
and land owned:North 117,925 37,420 1,100 Mid-Atlantic 68,250 South 143,450 2,500 700 West 251,971 21,200
581,596 61,120 1,800 Total $ 619,516 $ 152,045 $ 5,079
In fiscal 2007, the Company also recognized $59.2 million of impairment charges related to unconsolidated entities in which it had investments. These investments are located in our West segment.
The table below summarizes total assets for each of the Company’s geographic segments at October 31, 2007, 2006 and 2005 (amounts in thousands):
2007 2006 2005
North $1,589,119 $1,758,520 $1,305,619 Mid-Atlantic 1,523,447 1,654,718 1,331,023 South 1,180,325 1,338,344 1,096,627 West 1,616,395 1,905,945 1,611,230 Other 1,311,030 926,034 999,341
Total $7,220,316 $7,583,541 $6,343,840
Other is comprised principally of cash and cash equivalents and the assets of our manufacturing facilities and mortgage company.
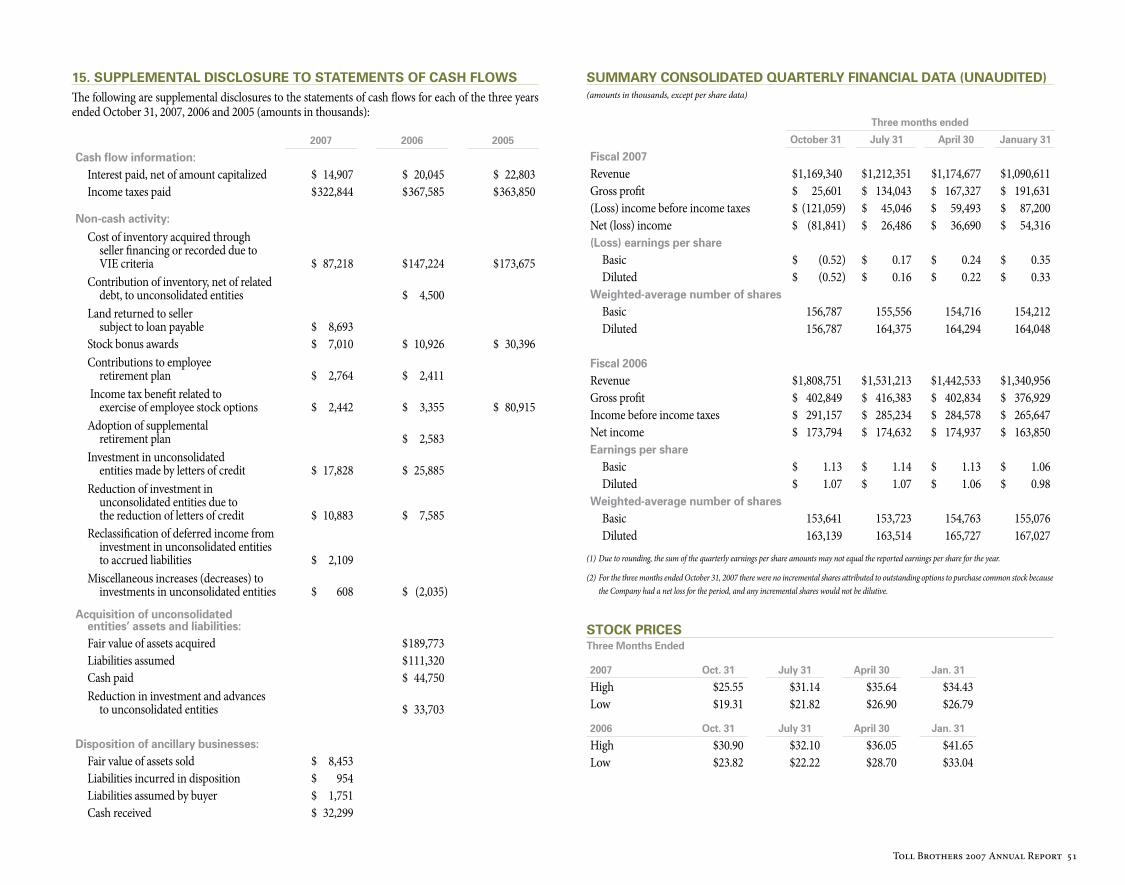
Toll Brothers 2007 Annual Report 51
SuMMARY CONSOlIDATED QuARTERlY FINANCIAl DATA (uNAuDITED)(amounts in thousands, except per share data)
Three months ended
October 31 July 31 April 30 January 31
Fiscal 2007Revenue $ 1,169,340 $ 1,212,351 $1,174,677 $ 1,090,611 Gross profit $ 25,601 $ 134,043 $ 167,327 $ 191,631 (Loss) income before income taxes $ (121,059) $ 45,046 $ 59,493 $ 87,200 Net (loss) income $ (81,841) $ 26,486 $ 36,690 $ 54,316 (loss) earnings per share
Basic $ (0.52) $ 0.17 $ 0.24 $ 0.35 Diluted $ (0.52) $ 0.16 $ 0.22 $ 0.33
Weighted-average number of sharesBasic 156,787 155,556 154,716 154,212 Diluted 156,787 164,375 164,294 164,048
Fiscal 2006Revenue $ 1,808,751 $ 1,531,213 $ 1,442,533 $ 1,340,956 Gross profit $ 402,849 $ 416,383 $ 402,834 $ 376,929 Income before income taxes $ 291,157 $ 285,234 $ 284,578 $ 265,647 Net income $ 173,794 $ 174,632 $ 174,937 $ 163,850 Earnings per share
Basic $ 1.13 $ 1.14 $ 1.13 $ 1.06 Diluted $ 1.07 $ 1.07 $ 1.06 $ 0.98
Weighted-average number of sharesBasic 153,641 153,723 154,763 155,076 Diluted 163,139 163,514 165,727 167,027
(1) Due to rounding, the sum of the quarterly earnings per share amounts may not equal the reported earnings per share for the year.
(2) For the three months ended October 31, 2007 there were no incremental shares attributed to outstanding options to purchase common stock because the Company had a net loss for the period, and any incremental shares would not be dilutive.
15. SuPPlEMENTAl DISClOSuRE TO STATEMENTS OF CASh FlOWS The following are supplemental disclosures to the statements of cash flows for each of the three years ended October 31, 2007, 2006 and 2005 (amounts in thousands):
2007 2006 2005
Cash flow information:Interest paid, net of amount capitalized $ 14,907 $ 20,045 $ 22,803 Income taxes paid $ 322,844 $ 367,585 $ 363,850
Non-cash activity:
Cost of inventory acquired through seller financing or recorded due to VIE criteria $ 87,218 $ 147,224 $ 173,675
Contribution of inventory, net of related debt, to unconsolidated entities $ 4,500
Land returned to seller subject to loan payable $ 8,693
Stock bonus awards $ 7,010 $ 10,926 $ 30,396 Contributions to employee
retirement plan $ 2,764 $ 2,411 Income tax benefit related to
exercise of employee stock options $ 2,442 $ 3,355 $ 80,915Adoption of supplemental
retirement plan $ 2,583 Investment in unconsolidated
entities made by letters of credit $ 17,828 $ 25,885 Reduction of investment in
unconsolidated entities due to the reduction of letters of credit $ 10,883 $ 7,585
Reclassification of deferred income from investment in unconsolidated entities to accrued liabilities $ 2,109
Miscellaneous increases (decreases) to investments in unconsolidated entities $ 608 $ (2,035)
Acquisition of unconsolidated entities’ assets and liabilities:Fair value of assets acquired $ 189,773 Liabilities assumed $ 111,320 Cash paid $ 44,750 Reduction in investment and advances
to unconsolidated entities $ 33,703
Disposition of ancillary businesses:Fair value of assets sold $ 8,453 Liabilities incurred in disposition $ 954 Liabilities assumed by buyer $ 1,751 Cash received $ 32,299
STOCK PRICESThree Months Ended
2007 Oct. 31 July 31 April 30 Jan. 31
High $25.55 $31.14 $35.64 $34.43Low $19.31 $21.82 $26.90 $26.79
2006 Oct. 31 July 31 April 30 Jan. 31
High $30.90 $32.10 $36.05 $41.65Low $23.82 $22.22 $28.70 $33.04
52 Toll Brothers 2007 Annual Report
Robert I. Toll* Chairman of the Board & Chief Executive Officer
Bruce E. Toll
Vice Chairman of the BoardPresident - BET Investments, an office and commercial real
estate company, andChairman - Philadelphia Media Holdings, LLC, parent
company of the Philadelphia Inquirer and Philadelphia Daily News
Zvi Barzilay*President and Chief Operating Officer
Robert S. BlankCo-Chairman & Co-CEO - Whitney Communications
Company, andSenior Partner - Whitcom Partners, media companies
Edward G. BoehneRetired President - Federal Reserve Bank of Philadelphia
Richard J. BraemerPartner - Ballard, Spahr, Andrews & Ingersoll, LLP,
Attorneys at Law
Roger S. HillasRetired Chairman - Meritor Savings Bank
Carl B. MarbachPresident - Greater Marbach Airlines, Inc., and
Florida Professional Aviation, Inc., aviation services and consulting companies
Stephen A. NovickSenior Advisor - The Andrea and Charles Bronfman
Philanthropies
Joel H. Rassman*Executive Vice President, Treasurer and Chief Financial Officer
Paul E. ShapiroChairman - Q Capital Strategies, LLC, a life settlement
company
*Executive Officer and Director of the Company
Corporate Officers
CORPORATE ADMINISTRATION
Frederick N. Cooper Finance & Investor RelationsJonathan C. Downs Human Resources Mark K. Kessler General Counsel &
Chief Compliance OfficerKira McCarron Chief Marketing Officer
Kevin J. McMaster ControllerGeorge W. Nelson Chief Information OfficerJoseph R. Sicree Chief Accounting OfficerMichael I. Snyder Secretary & Chief Planning OfficerWerner Thiessen Acquisitions
Suzanne BarlettoGerald L. BelfiglioLinda B. CohenSandy ColdenJoseph R. DeSanto
Evan G. ErnestPatrick GalliganRobert J. GirvinMichael J. GrubbDaniel J. Kennedy
Michael L. LaPatManfred P. MarottaJohn K. McDonald Michael SmithStephen A. Turbyfill
Mark J. WarshauerMichele WolfeKathryn L. Yates
Keith L. AndersonRoger A. BrushKevin D. DuermitJohn P. ElcanoChristopher G. GaffneyJohn G. Mangano
Glen H. MartinGary M. MayoThomas J. MurrayH. Jon PaynterRalph E. ReinertDouglas C. Shipe
Thomas J. AnhutJeffrey A. BartosCharles W. BowieJohn D. BuntingAnthony E. CasapullaJ. Michael DonnellyJames H. HarrisonGregory E. KamedulskiDan L. Martin
Richard C. McCormickThomas R. MulveyChris MyersRichard M. NelsonWalt I. NowakMichael J. PalmerCharles B. RaddatzWilliam C. ReillyJohn Vitella
Peter AllesRobert D. FrakesBenjamin D. JogodnikJames A. Majewski, Jr.Robert G. PaulAnthony J. RoccoJeffrey SchnurrAndrew M. SternKenneth S. ThirtyacreDaniel C. Zalinsky
David B. AndersonEric C. AndersonRonald BlumCharles T. BrederWilliam H. ByeJames C. CarrawayJoseph CaulfieldJohn ChristensenScott L. ColemanCharles M. ConnorsRobert L. CraigMark O. DavisAlan E. EuvrardRobert L. FlahertyThomas G. GestiteMichael D. GlennJohn D. HarrisThomas E. HausleRobert M. HodakWilliam M. HolmesGordon Ivascu
Robert A. JohnsonRobert J. KardosGregory J. LaGrecaBrian F. LoftusSheila N. McGuireLloyd S. MillerCynthia L. MorseBrad H. NelsonScott S. NodlandMark J. NosalWilliam D. PerryDavid K. SadlerWilliam N. SchmidtRichard N. SchoonmakerJohn P. SzakatsCharles W. TempletonDavid E. TorresAlan R. TruittDavid Von SpreckelsenRyan D. Walter
Thomas A. Argyris, Jr.James W. BoydBarry A. DepewWilliam J. GilliganRichard T. HartmanRobert ParahusEdward D. WeberDouglas C. Yearley, Jr.
hOME BuIlDING OPERATIONS
Eastern States Engineering, Inc. Christopher E. Stocke - Vice PresidentTBI Mortgage® Company Donald L. Salmon - PresidentToll Architecture, Inc. Jed Gibson - PresidentToll Brothers Realty Trust James M. Steuterman - Sr. Vice President
Toll Landscape, L.L.C. Mark Culichia - Vice PresidentWestminster Security Company Felicia Ratka - PresidentWestminster Title Company, Inc. William T. Unkel - President
Donald R. BarnesPaul BrukardtRobert B. FullerCharles M. Hare
James H. Harrington, Jr.Terry R. HodgeJohn JakominichMitchell P. Laskowitz
James MannersWilliam Morrison, Jr.Michael T. NolesEdward Oliu
Russel V. PowellMark D. SimmsRonnie E. SnyderChristopher S. Utschig
BOARD OF DIRECTORS AND ExECuTIVE OFFICERS
lAND ACQuISITION, lAND DEVElOPMENT, AND COuNTRY CluB OPERATIONS
Division Vice Presidents
Division Presidents
SuBSIDIARY AND AFFIlIATE OPERATIONS
Division Senior Vice Presidents
Group Presidents
Regional Presidents
Senior Vice Presidents
ExecutiveVice President
Robert N. McCarronDavid H. Richey
Joseph J. Palka
Vice Presidents
Senior Vice Presidents Vice Presidents
Employee listings are as of 11/1/07
CORPORATE OFFICE
Toll Brothers, Inc. 250 Gibraltar Road, Horsham, Pennsylvania 19044 215-938-8000 • TollBrothers.com
TRANSFER AGENT AND REGISTRAR
American Stock Transfer & Trust Company 59 Maiden Lane, New York, New York 10038 1-800-937-5449 • www.amstock.com
INDEPENDENT AuDITORS
Ernst & Young LLP — Philadelphia, Pennsylvania
SECuRITIES COuNSEl
Wolf, Block, Schorr and Solis-Cohen LLP — Philadelphia, Pennsylvania
EMPlOYEES
As of October 31, 2007, we had 4,329 full-time employees.
STOCKhOlDERS
As of December 7, 2007, we had 934 stockholders of record.
STOCK lISTING
Our common stock is traded on the New York Stock Exchange (symbol “TOL”).
CERTIFICATIONS
Our Chief Executive Officer and Chief Financial Officer have filed their certifications as required by the SEC regarding the quality of our public disclosures for each of the periods ended during our fiscal year ended October 31, 2007. Further, our Chief Executive Officer has certified to the New York Stock Exchange (“NYSE”) that he is not aware of any violation by our Company of NYSE corporate governance listing standards, as required by Section 303A.12(a) of the NYSE Listed Company Manual.
PRODuCTION NOTES
photography
James B. Abbott, John Benson, Mark Boisclair, Robert Brantley, James Christy, Dick Durrance, Faulkner Studios, Vance Fox Photography, Lance Gordon, Eric Kieley, Barry Kinsella, Steven McBride, Vic Moss Photography, Frank Short, Ray Strawbridge, William Taylor, Kim Wendell Design Studios, Jim Wilson
photos
Front Cover: Henley Versailles at Chapman’s Corner, Wrightstown, PA Back Cover: Sorrento at Dublin Ranch clubhouse, Dublin, CA
DEMOGRAPhIC AND OThER DATA
Sources for the data included in this annual report include Banc of America Securities; Bloomberg L.P.; Citigroup; Claritas; Credit Suisse; Federal National Mortgage Association; Federal Reserve Bank; Federal Reserve Board; Federal Home Loan Mortgage Corporation; Federal Housing Finance Board; Harvard Institute of Economic Research; International Strategy & Investment Group; Joint Center for Housing Studies – Harvard University; Mortgage Bankers Association; National Association of Home Builders; National Association of Realtors®; The New York Times; Office of Federal Housing Enterprises Oversight; UBS Securities; U.S. Census Bureau; U.S. Commerce Department; U.S. Department of Labor; Wachovia Securities; The Wall Street Journal; YAHOO! Finance.
INVESTOR RElATIONS INFORMATION REQuESTS
Our Annual Report on Form 10-K, Quarterly Reports on Form 10-Q, and other Company information are available on or through our website, TollBrothers.com, or upon request from the Co-Directors of Investor Relations at our Corporate Office:
Frederick N. Cooper, Senior Vice President – Finance & Investor Relations [email protected] • 215-938-8312
Joseph R. Sicree, Senior Vice President – Chief Accounting Officer [email protected] • 215-938-8045
Our Board of Directors has an audit committee, an executive compensation committee, and a nominating and corporate governance committee. Each of these committees has a formal charter. We also have Corporate Governance guidelines, a Code of Ethics for the Principal Executive Officer and Senior Financial Officers, and a Code of Ethics and Business Conduct which applies to all directors, officers, and employees. Copies of these charters, guidelines, and codes can be obtained on our website and are also available upon request from the Co-Directors of Investor Relations listed above.
STATEMENT ON FORWARD-lOOKING INFORMATION
Certain information included herein and in other Company reports, SEC filings, verbal or written statements and presentations is forward-looking within the meaning of the Private Securities Litigation Reform Act of 1995, including, but not limited to, information related to anticipated operating results, financial resources, changes in revenues, changes in profitability, changes in margins, changes in accounting treatment, interest expense, land-related write-downs, effects of home buyer cancellations, growth and expansion, anticipated income to be realized from our investments in unconsolidated entities, the ability to acquire land, the ability to gain approvals and to open new communities, the ability to sell homes and properties, the ability to deliver homes from backlog, the ability to secure materials and subcontractors, the ability to produce the liquidity and capital necessary to expand and take advantage of opportunities in the future, industry trends, and stock market valuations. Such forward-looking information involves important risks and uncertainties that could significantly affect actual results and cause them to differ materially from expectations expressed herein and in other Company reports, SEC filings, statements and presentations. These risks and uncertainties include local, regional and national economic conditions, the demand for homes, domestic and international political events, uncertainties created by terrorist attacks, the effects of governmental regulation, the competitive environment in which the Company operates, fluctuations in interest rates, changes in home prices, the availability and cost of land for future growth, adverse market conditions that could result in substantial inventory write-downs, the availability of capital, uncertainties and fluctuations in capital and securities markets, changes in tax laws and their interpretation, legal proceedings, the availability of adequate insurance at reasonable cost, the ability of customers to obtain adequate and affordable financing for the purchase of homes, the ability of home buyers to sell their existing homes, the availability and cost of labor and materials, and weather conditions. Any or all of the forward-looking statements included herein and in any Company reports of public statements are not guarantees of future performance and may turn out to be inaccurate. Forward-looking statements speak only as of the date they are made. We undertake no obligation to publicly update any forward-looking statements, whether as a result of new information, future events or otherwise.
Designed by R. Craig Schmauk. Copyright 2007 by Toll Brothers, Inc.

2 Toll Brothers 2007 Annual Report
250 Gibraltar road
Horsham, Pennsylvania 19044
TollBrothers.com