Third Quarter 2009Third Quarter 2009Third Quarter 2009 Project Progress and Financial UpdateProject Progress and Financial UpdateProject Progress and Financial Update
Released: November 2009
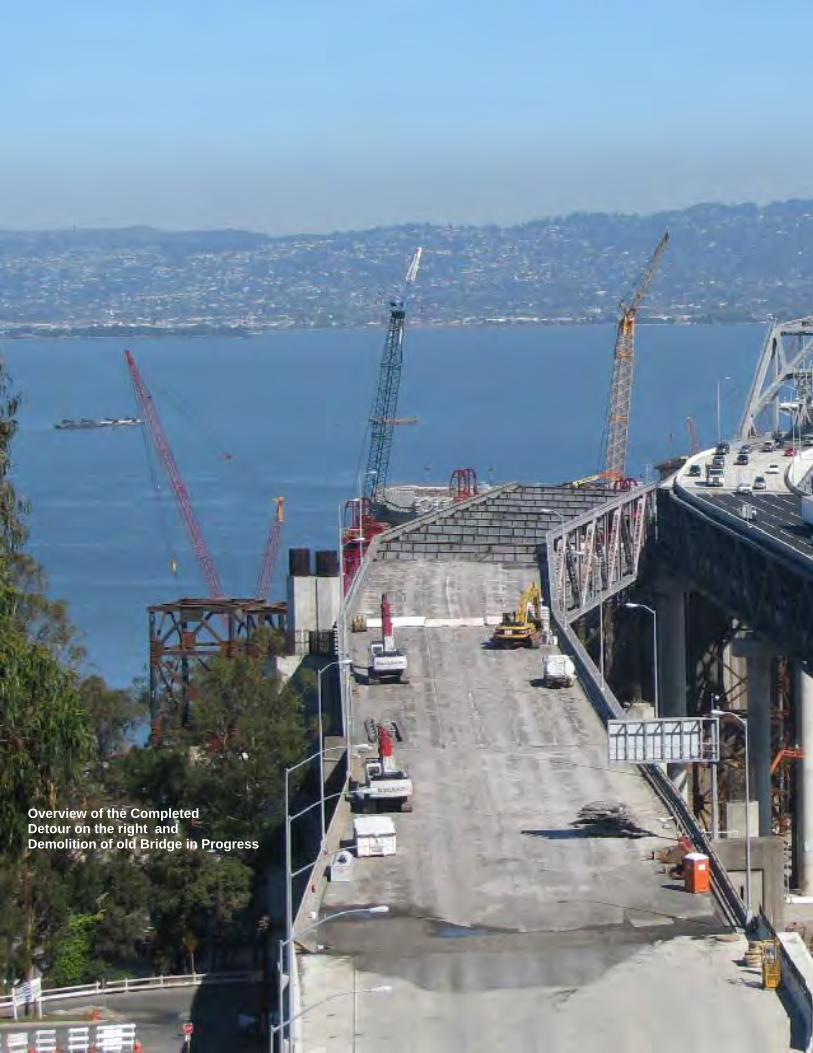
Overview of the Completed Detour on the right and Demolition of old Bridge in Progress
TOLL BRIDGE SEISMIC RETROFIT AND REGIONAL MEASURE 1 PROGRAMS
Other Contracts .................................................................................................................................................. 34
Program Funding Status ....................................................................................................................................... 48
Seismic Retrofit of Dumbarton and Antioch Bridges ......................................................................................... 51
Other Completed RM1 Projects............................................................................................................................ 64
San Diego-Coronado Bridge Seismic Retrofit Complete
Vincent Thomas Bridge Seismic Retrofit Complete
The new Benicia-Martinez Bridge is part of a larger program of toll-funded projects called the Regional Measure 1 (RM1) Toll
Bridge Program under the responsibility of BATA and Caltrans. While the rest of the projects in the RM1 program are not di
rectly under the responsibility of the TBPOC, BATA and Caltrans will continue to report on their progress as an informational
item. The RM1 program includes:
Regional Measure 1 Projects Open to Traffic Status
Interstate 880/State Route 92 Interchange Reconstruction Construction
1962 Benicia-Martinez Bridge Reconstruction Open
New Benicia-Martinez Bridge Open
Richmond-San Rafael Bridge Deck Overlay Rehabilitation Open
Richmond-San Rafael Bridge Trestle, Fender & Deck Joint Rehabilitation Open
Westbound Carquinez Bridge Replacement Open
San Mateo-Hayward Bridge Widening Open
State Route 84 Bayfront Expressway Widening Open
Richmond Parkway Open
1
Toll Bridge Program Oversight Committee
SUMMARY OF MAJOR PROJECT HIGHLIGHTS, ISSUES, AND ACTIONS
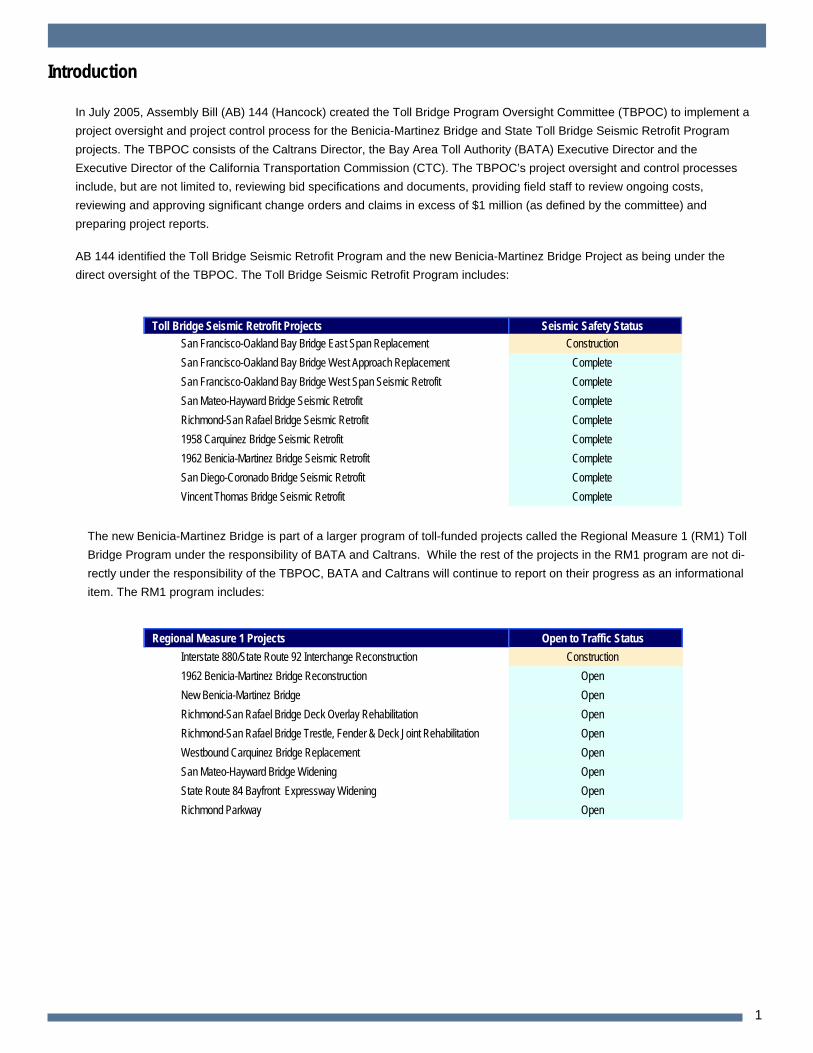
SAS Tower Lifting up Lift 1 South Shaft Tower to Vertical Position
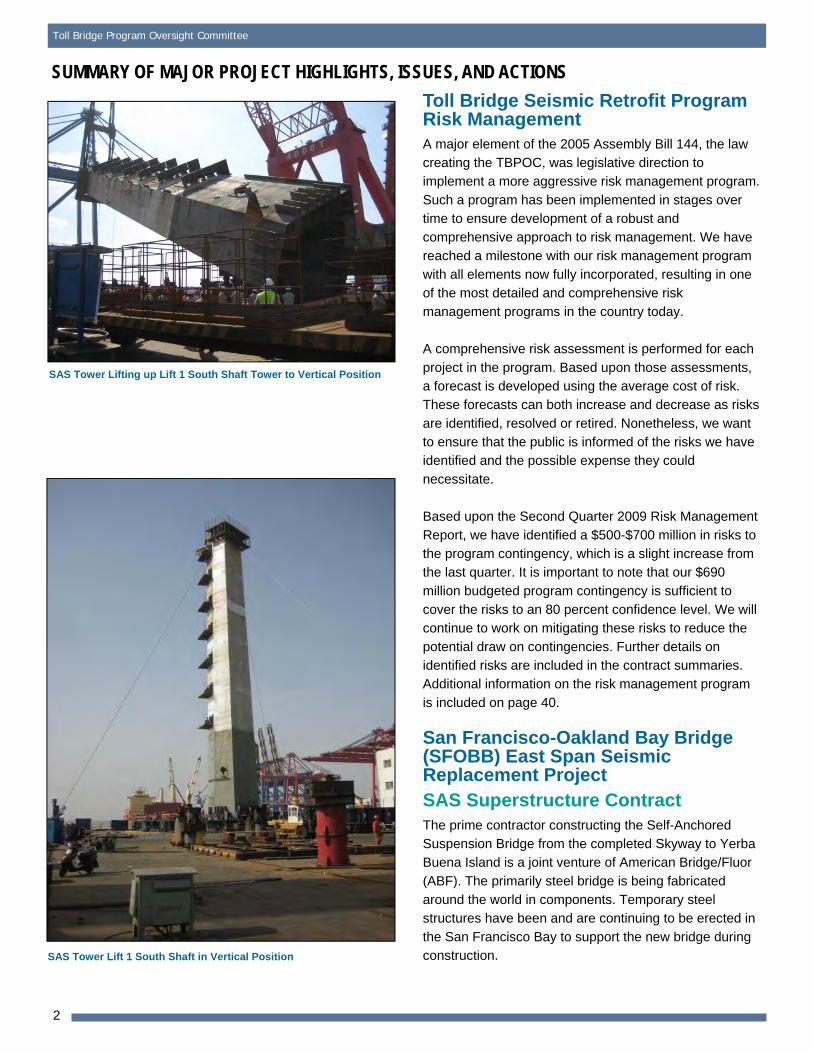
SAS Tower Lift 1 South Shaft in Vertical Position
Toll Bridge Seismic Retrofit Program Risk Management A major element of the 2005 Assembly Bill 144, the law creating the TBPOC, was legislative direction to implement a more aggressive risk management program.
Such a program has been implemented in stages over time to ensure development of a robust and comprehensive approach to risk management. We have
reached a milestone with our risk management program with all elements now fully incorporated, resulting in one of the most detailed and comprehensive risk
management programs in the country today.
A comprehensive risk assessment is performed for each
project in the program. Based upon those assessments, a forecast is developed using the average cost of risk. These forecasts can both increase and decrease as risks
are identified, resolved or retired. Nonetheless, we want to ensure that the public is informed of the risks we have identified and the possible expense they could
necessitate.
Based upon the Second Quarter 2009 Risk Management
Report, we have identified a $500-$700 million in risks to the program contingency, which is a slight increase from the last quarter. It is important to note that our $690
million budgeted program contingency is sufficient to cover the risks to an 80 percent confidence level. We will continue to work on mitigating these risks to reduce the
potential draw on contingencies. Further details on identified risks are included in the contract summaries. Additional information on the risk management program
is included on page 40.
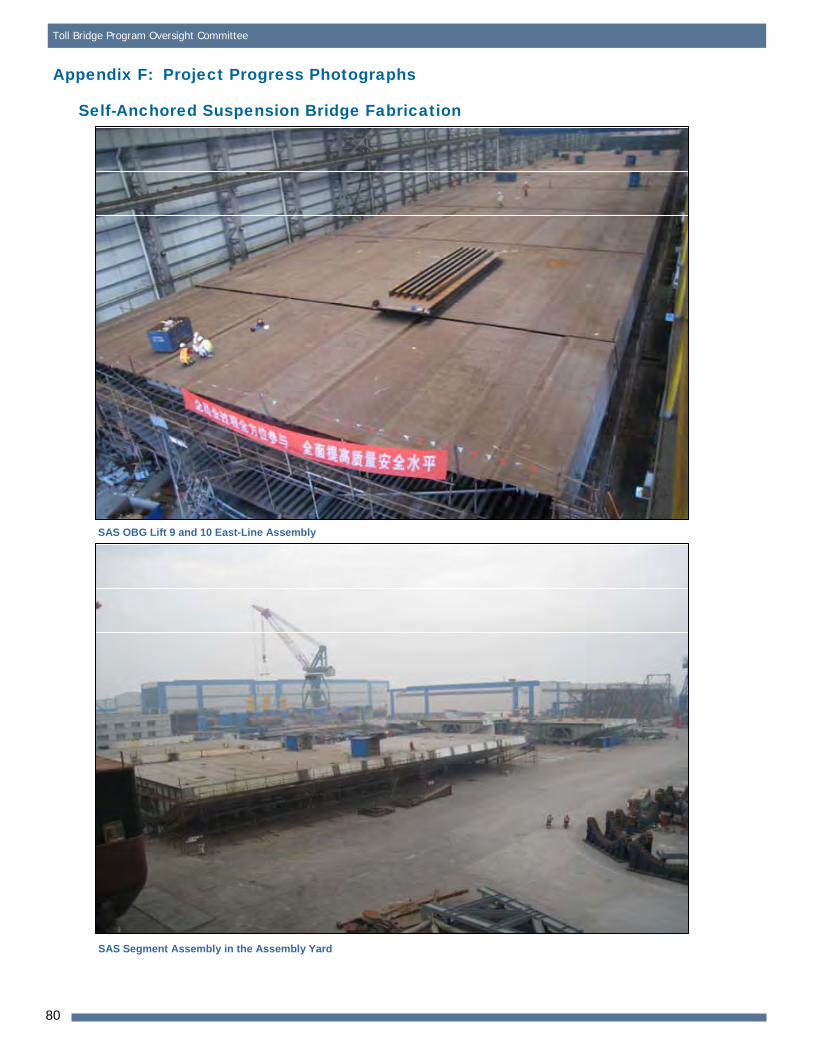
San Francisco-Oakland Bay Bridge (SFOBB) East Span SeismicReplacement Project SAS Superstructure Contract The prime contractor constructing the Self-Anchored Suspension Bridge from the completed Skyway to Yerba Buena Island is a joint venture of American Bridge/Fluor
(ABF). The primarily steel bridge is being fabricated around the world in components. Temporary steel structures have been and are continuing to be erected in
the San Francisco Bay to support the new bridge during construction.
2
Third Quarter 2009 Project Progress and Financial Update
The contractor has reported that fabrication of the steel tower and roadway boxes has fallen 15 months behind
schedule due to the complexity of the design and fabrication. The first shipment of roadway boxes (segments 1 through 4) are anticipated by the end of
2009, while the first tower segments are not expected until next year. All components have undergone a rigorous quality review by Shanghai Zhenhua Heavy
Industry Co. Ltd. (ZPMC), ABF, and Caltrans to ensure that only bridge components that have been built in accordance to the specifications will be shipped.
On the critical path to completing the bridge is the fabrication of the last two roadway sections at the east
end of the new span (Segments 13 and 14). Fabrication of these segments has fallen behind schedule due to delays in the fabrication drawing preparation process.
The TBPOC is exploring options to improve review times and communication, including locating additional design staff with shop drawing drafters in Vancouver,
Canada. These delays are likely to prevent the westbound opening of the bridge in 2012, but we continue to push for full opening of the bridge in 2013.
Caltrans has established risk management teams to evaluate these challenges and to identify future potential
risks to completing the project on time and on budget. In particular, teams are reviewing cable erection plans and mitigation actions. Based on the latest risk management
assessment, there is a potential for a $260 million increase on the SAS contract.
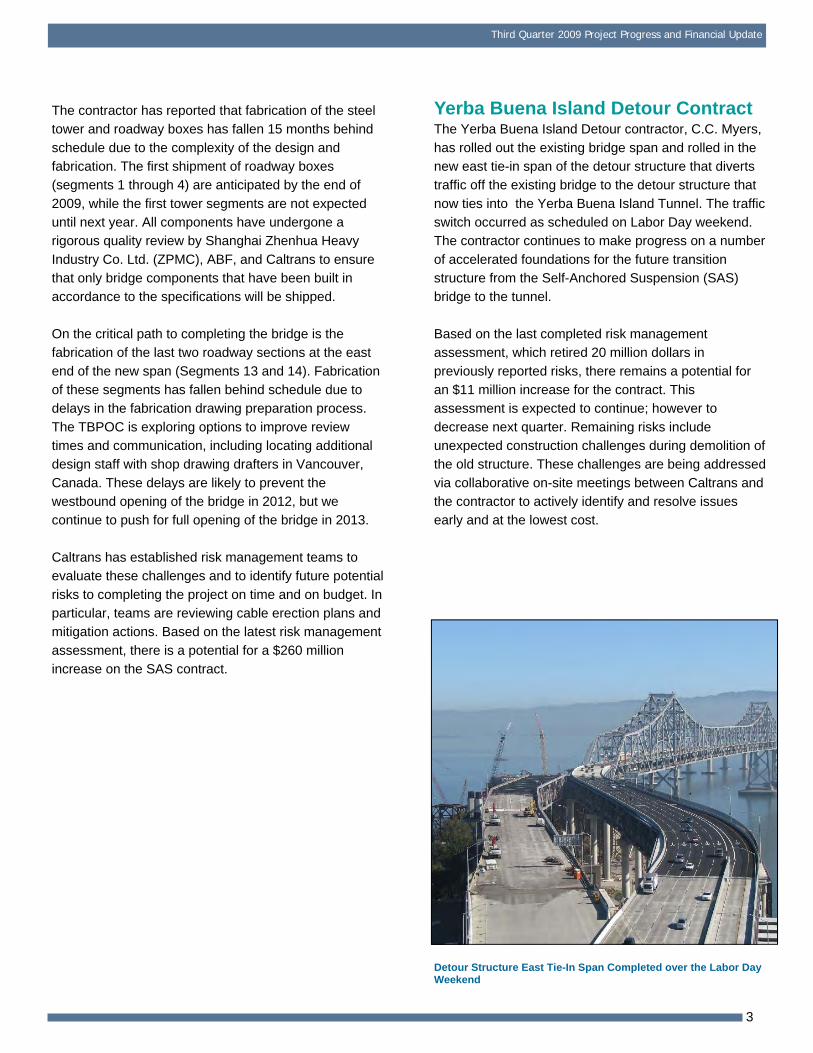
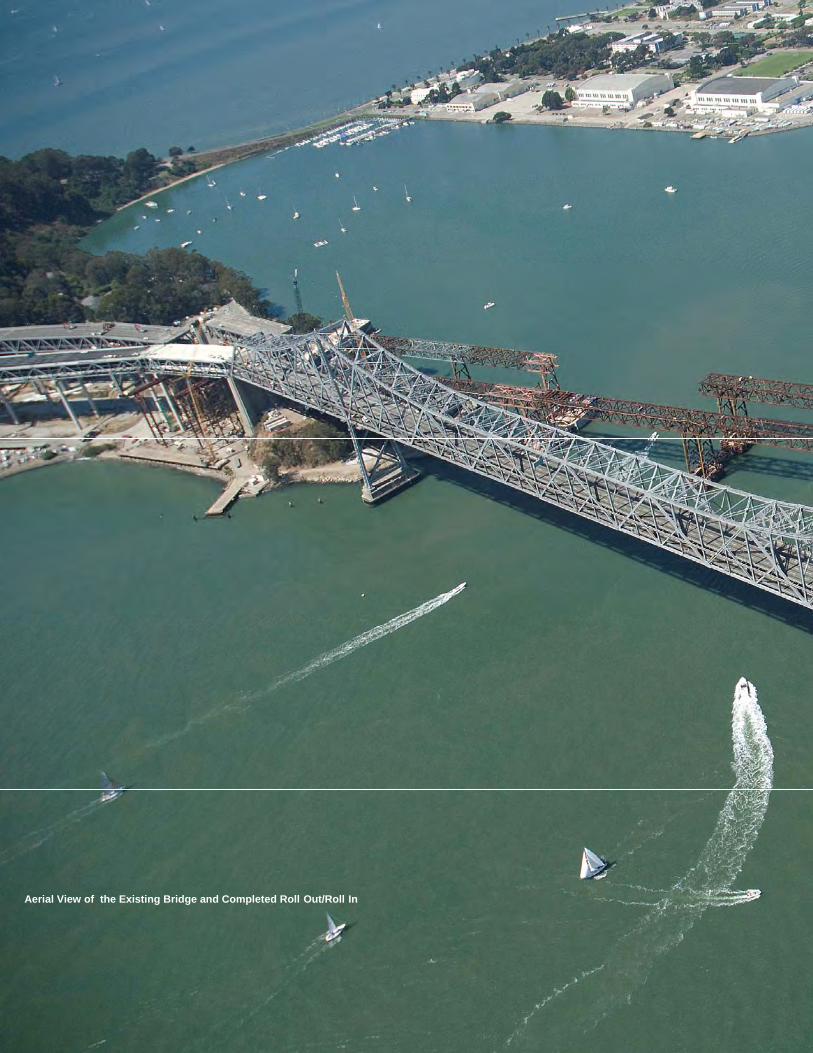
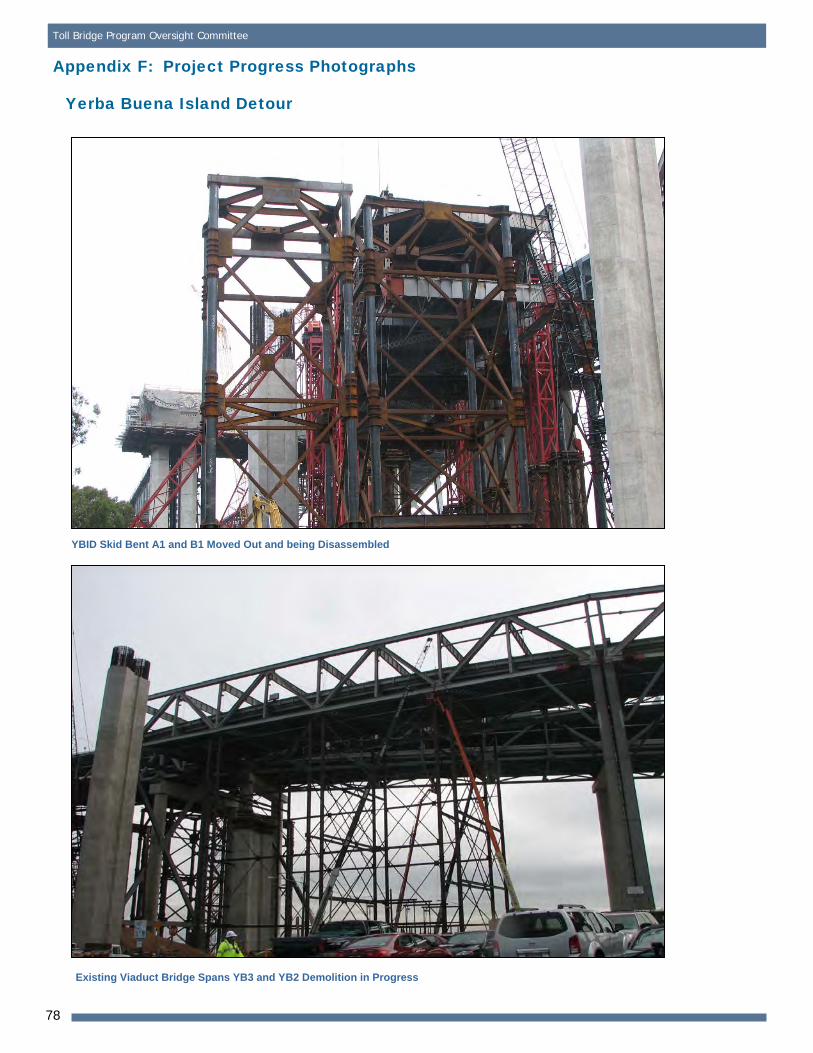
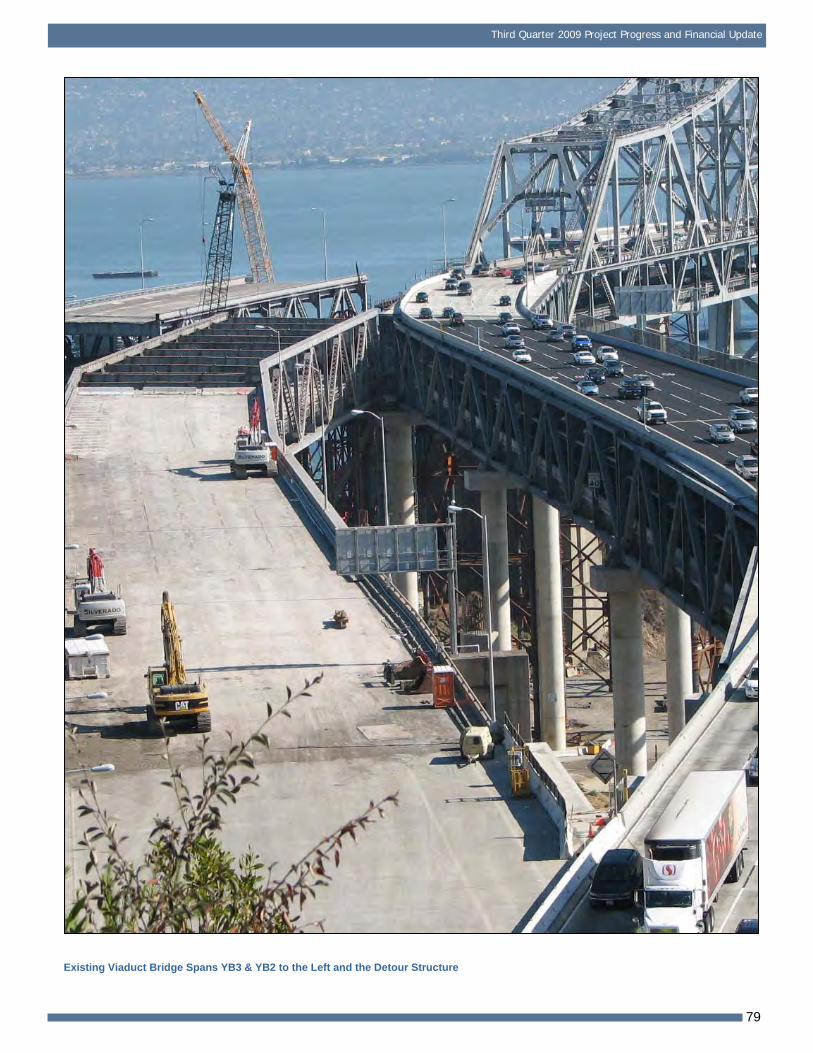
Yerba Buena Island Detour Contract The Yerba Buena Island Detour contractor, C.C. Myers,
has rolled out the existing bridge span and rolled in the new east tie-in span of the detour structure that diverts traffic off the existing bridge to the detour structure that
now ties into the Yerba Buena Island Tunnel. The traffic switch occurred as scheduled on Labor Day weekend. The contractor continues to make progress on a number
of accelerated foundations for the future transition structure from the Self-Anchored Suspension (SAS) bridge to the tunnel.
Based on the last completed risk management assessment, which retired 20 million dollars in
previously reported risks, there remains a potential for an $11 million increase for the contract. This assessment is expected to continue; however to
decrease next quarter. Remaining risks include unexpected construction challenges during demolition of the old structure. These challenges are being addressed
via collaborative on-site meetings between Caltrans and the contractor to actively identify and resolve issues early and at the lowest cost.
Detour Structure East Tie-In Span Completed over the Labor Day Weekend
3
Toll Bridge Program Oversight Committee
Oakland Touchdown Mole Substation
SUMMARY OF MAJOR PROJECT HIGHLIGHTS, ISSUES, AND ACTIONS
Oakland Touchdown Contract In early August, the Oakland Touchdown (OTD) contractor,
MCM, continues to be ahead of schedule and has opened construction access on the new westbound OTD structure to the Skyway. Work continues on the eastbound structure.
TBSRP Capital Outlay Support Based on initial discussions with our contractors, early
completion of the East Span Project was believed to be possible and sufficient to mitigate potential identified support cost increases. The support cost increases are due primarily
to the need to re-advertise the SAS contract and to decisions made to increase our opportunities for early completion of the East Span Project and potential for support cost savings.
These decisions include a 12-month schedule extension provided during bid time to attract the maximum number of bidders for the SAS contract and extension of the YBI Detour
contract to advance future foundation and column work of the transition structure and west-end deck reconstruction. Since we now judge early completion and the intended cost
savings to be unlikely, we forecast a potential drawdown of $244 million from the program contingency for project support. Further increases in project support costs would be
expected if the project is delayed beyond the 2013 forecast bridge opening date.
TBSRP Programmatic Risks This category includes risks that are not yet scoped within existing contracts and/or that spread across multiple
contracts. The interdependencies between all of the contracts in the program result in the potential for delays on one contract to impact the other contracts.
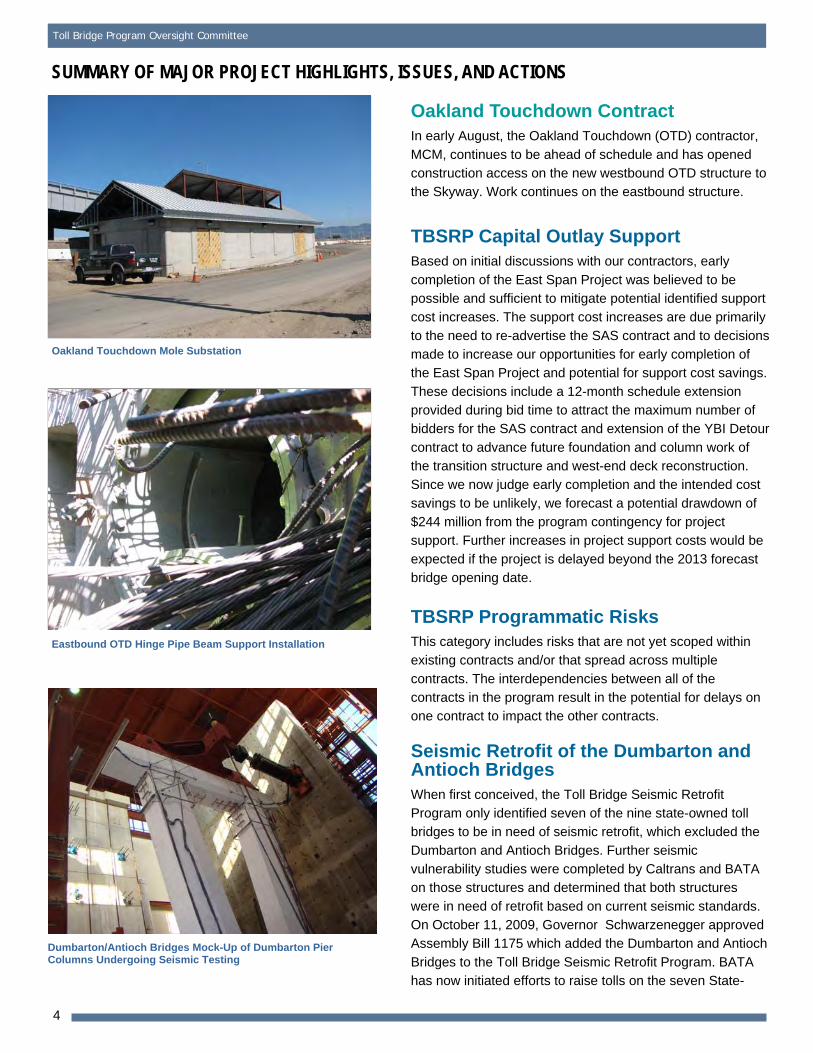
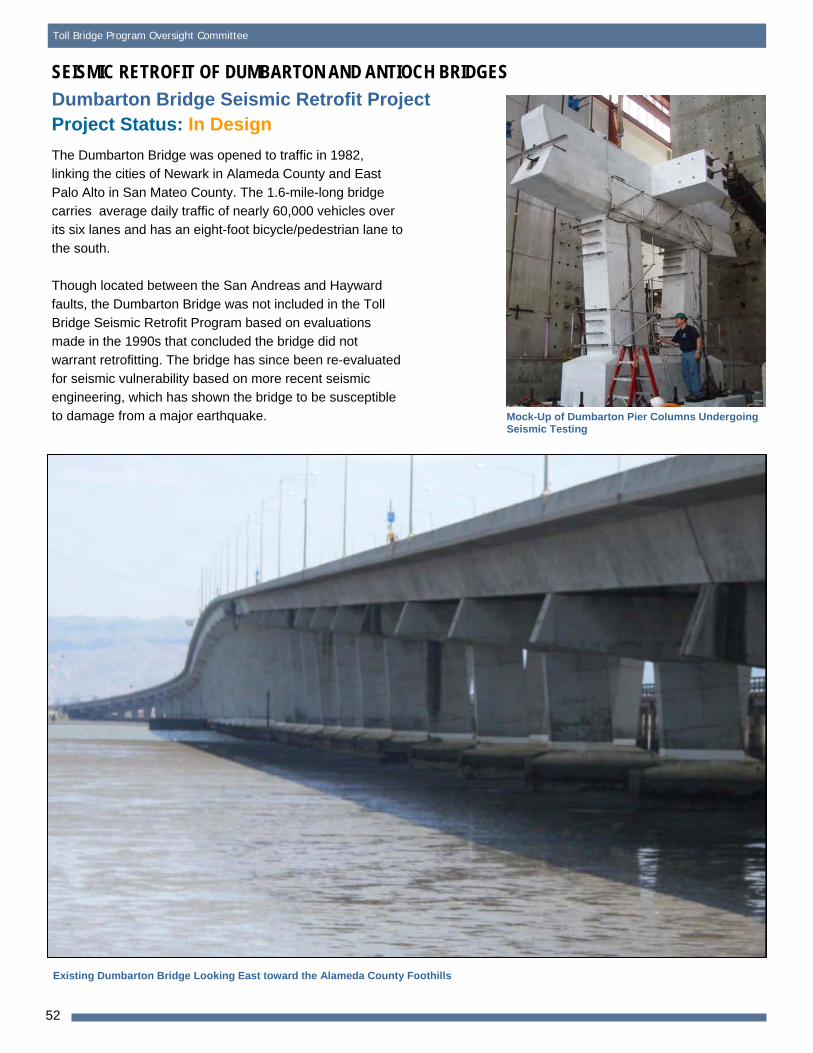
Seismic Retrofit of the Dumbarton and Antioch Bridges When first conceived, the Toll Bridge Seismic Retrofit Program only identified seven of the nine state-owned toll bridges to be in need of seismic retrofit, which excluded the
Dumbarton and Antioch Bridges. Further seismic vulnerability studies were completed by Caltrans and BATA on those structures and determined that both structures
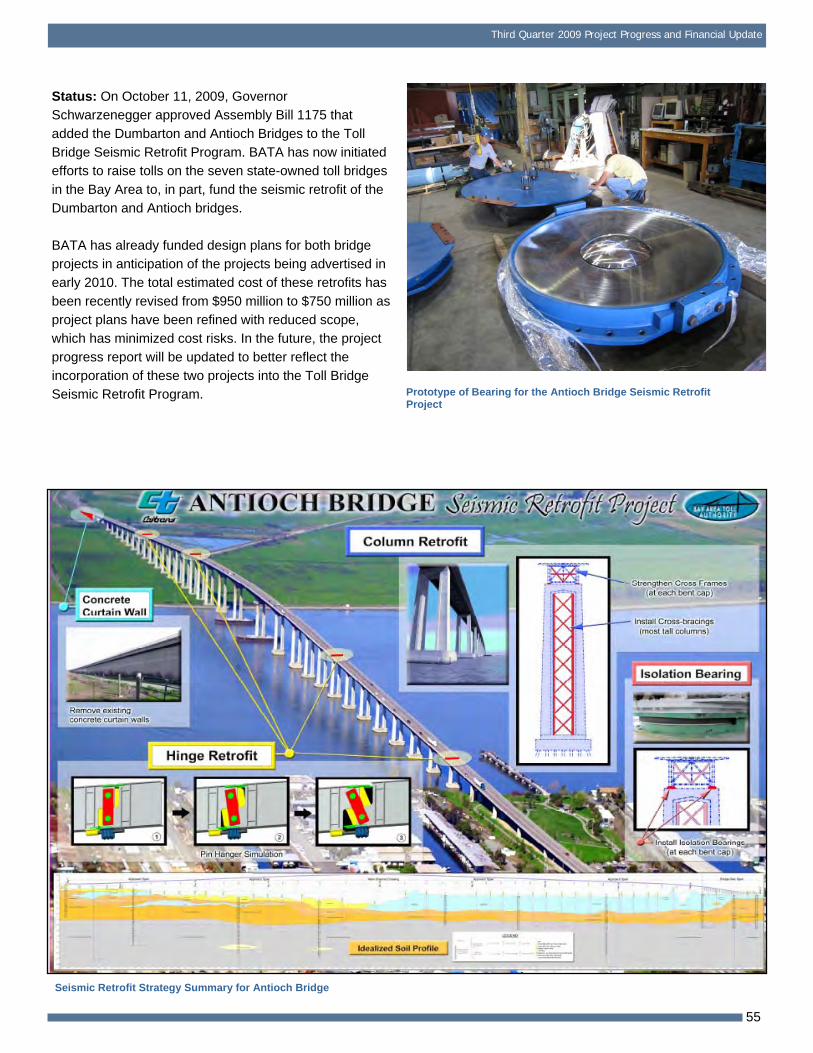
were in need of retrofit based on current seismic standards. On October 11, 2009, Governor Schwarzenegger approved Assembly Bill 1175 which added the Dumbarton and Antioch
Bridges to the Toll Bridge Seismic Retrofit Program. BATA has now initiated efforts to raise tolls on the seven State-
Eastbound OTD Hinge Pipe Beam Support Installation
Dumbarton/Antioch Bridges Mock-Up of Dumbarton Pier Columns Undergoing Seismic Testing
4
Third Quarter 2009 Project Progress and Financial Update
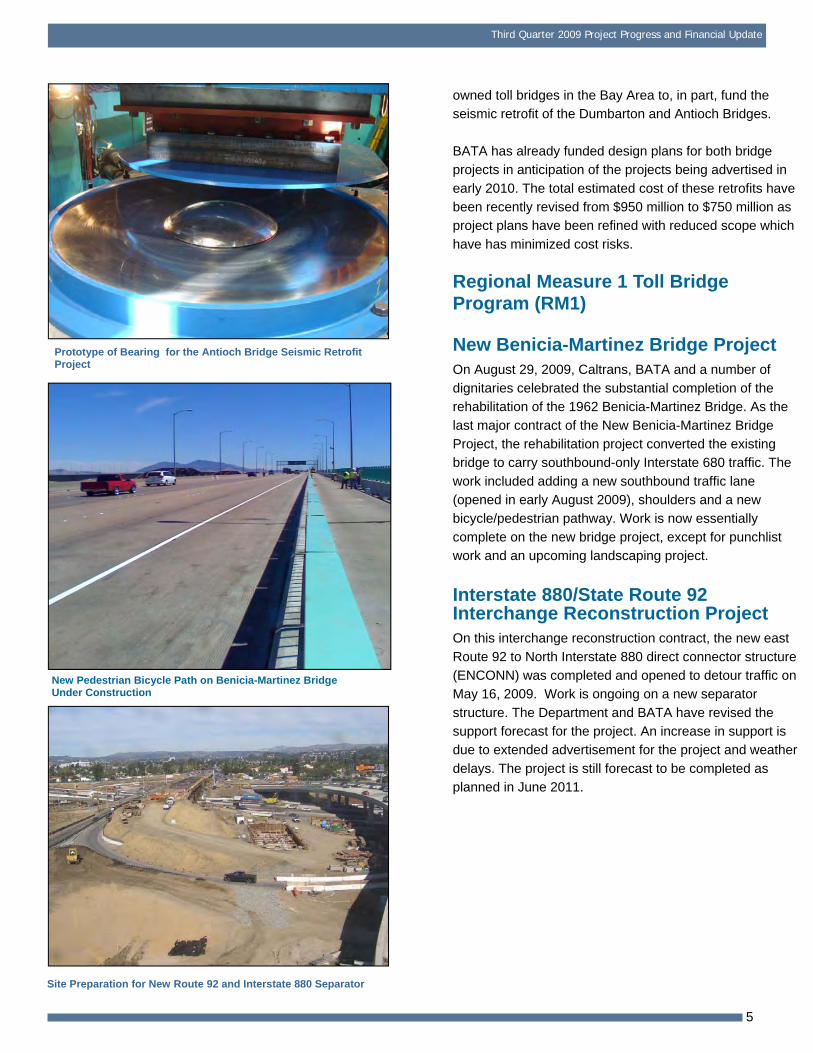
Prototype of Bearing for the Antioch Bridge Seismic Retrofit Project
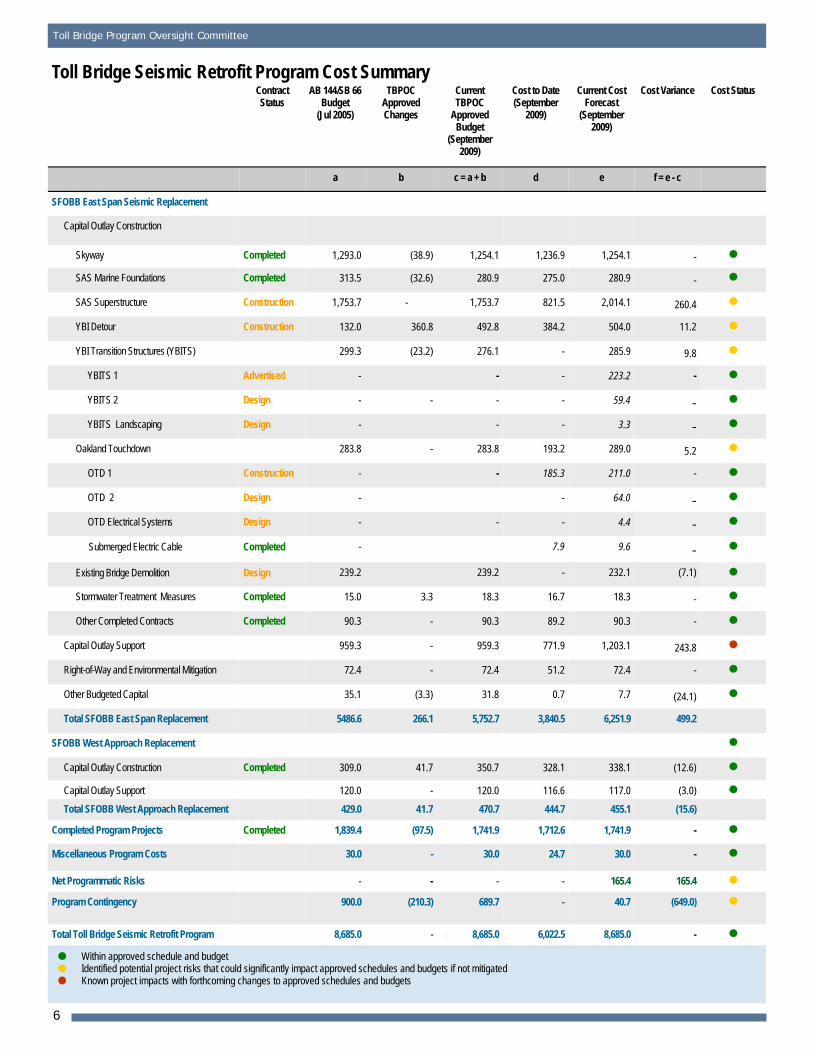
New Pedestrian Bicycle Path on Benicia-Martinez Bridge Under Construction
owned toll bridges in the Bay Area to, in part, fund the seismic retrofit of the Dumbarton and Antioch Bridges.
BATA has already funded design plans for both bridge projects in anticipation of the projects being advertised in
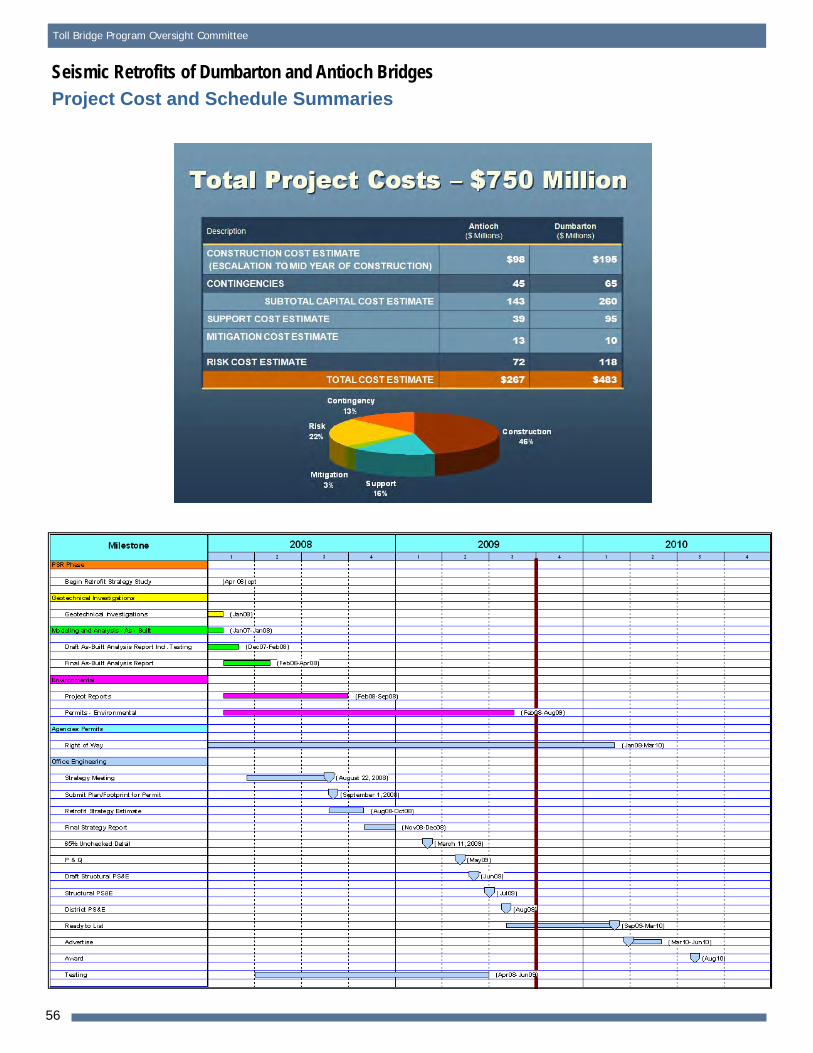
early 2010. The total estimated cost of these retrofits have been recently revised from $950 million to $750 million as project plans have been refined with reduced scope which
have has minimized cost risks.
Regional Measure 1 Toll Bridge Program (RM1)
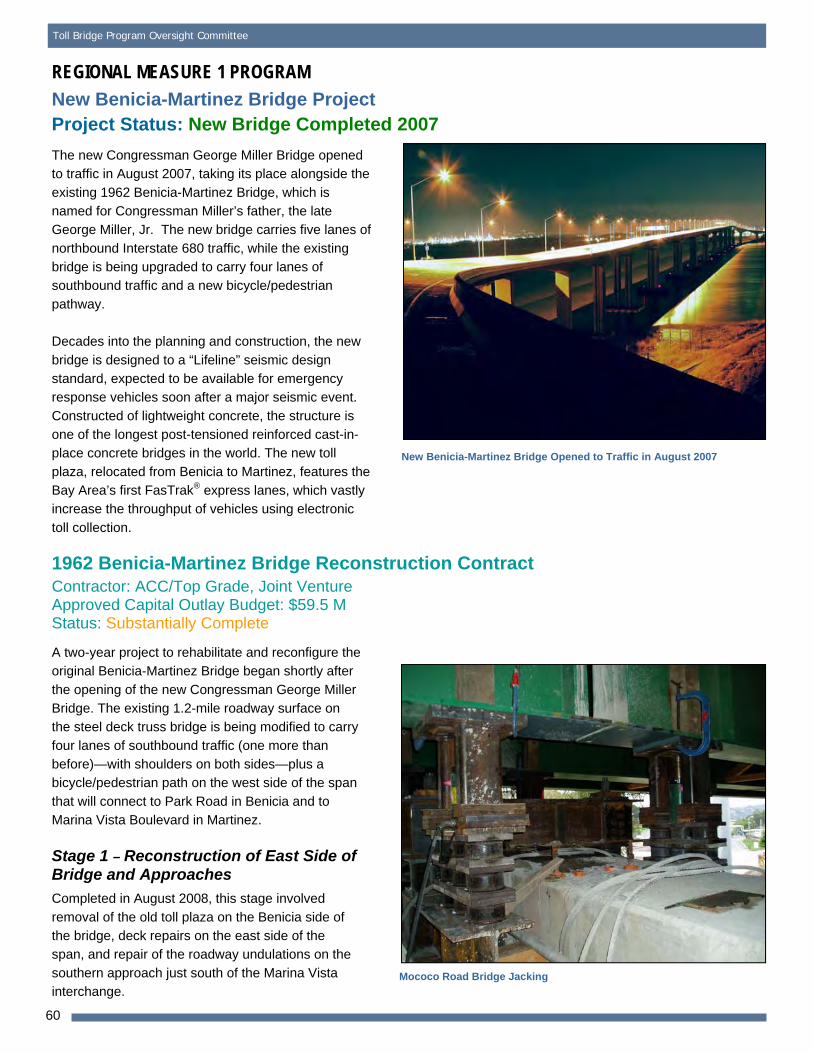
New Benicia-Martinez Bridge Project On August 29, 2009, Caltrans, BATA and a number of dignitaries celebrated the substantial completion of the rehabilitation of the 1962 Benicia-Martinez Bridge. As the
last major contract of the New Benicia-Martinez Bridge Project, the rehabilitation project converted the existing bridge to carry southbound-only Interstate 680 traffic. The
work included adding a new southbound traffic lane (opened in early August 2009), shoulders and a new bicycle/pedestrian pathway. Work is now essentially
complete on the new bridge project, except for punchlist work and an upcoming landscaping project.
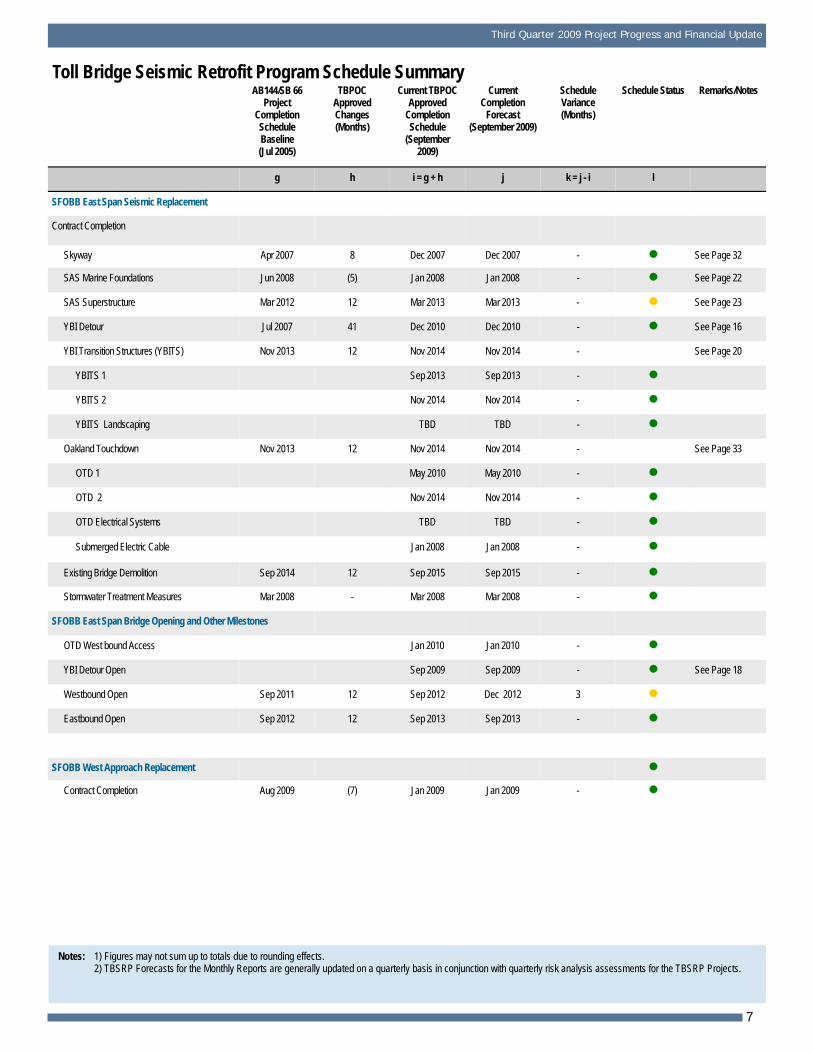
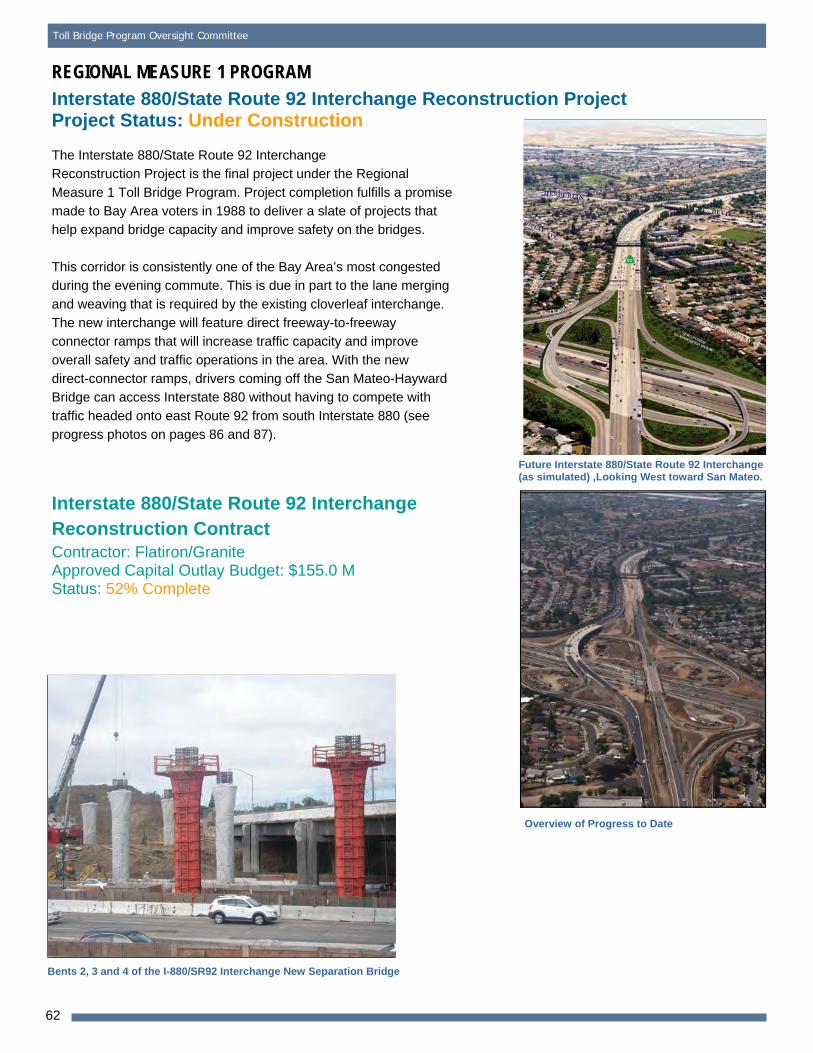
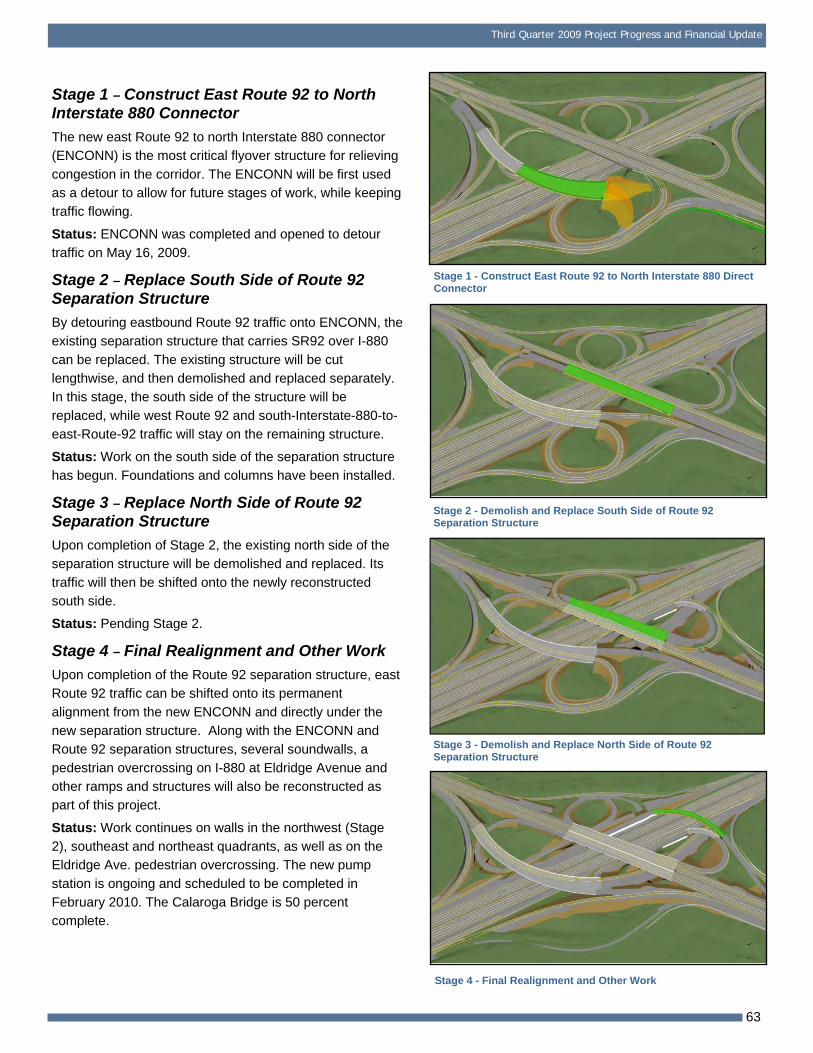
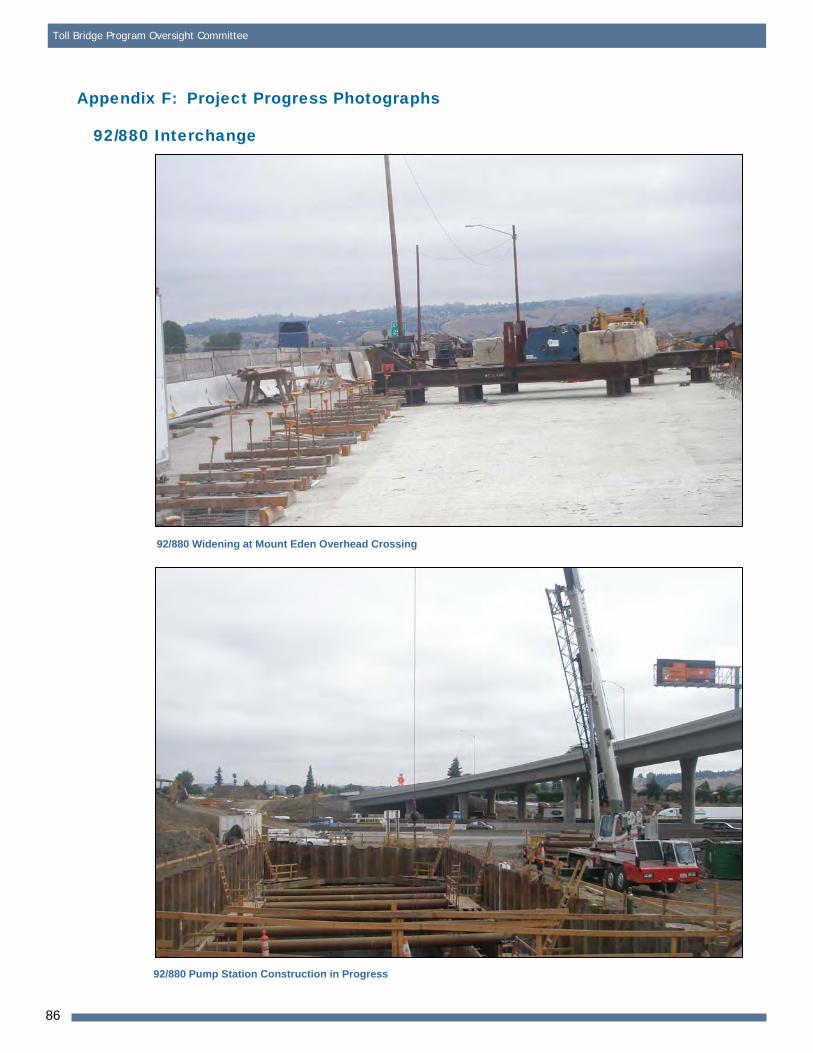
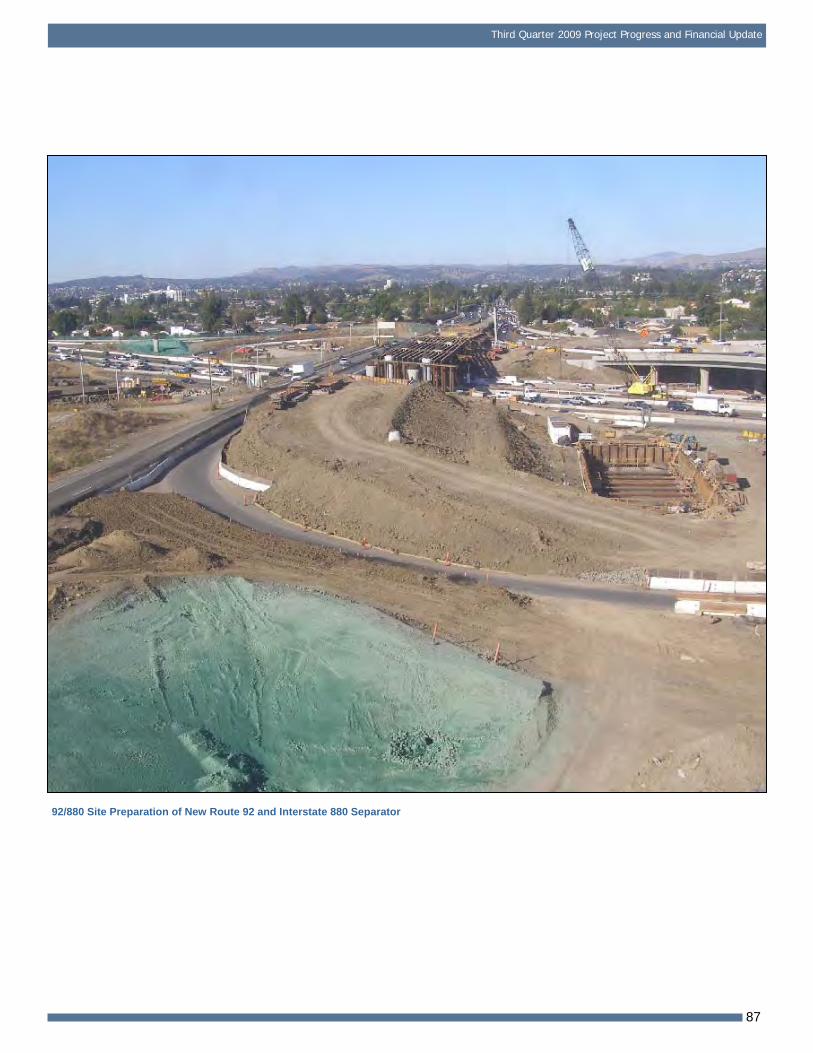
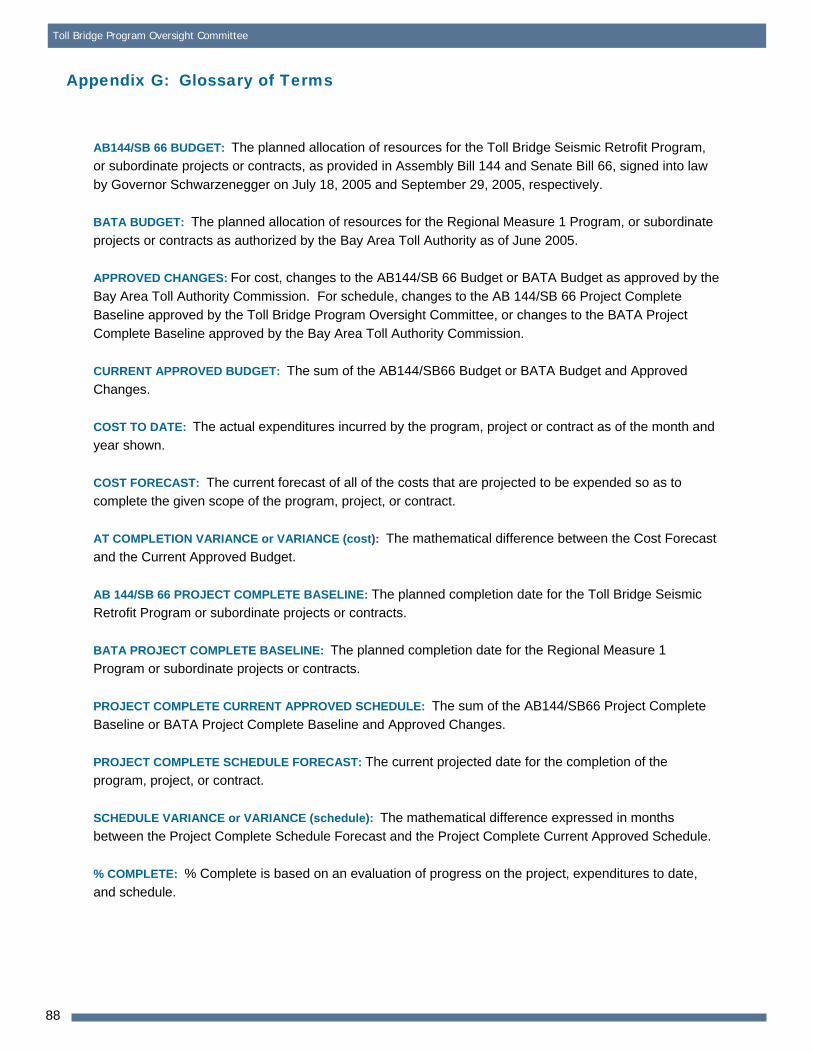
Interstate 880/State Route 92Interchange Reconstruction Project On this interchange reconstruction contract, the new east
Route 92 to North Interstate 880 direct connector structure (ENCONN) was completed and opened to detour traffic on May 16, 2009. Work is ongoing on a new separator
structure. The Department and BATA have revised the support forecast for the project. An increase in support is due to extended advertisement for the project and weather
delays. The project is still forecast to be completed as planned in June 2011.
Site Preparation for New Route 92 and Interstate 880 Separator
5
Toll Bridge Program Oversight Committee
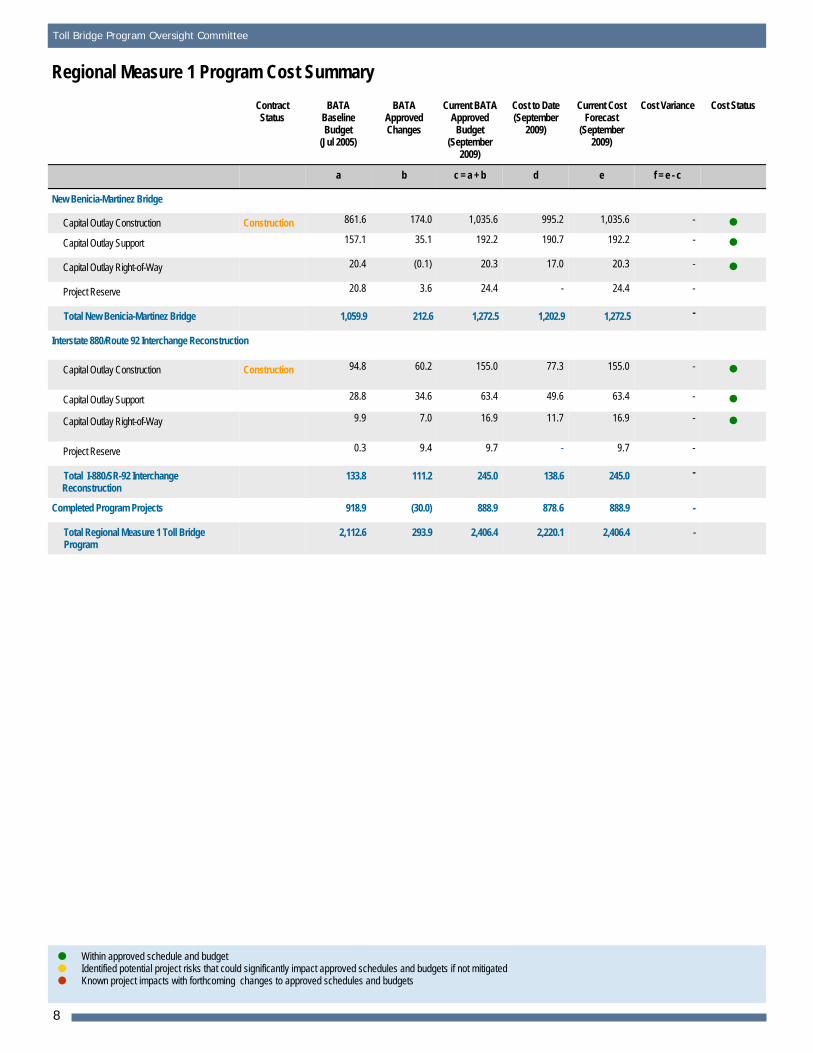
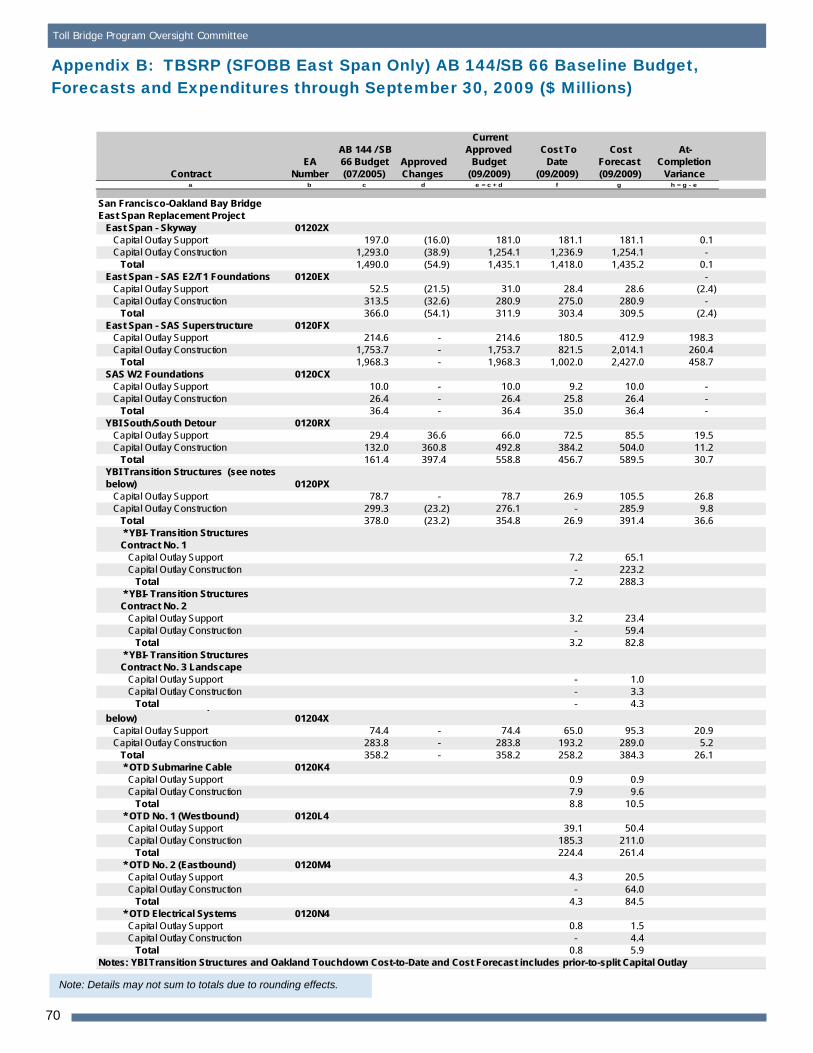
Toll Bridge Seismic Retrofit Program Cost Summary Contract AB 144/SB 66 TBPOC Current Cost to Date Current Cost Cost Variance Cost Status
Other Completed Contracts Completed 90.3 - 90.3 89.2 90.3 -
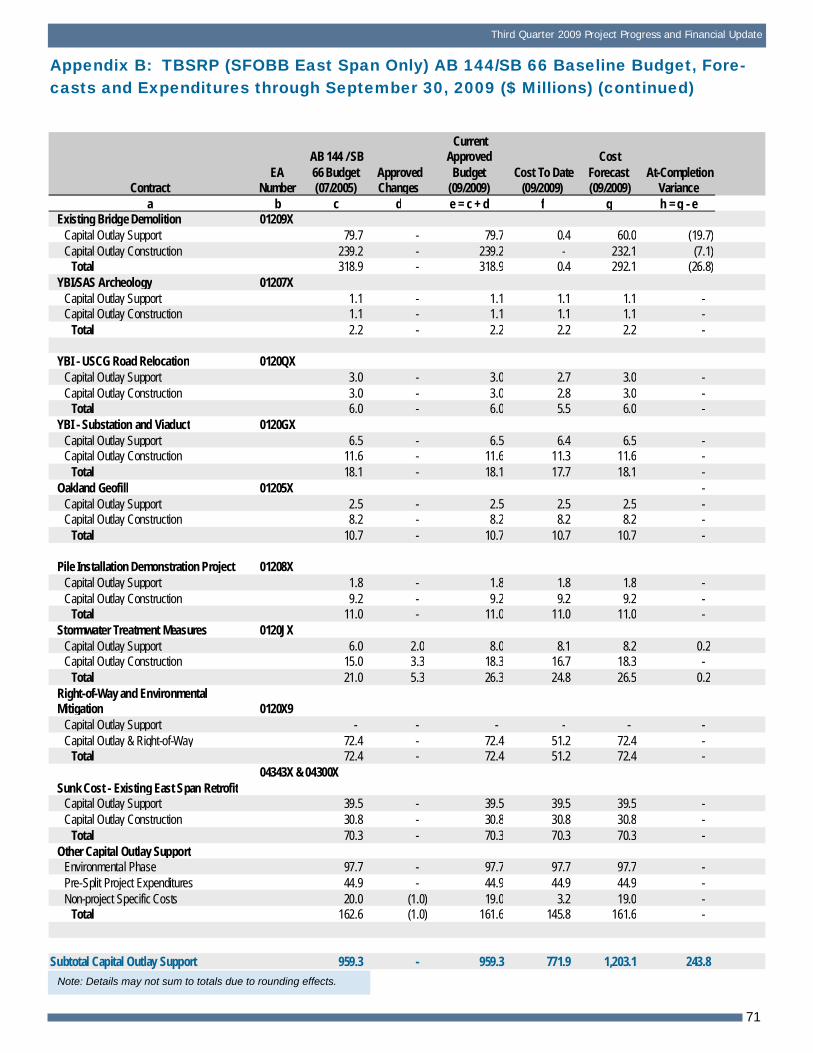
Capital Outlay Support 959.3 - 959.3 771.9 1,203.1 243.8
Right-of-Way and Environmental Mitigation 72.4 - 72.4 51.2 72.4 -
Other Budgeted Capital 35.1 (3.3) 31.8 0.7 7.7 (24.1)
Total SFOBB East Span Replacement 5486.6 266.1 5,752.7 3,840.5 6,251.9 499.2
SFOBB West Approach Replacement
Capital Outlay Construction Completed 309.0 41.7 350.7 328.1 338.1 (12.6)
Capital Outlay Support 120.0 - 120.0 116.6 117.0 (3.0)
Total SFOBB West Approach Replacement 429.0 41.7 470.7 444.7 455.1 (15.6)
Completed Program Projects Completed 1,839.4 (97.5) 1,741.9 1,712.6 1,741.9 -
Miscellaneous Program Costs 30.0 - 30.0 24.7 30.0 -
Net Programmatic Risks - - - - 165.4 165.4
Program Contingency 900.0 (210.3) 689.7 - 40.7 (649.0)
Total Toll Bridge Seismic Retrofit Program 8,685.0 - 8,685.0 6,022.5 8,685.0 -
Within approved schedule and budget Identified potential project risks that could significantly impact approved schedules and budgets if not mitigated Known project impacts with forthcoming changes to approved schedules and budgets
Construction
Advertised
Design
Construction
Design
Design
6
Third Quarter 2009 Project Progress and Financial Update
Toll Bridge Seismic Retrofit Program Schedule Summary AB144/SB 66 TBPOC Current TBPOC Current Schedule Schedule Status Remarks/Notes
Stormwater Treatment Measures Mar 2008 - Mar 2008 Mar 2008 -
SFOBB East Span Bridge Opening and Other Milestones
OTD West bound Access Jan 2010 Jan 2010 -
YBI Detour Open Sep 2009 Sep 2009 - See Page 18
Westbound Open Sep 2011 12 Sep 2012 Dec 2012 3
Eastbound Open Sep 2012 12 Sep 2013 Sep 2013 -
SFOBB West Approach Replacement
Contract Completion Aug 2009 (7) Jan 2009 Jan 2009 -
Notes: 1) Figures may not sum up to totals due to rounding effects. 2) TBSRP Forecasts for the Monthly Reports are generally updated on a quarterly basis in conjunction with quarterly risk analysis assessments for the TBSRP Projects.
7
Toll Bridge Program Oversight Committee
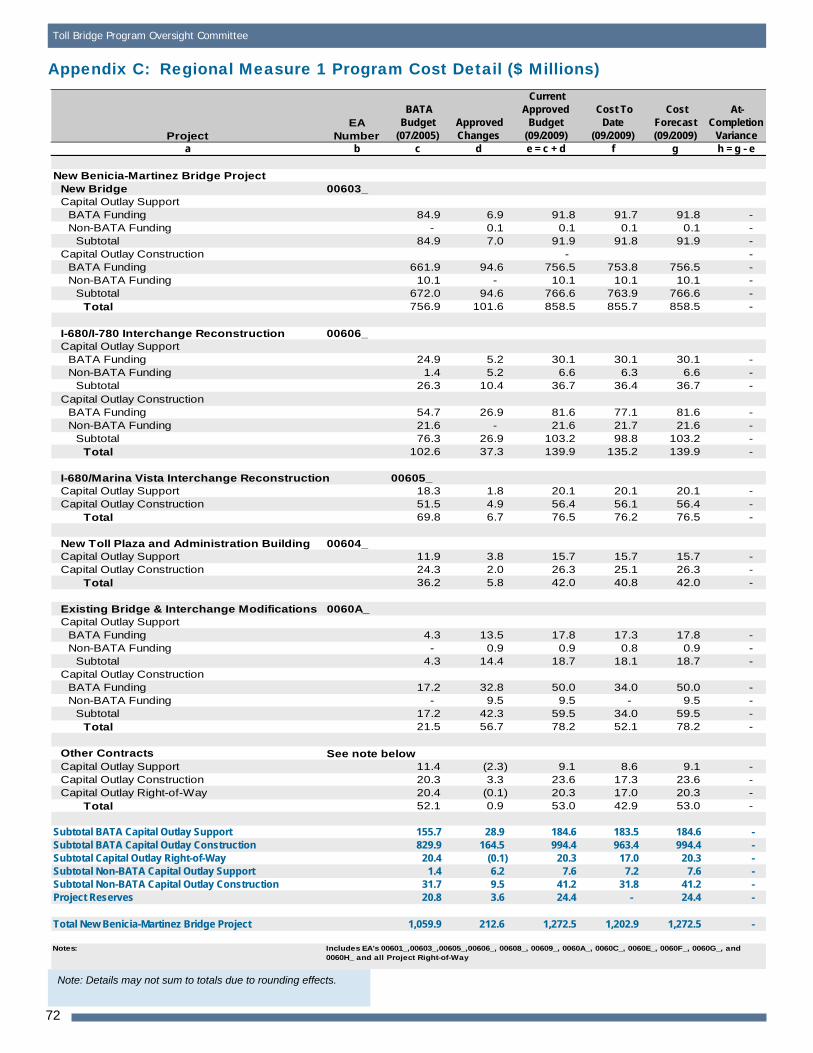
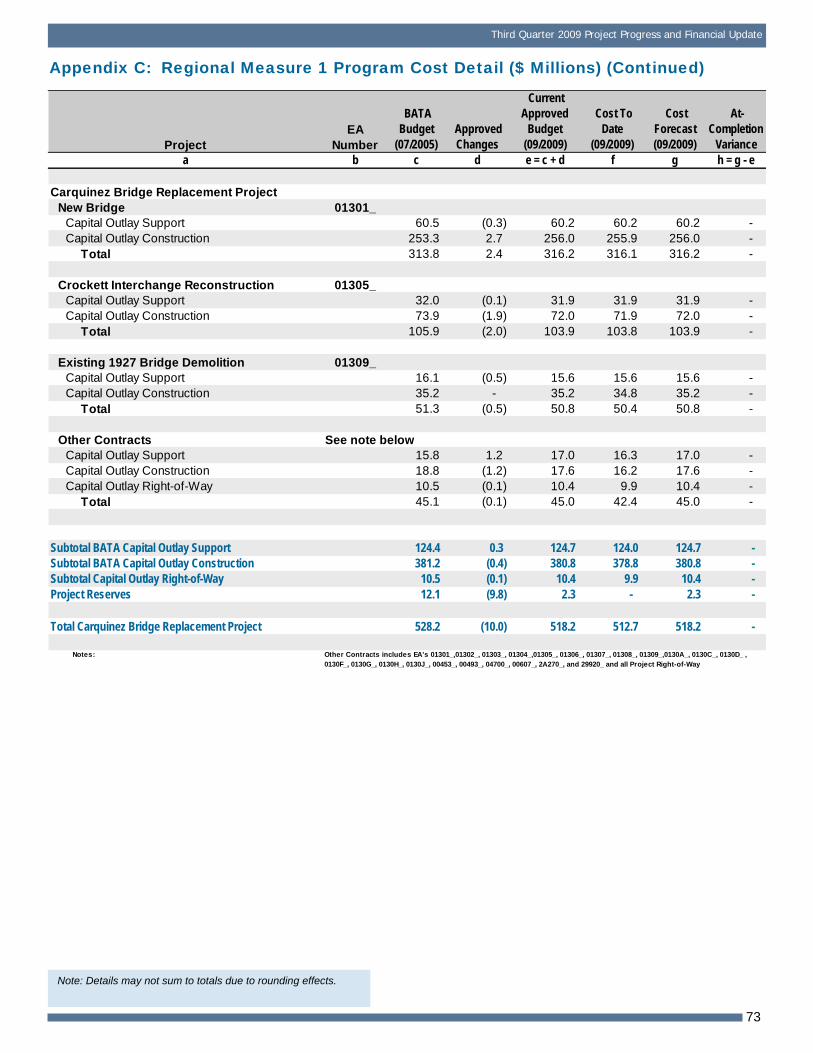
Regional Measure 1 Program Cost Summary
Contract BATA BATA Current BATA Cost to Date Current Cost Cost Variance Cost Status Status Baseline
Budget (Jul 2005)
Approved Changes
Approved Budget
(September 2009)
(September 2009)
Forecast (September
2009)
a b c = a + b d e f = e - c
New Benicia-Martinez Bridge
Capital Outlay Construction
Capital Outlay Support
Capital Outlay Right-of-Way
Project Reserve
861.6
157.1
20.4
20.8
174.0
35.1
(0.1)
3.6
1,035.6
192.2
20.3
24.4
995.2
190.7
17.0
-
1,035.6
192.2
20.3
24.4
-
-
-
-
Total New Benicia-Martinez Bridge 1,059.9 212.6 1,272.5 1,202.9 1,272.5 -
Capital Outlay Construction 94.8 60.2 155.0 77.3 155.0 -
Capital Outlay Support
Capital Outlay Right-of-Way
28.8
9.9
34.6
7.0
63.4
16.9
49.6
11.7
63.4
16.9
-
-
Project Reserve 0.3 9.4 9.7 - 9.7 -
Total I-880/SR-92 Interchange Reconstruction
133.8 111.2 245.0 138.6 245.0 -
Completed Program Projects 918.9 (30.0) 888.9 878.6 888.9 -
Total Regional Measure 1 Toll Bridge Program
2,112.6 293.9 2,406.4 2,220.1 2,406.4 -
Construction
Construction
Within approved schedule and budget Identified potential project risks that could significantly impact approved schedules and budgets if not mitigated Known project impacts with forthcoming changes to approved schedules and budgets
8
Third Quarter 2009 Project Progress and Financial Update
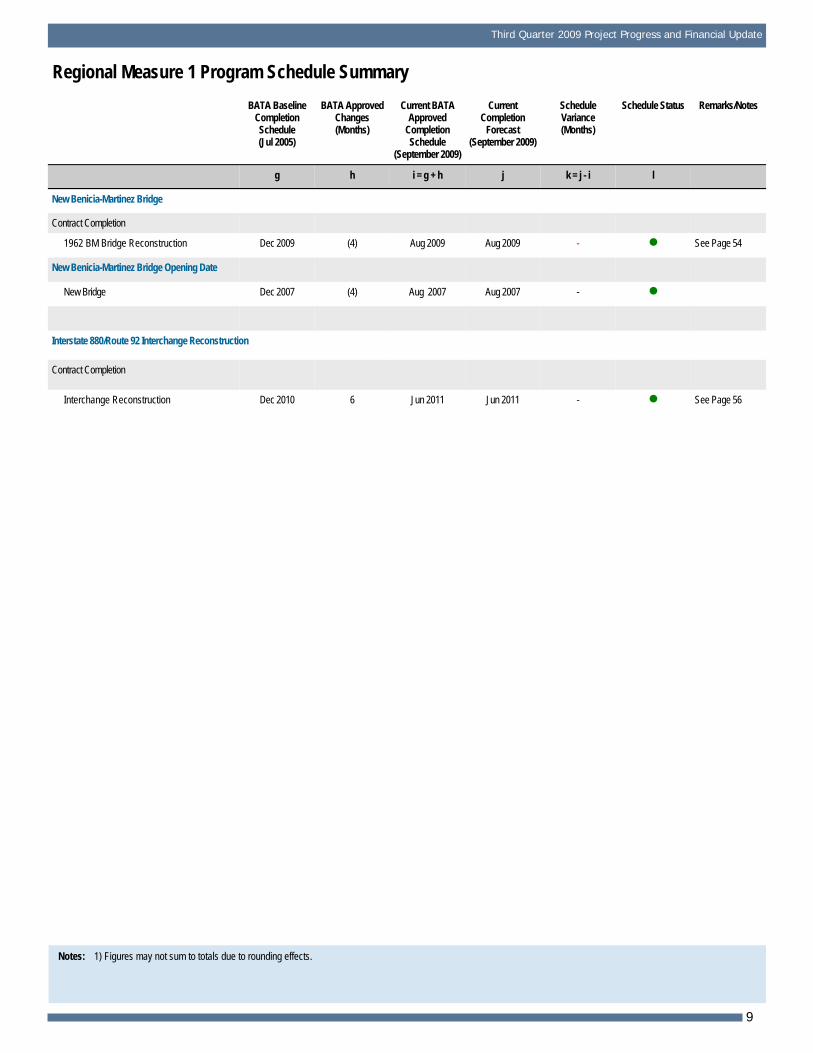
Regional Measure 1 Program Schedule Summary
BATA Baseline BATA Approved Current BATA Current Schedule Schedule Status Remarks/Notes Completion Changes Approved Completion Variance Schedule (Months) Completion Forecast (Months) (Jul 2005) Schedule (September 2009)
(September 2009)
g h i = g + h j k = j - i l
New Benicia-Martinez Bridge
Contract Completion
1962 BM Bridge Reconstruction Dec 2009 (4) Aug 2009 Aug 2009 - See Page 54
Interchange Reconstruction Dec 2010 6 Jun 2011 Jun 2011 - See Page 56
Notes: 1) Figures may not sum to totals due to rounding effects.
9
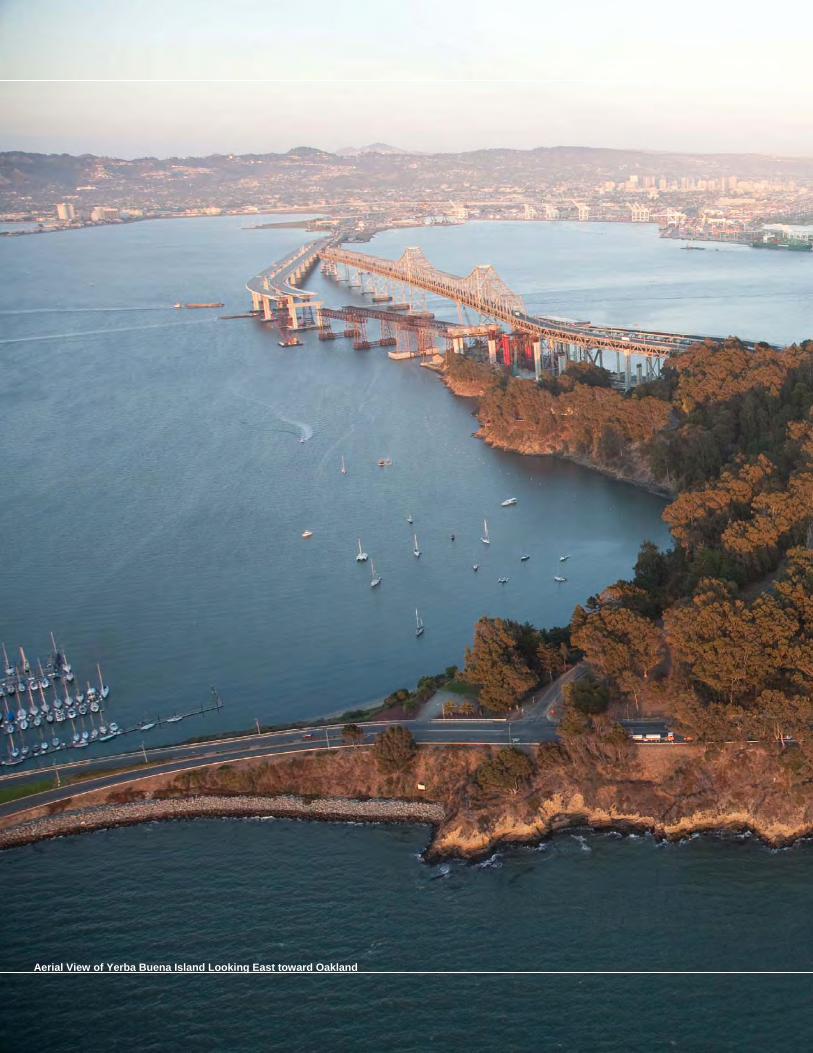
Aerial View of Yerba Buena Island Looking East toward Oakland
TO
LL
BR
IDG
E S
EIS
MIC
RE
TR
OF
IT P
RO
GR
AM
Toll Bridge Program Oversight Committee
TOLL BRIDGE SEISMIC RETROFIT PROGRAM
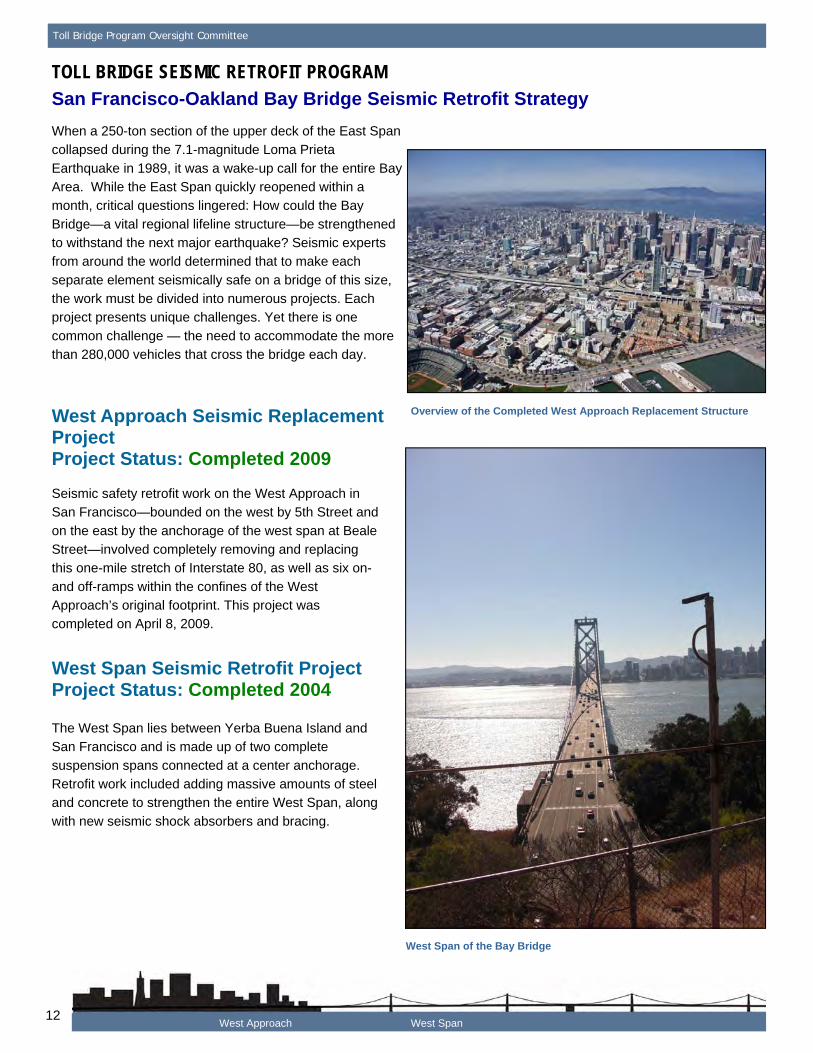
San Francisco-Oakland Bay Bridge Seismic Retrofit Strategy
When a 250-ton section of the upper deck of the East Span collapsed during the 7.1-magnitude Loma Prieta
Earthquake in 1989, it was a wake-up call for the entire Bay Area. While the East Span quickly reopened within a month, critical questions lingered: How could the Bay
Bridge—a vital regional lifeline structure—be strengthened to withstand the next major earthquake? Seismic experts from around the world determined that to make each
separate element seismically safe on a bridge of this size, the work must be divided into numerous projects. Each project presents unique challenges. Yet there is one
common challenge — the need to accommodate the more than 280,000 vehicles that cross the bridge each day.
West Approach Seismic Replacement Project Project Status: Completed 2009
Seismic safety retrofit work on the West Approach in San Francisco—bounded on the west by 5th Street and
on the east by the anchorage of the west span at Beale Street—involved completely removing and replacing this one-mile stretch of Interstate 80, as well as six on-
and off-ramps within the confines of the West Approach’s original footprint. This project was completed on April 8, 2009.
West Span Seismic Retrofit Project Project Status: Completed 2004
The West Span lies between Yerba Buena Island and San Francisco and is made up of two complete
suspension spans connected at a center anchorage. Retrofit work included adding massive amounts of steel and concrete to strengthen the entire West Span, along
with new seismic shock absorbers and bracing.
Overview of the Completed West Approach Replacement Structure
West Span of the Bay Bridge
West Approach West Span 12
Third Quarter 2009 Project Progress and Financial Update
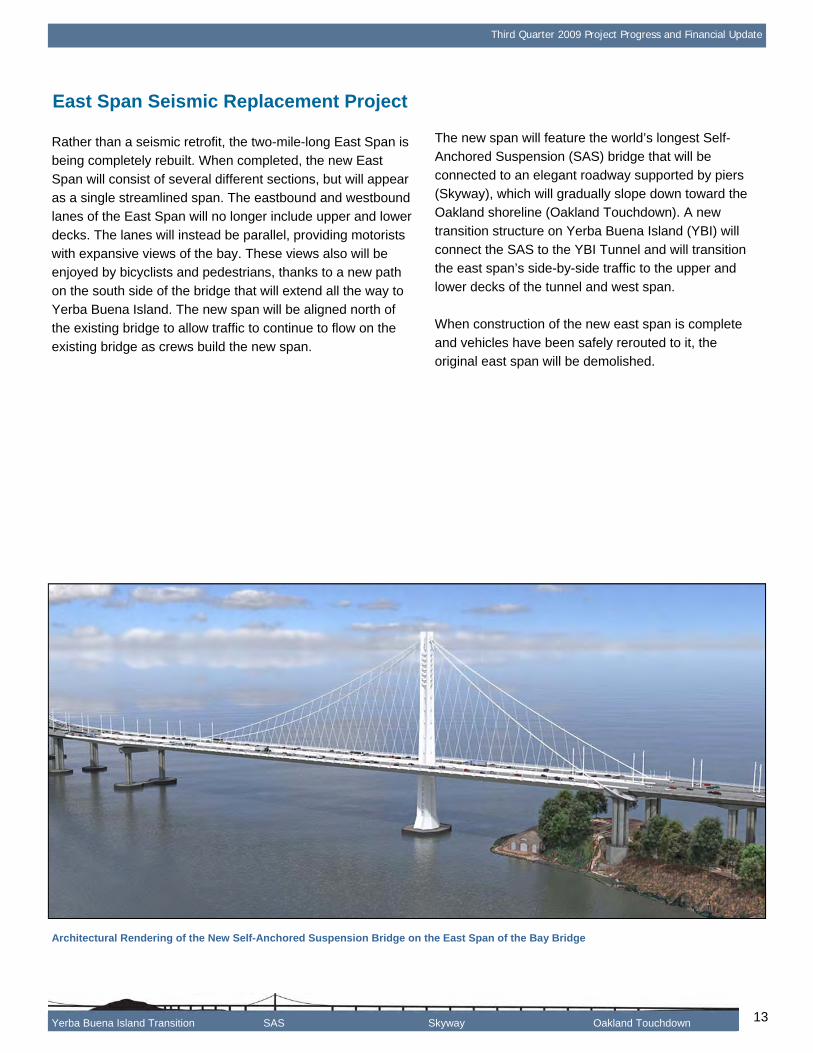
East Span Seismic Replacement Project
Rather than a seismic retrofit, the two-mile-long East Span is being completely rebuilt. When completed, the new East
Span will consist of several different sections, but will appear as a single streamlined span. The eastbound and westbound lanes of the East Span will no longer include upper and lower
decks. The lanes will instead be parallel, providing motorists with expansive views of the bay. These views also will be enjoyed by bicyclists and pedestrians, thanks to a new path
on the south side of the bridge that will extend all the way to Yerba Buena Island. The new span will be aligned north of the existing bridge to allow traffic to continue to flow on the
existing bridge as crews build the new span.
The new span will feature the world’s longest Self-Anchored Suspension (SAS) bridge that will be
connected to an elegant roadway supported by piers (Skyway), which will gradually slope down toward the Oakland shoreline (Oakland Touchdown). A new
transition structure on Yerba Buena Island (YBI) will connect the SAS to the YBI Tunnel and will transition the east span’s side-by-side traffic to the upper and
lower decks of the tunnel and west span.
When construction of the new east span is complete
and vehicles have been safely rerouted to it, the original east span will be demolished.
Architectural Rendering of the New Self-Anchored Suspension Bridge on the East Span of the Bay Bridge
Yerba Buena Island Transition SAS Skyway Oakland Touchdown 13
Toll Bridge Program Oversight Committee
14
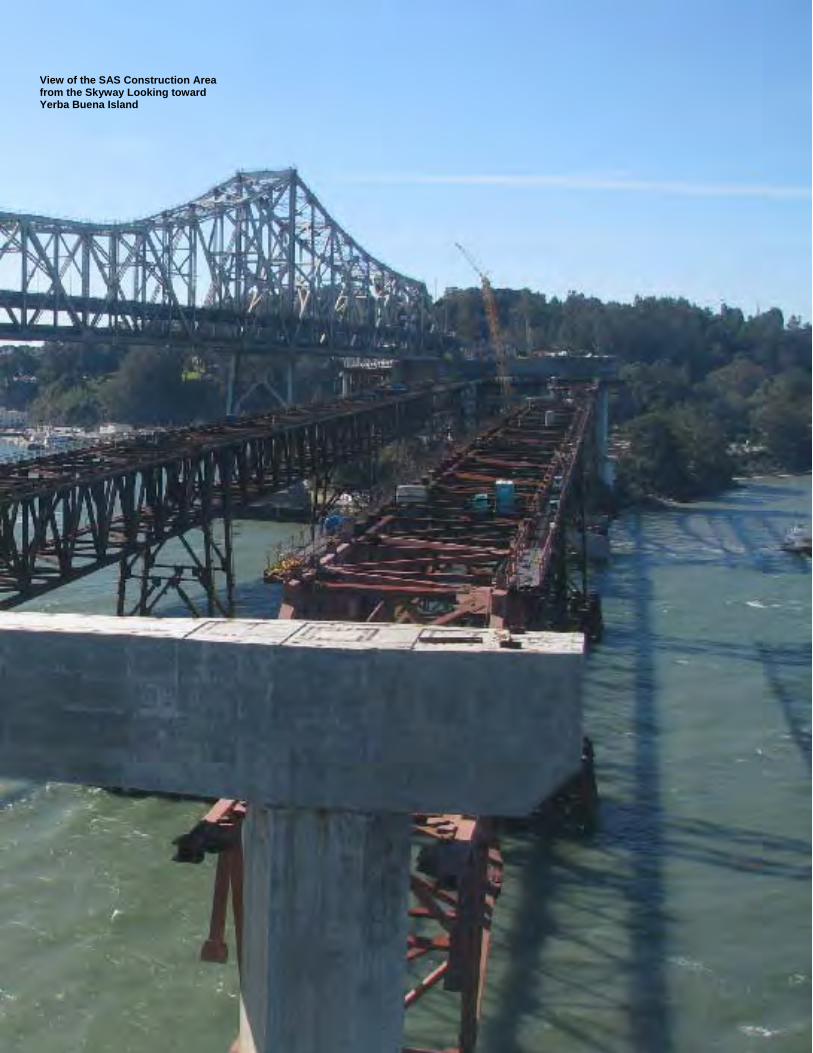
View of the SAS Construction Area from the Skyway Looking toward Yerba Buena Island
Third Quarter 2009 Project Progress and Financial Update
TOLL BRIDGE SEISMIC RETROFIT PROGRAM
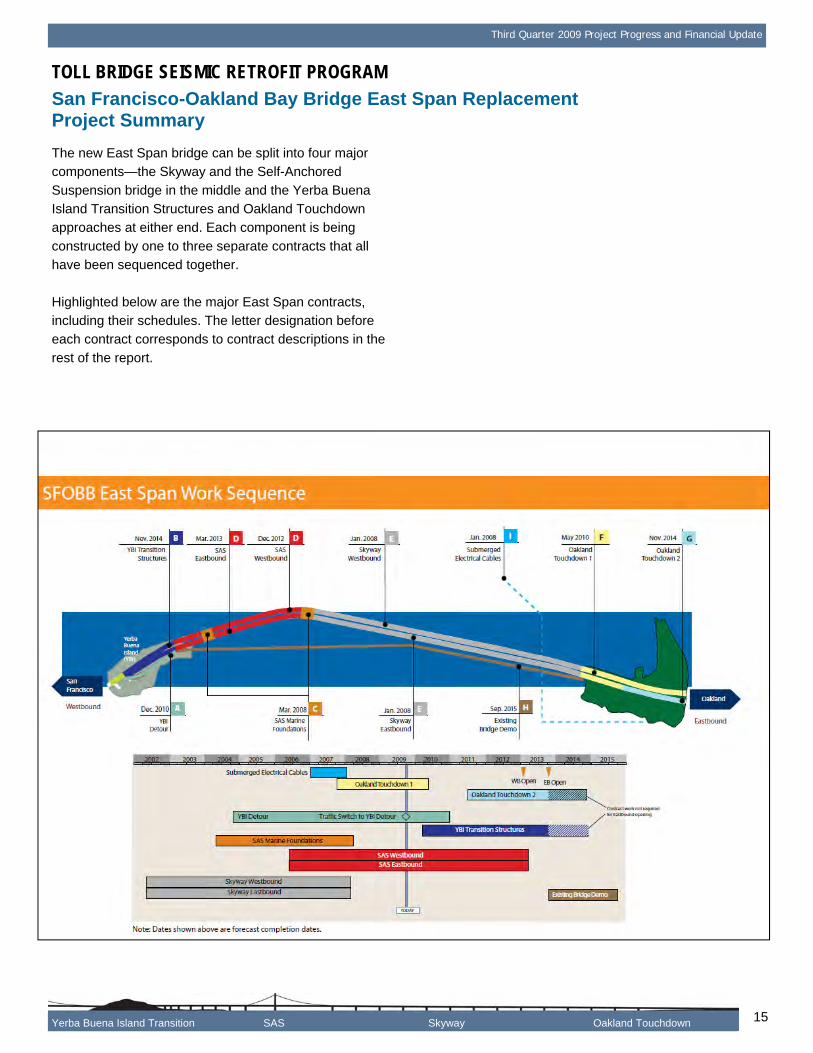
San Francisco-Oakland Bay Bridge East Span Replacement Project Summary
The new East Span bridge can be split into four major components—the Skyway and the Self-Anchored
Suspension bridge in the middle and the Yerba Buena Island Transition Structures and Oakland Touchdown approaches at either end. Each component is being
constructed by one to three separate contracts that all have been sequenced together.
Highlighted below are the major East Span contracts, including their schedules. The letter designation before each contract corresponds to contract descriptions in the
rest of the report.
Yerba Buena Island Transition SAS Skyway Oakland Touchdown 15
Toll Bridge Program Oversight Committee
TOLL BRIDGE SEISMIC RETROFIT PROGRAM
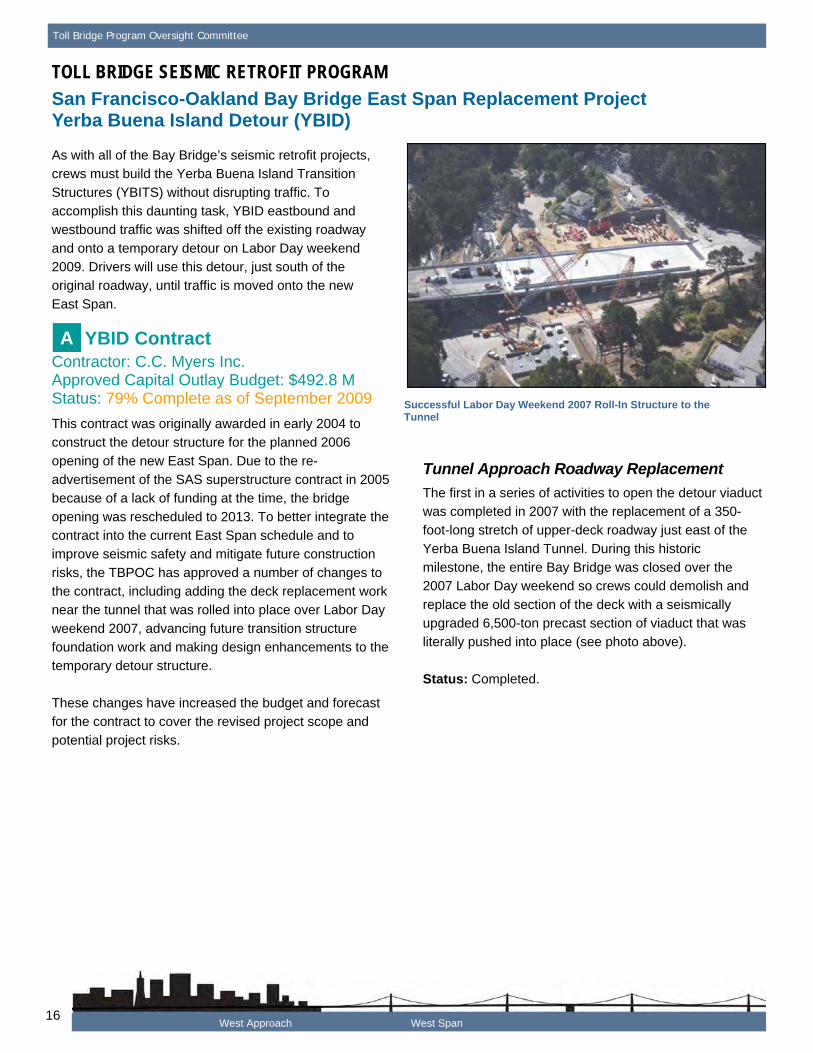
San Francisco-Oakland Bay Bridge East Span Replacement Project Yerba Buena Island Detour (YBID)
As with all of the Bay Bridge’s seismic retrofit projects, crews must build the Yerba Buena Island Transition
Structures (YBITS) without disrupting traffic. To accomplish this daunting task, YBID eastbound and westbound traffic was shifted off the existing roadway
and onto a temporary detour on Labor Day weekend 2009. Drivers will use this detour, just south of the original roadway, until traffic is moved onto the new
East Span.
A YBID Contract Contractor: C.C. Myers Inc. Approved Capital Outlay Budget: $492.8 M Status: 79% Complete as of September 2009
This contract was originally awarded in early 2004 to construct the detour structure for the planned 2006
opening of the new East Span. Due to the re-advertisement of the SAS superstructure contract in 2005 because of a lack of funding at the time, the bridge
opening was rescheduled to 2013. To better integrate the contract into the current East Span schedule and to improve seismic safety and mitigate future construction
risks, the TBPOC has approved a number of changes to the contract, including adding the deck replacement work near the tunnel that was rolled into place over Labor Day
weekend 2007, advancing future transition structure foundation work and making design enhancements to the temporary detour structure.
These changes have increased the budget and forecast for the contract to cover the revised project scope and
potential project risks.
Successful Labor Day Weekend 2007 Roll-In Structure to the Tunnel
Tunnel Approach Roadway Replacement
The first in a series of activities to open the detour viaduct was completed in 2007 with the replacement of a 350foot-long stretch of upper-deck roadway just east of the
Yerba Buena Island Tunnel. During this historic milestone, the entire Bay Bridge was closed over the 2007 Labor Day weekend so crews could demolish and
replace the old section of the deck with a seismically upgraded 6,500-ton precast section of viaduct that was literally pushed into place (see photo above).
Status: Completed.
West Approach West Span 16
Third Quarter 2009 Project Progress and Financial Update
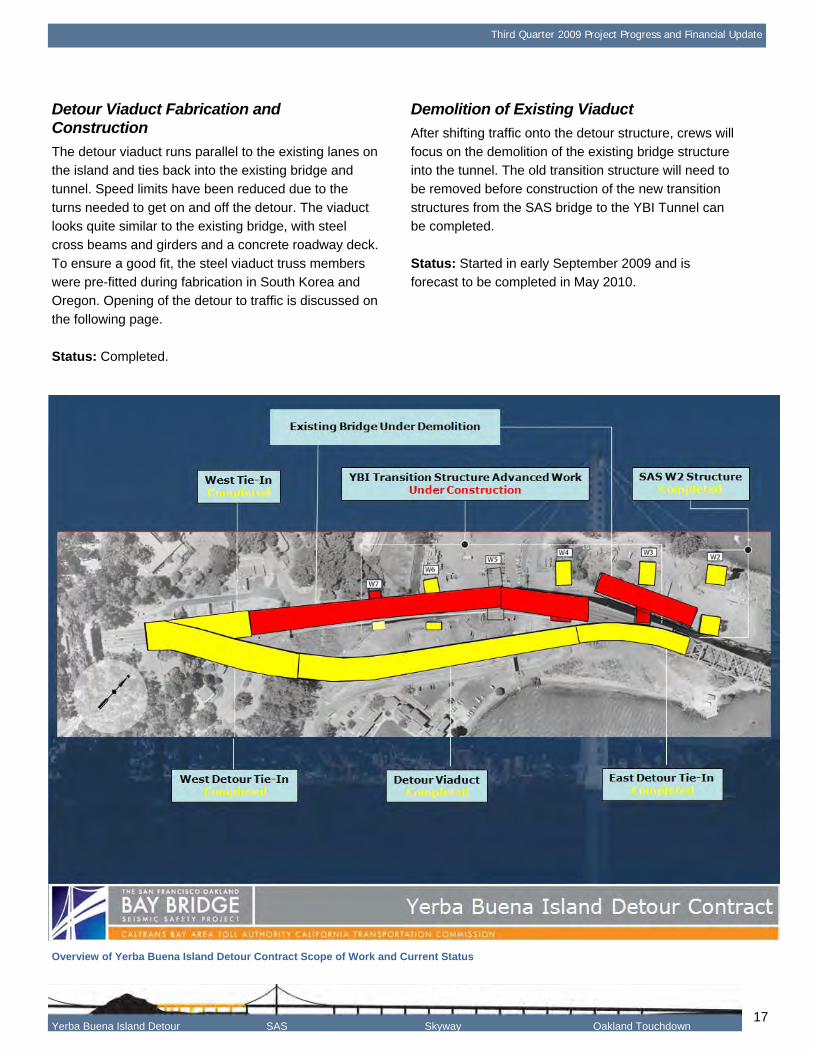
Detour Viaduct Fabrication and Construction
The detour viaduct runs parallel to the existing lanes on the island and ties back into the existing bridge and tunnel. Speed limits have been reduced due to the
turns needed to get on and off the detour. The viaduct looks quite similar to the existing bridge, with steel cross beams and girders and a concrete roadway deck.
To ensure a good fit, the steel viaduct truss members were pre-fitted during fabrication in South Korea and Oregon. Opening of the detour to traffic is discussed on
the following page.
Status: Completed.
Demolition of Existing Viaduct
After shifting traffic onto the detour structure, crews will
focus on the demolition of the existing bridge structure into the tunnel. The old transition structure will need to be removed before construction of the new transition
structures from the SAS bridge to the YBI Tunnel can be completed.
Status: Started in early September 2009 and is forecast to be completed in May 2010.
Overview of Yerba Buena Island Detour Contract Scope of Work and Current Status
Yerba Buena Island Detour SAS Skyway Oakland Touchdown 17
Toll Bridge Program Oversight Committee
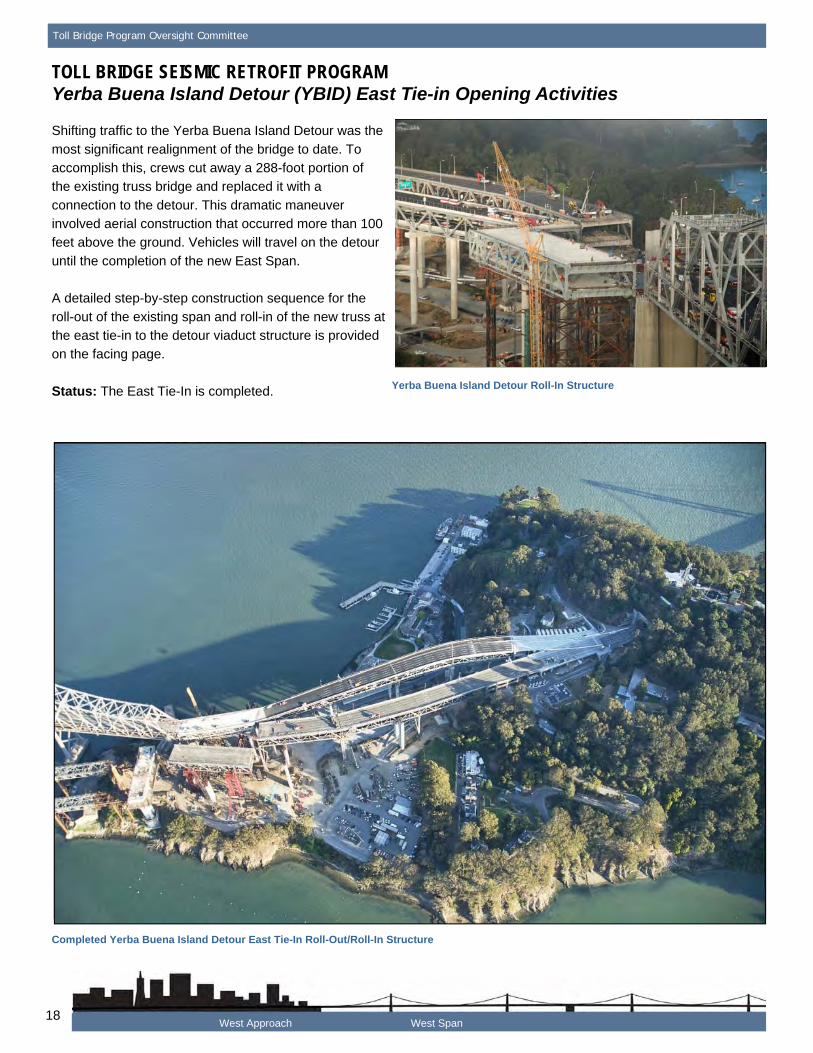
TOLL BRIDGE SEISMIC RETROFIT PROGRAM Yerba Buena Island Detour (YBID) East Tie-in Opening Activities
Shifting traffic to the Yerba Buena Island Detour was the
most significant realignment of the bridge to date. To accomplish this, crews cut away a 288-foot portion of the existing truss bridge and replaced it with a
connection to the detour. This dramatic maneuver involved aerial construction that occurred more than 100 feet above the ground. Vehicles will travel on the detour
until the completion of the new East Span.
A detailed step-by-step construction sequence for the
roll-out of the existing span and roll-in of the new truss at the east tie-in to the detour viaduct structure is provided on the facing page.
Status: The East Tie-In is completed. Yerba Buena Island Detour Roll-In Structure
Completed Yerba Buena Island Detour East Tie-In Roll-Out/Roll-In Structure
West Approach West Span 18
Third Quarter 2009 Project Progress and Financial Update
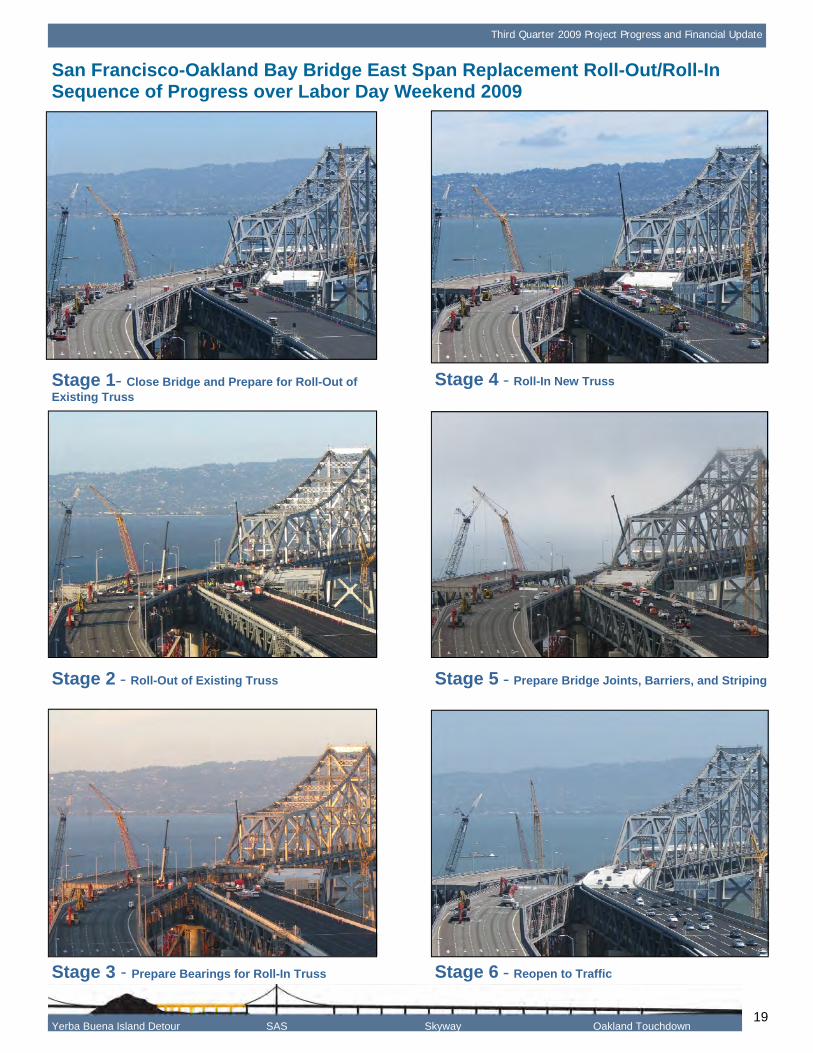
San Francisco-Oakland Bay Bridge East Span Replacement Roll-Out/Roll-In Sequence of Progress over Labor Day Weekend 2009
Stage 1- Close Bridge and Prepare for Roll-Out of Stage 4 - Roll-In New Truss Existing Truss
Stage 2 - Roll-Out of Existing Truss Stage 5 - Prepare Bridge Joints, Barriers, and Striping
Stage 3 - Prepare Bearings for Roll-In Truss Stage 6 - Reopen to Traffic
Yerba Buena Island Detour SAS Skyway Oakland Touchdown 19
Toll Bridge Program Oversight Committee
TOLL BRIDGE SEISMIC RETROFIT PROGRAM San Francisco-Oakland Bay Bridge East Span Replacement Project Yerba Buena Island Transition Structures (YBITS)
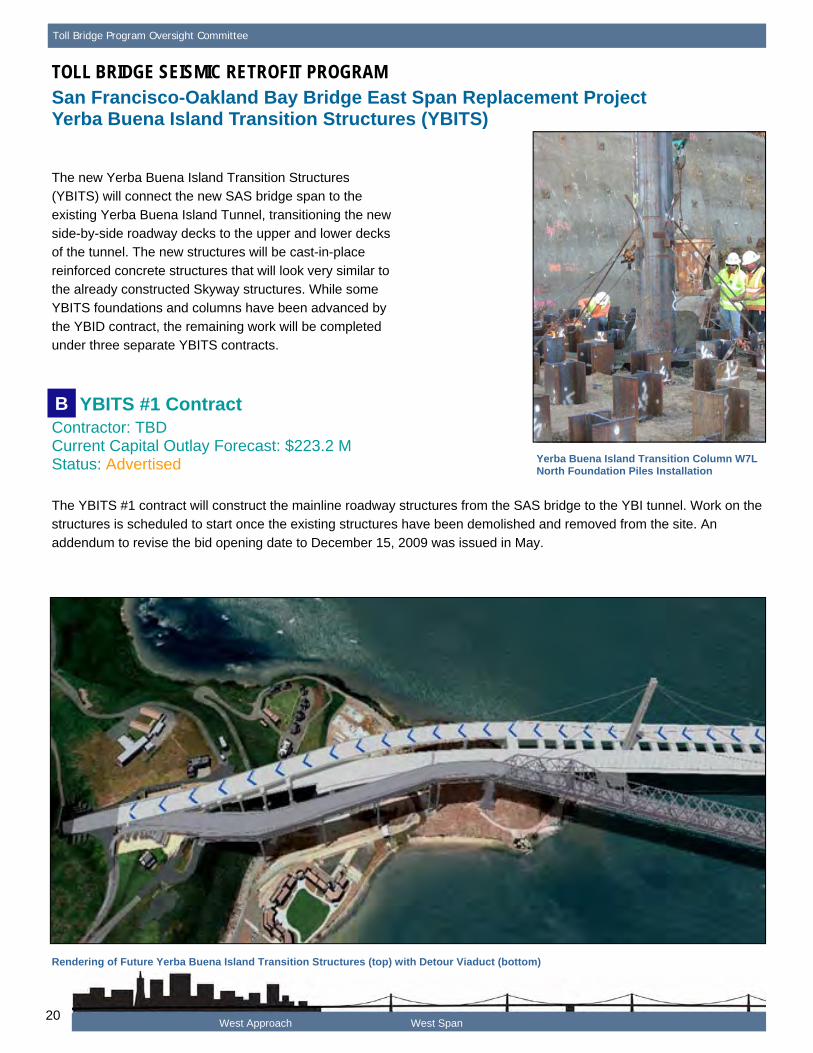
The new Yerba Buena Island Transition Structures (YBITS) will connect the new SAS bridge span to the
existing Yerba Buena Island Tunnel, transitioning the new side-by-side roadway decks to the upper and lower decks of the tunnel. The new structures will be cast-in-place
reinforced concrete structures that will look very similar to the already constructed Skyway structures. While some YBITS foundations and columns have been advanced by
the YBID contract, the remaining work will be completed under three separate YBITS contracts.
B YBITS #1 Contract Contractor: TBD Current Capital Outlay Forecast: $223.2 M
Yerba Buena Island Transition Column W7L Status: Advertised North Foundation Piles Installation
The YBITS #1 contract will construct the mainline roadway structures from the SAS bridge to the YBI tunnel. Work on the structures is scheduled to start once the existing structures have been demolished and removed from the site. An
addendum to revise the bid opening date to December 15, 2009 was issued in May.
Rendering of Future Yerba Buena Island Transition Structures (top) with Detour Viaduct (bottom)
West Approach West Span 20
Third Quarter 2009 Project Progress and Financial Update
YBITS #2 Contract Contractor: TBD Current Capital Outlay Forecast: $59.4 M Status: In Design
The YBITS #2 contract will demolish the detour viaduct after all traffic is shifted to the new bridge and will
construct a new eastbound on-ramp to the bridge in its place. The new ramp will also provide the final link for bicycle/pedestrian access off the SAS bridge onto
Yerba Buena Island.
YBITS Landscaping Contract Contractor: TBD Current Capital Outlay Forecast: $3.3 M Status: In Design
Upon completion of the YBITS work, a follow-on landscaping contract will be executed to re-plant and
landscape the area.
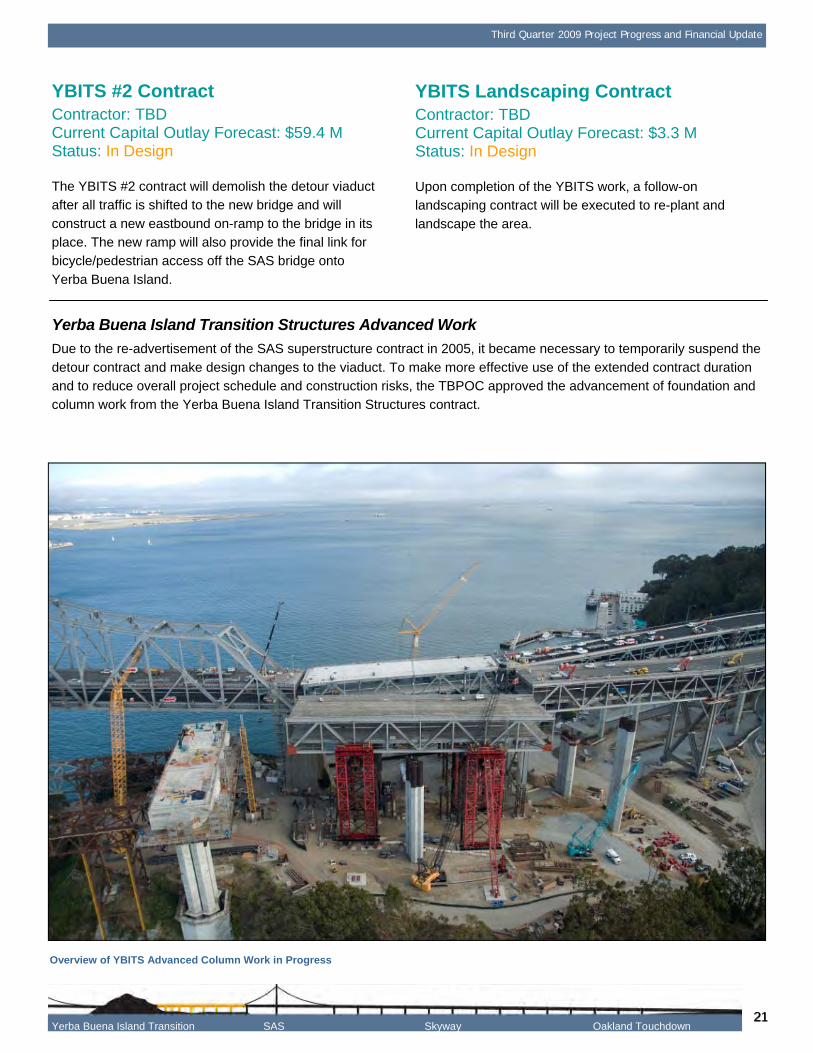
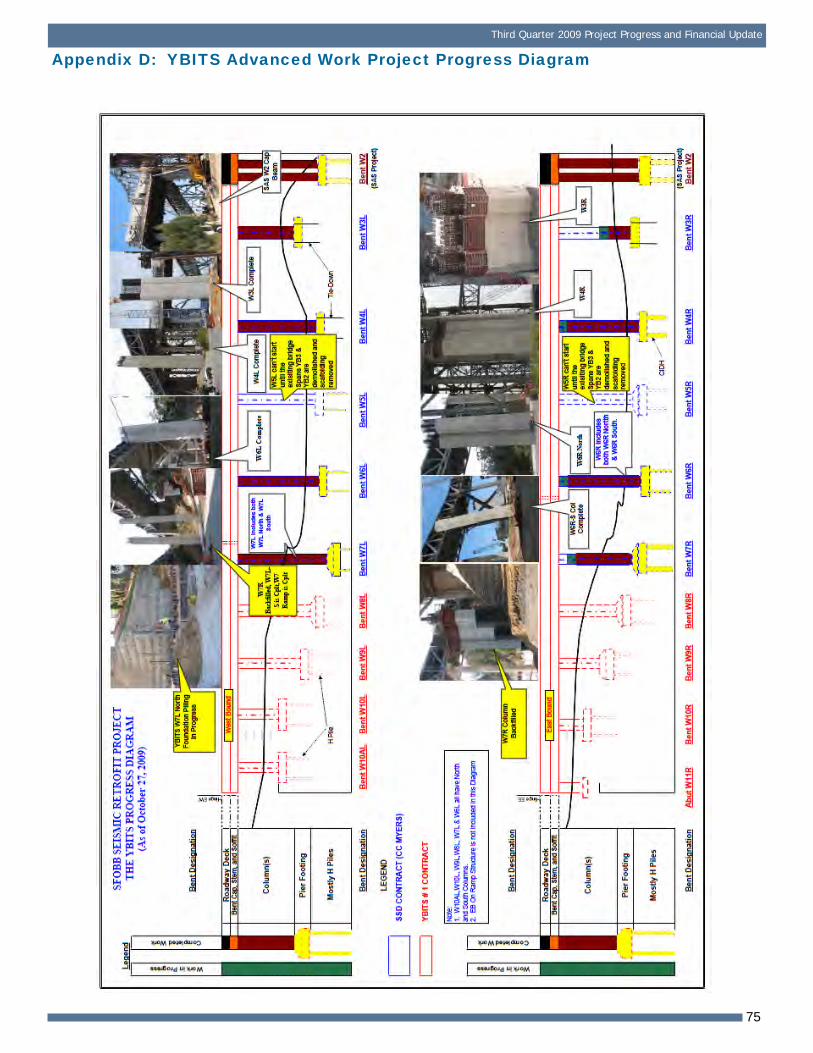
Yerba Buena Island Transition Structures Advanced Work
Due to the re-advertisement of the SAS superstructure contract in 2005, it became necessary to temporarily suspend the
detour contract and make design changes to the viaduct. To make more effective use of the extended contract duration and to reduce overall project schedule and construction risks, the TBPOC approved the advancement of foundation and column work from the Yerba Buena Island Transition Structures contract.
Overview of YBITS Advanced Column Work in Progress
21 Yerba Buena Island Transition SAS Skyway Oakland Touchdown
21
Toll Bridge Program Oversight Committee
TOLL BRIDGE SEISMIC RETROFIT PROGRAM
San Francisco-Oakland Bay Bridge East Span Replacement Project Self-Anchored Suspension (SAS) Bridge
If one single element bestows the status of world class on the new Bay Bridge East Span, it is the Self-Anchored Suspension (SAS) bridge. This engineering marvel will be
the world's largest SAS span at 2,047 feet in length, as well as the first bridge of its kind built with a single tower.
The SAS was separated into three separate contracts— construction of the land-based foundations and columns at Pier W2; construction of the marine-based foundations and
columns at Piers T1 and E2; and construction of the SAS steel superstructure, including the tower, roadway, and cabling. Construction of the foundations at Pier W2 and at
Piers T1 and E2 was completed in 2004 and 2007, respectively.
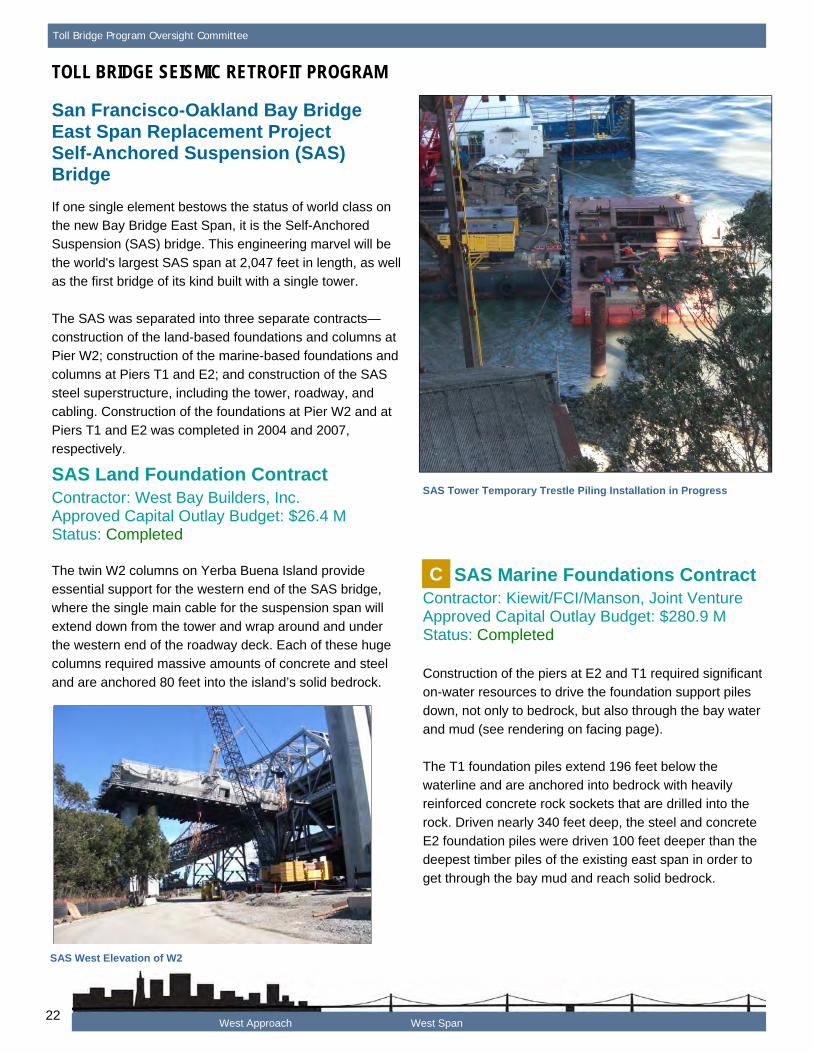
SAS Land Foundation Contract Contractor: West Bay Builders, Inc. Approved Capital Outlay Budget: $26.4 M Status: Completed
The twin W2 columns on Yerba Buena Island provide essential support for the western end of the SAS bridge, where the single main cable for the suspension span will
extend down from the tower and wrap around and under the western end of the roadway deck. Each of these huge columns required massive amounts of concrete and steel
and are anchored 80 feet into the island’s solid bedrock.
SAS West Elevation of W2
SAS Tower Temporary Trestle Piling Installation in Progress
C SAS Marine Foundations Contract Contractor: Kiewit/FCI/Manson, Joint Venture Approved Capital Outlay Budget: $280.9 M Status: Completed
Construction of the piers at E2 and T1 required significant on-water resources to drive the foundation support piles
down, not only to bedrock, but also through the bay water and mud (see rendering on facing page).
The T1 foundation piles extend 196 feet below the waterline and are anchored into bedrock with heavily reinforced concrete rock sockets that are drilled into the
rock. Driven nearly 340 feet deep, the steel and concrete E2 foundation piles were driven 100 feet deeper than the deepest timber piles of the existing east span in order to
get through the bay mud and reach solid bedrock.
West Approach West Span 22
Third Quarter 2009 Project Progress and Financial Update
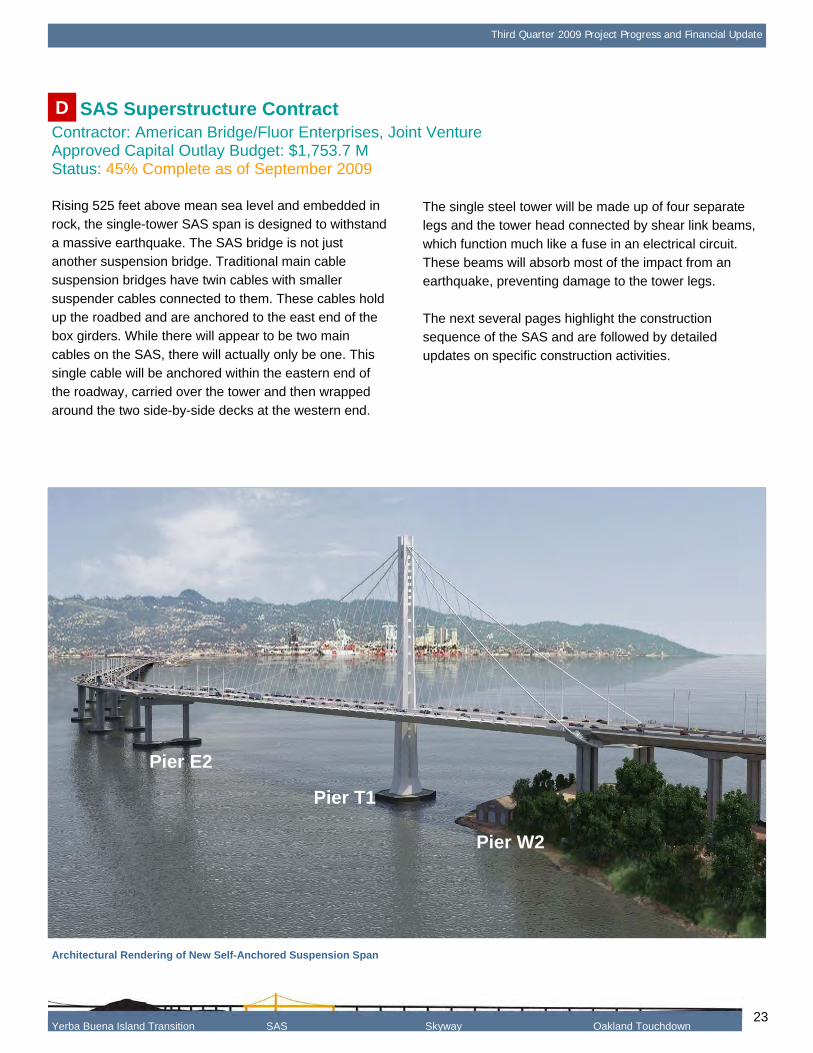
D SAS Superstructure Contract Contractor: American Bridge/Fluor Enterprises, Joint Venture
Pier E2
Pier T1
Pier W2
Approved Capital Outlay Budget: $1,753.7 M Status: 45% Complete as of September 2009
Rising 525 feet above mean sea level and embedded in rock, the single-tower SAS span is designed to withstand
a massive earthquake. The SAS bridge is not just another suspension bridge. Traditional main cable suspension bridges have twin cables with smaller
suspender cables connected to them. These cables hold up the roadbed and are anchored to the east end of the box girders. While there will appear to be two main
cables on the SAS, there will actually only be one. This single cable will be anchored within the eastern end of the roadway, carried over the tower and then wrapped
around the two side-by-side decks at the western end.
The single steel tower will be made up of four separate legs and the tower head connected by shear link beams,
which function much like a fuse in an electrical circuit. These beams will absorb most of the impact from an earthquake, preventing damage to the tower legs.
The next several pages highlight the construction sequence of the SAS and are followed by detailed
updates on specific construction activities.
Architectural Rendering of New Self-Anchored Suspension Span
Yerba Buena Island Transition SAS Skyway Oakland Touchdown 23
Toll Bridge Program Oversight Committee
TOLL BRIDGE SEISMIC RETROFIT PROGRAM
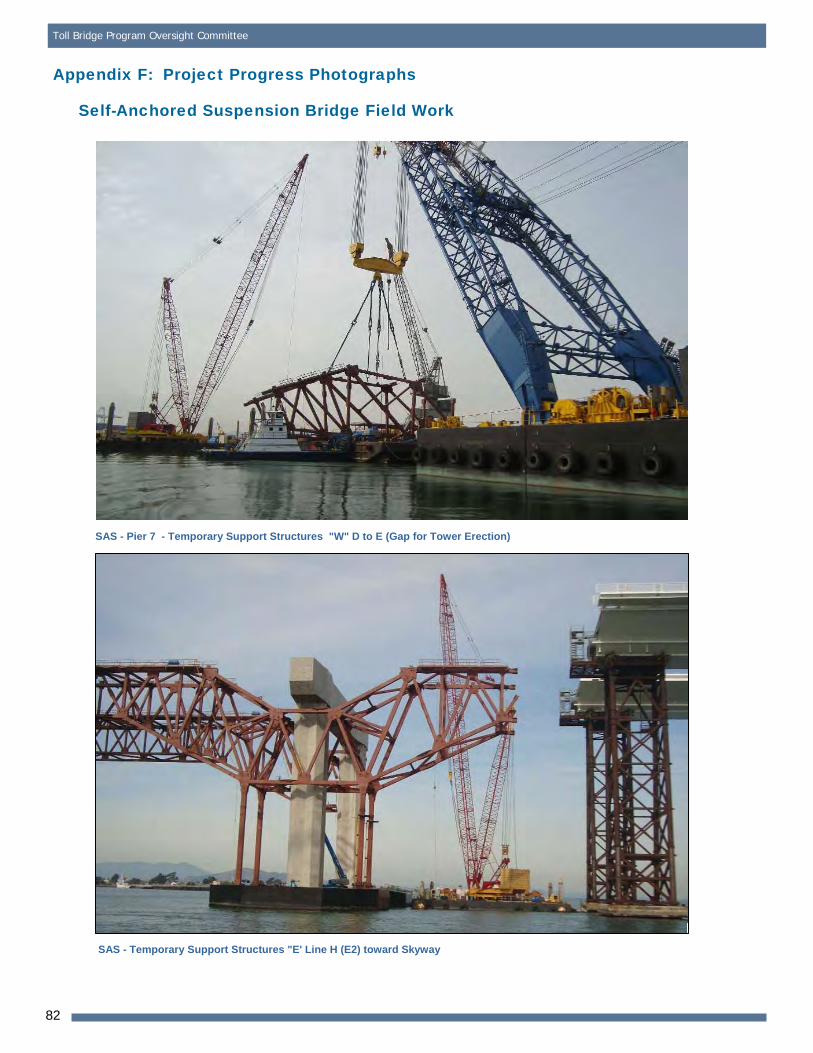
Self-Anchored Suspension (SAS) Construction Sequence
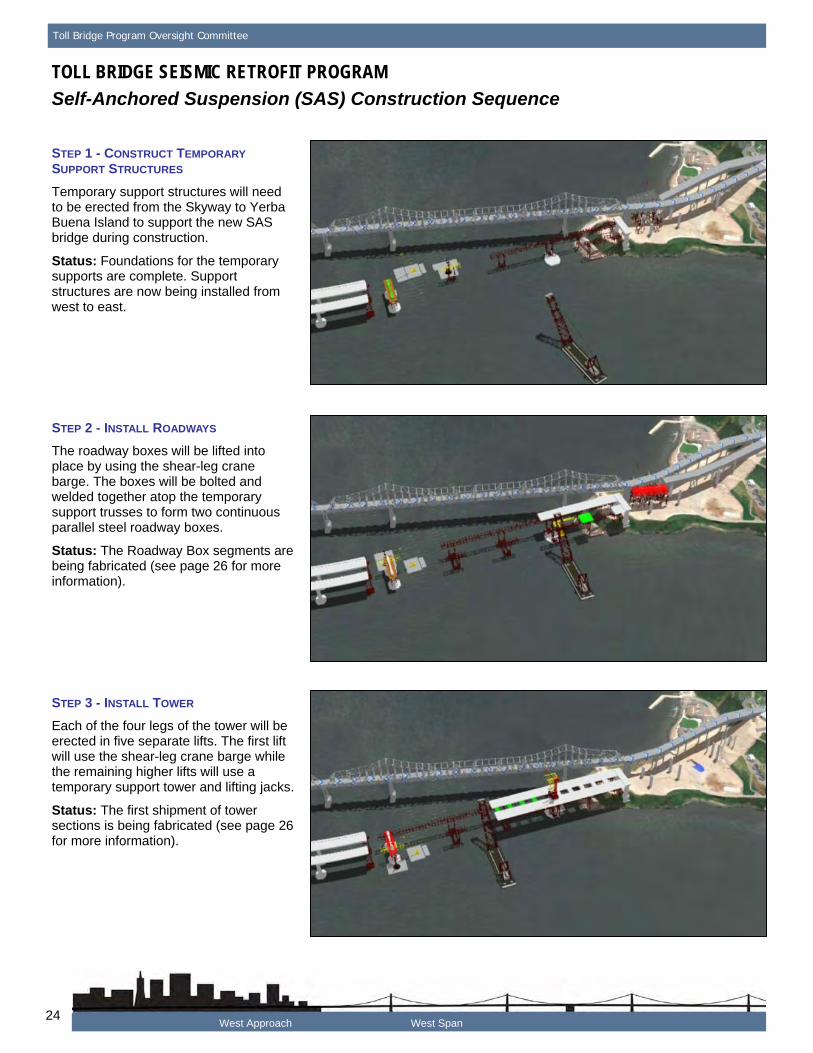
STEP 1 - CONSTRUCT TEMPORARY
SUPPORT STRUCTURES
Temporary support structures will need to be erected from the Skyway to Yerba Buena Island to support the new SAS bridge during construction.
Status: Foundations for the temporary supports are complete. Support structures are now being installed from west to east.
STEP 2 - INSTALL ROADWAYS
The roadway boxes will be lifted into place by using the shear-leg crane barge. The boxes will be bolted and welded together atop the temporary support trusses to form two continuous parallel steel roadway boxes.
Status: The Roadway Box segments are being fabricated (see page 26 for more information).
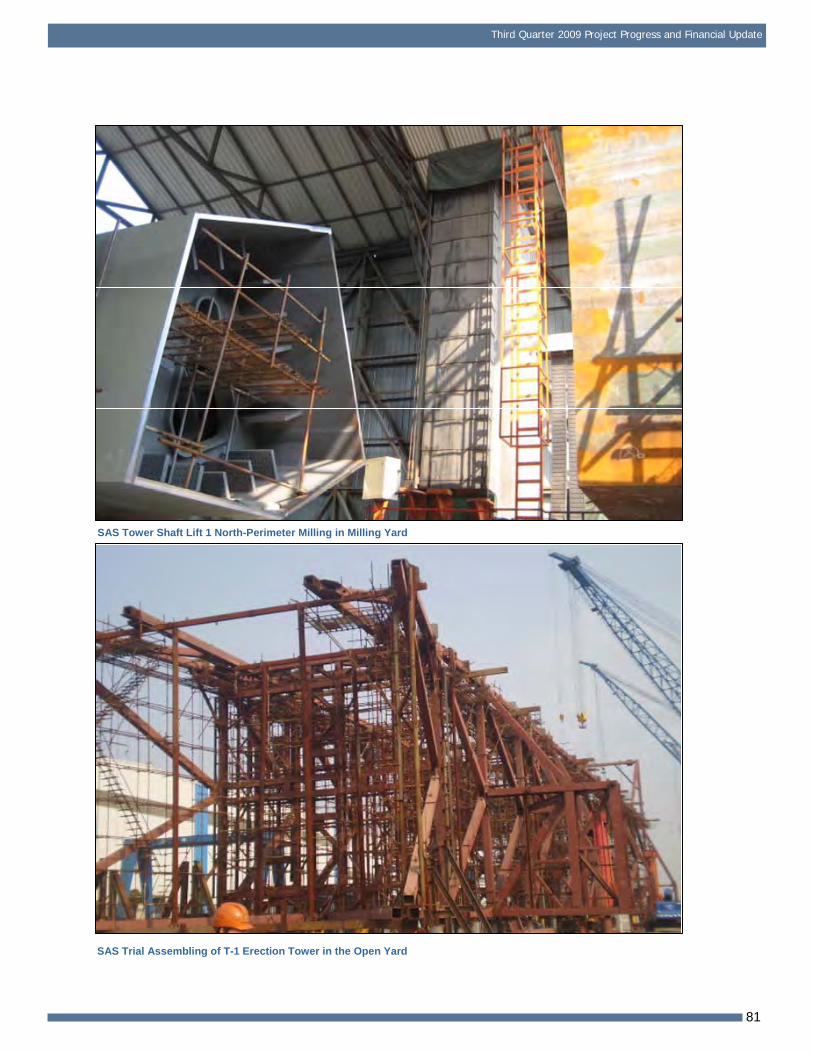
STEP 3 - INSTALL TOWER
Each of the four legs of the tower will be erected in five separate lifts. The first lift will use the shear-leg crane barge while the remaining higher lifts will use a temporary support tower and lifting jacks.
Status: The first shipment of tower sections is being fabricated (see page 26 for more information).
West Approach West Span 24
Third Quarter 2009 Project Progress and Financial Update
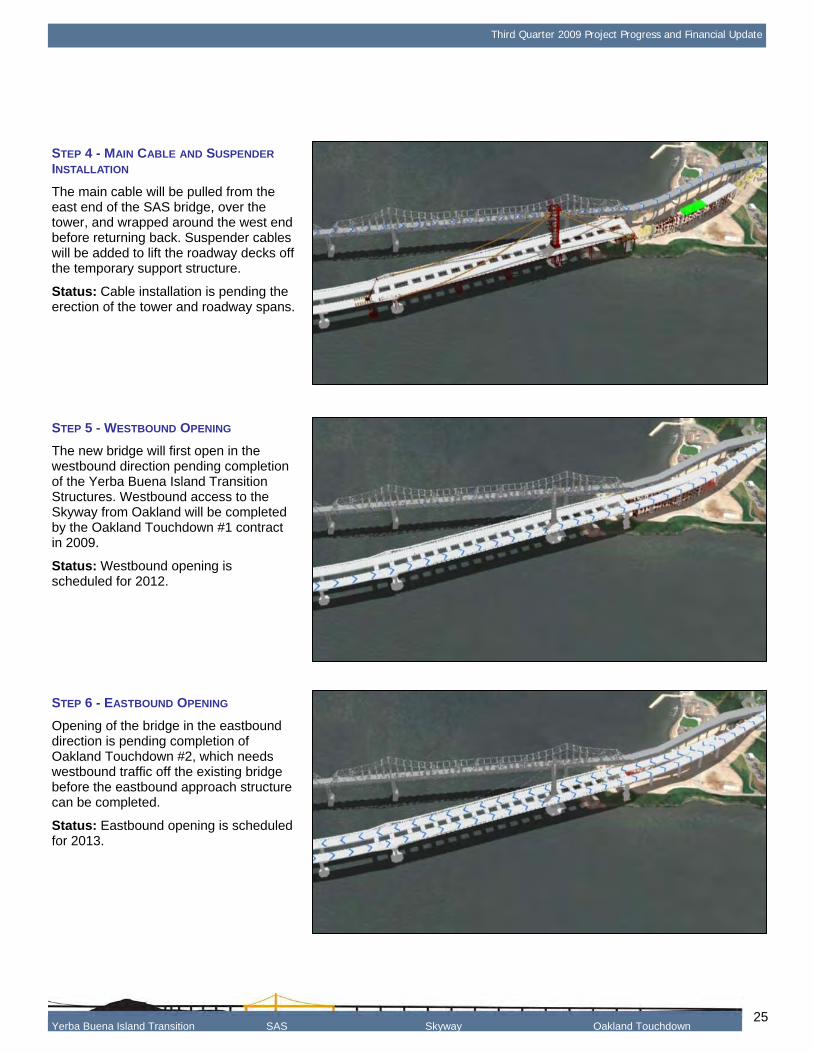
STEP 4 - MAIN CABLE AND SUSPENDER
INSTALLATION
The main cable will be pulled from the east end of the SAS bridge, over the tower, and wrapped around the west end before returning back. Suspender cables will be added to lift the roadway decks off the temporary support structure.
Status: Cable installation is pending the erection of the tower and roadway spans.
STEP 5 - WESTBOUND OPENING
The new bridge will first open in the westbound direction pending completion of the Yerba Buena Island Transition Structures. Westbound access to the Skyway from Oakland will be completed by the Oakland Touchdown #1 contract in 2009.
Status: Westbound opening is scheduled for 2012.
STEP 6 - EASTBOUND OPENING
Opening of the bridge in the eastbound direction is pending completion of Oakland Touchdown #2, which needs westbound traffic off the existing bridge before the eastbound approach structure can be completed.
Status: Eastbound opening is scheduled for 2013.
Yerba Buena Island Transition SAS Skyway Oakland Touchdown 25
Nearly every component of the SAS above the waterline— from the temporary support structures to the roadway and tower box sections to the main cable and suspender ropes
—will be fabricated off-site and erected into place upon arrival in the Bay Area. This project is truly global in nature, with fabrication of the bridge components occurring not only
in the United States but around the world—in China, the United Kingdom, Japan, South Korea and other locations.
Roadway and Tower Segments
Like giant three-dimensional jigsaw puzzles, the roadway
and tower segments of the SAS bridge are hollow steel shells that are internally strengthened and stiffened by a highly engineered network of welded steel ribs and
diaphragms. The use of steel in this manner allows for a flexible yet relatively light and strong structure able to withstand the massive loads placed on the bridge during
seismic events.
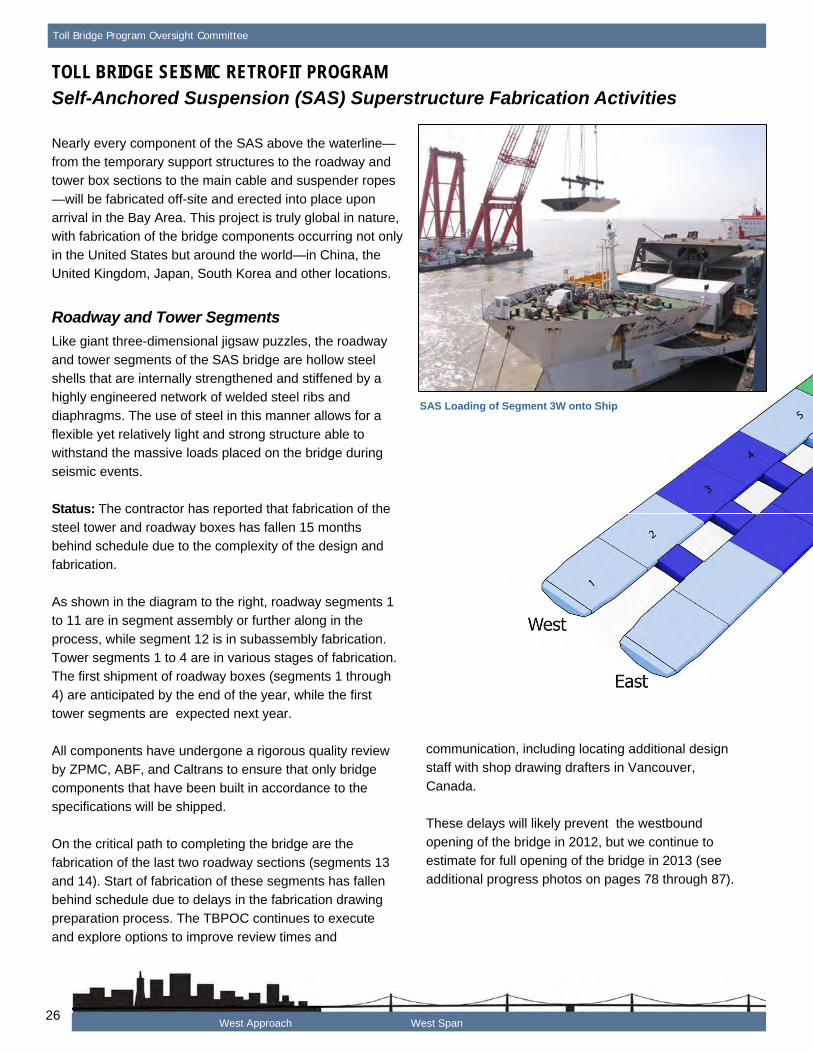
Status: The contractor has reported that fabrication of the
steel tower and roadway boxes has fallen 15 months behind schedule due to the complexity of the design and fabrication.
As shown in the diagram to the right, roadway segments 1 to 11 are in segment assembly or further along in the
process, while segment 12 is in subassembly fabrication. Tower segments 1 to 4 are in various stages of fabrication. The first shipment of roadway boxes (segments 1 through
4) are anticipated by the end of the year, while the first tower segments are expected next year.
All components have undergone a rigorous quality review by ZPMC, ABF, and Caltrans to ensure that only bridge components that have been built in accordance to the
specifications will be shipped.
On the critical path to completing the bridge are the
fabrication of the last two roadway sections (segments 13 and 14). Start of fabrication of these segments has fallen behind schedule due to delays in the fabrication drawing
preparation process. The TBPOC continues to execute and explore options to improve review times and
SAS Loading of Segment 3W onto Ship
communication, including locating additional design staff with shop drawing drafters in Vancouver,
Canada.
These delays will likely prevent the westbound
opening of the bridge in 2012, but we continue to estimate for full opening of the bridge in 2013 (see additional progress photos on pages 78 through 87).
West Approach West Span 26
Third Quarter 2009 Project Progress and Financial Update
S
W E
N
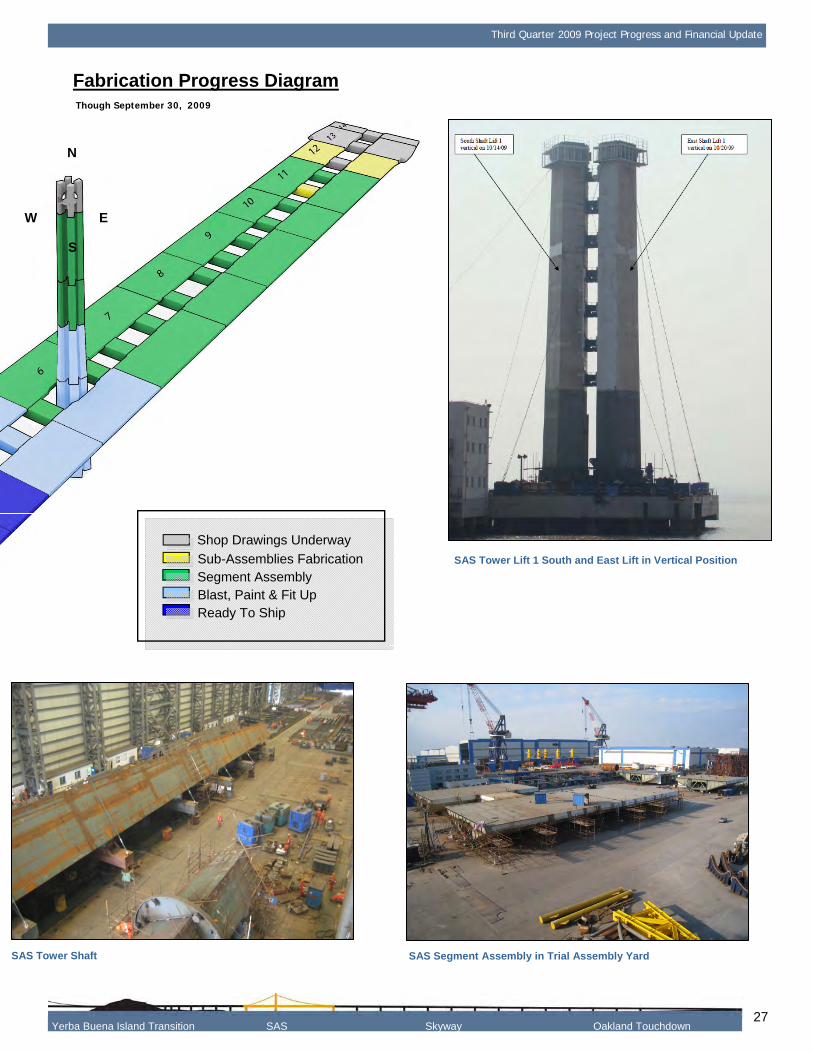
Fabrication Progress Diagram
Sub-Assemblies Fabrication Segment Assembly Blast, Paint & Fit Up Ready To Ship
Shop Drawings Underway
Though September 30, 2009
SAS Tower Lift 1 South and East Lift in Vertical Position
SAS Tower Shaft SAS Segment Assembly in Trial Assembly Yard
Yerba Buena Island Transition SAS Skyway Oakland Touchdown 27
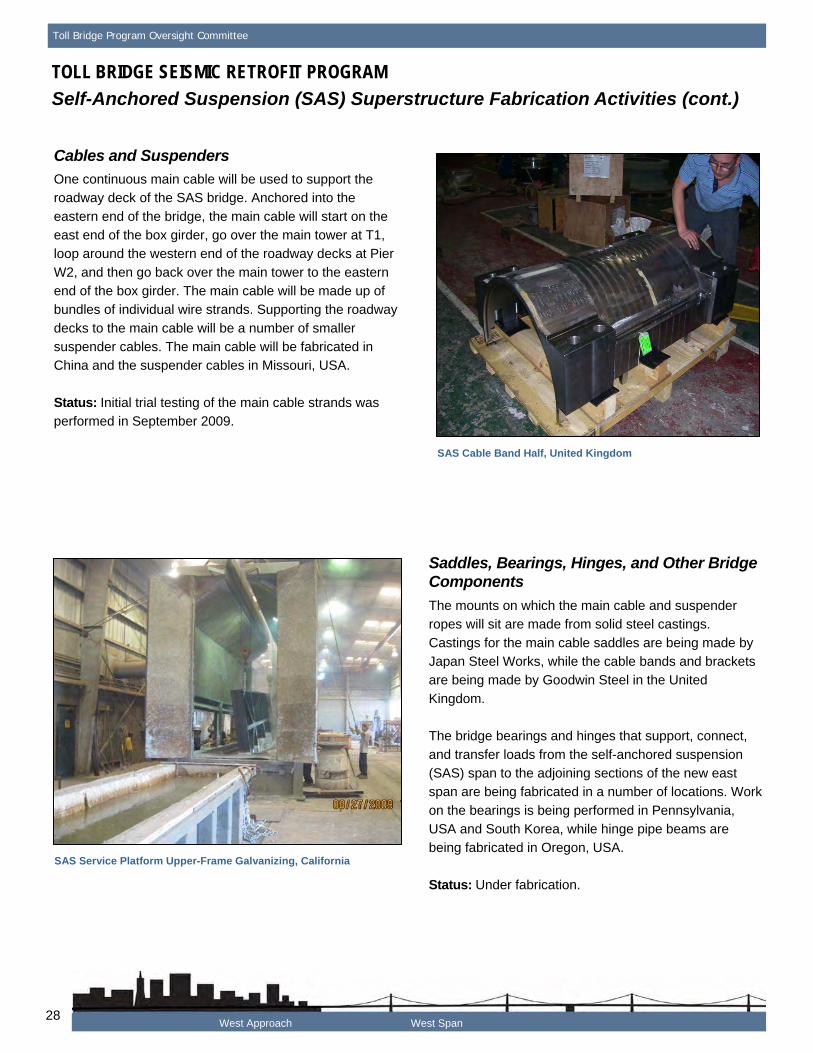
One continuous main cable will be used to support the roadway deck of the SAS bridge. Anchored into the
eastern end of the bridge, the main cable will start on the east end of the box girder, go over the main tower at T1, loop around the western end of the roadway decks at Pier
W2, and then go back over the main tower to the eastern end of the box girder. The main cable will be made up of bundles of individual wire strands. Supporting the roadway
decks to the main cable will be a number of smaller suspender cables. The main cable will be fabricated in China and the suspender cables in Missouri, USA.
Status: Initial trial testing of the main cable strands was performed in September 2009.
SAS Service Platform Upper-Frame Galvanizing, California
SAS Cable Band Half, United Kingdom
Saddles, Bearings, Hinges, and Other Bridge Components
The mounts on which the main cable and suspender ropes will sit are made from solid steel castings.
Castings for the main cable saddles are being made by Japan Steel Works, while the cable bands and brackets are being made by Goodwin Steel in the United
Kingdom.
The bridge bearings and hinges that support, connect,
and transfer loads from the self-anchored suspension (SAS) span to the adjoining sections of the new east span are being fabricated in a number of locations. Work
on the bearings is being performed in Pennsylvania, USA and South Korea, while hinge pipe beams are being fabricated in Oregon, USA.
Status: Under fabrication.
West Approach West Span 28
Third Quarter 2009 Project Progress and Financial Update
TOLL BRIDGE SEISMIC RETROFIT PROGRAM
Self-Anchored Suspension (SAS) Superstructure Field Activities
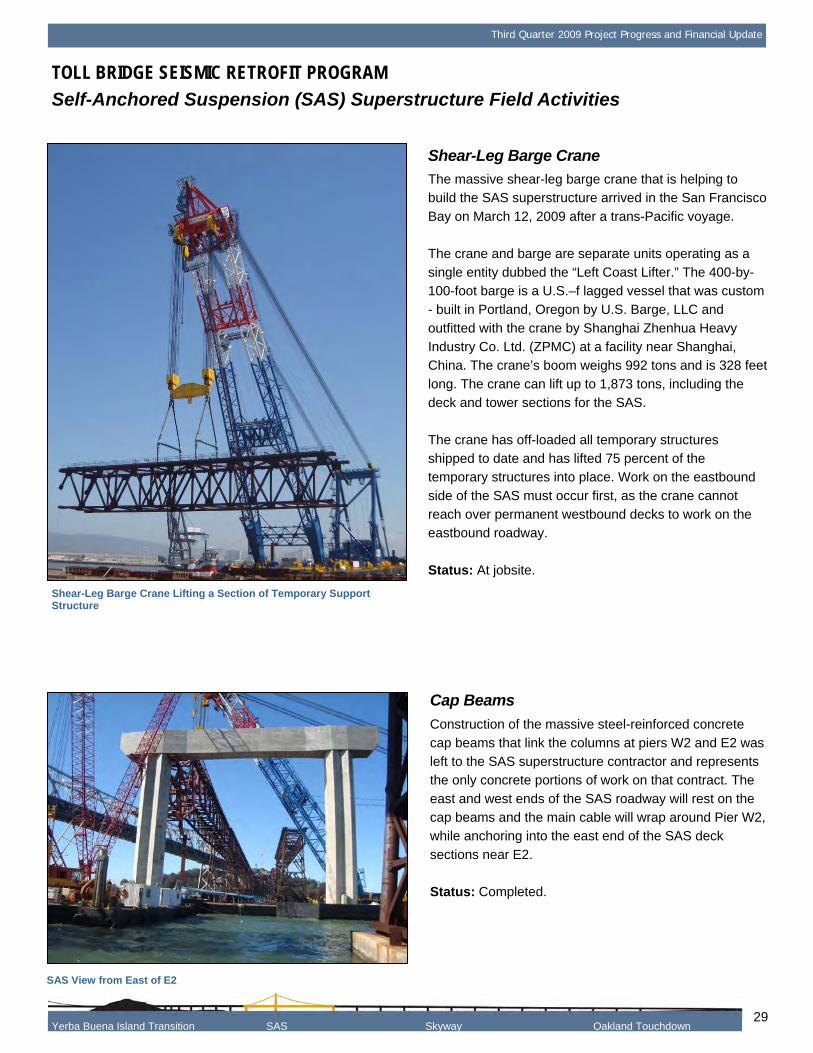
Shear-Leg Barge Crane Lifting a Section of Temporary Support Structure
Shear-Leg Barge Crane
The massive shear-leg barge crane that is helping to build the SAS superstructure arrived in the San Francisco
Bay on March 12, 2009 after a trans-Pacific voyage.
The crane and barge are separate units operating as a
single entity dubbed the “Left Coast Lifter.” The 400-by- 100-foot barge is a U.S.–f lagged vessel that was custom - built in Portland, Oregon by U.S. Barge, LLC and
outfitted with the crane by Shanghai Zhenhua Heavy Industry Co. Ltd. (ZPMC) at a facility near Shanghai, China. The crane’s boom weighs 992 tons and is 328 feet
long. The crane can lift up to 1,873 tons, including the deck and tower sections for the SAS.
The crane has off-loaded all temporary structures shipped to date and has lifted 75 percent of the temporary structures into place. Work on the eastbound
side of the SAS must occur first, as the crane cannot reach over permanent westbound decks to work on the eastbound roadway.
Status: At jobsite.
SAS View from East of E2
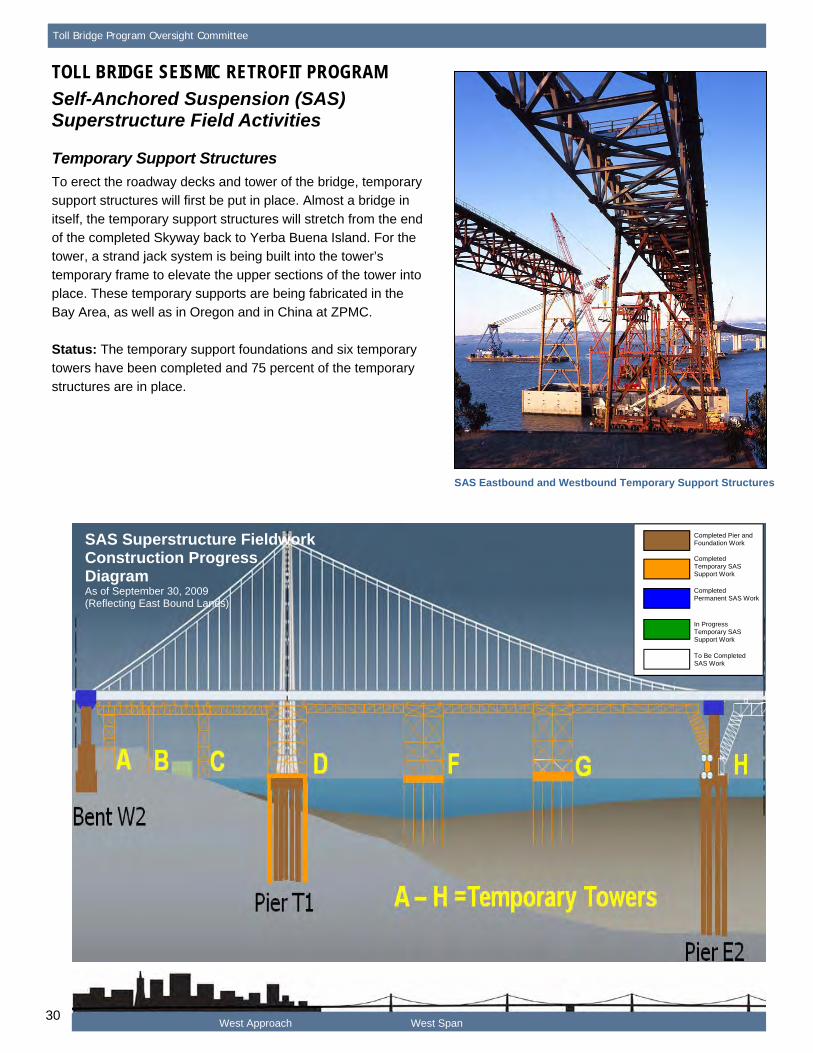
Cap Beams
Construction of the massive steel-reinforced concrete
cap beams that link the columns at piers W2 and E2 was left to the SAS superstructure contractor and represents the only concrete portions of work on that contract. The
east and west ends of the SAS roadway will rest on the cap beams and the main cable will wrap around Pier W2, while anchoring into the east end of the SAS deck
sections near E2.
Status: Completed.
Yerba Buena Island Transition SAS Skyway Oakland Touchdown 29
Toll Bridge Program Oversight Committee
TOLL BRIDGE SEISMIC RETROFIT PROGRAM
Self-Anchored Suspension (SAS) Superstructure Field Activities
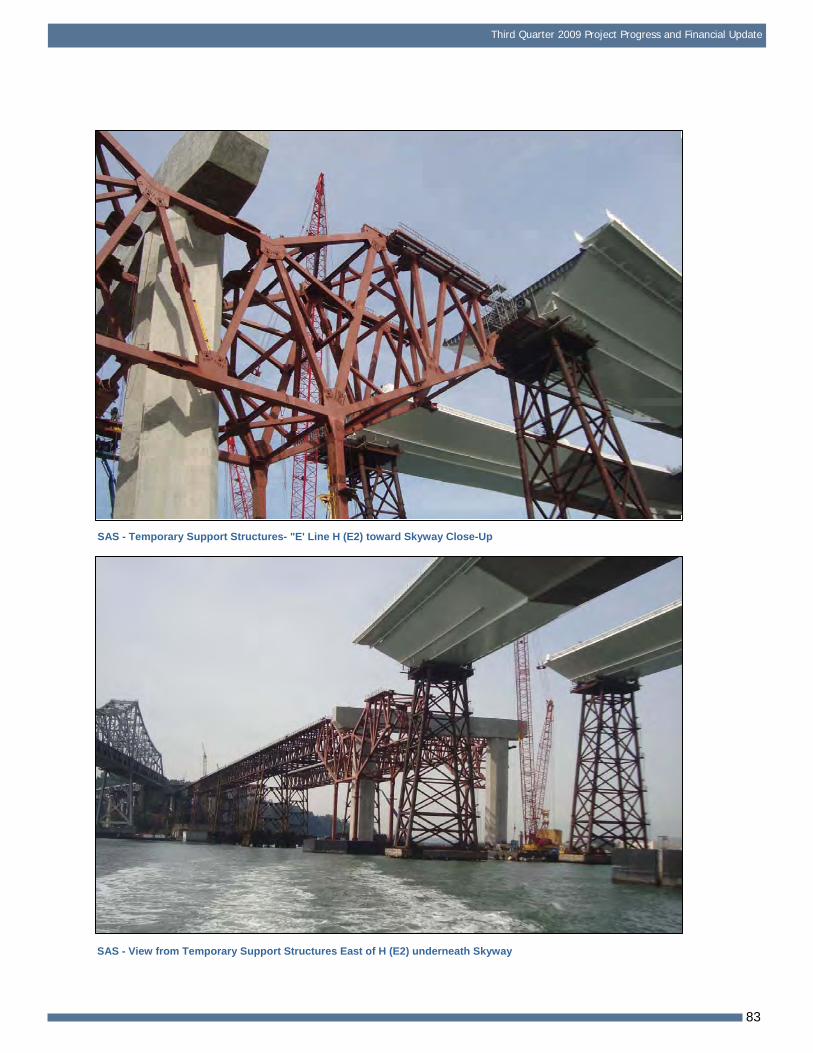
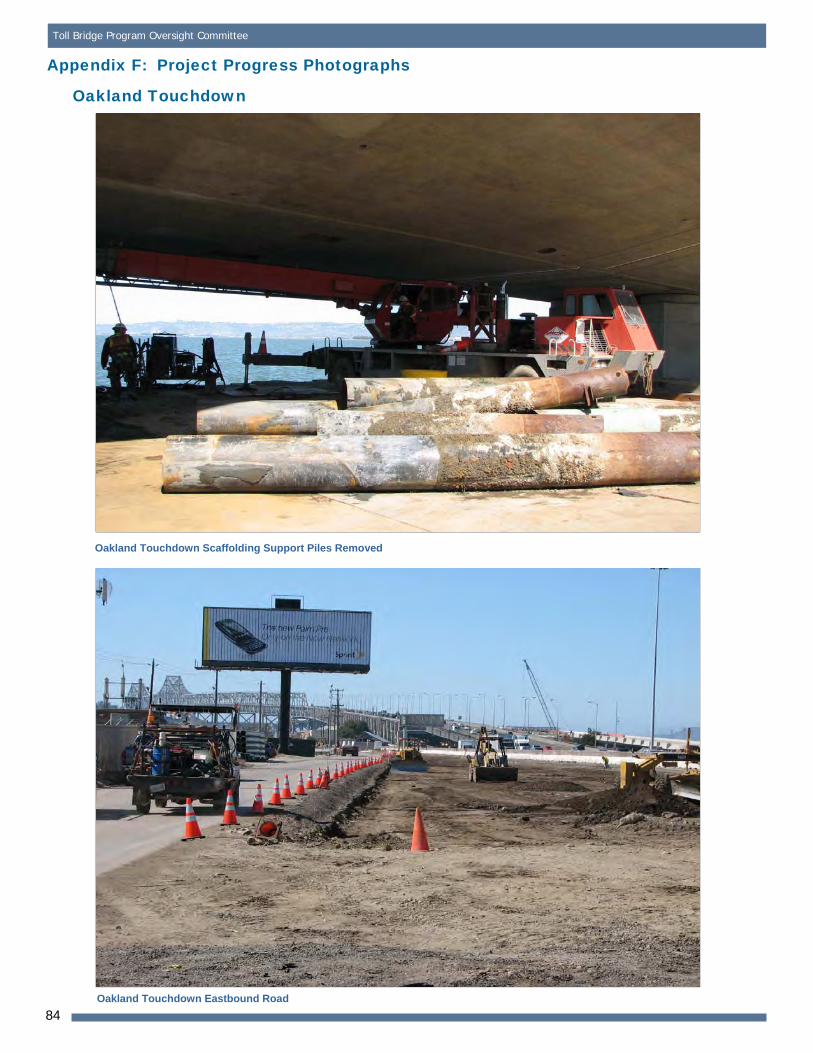
Temporary Support Structures
To erect the roadway decks and tower of the bridge, temporary support structures will first be put in place. Almost a bridge in
itself, the temporary support structures will stretch from the end of the completed Skyway back to Yerba Buena Island. For the tower, a strand jack system is being built into the tower’s
temporary frame to elevate the upper sections of the tower into place. These temporary supports are being fabricated in the Bay Area, as well as in Oregon and in China at ZPMC.
Status: The temporary support foundations and six temporary towers have been completed and 75 percent of the temporary
structures are in place.
SAS Eastbound and Westbound Temporary Support Structures
West Approach West Span
SAS Superstructure Fieldwork Construction Progress DiagramAs of September 30, 2009 (Reflecting East Bound Lanes)
Completed Pier and Foundation Work
Completed Temporary SAS Support Work
To Be Completed SAS Work
In Progress Temporary SAS Support Work
Completed Permanent SAS Work
30
Third Quarter 2009 Project Progress and Financial Update
SAS East and Westbound Temporary Support Structures Looking East
SAS Temporary Support Structures and Tower Erection Temporary Framing and the End of the completed Skyway on the Left
Yerba Buena Island Transition SAS Skyway Oakland Touchdown 31
Toll Bridge Program Oversight Committee
TOLL BRIDGE SEISMIC RETROFIT PROGRAM
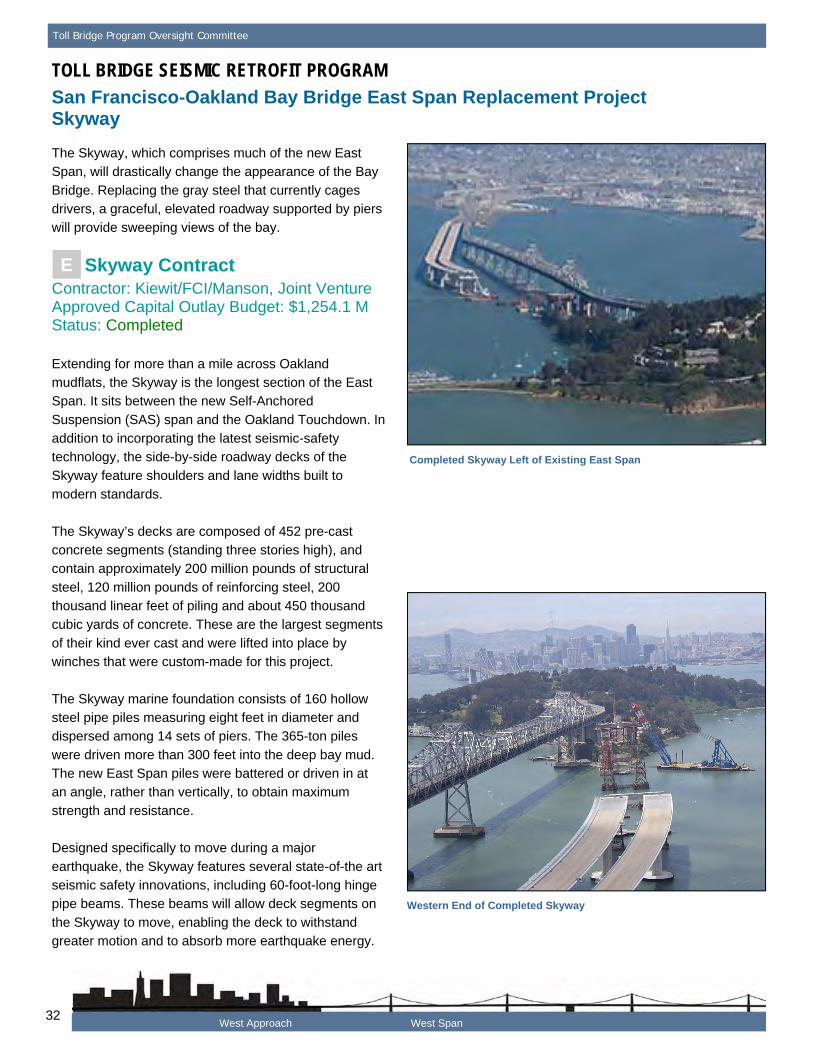
San Francisco-Oakland Bay Bridge East Span Replacement Project Skyway
The Skyway, which comprises much of the new East Span, will drastically change the appearance of the Bay
Bridge. Replacing the gray steel that currently cages drivers, a graceful, elevated roadway supported by piers will provide sweeping views of the bay.
E Skyway Contract Contractor: Kiewit/FCI/Manson, Joint Venture Approved Capital Outlay Budget: $1,254.1 M Status: Completed
Extending for more than a mile across Oakland mudflats, the Skyway is the longest section of the East Span. It sits between the new Self-Anchored
Suspension (SAS) span and the Oakland Touchdown. In addition to incorporating the latest seismic-safety technology, the side-by-side roadway decks of the
Skyway feature shoulders and lane widths built to modern standards.
The Skyway’s decks are composed of 452 pre-cast concrete segments (standing three stories high), and contain approximately 200 million pounds of structural
steel, 120 million pounds of reinforcing steel, 200 thousand linear feet of piling and about 450 thousand cubic yards of concrete. These are the largest segments
of their kind ever cast and were lifted into place by winches that were custom-made for this project.
The Skyway marine foundation consists of 160 hollow steel pipe piles measuring eight feet in diameter and dispersed among 14 sets of piers. The 365-ton piles
were driven more than 300 feet into the deep bay mud. The new East Span piles were battered or driven in at an angle, rather than vertically, to obtain maximum
strength and resistance.
Designed specifically to move during a major
earthquake, the Skyway features several state-of-the art seismic safety innovations, including 60-foot-long hinge pipe beams. These beams will allow deck segments on
the Skyway to move, enabling the deck to withstand greater motion and to absorb more earthquake energy.
Completed Skyway Left of Existing East Span
Western End of Completed Skyway
West Approach West Span 32
Third Quarter 2009 Project Progress and Financial Update
TOLL BRIDGE SEISMIC RETROFIT PROGRAM
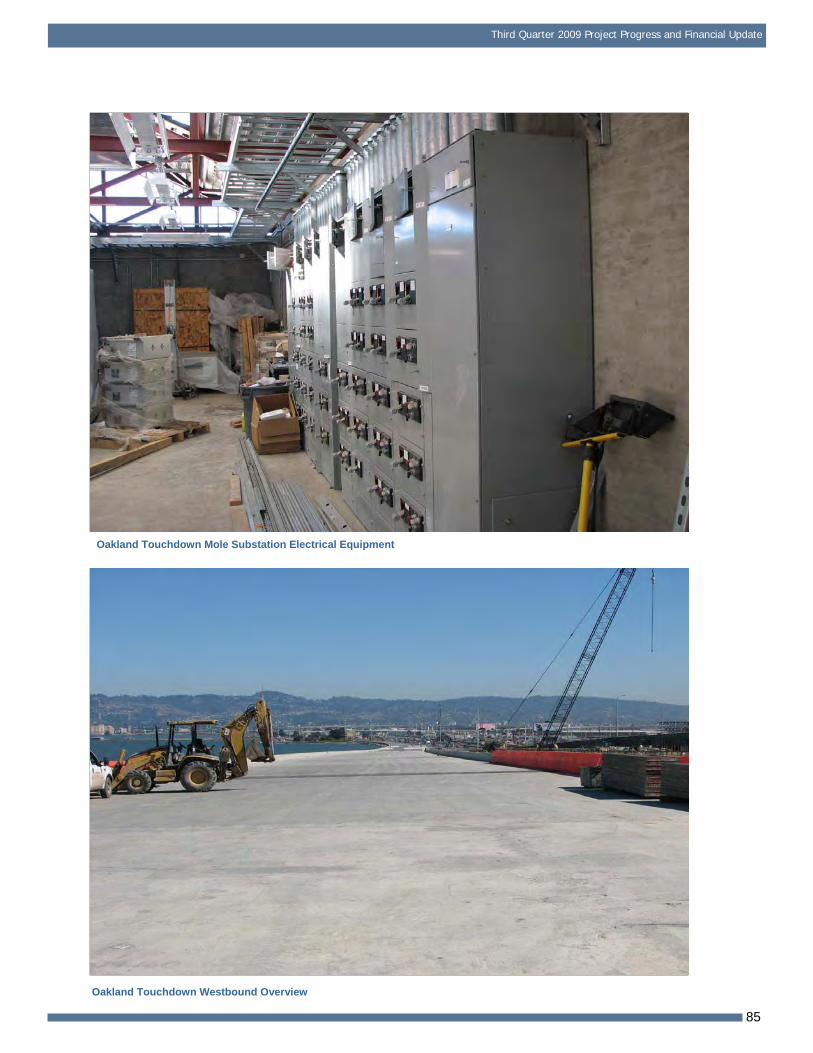
San Francisco-Oakland Bay Bridge East Span Replacement Project Oakland Touchdown
When completed, the Oakland Touchdown (OTD) structures will connect Interstate 80 in Oakland to the
new side-by-side decks of the new East Span. For westbound drivers, the OTD will be their introduction to the graceful new East Span. For eastbound drivers
from San Francisco, this section of the bridge will carry them from the Skyway to the East Bay, offering unobstructed views of the Oakland hills.
The OTD will be constructed through two contracts. The first contract will build the new westbound lanes,
as well as part of the eastbound lanes. The second contract to complete the eastbound lanes cannot fully begin until westbound traffic is shifted onto the new
bridge so that a portion of the upper deck of the existing bridge can be demolished to allow for a smooth transition for the new eastbound lanes in
Oakland.
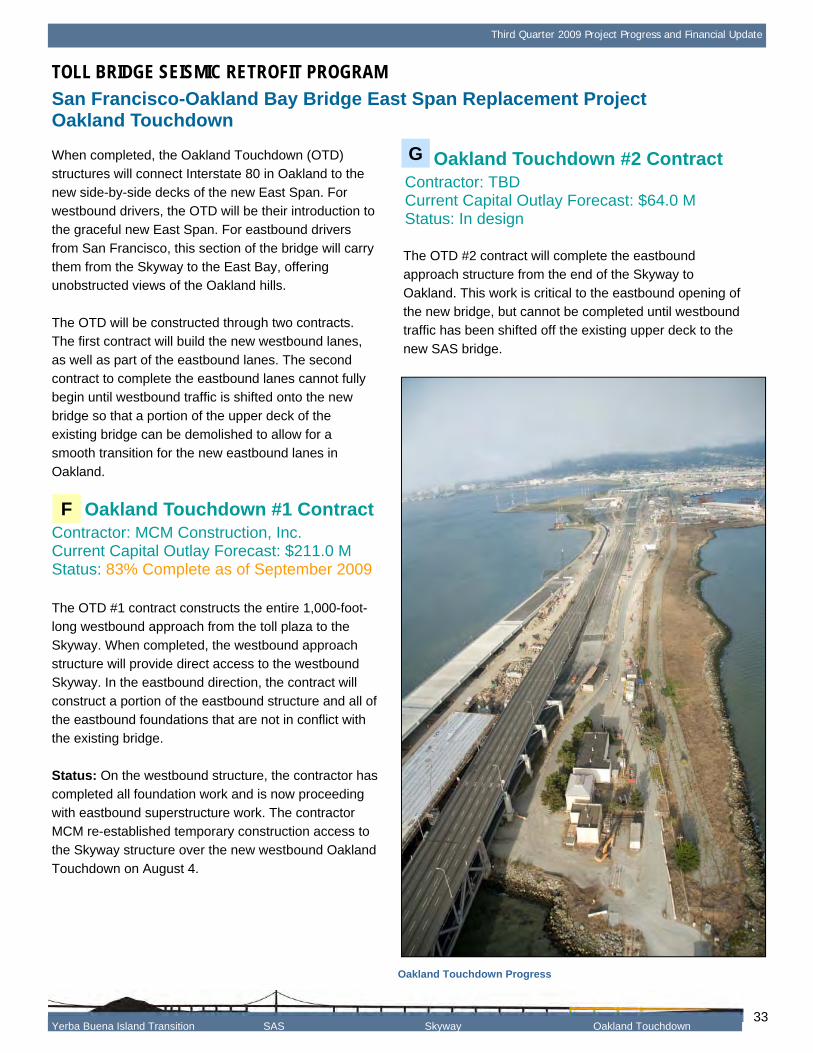
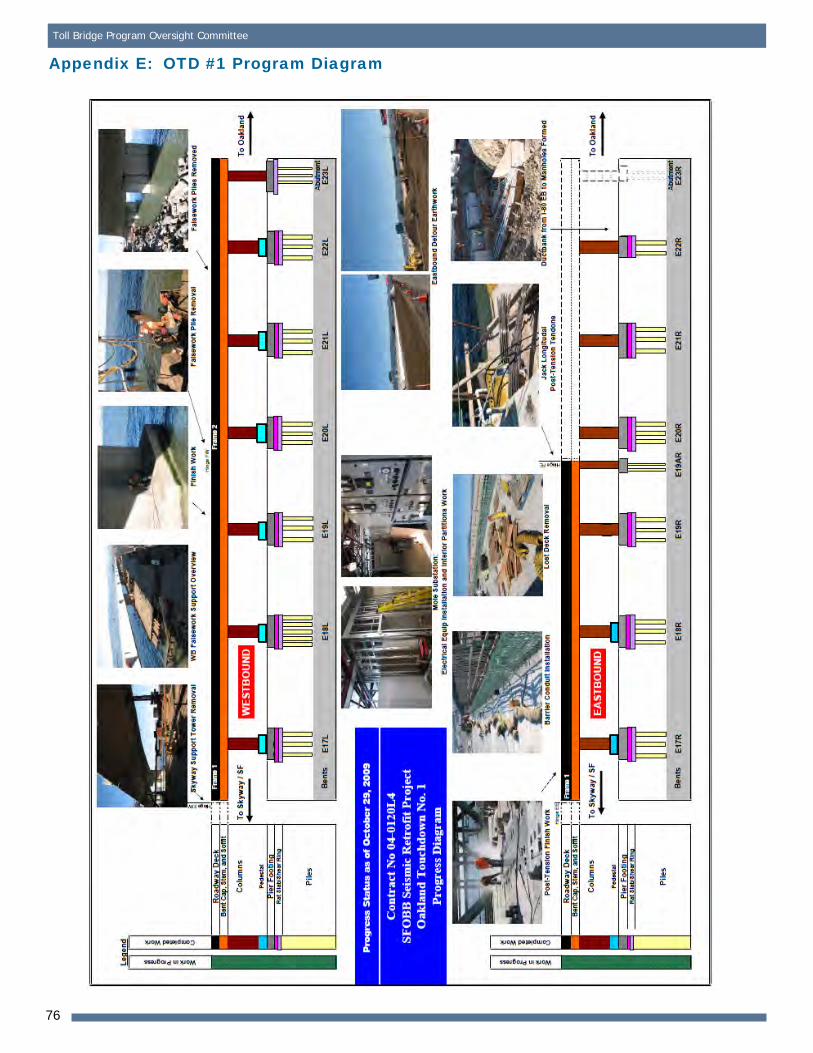
F Oakland Touchdown #1 Contract Contractor: MCM Construction, Inc. Current Capital Outlay Forecast: $211.0 M Status: 83% Complete as of September 2009
The OTD #1 contract constructs the entire 1,000-footlong westbound approach from the toll plaza to the
Skyway. When completed, the westbound approach structure will provide direct access to the westbound Skyway. In the eastbound direction, the contract will
construct a portion of the eastbound structure and all of the eastbound foundations that are not in conflict with the existing bridge.
Status: On the westbound structure, the contractor has completed all foundation work and is now proceeding
with eastbound superstructure work. The contractor MCM re-established temporary construction access to the Skyway structure over the new westbound Oakland
Touchdown on August 4.
G Oakland Touchdown #2 Contract Contractor: TBD Current Capital Outlay Forecast: $64.0 M Status: In design
The OTD #2 contract will complete the eastbound approach structure from the end of the Skyway to
Oakland. This work is critical to the eastbound opening of the new bridge, but cannot be completed until westbound traffic has been shifted off the existing upper deck to the
new SAS bridge.
Oakland Touchdown Progress
Yerba Buena Island Transition SAS Skyway Oakland Touchdown 33
Toll Bridge Program Oversight Committee
TOLL BRIDGE SEISMIC RETROFIT PROGRAM
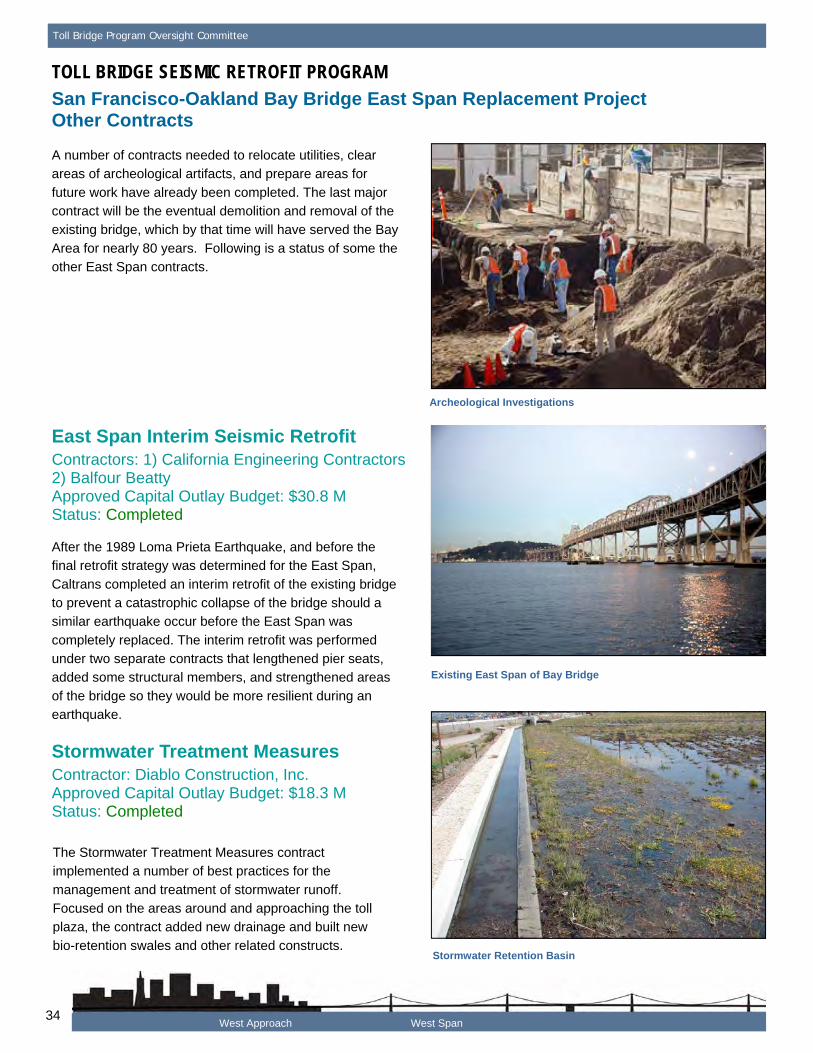
San Francisco-Oakland Bay Bridge East Span Replacement Project Other Contracts
A number of contracts needed to relocate utilities, clear areas of archeological artifacts, and prepare areas for
future work have already been completed. The last major contract will be the eventual demolition and removal of the existing bridge, which by that time will have served the Bay
Area for nearly 80 years. Following is a status of some the other East Span contracts.
Archeological Investigations
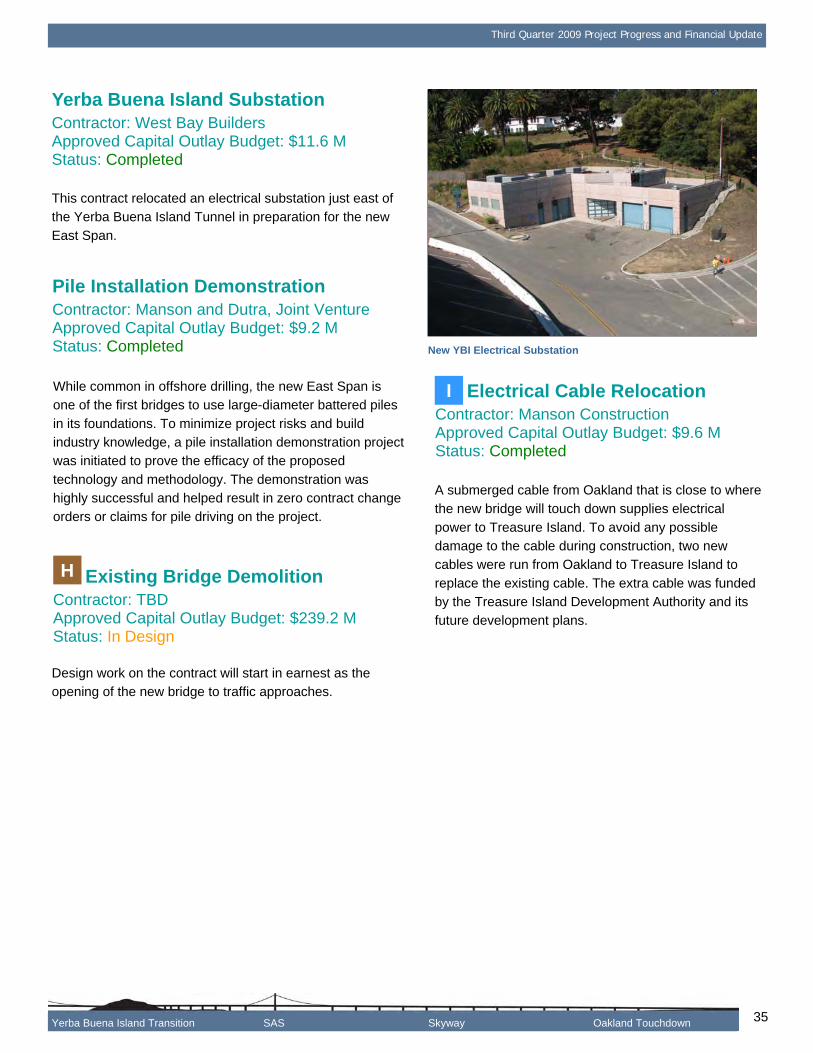
East Span Interim Seismic Retrofit Contractors: 1) California Engineering Contractors 2) Balfour Beatty Approved Capital Outlay Budget: $30.8 M Status: Completed
After the 1989 Loma Prieta Earthquake, and before the final retrofit strategy was determined for the East Span,
Caltrans completed an interim retrofit of the existing bridge to prevent a catastrophic collapse of the bridge should a similar earthquake occur before the East Span was
completely replaced. The interim retrofit was performed under two separate contracts that lengthened pier seats, added some structural members, and strengthened areas
of the bridge so they would be more resilient during an earthquake.
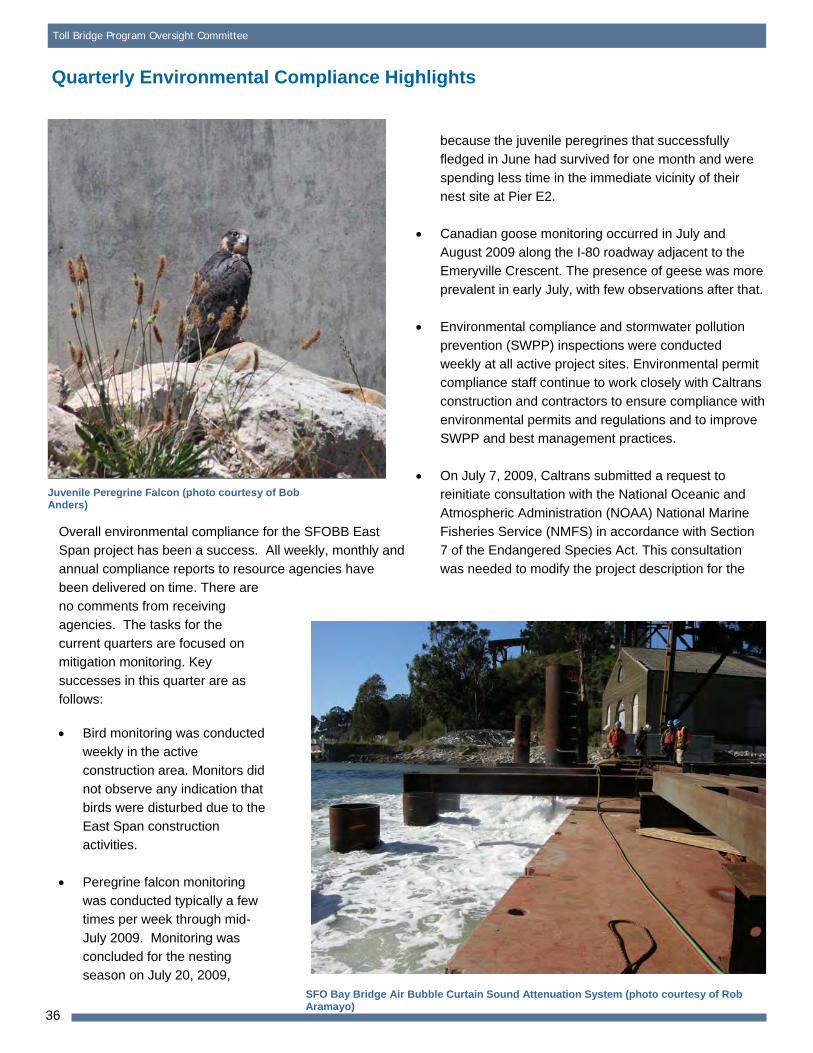
Stormwater Treatment Measures Contractor: Diablo Construction, Inc. Approved Capital Outlay Budget: $18.3 M Status: Completed
The Stormwater Treatment Measures contract implemented a number of best practices for the
management and treatment of stormwater runoff. Focused on the areas around and approaching the toll plaza, the contract added new drainage and built new
bio-retention swales and other related constructs.
Existing East Span of Bay Bridge
Stormwater Retention Basin
West Approach West Span 34
Third Quarter 2009 Project Progress and Financial Update
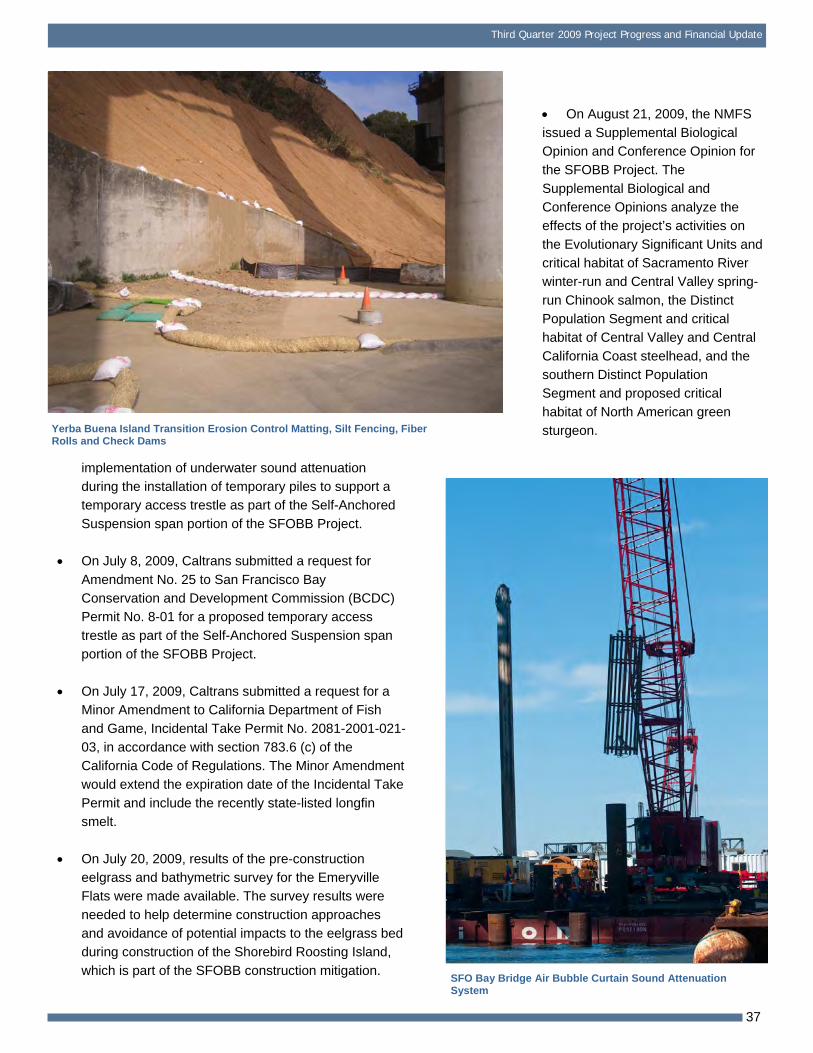
Yerba Buena Island Substation Contractor: West Bay Builders Approved Capital Outlay Budget: $11.6 M Status: Completed
This contract relocated an electrical substation just east of the Yerba Buena Island Tunnel in preparation for the new
East Span.
Pile Installation Demonstration Contractor: Manson and Dutra, Joint Venture Approved Capital Outlay Budget: $9.2 M Status: Completed
While common in offshore drilling, the new East Span is one of the first bridges to use large-diameter battered piles
in its foundations. To minimize project risks and build industry knowledge, a pile installation demonstration project was initiated to prove the efficacy of the proposed
technology and methodology. The demonstration was highly successful and helped result in zero contract change orders or claims for pile driving on the project.
H Existing Bridge Demolition Contractor: TBD Approved Capital Outlay Budget: $239.2 M Status: In Design
Design work on the contract will start in earnest as the opening of the new bridge to traffic approaches.
New YBI Electrical Substation
I Electrical Cable Relocation Contractor: Manson Construction Approved Capital Outlay Budget: $9.6 M Status: Completed
A submerged cable from Oakland that is close to where the new bridge will touch down supplies electrical
power to Treasure Island. To avoid any possible damage to the cable during construction, two new cables were run from Oakland to Treasure Island to
replace the existing cable. The extra cable was funded by the Treasure Island Development Authority and its future development plans.
Yerba Buena Island Transition SAS Skyway Oakland Touchdown 35
Toll Bridge Program Oversight Committee
Quarterly Environmental Compliance Highlights
Juvenile Peregrine Falcon (photo courtesy of Bob Anders)
Overall environmental compliance for the SFOBB East Span project has been a success. All weekly, monthly and
annual compliance reports to resource agencies have been delivered on time. There are no comments from receiving
agencies. The tasks for the current quarters are focused on mitigation monitoring. Key
successes in this quarter are as follows:
Bird monitoring was conducted weekly in the active
construction area. Monitors did not observe any indication that birds were disturbed due to the
East Span construction activities.
Peregrine falcon monitoring was conducted typically a few times per week through mid-
July 2009. Monitoring was concluded for the nesting season on July 20, 2009,
because the juvenile peregrines that successfully fledged in June had survived for one month and were
spending less time in the immediate vicinity of their nest site at Pier E2.
Canadian goose monitoring occurred in July and August 2009 along the I-80 roadway adjacent to the Emeryville Crescent. The presence of geese was more
prevalent in early July, with few observations after that.
Environmental compliance and stormwater pollution
prevention (SWPP) inspections were conducted weekly at all active project sites. Environmental permit compliance staff continue to work closely with Caltrans
construction and contractors to ensure compliance with environmental permits and regulations and to improve SWPP and best management practices.
On July 7, 2009, Caltrans submitted a request to reinitiate consultation with the National Oceanic and
Atmospheric Administration (NOAA) National Marine Fisheries Service (NMFS) in accordance with Section 7 of the Endangered Species Act. This consultation
was needed to modify the project description for the
SFO Bay Bridge Air Bubble Curtain Sound Attenuation System (photo courtesy of Rob Aramayo)
36
Third Quarter 2009 Project Progress and Financial Update
Yerba Buena Island Transition Erosion Control Matting, Silt Fencing, Fiber Rolls and Check Dams
implementation of underwater sound attenuation during the installation of temporary piles to support a temporary access trestle as part of the Self-Anchored
Suspension span portion of the SFOBB Project.
On July 8, 2009, Caltrans submitted a request for
Amendment No. 25 to San Francisco Bay Conservation and Development Commission (BCDC) Permit No. 8-01 for a proposed temporary access
trestle as part of the Self-Anchored Suspension span portion of the SFOBB Project.
On July 17, 2009, Caltrans submitted a request for a Minor Amendment to California Department of Fish and Game, Incidental Take Permit No. 2081-2001-021
03, in accordance with section 783.6 (c) of the California Code of Regulations. The Minor Amendment would extend the expiration date of the Incidental Take
Permit and include the recently state-listed longfin smelt.
On July 20, 2009, results of the pre-construction eelgrass and bathymetric survey for the Emeryville Flats were made available. The survey results were
needed to help determine construction approaches and avoidance of potential impacts to the eelgrass bed during construction of the Shorebird Roosting Island,
which is part of the SFOBB construction mitigation.
On August 21, 2009, the NMFS
issued a Supplemental Biological Opinion and Conference Opinion for the SFOBB Project. The
Supplemental Biological and Conference Opinions analyze the effects of the project’s activities on
the Evolutionary Significant Units and critical habitat of Sacramento River winter-run and Central Valley spring-
run Chinook salmon, the Distinct Population Segment and critical habitat of Central Valley and Central
California Coast steelhead, and the southern Distinct Population Segment and proposed critical
habitat of North American green sturgeon.
SFO Bay Bridge Air Bubble Curtain Sound Attenuation System
37
Toll Bridge Program Oversight Committee
TOLL BRIDGE SEISMIC RETROFIT PROGRAM
Other Completed Projects
The State Legislature in the 1990s identified seven of the nine state-owned toll bridges for seismic retrofit. In
addition to the San Francisco-Oakland Bay Bridge, these included the Benicia-Martinez, Carquinez, Richmond-San Rafael and San Mateo-Hayward
bridges in the Bay Area, and the Vincent Thomas and Coronado bridges in Southern California. Other than the East Span of the Bay Bridge, the retrofits of all of
the bridges have been completed as planned.
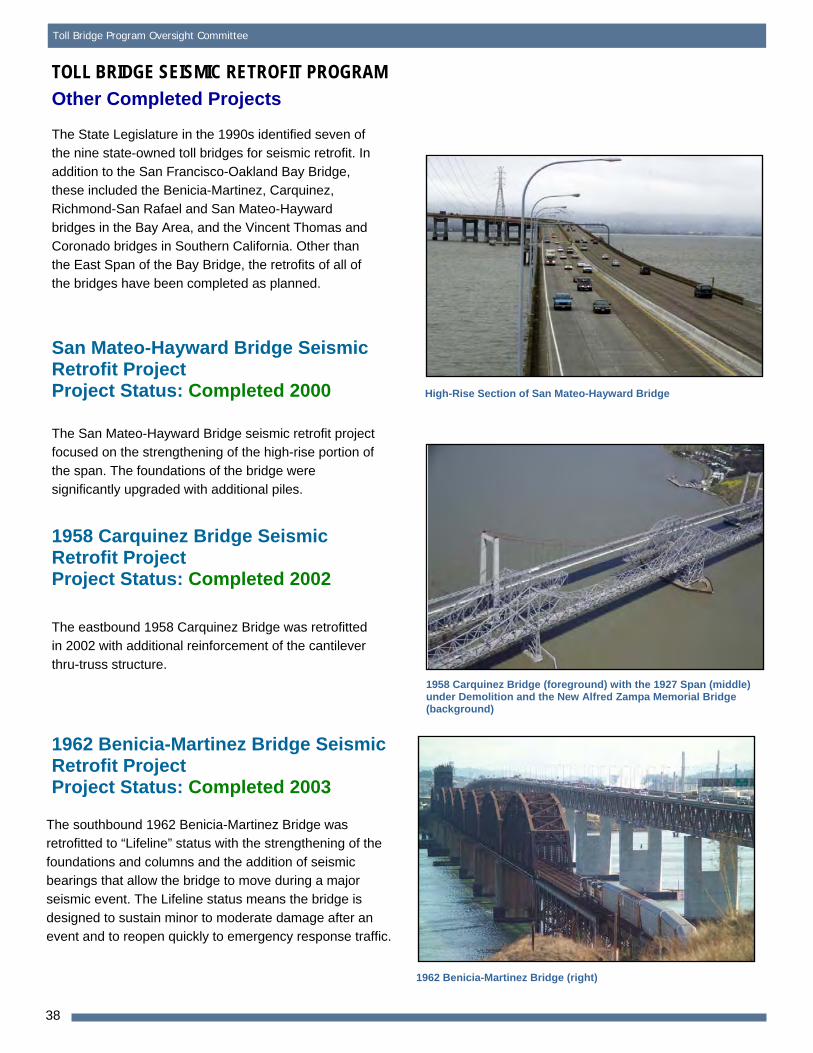
San Mateo-Hayward Bridge Seismic Retrofit Project Project Status: Completed 2000
The San Mateo-Hayward Bridge seismic retrofit project focused on the strengthening of the high-rise portion of
the span. The foundations of the bridge were significantly upgraded with additional piles.
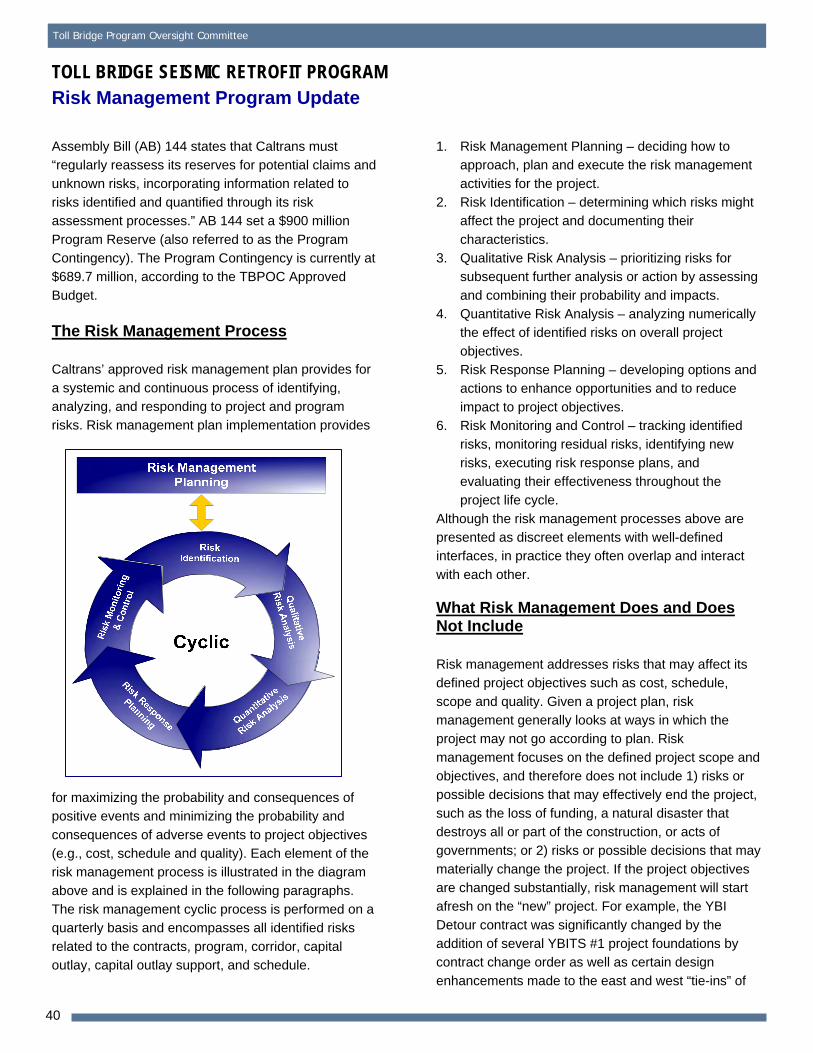
The southbound 1962 Benicia-Martinez Bridge was retrofitted to “Lifeline” status with the strengthening of the
foundations and columns and the addition of seismic bearings that allow the bridge to move during a major seismic event. The Lifeline status means the bridge is
designed to sustain minor to moderate damage after an event and to reopen quickly to emergency response traffic.
High-Rise Section of San Mateo-Hayward Bridge
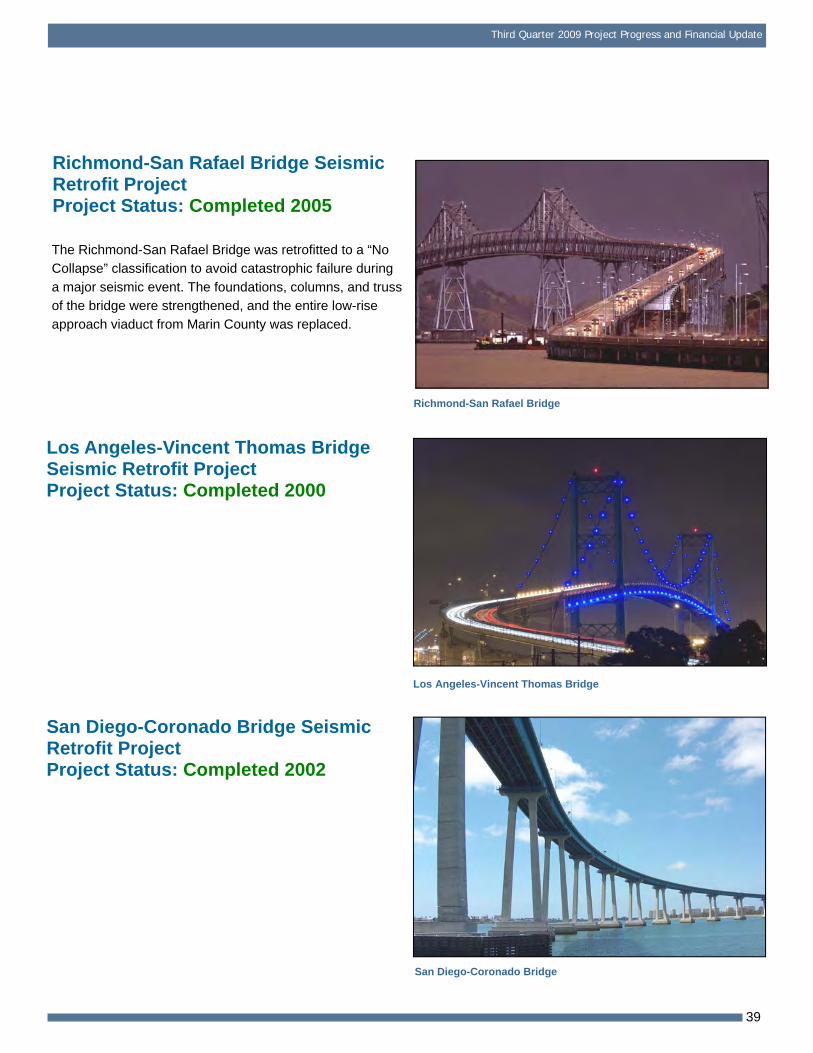
1958 Carquinez Bridge (foreground) with the 1927 Span (middle)
1962 Benicia-Martinez Bridge (right)
38
Third Quarter 2009 Project Progress and Financial Update
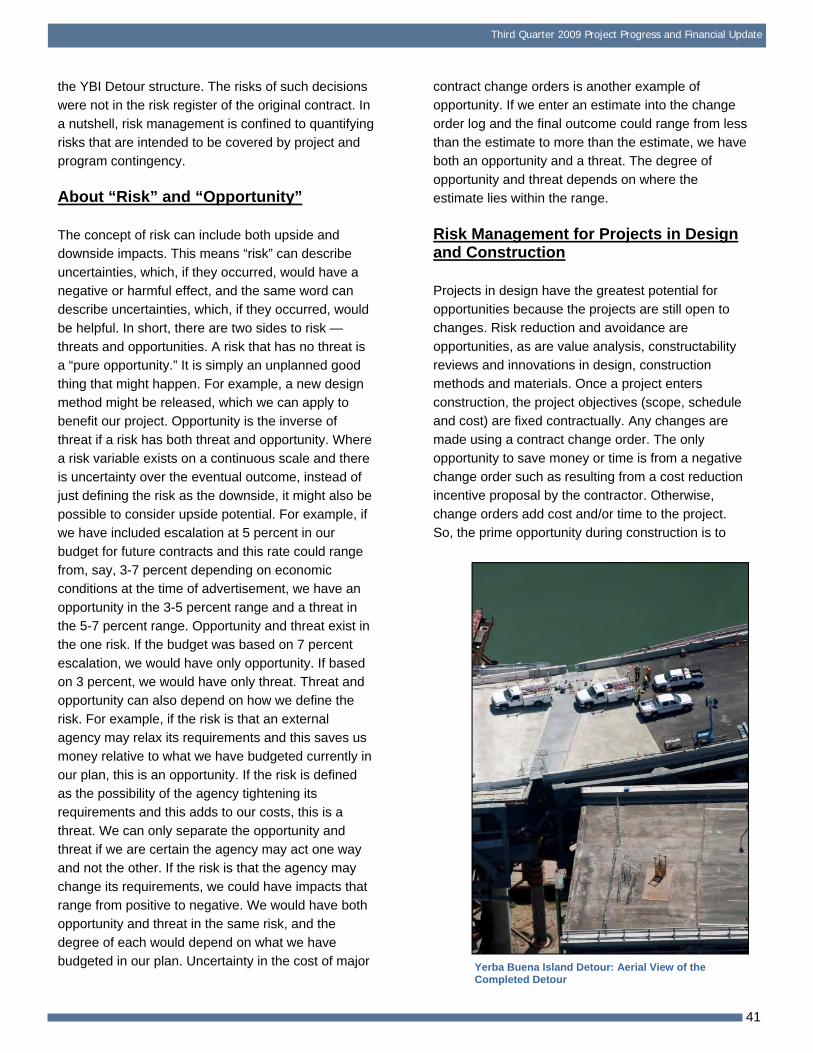
Richmond-San Rafael Bridge Seismic Retrofit Project Project Status: Completed 2005
The Richmond-San Rafael Bridge was retrofitted to a “No Collapse” classification to avoid catastrophic failure during
a major seismic event. The foundations, columns, and truss of the bridge were strengthened, and the entire low-rise approach viaduct from Marin County was replaced.
Richmond-San Rafael Bridge
Los Angeles-Vincent Thomas Bridge Seismic Retrofit Project Project Status: Completed 2000
Los Angeles-Vincent Thomas Bridge
San Diego-Coronado Bridge Seismic Retrofit Project Project Status: Completed 2002
San Diego-Coronado Bridge
39
Toll Bridge Program Oversight Committee
TOLL BRIDGE SEISMIC RETROFIT PROGRAM Risk Management Program Update
Assembly Bill (AB) 144 states that Caltrans must “regularly reassess its reserves for potential claims and
unknown risks, incorporating information related to risks identified and quantified through its risk assessment processes.” AB 144 set a $900 million
Program Reserve (also referred to as the Program Contingency). The Program Contingency is currently at $689.7 million, according to the TBPOC Approved
Budget.
The Risk Management Process
Caltrans’ approved risk management plan provides for
a systemic and continuous process of identifying, analyzing, and responding to project and program risks. Risk management plan implementation provides
for maximizing the probability and consequences of positive events and minimizing the probability and
consequences of adverse events to project objectives (e.g., cost, schedule and quality). Each element of the risk management process is illustrated in the diagram
above and is explained in the following paragraphs. The risk management cyclic process is performed on a quarterly basis and encompasses all identified risks
related to the contracts, program, corridor, capital outlay, capital outlay support, and schedule.
1. Risk Management Planning – deciding how to approach, plan and execute the risk management
activities for the project. 2. Risk Identification – determining which risks might
affect the project and documenting their
characteristics. 3. Qualitative Risk Analysis – prioritizing risks for
subsequent further analysis or action by assessing
and combining their probability and impacts. 4. Quantitative Risk Analysis – analyzing numerically
the effect of identified risks on overall project
objectives. 5. Risk Response Planning – developing options and
actions to enhance opportunities and to reduce
impact to project objectives. 6. Risk Monitoring and Control – tracking identified
risks, monitoring residual risks, identifying new
risks, executing risk response plans, and evaluating their effectiveness throughout the project life cycle.
Although the risk management processes above are presented as discreet elements with well-defined interfaces, in practice they often overlap and interact
with each other.
What Risk Management Does and Does Not Include
Risk management addresses risks that may affect its defined project objectives such as cost, schedule,
scope and quality. Given a project plan, risk management generally looks at ways in which the project may not go according to plan. Risk
management focuses on the defined project scope and objectives, and therefore does not include 1) risks or possible decisions that may effectively end the project,
such as the loss of funding, a natural disaster that destroys all or part of the construction, or acts of governments; or 2) risks or possible decisions that may
materially change the project. If the project objectives are changed substantially, risk management will start afresh on the “new” project. For example, the YBI
Detour contract was significantly changed by the addition of several YBITS #1 project foundations by contract change order as well as certain design
enhancements made to the east and west “tie-ins” of
40
Third Quarter 2009 Project Progress and Financial Update
the YBI Detour structure. The risks of such decisions were not in the risk register of the original contract. In
a nutshell, risk management is confined to quantifying risks that are intended to be covered by project and program contingency.
About “Risk” and “Opportunity”
The concept of risk can include both upside and downside impacts. This means “risk” can describe
uncertainties, which, if they occurred, would have a negative or harmful effect, and the same word can describe uncertainties, which, if they occurred, would
be helpful. In short, there are two sides to risk — threats and opportunities. A risk that has no threat is a “pure opportunity.” It is simply an unplanned good
thing that might happen. For example, a new design method might be released, which we can apply to benefit our project. Opportunity is the inverse of
threat if a risk has both threat and opportunity. Where a risk variable exists on a continuous scale and there is uncertainty over the eventual outcome, instead of
just defining the risk as the downside, it might also be possible to consider upside potential. For example, if we have included escalation at 5 percent in our
budget for future contracts and this rate could range from, say, 3-7 percent depending on economic conditions at the time of advertisement, we have an
opportunity in the 3-5 percent range and a threat in the 5-7 percent range. Opportunity and threat exist in the one risk. If the budget was based on 7 percent
escalation, we would have only opportunity. If based on 3 percent, we would have only threat. Threat and opportunity can also depend on how we define the
risk. For example, if the risk is that an external agency may relax its requirements and this saves us money relative to what we have budgeted currently in
our plan, this is an opportunity. If the risk is defined as the possibility of the agency tightening its requirements and this adds to our costs, this is a
threat. We can only separate the opportunity and threat if we are certain the agency may act one way and not the other. If the risk is that the agency may
change its requirements, we could have impacts that range from positive to negative. We would have both opportunity and threat in the same risk, and the
degree of each would depend on what we have budgeted in our plan. Uncertainty in the cost of major
contract change orders is another example of opportunity. If we enter an estimate into the change
order log and the final outcome could range from less than the estimate to more than the estimate, we have both an opportunity and a threat. The degree of
opportunity and threat depends on where the estimate lies within the range.
Risk Management for Projects in Design and Construction
Projects in design have the greatest potential for opportunities because the projects are still open to changes. Risk reduction and avoidance are
opportunities, as are value analysis, constructability reviews and innovations in design, construction methods and materials. Once a project enters
construction, the project objectives (scope, schedule and cost) are fixed contractually. Any changes are made using a contract change order. The only
opportunity to save money or time is from a negative change order such as resulting from a cost reduction incentive proposal by the contractor. Otherwise,
change orders add cost and/or time to the project. So, the prime opportunity during construction is to
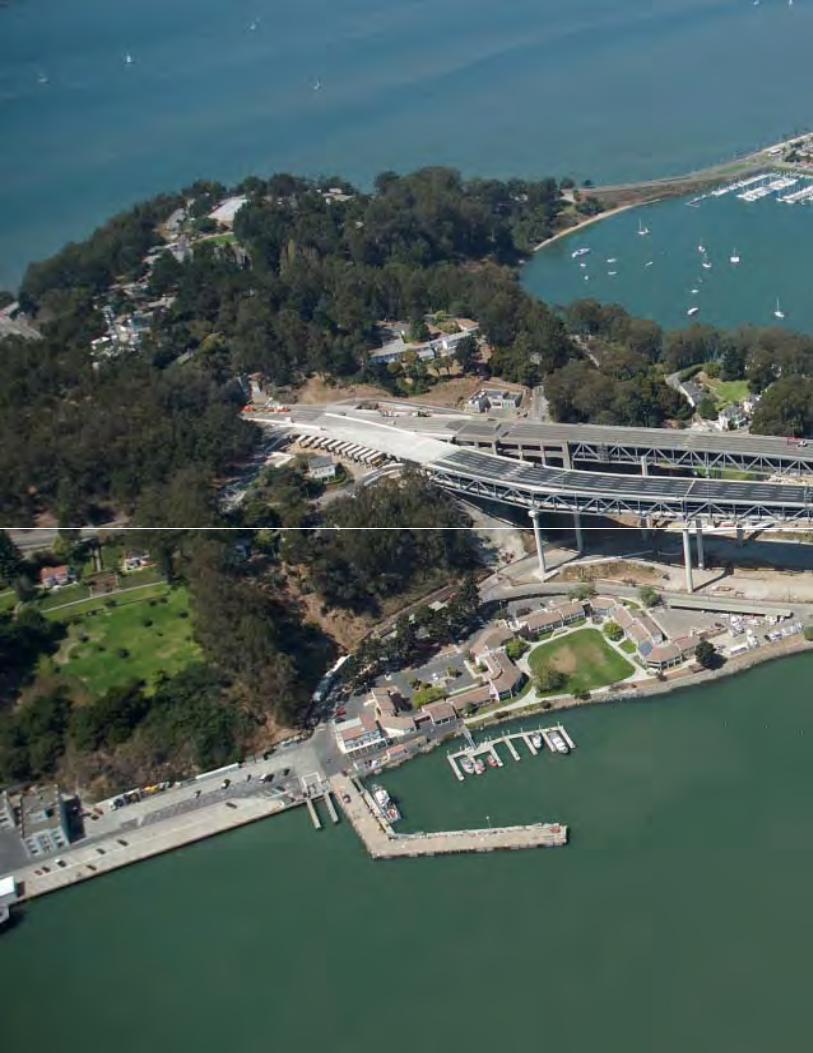
Yerba Buena Island Detour: Aerial View of the Completed Detour
41
Toll Bridge Program Oversight Committee
TOLL BRIDGE SEISMIC RETROFIT PROGRAM
Risk Management Program Update (cont.)
POTENTIAL DRAW ON PROGRAM
RESERVE (PROGRAM CONTINGENCY)
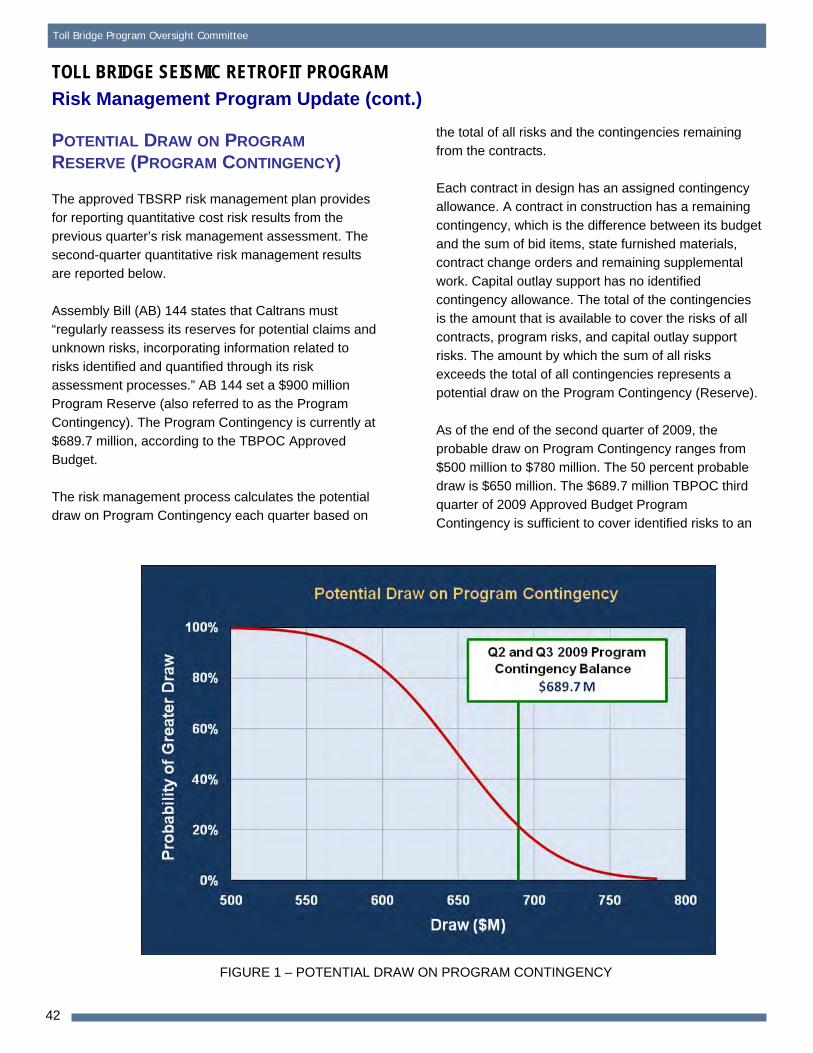
The approved TBSRP risk management plan provides for reporting quantitative cost risk results from the previous quarter’s risk management assessment. The
second-quarter quantitative risk management results are reported below.
Assembly Bill (AB) 144 states that Caltrans must “regularly reassess its reserves for potential claims and unknown risks, incorporating information related to
risks identified and quantified through its risk assessment processes.” AB 144 set a $900 million Program Reserve (also referred to as the Program
Contingency). The Program Contingency is currently at $689.7 million, according to the TBPOC Approved Budget.
The risk management process calculates the potential draw on Program Contingency each quarter based on
the total of all risks and the contingencies remaining from the contracts.
Each contract in design has an assigned contingency allowance. A contract in construction has a remaining
contingency, which is the difference between its budget and the sum of bid items, state furnished materials, contract change orders and remaining supplemental
work. Capital outlay support has no identified contingency allowance. The total of the contingencies is the amount that is available to cover the risks of all
contracts, program risks, and capital outlay support risks. The amount by which the sum of all risks exceeds the total of all contingencies represents a
potential draw on the Program Contingency (Reserve).
As of the end of the second quarter of 2009, the
probable draw on Program Contingency ranges from $500 million to $780 million. The 50 percent probable draw is $650 million. The $689.7 million TBPOC third
quarter of 2009 Approved Budget Program Contingency is sufficient to cover identified risks to an
FIGURE 1 – POTENTIAL DRAW ON PROGRAM CONTINGENCY
42
Third Quarter 2009 Project Progress and Financial Update
80 percent confidence level. Ongoing risk mitigation actions will continue to be developed and implemented
to reduce the potential draw on Program Contingency.
The curve in Figure 1 can be used to directly read off
the probability of exceeding any value of cost. For example, there is about an 80 percent chance the potential draw on Program Contingency (Reserve) will
exceed $610 million, while there is a 20 percent chance it will exceed $689.7 million.
RISK MANAGEMENT DEVELOPMENTS
SAS Contract
The “east end” orthotropic box girder (i.e., Lifts 12 – 14) working drawing process is proving to be significantly more complicated than the other lifts due to super-
elevation transitions, horizontal curves, cable anchorages, hinge diaphragms, and other technical issues. Three-dimensional modeling of the area was
successful in identifying conflicts. The development of working drawings has been extremely complicated and
continues to require a coordinated effort by Caltrans design and construction and the contractor’s shop
fabrication drawing team. Caltrans and the contractor’s cross-functional working drawing campus team, as well as Caltrans management, continues to assess and
implement ways to expedite working drawing reviews. Collocation of Caltrans, designer, and the contractor’s personnel is facilitating the development and approval
of east-end working drawings.
Caltrans and the contractor continue to work together
to develop and implement a joint planning schedule. The schedule is continuously assessed to identify future opportunities and actions to mitigate schedule
risk. Team China continues to work to mitigate deck and tower fabrication challenges reported in the SAS contractor’s latest schedule update. Potential actions
include the implementation of complex “mock-up” construction as well as the assessment of additional shop space, should the opportunity arise. Work could
proceed in multiple shifts to expedite fabrication. The Corridor Schedule Team (CST) continues to assess the SAS and other contract schedules. The CST
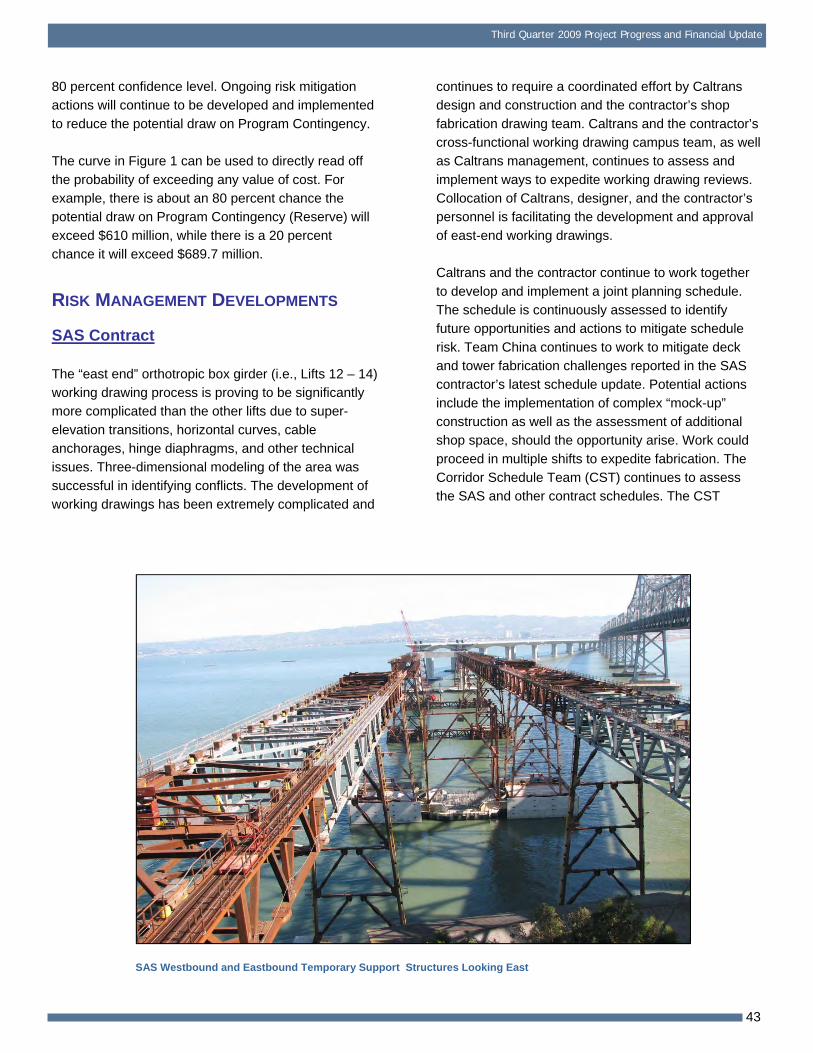
SAS Westbound and Eastbound Temporary Support Structures Looking East
43
Toll Bridge Program Oversight Committee
TOLL BRIDGE SEISMIC RETROFIT PROGRAM
Risk Management Program Update (cont.)
developed an intermediate-level critical path method schedule for the corridor to evaluate schedule risks.
This corridor schedule is a summarization of the contract schedules submitted by the various contractors and schedules developed by the
Department for the contracts in design. During development and updating of the corridor schedule, the CST and risk team incorporated several opportunities
and other assumptions into the SAS schedule. Most of the recovery opportunities are in the construction phase of the SAS contract and allow for re-sequencing
certain work activities to better reflect concurrent work and redefining phase completion requirements. An important aspect of this schedule and of all schedules
for large projects is that there may be multiple critical paths on a project. Focusing on the path that is the most critical, while important, may divert attention from
other near-critical paths. The CST continues to assess risk mitigation strategies and opportunities accordingly.
YBI Detour: Detailed Event Planning for YBI Detour Traffic Switch
Collaborative on-site meetings between Caltrans, the designer, and the contractor continued on-site and at various fabrication facilities. These meetings helped to
resolve various constructability issues that may have caused significant impacts to the planned traffic switch schedule. Caltrans and the contractor performed a
schedule risk analysis for the weekend traffic switch work and concluded that a four-day work window would likely be required to complete the work. The TBPOC
subsequently approved the proposed four-day closure schedule. The traffic switch onto the YBI Detour contract occurred successfully in the third quarter of
2009. A significant portion of the YBI Detour contract risks were reduced or retired after the successful Labor Day weekend work was completed.
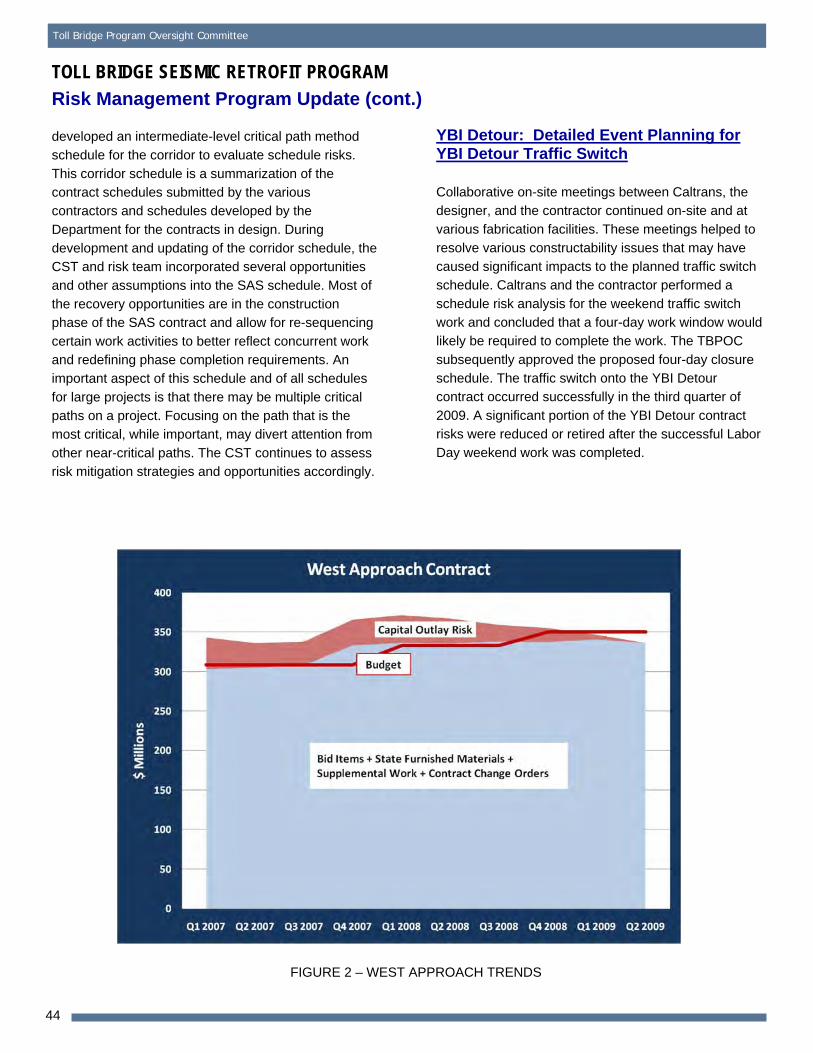
FIGURE 2 – WEST APPROACH TRENDS
44
Third Quarter 2009 Project Progress and Financial Update
West Approach Contract Closeout
The West Approach contract was accepted on April 8, 2009. The project was completed under its current budget, there were no claims outstanding and the final
estimate for the project was run in early July. Caltrans implemented a formal risk assessment process for the West Approach contract early in the contract. As the
trend chart on the preceding page attests, the risk management team effectively forecast a range for the final project cost well in advance of project
completion. This case study on the West Approach contract shows the value of using risk management to assist the project managers with program financial
forecasting.
RISK MANAGEMENT LOOK AHEAD
SAS Contract
Resolution of Fabrication Issues
In the Second Quarter of 2009, Caltrans issued a contract change order to provide initial compensation
for impacts to fabrication of the tower and the OBG Lifts 1 – 11. Caltrans is continuing negotiations in the third quarter of 2009 to resolve the remaining
outstanding issues. A proposed resolution is to be presented to the TBPOC in the next quarter and will address contract time extensions for issues known
prior to a definitive date. Other potential resolutions will include east-end shop drawing development and fabrication. A change order to address preliminary
compensation and incentives to the shop drawing detailers will also be negotiated during the third quarter of 2009. This is considered to be the first of
several steps that will be needed to resolve this issue.
Schedule Partnership
Forecasting shipment dates continues to be a
challenge. With the pace of repairs not matching the pace needed to meet the contract schedule, it is likely that the first shipment will not depart China until late
this year. These delays were recognized in the contractor’s August schedule update, and will likely result in a significant increase in schedule risk costs in
the third quarter of 2009. Project management will
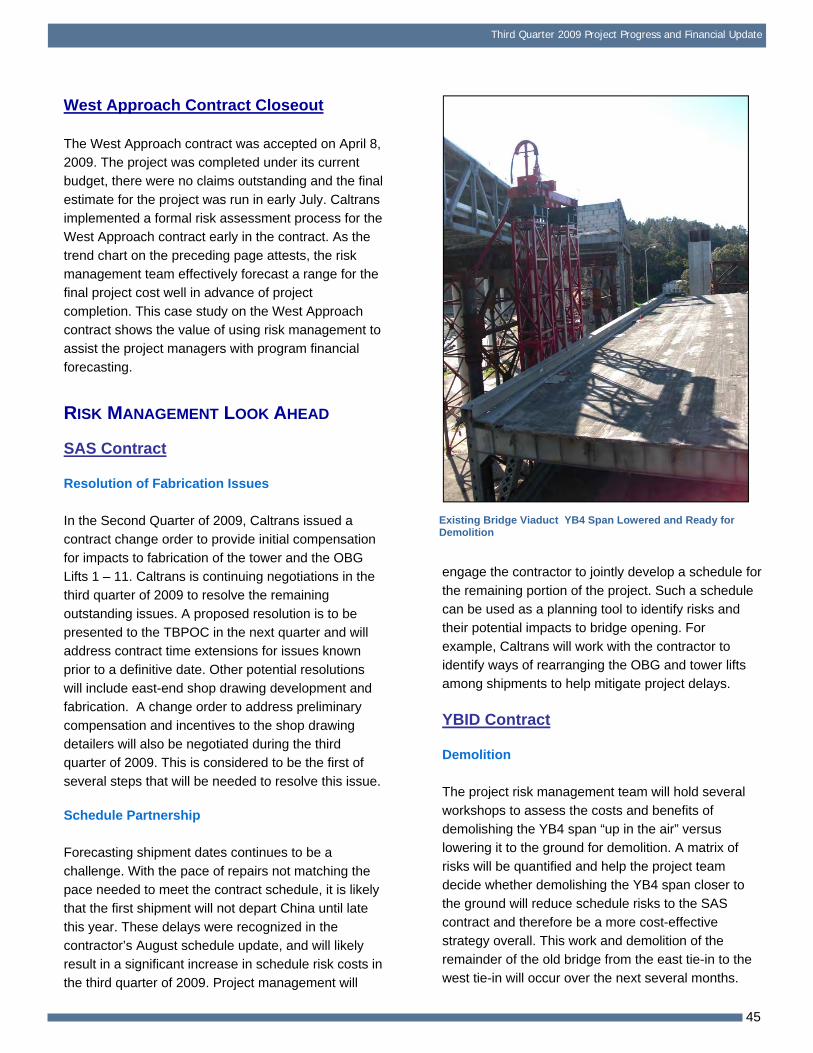
Existing Bridge Viaduct YB4 Span Lowered and Ready for Demolition
engage the contractor to jointly develop a schedule for
the remaining portion of the project. Such a schedule can be used as a planning tool to identify risks and their potential impacts to bridge opening. For
example, Caltrans will work with the contractor to identify ways of rearranging the OBG and tower lifts among shipments to help mitigate project delays.
YBID Contract
Demolition
The project risk management team will hold several
workshops to assess the costs and benefits of demolishing the YB4 span “up in the air” versus lowering it to the ground for demolition. A matrix of
risks will be quantified and help the project team decide whether demolishing the YB4 span closer to the ground will reduce schedule risks to the SAS
contract and therefore be a more cost-effective strategy overall. This work and demolition of the remainder of the old bridge from the east tie-in to the
west tie-in will occur over the next several months.
45
Toll Bridge Program Oversight Committee
TOLL BRIDGE SEISMIC RETROFIT PROGRAM
Risk Management Program Update (cont.)
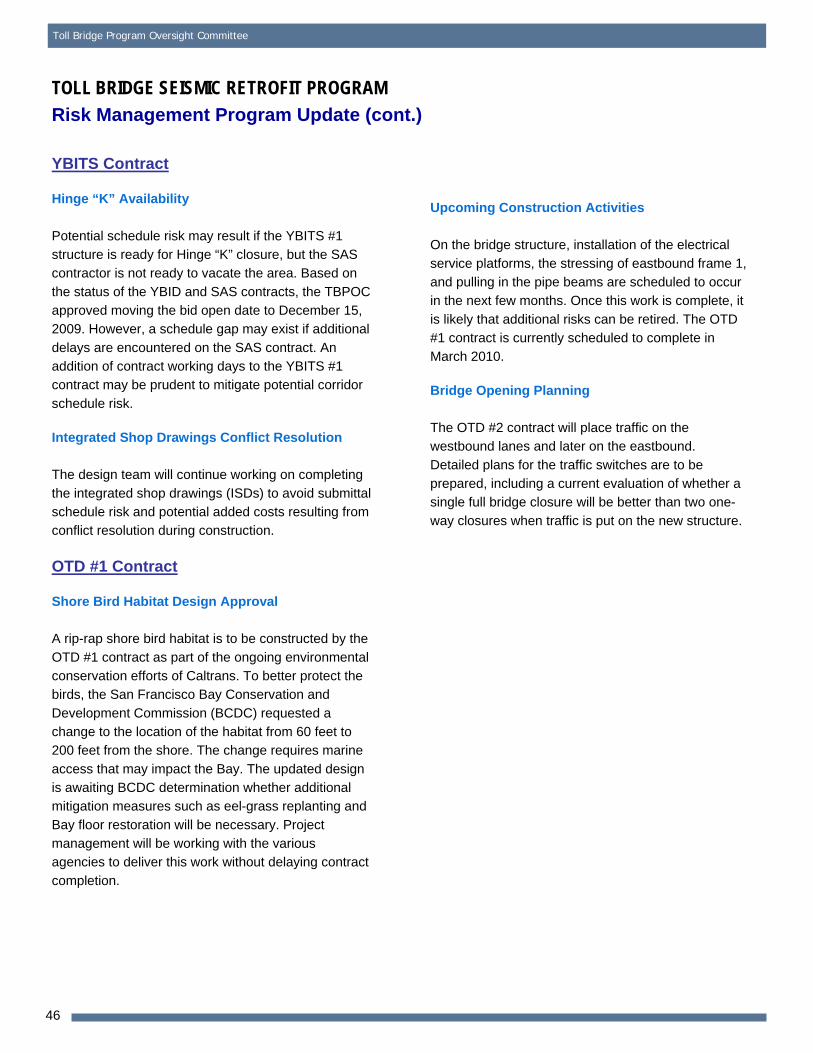
YBITS Contract
Hinge “K” Availability
Potential schedule risk may result if the YBITS #1 structure is ready for Hinge “K” closure, but the SAS contractor is not ready to vacate the area. Based on
the status of the YBID and SAS contracts, the TBPOC approved moving the bid open date to December 15, 2009. However, a schedule gap may exist if additional
delays are encountered on the SAS contract. An addition of contract working days to the YBITS #1 contract may be prudent to mitigate potential corridor
schedule risk.
Integrated Shop Drawings Conflict Resolution
The design team will continue working on completing
the integrated shop drawings (ISDs) to avoid submittal schedule risk and potential added costs resulting from conflict resolution during construction.
OTD #1 Contract
Shore Bird Habitat Design Approval
A rip-rap shore bird habitat is to be constructed by the
OTD #1 contract as part of the ongoing environmental conservation efforts of Caltrans. To better protect the birds, the San Francisco Bay Conservation and
Development Commission (BCDC) requested a change to the location of the habitat from 60 feet to 200 feet from the shore. The change requires marine
access that may impact the Bay. The updated design is awaiting BCDC determination whether additional mitigation measures such as eel-grass replanting and
Bay floor restoration will be necessary. Project management will be working with the various agencies to deliver this work without delaying contract
completion.
Upcoming Construction Activities
On the bridge structure, installation of the electrical
service platforms, the stressing of eastbound frame 1, and pulling in the pipe beams are scheduled to occur in the next few months. Once this work is complete, it
is likely that additional risks can be retired. The OTD #1 contract is currently scheduled to complete in March 2010.
Bridge Opening Planning
The OTD #2 contract will place traffic on the westbound lanes and later on the eastbound.
Detailed plans for the traffic switches are to be prepared, including a current evaluation of whether a single full bridge closure will be better than two one-
way closures when traffic is put on the new structure.
46
Third Quarter 2009 Project Progress and Financial Update
47
Toll Bridge Program Oversight Committee
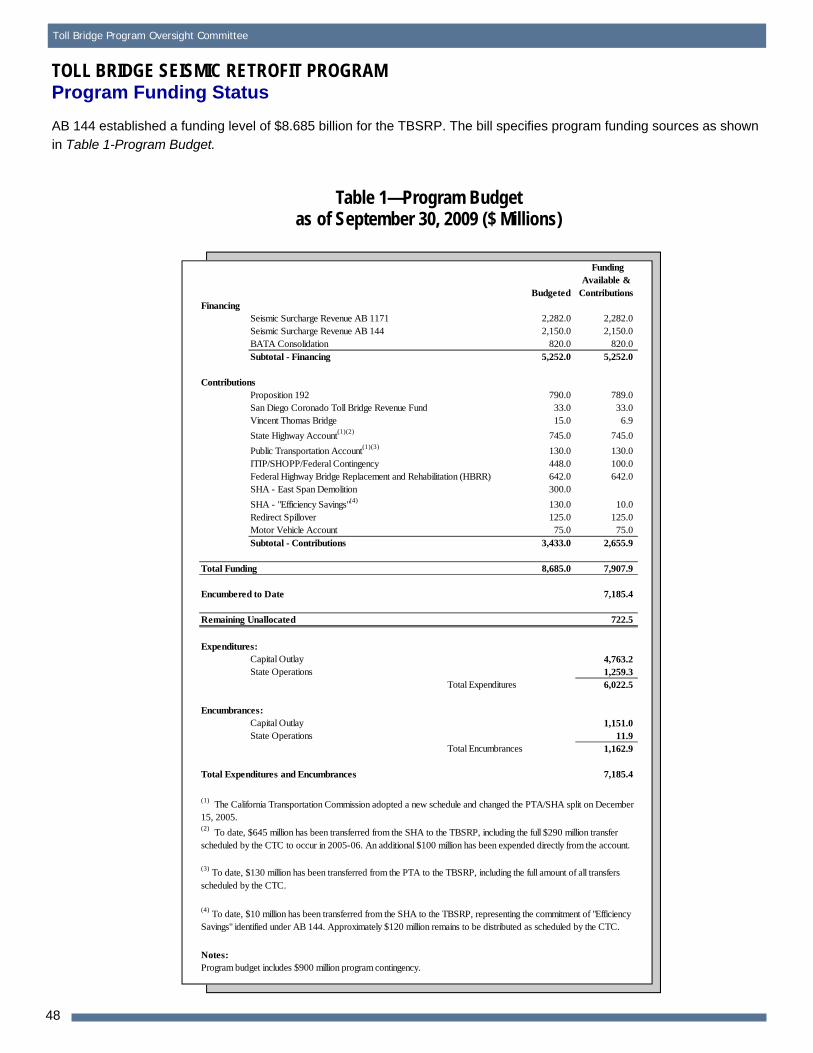
TOLL BRIDGE SEISMIC RETROFIT PROGRAM Program Funding Status
AB 144 established a funding level of $8.685 billion for the TBSRP. The bill specifies program funding sources as shown in Table 1-Program Budget.
Table 1—Program Budget as of September 30, 2009 ($ Millions)
Budgeted
Funding Available &
Contributions Financing
Seismic Surcharge Revenue AB 1171 2,282.0 2,282.0 Seismic Surcharge Revenue AB 144 2,150.0 2,150.0
BATA Consolidation 820.0 820.0 Subtotal - Financing 5,252.0 5,252.0
Contributions Proposition 192 790.0 789.0 San Diego Coronado Toll Bridge Revenue Fund 33.0 33.0 Vincent Thomas Bridge 15.0 6.9
State Highway Account(1)(2) 745.0 745.0
Public Transportation Account(1)(3) 130.0 130.0 ITIP/SHOPP/Federal Contingency 448.0 100.0 Federal Highway Bridge Replacement and Rehabilitation (HBRR) 642.0 642.0 SHA - East Span Demolition 300.0
Expenditures: Capital Outlay 4,763.2 State Operations 1,259.3
Total Expenditures 6,022.5
Encumbrances: Capital Outlay 1,151.0 State Operations 11.9
Total Encumbrances 1,162.9
Total Expenditures and Encumbrances 7,185.4
Notes: Program budget includes $900 million program contingency.
(4) To date, $10 million has been transferred from the SHA to the TBSRP, representing the commitment of "Efficiency Savings" identified under AB 144. Approximately $120 million remains to be distributed as scheduled by the CTC.
(3) To date, $130 million has been transferred from the PTA to the TBSRP, including the full amount of all transfers scheduled by the CTC.
(2) To date, $645 million has been transferred from the SHA to the TBSRP, including the full $290 million transfer scheduled by the CTC to occur in 2005-06. An additional $100 million has been expended directly from the account.
(1) The California Transportation Commission adopted a new schedule and changed the PTA/SHA split on December 15, 2005.
48
Third Quarter 2009 Project Progress and Financial Update
Summary of the Toll Bridge Oversight Committee (TBPOC) Expenses
Pursuant to Streets and Highways Code Section 30952.1 (d), expenses incurred by Caltrans, BATA, and the
California Transportation Commission (CTC) for costs directly related to the duties associated with the TBPOC are to be reimbursed by toll revenues. Table 3-Toll Bridge Program Oversight Committee Estimated Expenses: July 1, 2005 through September 30, 2009 shows expenses through June 30, 2009 for TBPOC functioning,
support, and monthly and quarterly reporting.
Table 2—CTC Toll Bridge Seismic Retrofit Program Contributions Adopted December 2005 Schedule of Contributions to the Toll Bridge Seismic Retrofit Program ($ Millions)
Source Description 2005-06 (Actual)
2006-07 (Actual)
2007-08 (Actual)
2008-09 (Actual)
2009-10 (Actual)
2010-11 2011-12 2012-13 2013-14 Total
AB 1171
SHA 290 290
PTA 80 40 120
Highway Bridge Replacement and Rehabilitation (HBRR )
Table 3—Toll Bridge Program Oversight Committee Estimated Expenses: July 1, 2005 through September 30, 2009
($ Millions)
Agency/Program Activity Expenses
BATA 0.8
Caltrans 1.7
CTC 1.2
Reporting 3.1
Total Program 6.8
49
Sei
smic
Ret
rofi
t o
f th
e D
um
bar
ton
an
d A
nti
och
Bri
dg
es
Dumbarton Bridge
Toll Bridge Program Oversight Committee
SEISMIC RETROFIT OF DUMBARTON AND ANTIOCH BRIDGES
Dumbarton Bridge Seismic Retrofit Project Project Status: In Design
The Dumbarton Bridge was opened to traffic in 1982, linking the cities of Newark in Alameda County and East
Palo Alto in San Mateo County. The 1.6-mile-long bridge carries average daily traffic of nearly 60,000 vehicles over its six lanes and has an eight-foot bicycle/pedestrian lane to
the south.
Though located between the San Andreas and Hayward
faults, the Dumbarton Bridge was not included in the Toll Bridge Seismic Retrofit Program based on evaluations made in the 1990s that concluded the bridge did not
warrant retrofitting. The bridge has since been re-evaluated for seismic vulnerability based on more recent seismic engineering, which has shown the bridge to be susceptible
to damage from a major earthquake. Mock-Up of Dumbarton Pier Columns Undergoing Seismic Testing
Existing Dumbarton Bridge Looking East toward the Alameda County Foothills
52
Third Quarter 2009 Project Progress and Financial Update
Based on the vulnerability studies and a follow-up sensitivity analysis of seismic risk, Caltrans and BATA
decided to take steps towards retrofitting the Dumbarton Bridge, even though full funding for the project has not yet been identified. Using BATA toll
bridge rehabilitation funding, a comprehensive seismic analysis of the bridge has commenced. This includes detailed geotechnical and geophysical investigations at
the bridge and the development of a seismic retrofit strategy and design plans.
The current retrofit strategy for the Dumbarton Bridge includes superstructure and deck modifications, plus strengthening of the over land approach slab
structures. Additional activities are identified in the attached diagram. The results of the seismic analysis and proposed retrofit strategy have been presented to
the Toll Bridge Seismic Safety Peer Review Panel.
Status: On October 11, 2009, Governor Schwarzenegger approved Assembly Bill 1175 that
added the Dumbarton and Antioch Bridges to the Toll Bridge Seismic Retrofit Program. BATA has now initiated efforts to raise tolls on the seven state-owned
toll bridges in the Bay Area to, in part, fund the seismic retrofit of the Dumbarton and Antioch bridges.
BATA has already funded design plans for both bridge projects in anticipation of the projects being advertised in early 2010. The total estimated cost of these retrofits
has been recently revised from $950 million to $750 million as project plans have been refined with reduced scope, which has minimized cost risks. In the future,
the project progress report will be updated to better reflect the incorporation of these two projects into the Toll Bridge Seismic Retrofit Program.
Seismic Retrofit Strategy Summary for Dumbarton Bridge
53
Toll Bridge Program Oversight Committee
SEISMIC RETROFIT OF DUMBARTON AND ANTIOCH BRIDGES
Antioch Bridge Seismic Retrofit Project Project Status: In Design
Serving the Delta region of the Bay Area, the Antioch Bridge takes State Route 160 traffic over the San
Joaquin River, linking eastern Contra Costa County with Sacramento County. The current bridge was opened in 1978 with one lane in each direction and
carries an average of more than 10,000 vehicles a day. Approximately 1.8 miles long, the bridge is a steel girder support roadway on reinforced concrete columns
and foundations.
Like the Dumbarton Bridge, the Antioch bridge was not
included in the Toll Bridge Seismic Retrofit Program based on evaluations made in the 1990s that concluded that the bridge did not warrant retrofitting.
The Antioch Bridge has since been re-evaluated for seismic vulnerability based on more recent seismic engineering, which has shown the bridge to be
susceptible to damage from a major earthquake.
Based on the vulnerability studies and a follow-up sensitivity analysis of seismic risk, Caltrans and BATA
decided to take steps toward retrofitting the Antioch Bridge, even though full funding for the project has not yet been identified. Using BATA toll bridge
rehabilitation funding, a comprehensive seismic analysis of the bridge has commenced. This analysis includes detailed geotechnical and geophysical
investigation at the bridge and the development of a seismic retrofit strategy and design plans.
The current retrofit strategy for the Antioch Bridge includes relatively minor modifications to the approach structure on Sherman Island, the addition of isolation
bearings, strengthening of the columns, and hinge retrofits. The results of the seismic analysis and proposed retrofit strategy have been presented to the
Toll Bridge Seismic Safety Peer Review Panel.
Antioch Bridge
54
Third Quarter 2009 Project Progress and Financial Update
Status: On October 11, 2009, Governor Schwarzenegger approved Assembly Bill 1175 that
added the Dumbarton and Antioch Bridges to the Toll Bridge Seismic Retrofit Program. BATA has now initiated efforts to raise tolls on the seven state-owned toll bridges
in the Bay Area to, in part, fund the seismic retrofit of the Dumbarton and Antioch bridges.
BATA has already funded design plans for both bridge projects in anticipation of the projects being advertised in early 2010. The total estimated cost of these retrofits has
been recently revised from $950 million to $750 million as project plans have been refined with reduced scope, which has minimized cost risks. In the future, the project
progress report will be updated to better reflect the incorporation of these two projects into the Toll Bridge Seismic Retrofit Program. Prototype of Bearing for the Antioch Bridge Seismic Retrofit
Project
Seismic Retrofit Strategy Summary for Antioch Bridge
55
Toll Bridge Program Oversight Committee
Seismic Retrofits of Dumbarton and Antioch Bridges
Project Cost and Schedule Summaries
56
Third Quarter 2009 Project Progress and Financial Update
57
Dumbarton Bridge
-
RE
GIO
NA
L M
EA
SU
RE
1 T
OL
L B
RID
GE
PR
OG
RA
M
Benicia Martinez Bridge
Toll Bridge Program Oversight Committee
REGIONAL MEASURE 1 PROGRAM
New Benicia-Martinez Bridge Project Project Status: New Bridge Completed 2007
The new Congressman George Miller Bridge opened to traffic in August 2007, taking its place alongside the
existing 1962 Benicia-Martinez Bridge, which is named for Congressman Miller’s father, the late George Miller, Jr. The new bridge carries five lanes of
northbound Interstate 680 traffic, while the existing bridge is being upgraded to carry four lanes of southbound traffic and a new bicycle/pedestrian
pathway.
Decades into the planning and construction, the new
bridge is designed to a “Lifeline” seismic design standard, expected to be available for emergency response vehicles soon after a major seismic event.
Constructed of lightweight concrete, the structure is one of the longest post-tensioned reinforced cast-inplace concrete bridges in the world. The new toll
plaza, relocated from Benicia to Martinez, features the Bay Area’s first FasTrak® express lanes, which vastly increase the throughput of vehicles using electronic
toll collection.
1962 Benicia-Martinez Bridge Reconstruction Contract Contractor: ACC/Top Grade, Joint Venture Approved Capital Outlay Budget: $59.5 M Status: Substantially Complete
A two-year project to rehabilitate and reconfigure the original Benicia-Martinez Bridge began shortly after
the opening of the new Congressman George Miller Bridge. The existing 1.2-mile roadway surface on the steel deck truss bridge is being modified to carry
four lanes of southbound traffic (one more than before)—with shoulders on both sides—plus a bicycle/pedestrian path on the west side of the span
that will connect to Park Road in Benicia and to Marina Vista Boulevard in Martinez.
Stage 1 – Reconstruction of East Side of Bridge and Approaches
Completed in August 2008, this stage involved
removal of the old toll plaza on the Benicia side of the bridge, deck repairs on the east side of the span, and repair of the roadway undulations on the
southern approach just south of the Marina Vista interchange.
New Benicia-Martinez Bridge Opened to Traffic in August 2007
Mococo Road Bridge Jacking
60
Third Quarter 2009 Project Progress and Financial Update
Stage 2 – Reconstruction of West Side of Bridge and Approaches and Construction of Bicycle/Pedestrian Pathway
This stage began after southbound traffic was shifted from the west side of the bridge to the newly refurbished east
side. It involves repairing the west-side bridge deck, repairing undulations on the west side of the roadway in Martinez, demolishing obsolete I-680/I-780 interchange
structures, realigning southbound Interstate 680 for four lanes, and construction of the barrier separating traffic lanes from the bicycle/pedestrian path.
Status: A new southbound I-680 was opened to traffic in early August. The new bicycle/pedestrian path opened on
August 29. The contract is now substantially complete. Benicia-Martinez Bridge Newly Opened Pedestrian/Bicycle Pathway
Benicia-Martinez Bridge Pedestrian/Bicycle Pathway Opened to The Public
61
Toll Bridge Program Oversight Committee
REGIONAL MEASURE 1 PROGRAM
Interstate 880/State Route 92 Interchange Reconstruction Project Project Status: Under Construction
The Interstate 880/State Route 92 Interchange Reconstruction Project is the final project under the Regional
Measure 1 Toll Bridge Program. Project completion fulfills a promise made to Bay Area voters in 1988 to deliver a slate of projects that help expand bridge capacity and improve safety on the bridges.
This corridor is consistently one of the Bay Area’s most congested during the evening commute. This is due in part to the lane merging
and weaving that is required by the existing cloverleaf interchange. The new interchange will feature direct freeway-to-freeway connector ramps that will increase traffic capacity and improve
overall safety and traffic operations in the area. With the new direct-connector ramps, drivers coming off the San Mateo-Hayward Bridge can access Interstate 880 without having to compete with
traffic headed onto east Route 92 from south Interstate 880 (see progress photos on pages 86 and 87).
Future Interstate 880/State Route 92 Interchange (as simulated) ,Looking West toward San Mateo.
Interstate 880/State Route 92 Interchange Reconstruction Contract Contractor: Flatiron/Granite Approved Capital Outlay Budget: $155.0 M Status: 52% Complete
Overview of Progress to Date
Bents 2, 3 and 4 of the I-880/SR92 Interchange New Separation Bridge
62
Third Quarter 2009 Project Progress and Financial Update
Stage 1 – Construct East Route 92 to North Interstate 880 Connector
The new east Route 92 to north Interstate 880 connector (ENCONN) is the most critical flyover structure for relieving
congestion in the corridor. The ENCONN will be first used as a detour to allow for future stages of work, while keeping traffic flowing.
Status: ENCONN was completed and opened to detour traffic on May 16, 2009.
Stage 2 – Replace South Side of Route 92 Separation Structure
By detouring eastbound Route 92 traffic onto ENCONN, the existing separation structure that carries SR92 over I-880
can be replaced. The existing structure will be cut lengthwise, and then demolished and replaced separately. In this stage, the south side of the structure will be
replaced, while west Route 92 and south-Interstate-880-to- east-Route-92 traffic will stay on the remaining structure.
Status: Work on the south side of the separation structure
has begun. Foundations and columns have been installed.
Stage 3 – Replace North Side of Route 92 Separation Structure
Upon completion of Stage 2, the existing north side of the separation structure will be demolished and replaced. Its
traffic will then be shifted onto the newly reconstructed south side.
Status: Pending Stage 2.
Stage 4 – Final Realignment and Other Work
Upon completion of the Route 92 separation structure, east Route 92 traffic can be shifted onto its permanent
alignment from the new ENCONN and directly under the new separation structure. Along with the ENCONN and Route 92 separation structures, several soundwalls, a
pedestrian overcrossing on I-880 at Eldridge Avenue and other ramps and structures will also be reconstructed as part of this project.
Status: Work continues on walls in the northwest (Stage 2), southeast and northeast quadrants, as well as on the Eldridge Ave. pedestrian overcrossing. The new pump
station is ongoing and scheduled to be completed in February 2010. The Calaroga Bridge is 50 percent complete.
Stage 1 - Construct East Route 92 to North Interstate 880 Direct Connector
Stage 2 - Demolish and Replace South Side of Route 92 Separation Structure
Stage 3 - Demolish and Replace North Side of Route 92 Separation Structure
Stage 4 - Final Realignment and Other Work
63
Toll Bridge Program Oversight Committee
REGIONAL MEASURE 1 PROGRAM
Other Completed Projects
San Mateo-Hayward Bridge-Widening Project Project Status: Completed 2003
Widening of the San Mateo-Hayward Bridge Trestle on Left
This project expanded the low-rise concrete trestle section of the San Mateo-Hayward Bridge to allow for
three lanes in each direction to match the existing configuration of the high-rise steel section of the bridge.
Richmond-San Rafael Bridge Rehabilitation Projects Project Status: Completed 2006
Two major rehabilitation projects for the Richmond-San Rafael Bridge were funded and completed:
(1) replacement of the western concrete approach trestle and ship-collision protection fender system; and (2) rehabilitation of deck joints and resurfacing of the
bridge deck.
In 2005, along with the seismic retrofit of the bridge, the
trestle and fender replacement work was completed as part of the same project. Under a separate contract in 2006, the bridge was resurfaced with a polyester
concrete overlay along with the repair of numerous deck joints.
New Richmond-San Rafael Bridge West Approach Trestle under Construction
Richmond Parkway Construction Project Project Status: Completed 2001
The final connections to the Richmond Parkway from Interstate 580 near the Richmond-San Rafael Bridge were
completed in May 2001.
64
Third Quarter 2009 Project Progress and Financial Update
New Alfred Zampa Memorial (Carquinez) Bridge Soon after Opening to Traffic, with Crockett Interchange Still under Construction
New Alfred Zampa Memorial (Carquinez) Bridge Project Project Status: Completed 2003 The new western span of the Carquinez Bridge, which replaced the original 1927 span, is a twin-towered
suspension bridge with three mixed-flow lanes, a new carpool lane, shoulders and a bicycle and pedestrian pathway.
This project expanded and improved the roadway from the Dumbarton Bridge touchdown to the US 101/Marsh Road
interchange by adding additional lanes and turn pockets and improving bicycle and pedestrian access in the area.
65
Toll Bridge Program Oversight Committee
66
- - Aerial View of the Existing Bridge and Completed Roll Out/Roll In
Third Quarter 2009 Project Progress and Financial Update
67
APPENDICES
A. TBSRP AB 144/SB 66 Baseline Budget, Forecasts and Expenditures through September 30, 2009 (A-1 and A-2)…………… 68
B. TBSRP (SFOBB East Span Only) AB 144/SB 66 Baseline Budget, Forecasts and Expenditures through September 30, 2009 ……………...….…….…..70
C. Regional Measure 1 Program Cost Detail………………..…….…..….72
D. Yerba Buena Island Transition Structures (YBITS) Advanced Work Project Progress Diagram……………………..……75
E. Oakland Touchdown (OTD) #1 Program Diagram……………………...…………76
F. Project Photos…….……………………………...77
G. Glossary of Terms…………..…………………...88
Toll Bridge Program Oversight Committee
Appendix A-1: TBSRP AB 144/SB 66 Baseline Budget, Forecasts and Expenditures through September 30, 2009 ($ Millions)
Current AB 144 / SB Approved Cost 66 Budget Approved Budget Cost To Date Forecast At-Completion
Contract (07/2005) Changes (09/2009) (09/2009) (09/2009) Variance a c d e = c + d f g h = g - e
SFOBB East Span Replacement Project Capital Outlay Support 959.3 - 959.3 771.9 1,203.1 243.8 Capital Outlay Construction 4,492.2 269.4 4,761.6 3,067.9 5,041.1 279.5 Other Budgeted Capital 35.1 (3.3) 31.8 0.7 7.7 (24.1)
Total 5,486.6 266.1 5,752.7 3,840.5 6,251.9 499.2 SFOBB West Approach Replacement
Capital Outlay Support 120.0 - 120.0 116.6 117.0 (3.0) Capital Outlay Construction 309.0 41.7 350.7 328.1 338.1 (12.6)
Total 429.0 41.7 470.7 444.7 455.1 (15.6) SFOBB West Span Retrofit -
Capital Outlay Support 75.0 - 75.0 74.8 75.0 -Capital Outlay Construction 232.9 - 232.9 227.2 232.9 -
Total 307.9 - 307.9 302.0 307.9 -Richmond-San Rafael Bridge Retrofit
Capital Outlay Support 134.0 (7.0) 127.0 126.7 127.0 -Capital Outlay Construction 780.0 (90.5) 689.5 667.5 689.5 -
Total 914.0 (97.5) 816.5 794.2 816.5 -Benicia-Martinez Bridge Retrofit -
Capital Outlay Support 38.1 - 38.1 38.1 38.1 -Capital Outlay Construction 139.7 - 139.7 139.7 139.7 -
Total 177.8 - 177.8 177.8 177.8 -Carquinez Bridge Retrofit
Capital Outlay Support 28.7 - 28.7 28.8 28.7 -Capital Outlay Construction 85.5 - 85.5 85.4 85.5 -
Capital Outlay Support 28.1 - 28.1 28.1 28.1 -Capital Outlay Construction 135.4 - 135.4 135.3 135.4 -
Total 163.5 - 163.5 163.4 163.5 -Vincent Thomas Bridge Retrofit (Los Angeles)
Capital Outlay Support 16.4 - 16.4 16.4 16.4 -Capital Outlay Construction 42.1 - 42.1 42.0 42.1 -
Total 58.5 - 58.5 58.4 58.5 -San Diego-Coronado Bridge Retrofit
Capital Outlay Support 33.5 - 33.5 33.2 33.5 -Capital Outlay Construction 70.0 - 70.0 69.4 70.0 -
Total 103.5 - 103.5 102.6 103.5 -
Subtotal Capital Outlay Support 1,433.1 (7.0) 1,426.1 1,234.6 1,666.9 240.8 Subtotal Capital Outlay 6,286.8 220.6 6,507.4 4,762.5 6,774.3 266.9 Subtotal Other Budgeted Capital 35.1 (3.3) 31.8 0.7 7.7 (24.1) Miscellaneous Program Costs 30.0 - 30.0 24.7 30.0 -Subtotal Toll Bridge Seismic Retrofit Program 7,785.0 210.3 7,995.3 6,022.5 8,478.9 483.6 Programatic Risk - - - - 165.4 165.4 Program Contingency 900.0 (210.3) 689.7 - 40.7 (649.0)
Total Toll Bridge Seismic Retrofit Program 8,685.0 - 8,685.0 6,022.5 8,685.0 -
Note: Details may not sum to totals due to rounding effects.
68
Third Quarter 2009 Project Progress and Financial Update
Appendix A-2: TBSRP AB 144/SB 66 Baseline Budget, Forecasts and Expenditures through September 30, 2009 ($ Millions)
Expenditures to date and Encumbrances Estimated Costs not yet
AB 144 Baseline TBPOC Current as of Sep 2009 Spent or Encumbered Total Forecast Bridge Budget Approved Budget See Note (1) as of Sep 2009 as of Sep 2009
a b c d e f = d + e Other Completed Projects
Capital Outlay Support 144.9 144.9 144.6 0.3 144.9 Capital Outlay 472.6 472.6 472.6 0.1 472.7 Total 617.5 617.5 617.2 0.4 617.6
Richmond-San Rafael Capital Outlay Support 134.0 127.0 126.7 0.3 127.0 Capital Outlay 698.0 689.5 674.2 15.3 689.5 Project Reserves 82.0 - - - -Total 914.0 816.5 800.9 15.6 816.5
West Span Retrofit Capital Outlay Support 75.0 75.0 74.8 0.2 75.0 Capital Outlay 232.9 232.9 232.7 0.2 232.9 Total 307.9 307.9 307.5 0.4 307.9
West Approach Capital Outlay Support 120.0 120.0 117.3 (0.3) 117.0 Capital Outlay 309.0 350.7 342.5 (4.4) 338.1 Total 429.0 470.7 459.8 (4.7) 455.1
SFOBB East Span -Skyway Capital Outlay Support 197.0 181.0 181.2 (0.1) 181.1 Capital Outlay 1,293.0 1,254.1 1,412.1 (158.0) 1,254.1 Total 1,490.0 1,435.1 1,593.3 (158.1) 1,435.2
SFOBB East Span -SAS- Superstructure Capital Outlay Support 214.6 214.6 186.3 226.6 412.9 Capital Outlay 1,753.7 1,753.7 1,649.7 364.4 2,014.1 Total 1,968.3 1,968.3 1,836.0 591.0 2,427.0
SFOBB East Span -SAS- Foundations Capital Outlay Support 62.5 41.0 37.6 1.0 38.6 Capital Outlay 339.9 307.3 308.7 (1.4) 307.3 Total 402.4 348.3 346.3 (0.4) 345.9
Small YBI Projects Capital Outlay Support 10.6 10.6 10.1 0.5 10.6 Capital Outlay 15.6 15.6 16.6 (0.9) 15.7 Total 26.2 26.2 26.7 (0.4) 26.3
YBI Detour Capital Outlay Support 29.5 66.0 75.0 10.5 85.5 Capital Outlay 131.9 492.8 493.0 11.0 504.0 Total 161.4 558.8 568.0 21.5 589.5
YBI - Transition Structures Capital Outlay Support 78.7 78.7 16.4 89.1 105.5 Capital Outlay 299.4 276.1 0.1 285.8 285.9 Total 378.1 354.8 16.5 374.9 391.4
Oakland Touchdown Capital Outlay Support 74.4 74.4 67.1 28.2 95.3 Capital Outlay 283.8 283.8 218.0 71.0 289.0 Total 358.2 358.2 285.1 99.2 384.3
East Span Other Small Project Capital Outlay Support 212.3 213.3 208.3 5.2 213.5 Capital Outlay 170.8 170.8 94.0 52.6 146.6 Total 383.1 384.1 302.3 57.8 360.1
Existing Bridge Demolition Capital Outlay Support 79.7 79.7 0.4 59.6 60.0 Capital Outlay 239.2 239.2 - 232.1 232.1 Total 318.9 318.9 0.4 291.7 292.1
Miscellaneous Program Costs 30.0 30.0 25.4 4.6 30.0 Total Capital Outlay Support (2) 1,463.2 1,456.2 1,271.2 425.7 1,696.9 Total Capital Outlay 6,321.8 6,539.1 5,914.2 867.8 6,782.0 Program Total 7,785.0 7,995.3 7,185.4 1,293.5 8,478.9
(1). Funds allocated to project or contract for Capital Outlay and Support needs includes Capital Outlay Support total allocation for FY 06/07.
(2). BSA prov ided a distribution of program contingency in December 2004 based on Bechtel Infrastructure Corporation input.
This column is subject to rev ision upon completion of Department's risk assessment update.
(3). Total Capital Outlay Support includes program indirect costs.
Notes: * Budget for Richmond-San Rafael Bridge includes $16.9 million of deck joint rehabilitation work that is considered to be eligible for seismic retrofit program funding.
Note: Details may not sum to totals due to rounding effects.
69
Toll Bridge Program Oversight Committee
Appendix B: TBSRP (SFOBB East Span Only) AB 144/SB 66 Baseline Budget, Forecasts and Expenditures through September 30, 2009 ($ Millions)
Current AB 144 / SB Approved Cost To Cost At-
EA 66 Budget Approved Budget Date Forecast Completion Contract Number (07/2005) Changes (09/2009) (09/2009) (09/2009) Variance
a b c d e = c + d f g h = g - e
San Francisco-Oakland Bay Bridge East Span Replacement Project
East Span - Skyway 01202X Capital Outlay Support 197.0 (16.0) 181.0 181.1 181.1 0.1 Capital Outlay Construction 1,293.0 (38.9) 1,254.1 1,236.9 1,254.1 -
Total 1,490.0 (54.9) 1,435.1 1,418.0 1,435.2 0.1 East Span - SAS E2/T1 Foundations 0120EX -
Capital Outlay Support 52.5 (21.5) 31.0 28.4 28.6 (2.4) Capital Outlay Construction 313.5 (32.6) 280.9 275.0 280.9 -
Total 366.0 (54.1) 311.9 303.4 309.5 (2.4) East Span - SAS Superstructure 0120FX
Capital Outlay Support 214.6 - 214.6 180.5 412.9 198.3 Capital Outlay Construction 1,753.7 - 1,753.7 821.5 2,014.1 260.4
Total 1,968.3 - 1,968.3 1,002.0 2,427.0 458.7 SAS W2 Foundations 0120CX
Capital Outlay Support 10.0 - 10.0 9.2 10.0 -Capital Outlay Construction 26.4 - 26.4 25.8 26.4 -
Total 36.4 - 36.4 35.0 36.4 -YBI South/South Detour 0120RX
Capital Outlay Support 29.4 36.6 66.0 72.5 85.5 19.5 Capital Outlay Construction 132.0 360.8 492.8 384.2 504.0 11.2
Total 161.4 397.4 558.8 456.7 589.5 30.7 YBI Transition Structures (see notes below) 0120PX
Capital Outlay Support 78.7 - 78.7 26.9 105.5 26.8 Capital Outlay Construction 299.3 (23.2) 276.1 - 285.9 9.8
I-680/Marina Vista Interchange Reconstruction 00605_ Capital Outlay Support 18.3 1.8 20.1 20.1 20.1 -Capital Outlay Construction 51.5 4.9 56.4 56.1 56.4 -
Total 69.8 6.7 76.5 76.2 76.5 -
New Toll Plaza and Administration Building 00604_ Capital Outlay Support 11.9 3.8 15.7 15.7 15.7 -Capital Outlay Construction 24.3 2.0 26.3 25.1 26.3 -
Total 36.2 5.8 42.0 40.8 42.0 -
Existing Bridge & Interchange Modifications 0060A_ Capital Outlay Support
EA Budget Approved Budget Date Forecast Completion Project
a Number
b (07/2005)
c Changes
d (09/2009)e = c + d
(09/2009)f
(09/2009)g
Variance h = g - e
Richmond-San Rafael Bridge Trestle, Fender, and Deck Joint Rehabilitation Capital Outlay Support
BATA Funding Non-BATA Funding
Subtotal Capital Outlay Construction
BATA Funding Non-BATA Funding
Subtotal Project Reserves
Total
g y Rehabilitation
Capital Outlay Support BATA Funding Non-BATA Funding
Subtotal Capital Outlay Construction Project Reserves
Total Richmond Parkway Project (RM 1 Share Only)
Capital Outlay Support Capital Outlay Construction
Total San Mateo-Hayward Bridge Widening
Capital Outlay Support Capital Outlay Construction Capital Outlay Right-of-Way Project Reserves
Total I-880/SR-92 Interchange Reconstruction
Capital Outlay Support Capital Outlay Construction
BATA Funding Non-BATA Funding
Subtotal Capital Outlay Right-of-Way Project Reserves
Total Bayfront Expressway Widening
Capital Outlay Support Capital Outlay Construction Capital Outlay Right-of-Way Project Reserves
Total US 101/University Avenue Interchange Modification
Capital Outlay Support Capital Outlay Construction Total
Subtotal BATA Capital Outlay Support Subtotal BATA Capital Outlay Construction Subtotal Capital Outlay Right-of-Way Subtotal Non-BATA Capital Outlay Support Subtotal Non-BATA Capital Outlay Construction Project Reserves
Total RM1 Program
Notes:
04152_
Non-Caltrans
See note 2 below
2.2 8.6
10.8
40.2 51.1 91.3
-102.1
4.0 4.0 8.0
16.9 0.1
25.0
-5.9 5.9
34.6 180.2
1.5 1.5
217.8
See note 1 below
EA's 23317_, 01601_, and 01602_ 28.8
85.2 9.6
94.8 9.9 0.3
(0.8) 1.8 1.0
(6.8) -
(6.8) 0.8
(5.0)
(0.7) (4.0) (4.7) (0.6) 0.3
(5.0)
---
(0.5) (6.1) (0.9) (0.5) (8.0)
34.6
60.2 -
60.2 7.0 9.4
133.8 111.2 EA's 00487_, 01511_, and 01512_
8.6 (0.2) 26.5 (1.5)
0.2 -0.8 (0.3)
36.1 (2.0) Non-Caltrans
3.8 -3.8 -
358.3 61.6 1,569.8 209.3
42.5 5.9 14.0 4.0 92.4 9.5 35.6 3.5
2,112.6 293.8
1.4 10.4 11.8
33.4 51.1 84.5
0.8 97.1
3.3 -
3.3 16.3
0.4 20.0
-5.9 5.9
34.1 174.1
0.6 1.0
209.8
63.4
145.4 9.6
155.0 16.9
9.7 245.0
8.4 25.0
0.2 0.5
34.1
-3.8 3.8
419.9 1,779.1
48.4 18.0
101.9 39.1
2,406.4
1.4 1.4 -10.4 10.4 -11.8 11.8 -
33.3 33.4 -51.1 51.1 -84.4 84.5 -
- 0.8 -96.2 97.1 -
3.3 3.3 -- - -
3.3 3.3 -16.3 16.3 -
- 0.4 -19.6 20.0 -
- - -4.3 5.9 -4.3 5.9 -
34.1 34.1 -174.1 174.1 -
0.5 0.6 -- 1.0 -
208.7 209.8 -
49.6 63.4 -
77.3 145.4 -- 9.6 -
77.3 155.0 -11.7 16.9 -
- 9.7 -138.6 245.0 -
8.3 8.4 -24.9 25.0 -
0.2 0.2 -- 0.5 -
33.4 34.1 -
- - -3.7 3.8 -3.7 3.8 -
404.2 419.9 -1,676.1 1,779.1 -
39.3 48.4 -17.6 18.0 -82.9 101.9 -
- 39.1 -2,220.1 2,406.4 -
1 Richmond-San Rafael Bridge Trestle, Fender, and Deck Joint Rehabilitation Includes Non-TBSRA Expenses for EA 0438U_ and 04157_
2 San Mateo-Hayward Bridge Widening Includes EA's 00305_, 04501_, 04502_, 04503_, 04504_, 04505_, 04506_, 04507_, 04508_, 04509_, 27740_, 27790_, 04860_
Note: Details may not sum to totals due to rounding effects.
74
Third Quarter 2009 Project Progress and Financial Update
Appendix D: YBITS Advanced Work Project Progress Diagram
75
Toll Bridge Program Oversight Committee
Appendix E: OTD #1 Program Diagram
76
Third Quarter 2009 Project Progress and Financial Update
Appendix F: Project Progress Photographs
Aerial View of the West Span of the San Francisco-Oakland Bay Bridge 77
Toll Bridge Program Oversight Committee
Appendix F: Project Progress Photographs
Yerba Buena Island Detour
YBID Skid Bent A1 and B1 Moved Out and being Disassembled
Existing Viaduct Bridge Spans YB3 and YB2 Demolition in Progress
78
Third Quarter 2009 Project Progress and Financial Update
Existing Viaduct Bridge Spans YB3 & YB2 to the Left and the Detour Structure
79
Toll Bridge Program Oversight Committee
Appendix F: Project Progress Photographs
Self-Anchored Suspension Bridge Fabrication
SAS OBG Lift 9 and 10 East-Line Assembly
SAS Segment Assembly in the Assembly Yard
80
Third Quarter 2009 Project Progress and Financial Update
SAS Tower Shaft Lift 1 North-Perimeter Milling in Milling Yard
SAS Trial Assembling of T-1 Erection Tower in the Open Yard
81
Toll Bridge Program Oversight Committee
Appendix F: Project Progress Photographs
Self-Anchored Suspension Bridge Field Work
SAS - Pier 7 - Temporary Support Structures "W" D to E (Gap for Tower Erection)
SAS - Temporary Support Structures "E' Line H (E2) toward Skyway
82
Third Quarter 2009 Project Progress and Financial Update
SAS - Temporary Support Structures- "E' Line H (E2) toward Skyway Close-Up
SAS - View from Temporary Support Structures East of H (E2) underneath Skyway
83
Toll Bridge Program Oversight Committee
Appendix F: Project Progress Photographs
Oakland Touchdown
Oakland Touchdown Scaffolding Support Piles Removed
Oakland Touchdown Eastbound Road
84
Third Quarter 2009 Project Progress and Financial Update
Third Quarter 2009 Project Progress and Financial Update
92/880 Site Preparation of New Route 92 and Interstate 880 Separator
87
Toll Bridge Program Oversight Committee
Appendix G: Glossary of Terms
AB144/SB 66 BUDGET: The planned allocation of resources for the Toll Bridge Seismic Retrofit Program, or subordinate projects or contracts, as provided in Assembly Bill 144 and Senate Bill 66, signed into law
by Governor Schwarzenegger on July 18, 2005 and September 29, 2005, respectively.
BATA BUDGET: The planned allocation of resources for the Regional Measure 1 Program, or subordinate
projects or contracts as authorized by the Bay Area Toll Authority as of June 2005.
APPROVED CHANGES: For cost, changes to the AB144/SB 66 Budget or BATA Budget as approved by the
Bay Area Toll Authority Commission. For schedule, changes to the AB 144/SB 66 Project Complete Baseline approved by the Toll Bridge Program Oversight Committee, or changes to the BATA Project Complete Baseline approved by the Bay Area Toll Authority Commission.
CURRENT APPROVED BUDGET: The sum of the AB144/SB66 Budget or BATA Budget and Approved Changes.
COST TO DATE: The actual expenditures incurred by the program, project or contract as of the month and year shown.
COST FORECAST: The current forecast of all of the costs that are projected to be expended so as to complete the given scope of the program, project, or contract.
AT COMPLETION VARIANCE or VARIANCE (cost): The mathematical difference between the Cost Forecast and the Current Approved Budget.
AB 144/SB 66 PROJECT COMPLETE BASELINE: The planned completion date for the Toll Bridge Seismic Retrofit Program or subordinate projects or contracts.
BATA PROJECT COMPLETE BASELINE: The planned completion date for the Regional Measure 1 Program or subordinate projects or contracts.
PROJECT COMPLETE CURRENT APPROVED SCHEDULE: The sum of the AB144/SB66 Project Complete Baseline or BATA Project Complete Baseline and Approved Changes.
PROJECT COMPLETE SCHEDULE FORECAST: The current projected date for the completion of the program, project, or contract.
SCHEDULE VARIANCE or VARIANCE (schedule): The mathematical difference expressed in months between the Project Complete Schedule Forecast and the Project Complete Current Approved Schedule.
% COMPLETE: % Complete is based on an evaluation of progress on the project, expenditures to date, and schedule.
88
100% Recyclable
This document, including the coil binding, is 100% recyclable
The information in this report is provided in accordance with California Government code Section 755. This document is one of a series of reports prepared for the Bay Area Toll Authority (BATA)/Metropolitan Transportation Commission (MTC) for the Toll Bridge Seismic Retrofit and Regional Measure 1 Programs. The contract value for the monitoring efforts, technical analysis, and field site works that contribute to these reports, as well as the report preparation and production is $1,574,873.73.